
4
Food and Beverage Marketing to Children and Youth
INTRODUCTION
This chapter considers how food and beverage products are developed and marketed to appeal to the preferences of children and youth and to stimulate sales. It provides definitions of certain commonly used marketing terms and approaches; provides an overview of various target markets such as tweens, teens, and ethnic minorities; and offers a description of the marketing research enterprise directed at children and youth. An overview is provided of the marketing environment, including a profile of food and beverage companies and retailers, full serve and quick serve restaurants, and trade associations. It discusses food, beverage, and meal product development, the implications of the evolving purchasing power of American children and youth, and the general marketing strategies, tactics, and messaging used by industry. The chapter also reviews children’s and adolescents’ media use patterns and advertising exposure, and discusses the range of marketing vehicles and venues used by companies to reach them with advertising and marketing messages. A discussion of company and industry guidelines and policies, including self-regulatory programs, health and wellness advisory councils, public–private partnerships, and coalitions concludes the chapter.
To explore this domain, the committee drew from several different types of reviews, reports and materials, including supplementing the peer-reviewed literature with information from industry and marketing sources. Thus, the evidentiary sources cited in this chapter include articles published
in marketing, advertising, or industry trade journals; commissioned papers examining the current and future food and beverage marketing trends affecting children and youth; government, company, and trade organization websites; annual reports of companies;1 foundation or nonprofit organization reports and briefs; popular magazines and books relevant to advertising and marketing; and news releases. Sources also included materials from presentations, testimony, and documents provided during and following the January 2005 public workshop held to consider industry perspectives and activities. To assess the degree to which new food and beverage products have been targeted to children and youth across various product categories, the committee also conducted an analysis of trends in the proliferation of children’s products using ProductScan®, a large commercial database of products (Marketing Intelligence Service, 2005) that has tracked new product introductions in the U.S. marketplace since 1980 (Williams, 2005b).
Because marketing research could enhance understanding on the relationships of marketing strategies to children’s food and beverage consumption patterns and diets and diet-related health outcomes, as well as the design of strategies to improve the healthfulness of messages, several market research firms were contacted for information. Some—The Geppetto Group, The Strottman Group, KidShop/KidzEyes, and Yankelovich Partners—provided child- and youth-specific data for the committee’s consideration and use. Others were unable to provide information, either because of time constraints, economic considerations, or on the basis that the data were proprietary and not intended for public use. A summary of the marketing research information considered by the committee is included in Appendix E, Table E-1.
MARKETING TERMINOLOGY AND APPROACHES
Marketing professionals use a variety of strategies to influence consumer preferences, stimulate consumer demand, promote frequency of purchases, build brand awareness and brand loyalty, encourage potential or existing customers to try new products, and increase sales. From a marketing perspective, businesses engage in a variety of activities that are designed to meet customers’ needs and to create the context where consumers perceive value in exchange for their money. Marketing is defined by the American Marketing Association (AMA) as “an organizational function and a set
of processes for creating, communicating, and delivering value to customers and for managing customer relationships in ways that benefit an organization and its stakeholders” (AMA, 2005a). Conducting marketing research is a fundamental activity of the marketing process, providing information that helps identify opportunities and problems, refine strategies, and monitor performance (AMA, 2005a).
The four traditional components of marketing are as follows:
-
Product (e.g., features, quality, quantity, packaging)
-
Place (e.g., location, outlets, distribution points used to reach target markets)
-
Price (e.g., strategy, determinants, levels)
-
Promotion (e.g., advertising, consumer promotion, trade promotion, public relations)
Figure 4-1 shows one approach to a graphic representation of the elements that influence a marketing strategy: defining the target market, determining the marketing mix to meet the needs of that market, and assessing
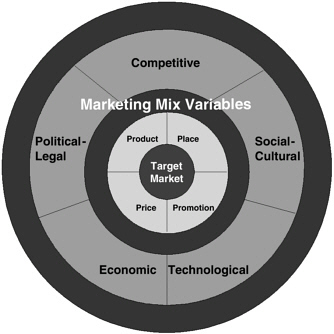
FIGURE 4-1 Elements of a marketing strategy and its environmental framework.
SOURCE: Based on Boone and Kurtz (1998). From Contemporary Marketing, 9E 9th edition by Boone. ©1998. Reprinted with permission of South-Western, a division of Thomson Learning: www.thomsonrights.com.
the relevant competitive, social-cultural, technological, economic, political-legal, and environmental factors (Boone and Kurtz, 1998).
Branding
A key aim of marketing is product branding—providing a name or symbol that legally identifies a company, a single product, or a product line to differentiate it from other companies or products in the marketplace (Roberts, 2004). Elements of branding strategy may be characterized on several dimensions: (1) brand differentiation, to distinguish one brand from another in the same product line; (2) building brand image (or brand presence) to raise consumers’ awareness about a brand and the competition; (3) developing brand equity (also referred to as brand relevance and brand performance), to build brand familiarity and perceived quality with the intent to meet a customer’s expectations and purchase intent, which is the extent to which a consumer intends to continue purchasing a specific brand; (4) assessing brand momentum (or brand advantage) to determine whether customers think a brand is improving or whether their interest in a specific brand is declining; and (5) building and sustaining brand loyalty (also referred to as brand bonding), which is the degree to which consumers will consistently purchase the same brand within a product category (BrandWeek, 2005; Survey Value, 2005).
In effect, the purpose of branding is to promote product sales by taking a product and identifying it with a lifestyle to which consumers aspire (Roberts, 2004). With food and beverage products, product development can be part of the branding process, as with many prepared entrees, baked goods, savory snacks, confectionery, and carbonated soft drinks (CSDs)2. Nonprocessed foods such as vegetables and fruits are more difficult challenges for brand differentiation, and are generally less promoted than processed food brands. This may be beginning to change, however, as there is a developing trend toward branding produce and promoting innovative features such as new shapes or colors, special varieties (e.g., baby or seedless watermelon, champagne grapes) and ethnic fruits and vegetables that help to build consumer awareness, sales, and profits (Pollack Associates, 2004).
Processed foods are highly branded and lend themselves to major advertising (Gallo, 1999). More than 80 percent of U.S. grocery products
are branded whereas only 19 percent of fruits and vegetables are nationally branded (Harris, 2002). Results from a Grocery Manufacturers Association (GMA) survey of 800 consumers found that Americans across all demographic groups consider a product’s brand before making a final purchase selection, and consumers will pay a higher price for perceived quality in premium branded products and will go to a different store if a preferred brand is not available (GMA, 2002; Pollack Associates, 2004). Key factors that influenced their brand selection include experience (36 percent indicated that prior family exposure influences brand choice) and peer endorsement (13 percent) (GMA, 2002). Branding has become a normalized part of life for American children and adolescents (Schor, 2004), as marketers seek to develop positive and sustained brand relationships with young consumers and their parents in order to create brand recognition and foster brand loyalty, brand advantage, and brand equity (McDonald’s Corporation, 1996; McNeal, 1999; Moore et al., 2002).
Advertising
Advertising is the most visible form of marketing. It is paid public presentation and promotion of ideas, goods, or services by a sponsor (Kotler and Armstrong, 2004), intended to bring a product to the attention of consumers through a variety of media channels such as broadcast and cable television, radio, print, billboards, the Internet, or personal contact (Boone and Kurtz, 1998). Marketers recognize its value by itself, and also view it as contributing to the success of other strategies by (1) building brand awareness and brand loyalty among potential consumers, and (2) creating perceived value by persuading consumers that they are getting more than the product itself (e.g., social esteem, peer respect).
Consumer Promotion
Consumer promotion, also called sales promotion, represents the promotional efforts that are designed to have an immediate impact on sales. Consumer promotion includes media and nonmedia marketing communications targeted directly to the consumer that are used for a predetermined and limited time to increase consumer demand, stimulate market demand, or improve product availability. Examples of sales promotion include coupons, discounts and sales, contests, point-of-purchase displays, rebates, and gifts and incentives (Boone and Kurtz, 1998).
Trade Promotion
Trade promotion is a broad category of marketing that targets interme-
diaries, such as grocery stores, convenience stores, and other food retail outlets. Trade promotion strategies include provision of in-store displays, agreements for shelf space and positioning, free merchandise, buy-back allowances,3 and merchandise allowances,4 as well as sales contests to encourage wholesalers or retailers to give unusual attention to selling more of a specific product or lines (Boone and Kurtz, 1998). Companies usually spend as much of their marketing budgets on trade promotion as on expenditures for advertising and all other consumer-oriented sales promotion, combined (Boone and Kurtz, 1998; GMA Forum, 2005).
Market Segmentation and Target Markets
Identifying and reaching unique target markets is important for businesses to promote sales in a competitive marketplace. Target markets may be segmented by demographic characteristics (e.g., age, gender, income, race or ethnicity), psychographic features (e.g., values, attitudes, beliefs, lifestyles), behavioral patterns (e.g., brand loyalty, usage rates, price sensitivities), and geographic characteristics (e.g., region, population density) (Neal, 2005; QuickMBA, 2004). As the ethnic, racial, and cultural composition of the U.S. population changes and boundaries among groups become less distinct through intermarriage and cultural adaptation, the criteria that marketers have used to target specific groups of consumers may change (Grier and Brumbaugh, 2004).
Companies often alter the types of products and services marketed (marketing mix) for customers in each market segment in order to meet the demand for products and services and to maximize sales. Marketers may change only one element of the marketing mix (e.g., promotional approach), or tailor each element of the marketing mix to a specific population segment—the product and how it is packaged, the pricing strategies, the place(s) or channel(s) through which the product is distributed and made available to consumers in a target market, and the promotional strategies (Neal, 2005; QuickMBA, 2004).
Children and youth represent an important demographic market because they are potential customers, they influence purchases made by parents and households, and they constitute the future adult market (McNeal, 1998; Moore et al., 2002). Table 4-1 summarizes the U.S. Census Bureau
TABLE 4-1 Marketing Categories by Population Sizes
|
Group |
Age Range |
Population Size |
|
Infants and Toddlers |
0–2 years |
|
|
|
Girls |
5,575,564 |
|
|
Boys |
5,841,112 |
|
Children |
3–8 years |
|
|
|
Girls |
11,734,700 |
|
|
Boys |
12,306,607 |
|
Tweensa |
9–12 years |
|
|
|
Girls |
8,159,391 |
|
|
Boys |
8,572,920 |
|
Teensb |
13–19 years |
|
|
|
Girls |
13,758,399 |
|
|
Boys |
14,524,572 |
|
aIn this report, the committee characterized infants and toddlers as under age 2 years, younger children as ages 2–5 years, older children as ages 6–11 years, and teens as ages 12–18 (Chapter 1). These age categories and terms differ slightly from what is described in this chapter. Marketers distinguish the tween market segment from children and teens, defining it as young people who have attitudes and behaviors that are “in between” the ages of 8–12 years or 9–14 years (Siegel et al., 2001; The Intelligence Group/Youth Intelligence, 2005). bThe U.S. Census Bureau defines teens as young people ages 13–19 years. SOURCE: U.S. Census Bureau (2000). |
||
age categories that differ from the age categories used in this report (Chapter 1 and Chapter 5) and commonly used by marketers. The Census Bureau age categories include infants and toddlers (ages 0–2 years), younger and older children (ages 3–8 years), tweens (ages 9–12 years), and younger and older teens (ages 13–19 years).
Children and youth under the age of 19 years comprise more than a fourth of the U.S. population. From 1990–2003, this population increased by 14 percent (U.S. Census Bureau, 2001, 2004). Ethnic minorities represent attractive targets for food and beverage marketers due to their size, growth, and purchasing power (Williams, 2005a). Marketers segment target audiences by age, gender, and race/ethnicity to build brand awareness and brand loyalty early in life that will be sustained into adulthood. African American consumers have been targeted by both mainstream and African American-owned marketers, often using very different marketing styles (Williams and Tharp, 2001). Food and beverage companies market to African American family preferences. An analysis of 2004 Nielsen Monitor-Plus data of food and beverage advertising that appeared in African American media showed significant spending by food and beverage companies for high-calorie and low-nutrient foods and beverages.
In six magazines targeted to African Americans (e.g., Jet, Ebony, Black Enterprise, Essence, Vibe, and Savoy), the top three categories advertised were regular CSDs ($1.8 million), cookies and crackers ($1.6 million), and fruit juices and fruit-flavored drinks ($1.5 million). Advertising spending for the top three food and beverage categories on Black Entertainment Television (BET) were regular CSDs ($10.8 million), candy and gum ($8.8 million), and fruit juices and fruit-flavored drinks ($5.3 million) (Williams, 2005a). Magazine Publishers of America estimates that 15 percent of teens ages 12–19 years are African American, and are a major influence on youth culture, spending 6 percent more per month than the average U.S. teen, which is estimated at $428 monthly (MPA, 2004b).
In 2004, the industry advertising and marketing expenditures were estimated at $260.9 million to reach consumers through Hispanic/Latino-oriented broadcast television networks, cable television, and Spanish-language newspapers and magazines (Endicott et al., 2005). Among the food, beverage, and retailer companies, PepsiCo spent $68.5 million, McDonald’s Corporation spent $65.8 million, Wal-Mart Stores spent $55.9 million, Yum! Brands spent $30.8 million, The Coca-Cola Company spent $27.7 million, the Kellogg Company spent $25.2 million, and Wendy’s International spent $20.4 million to advertise brands to reach Hispanic/Latino consumers (Endicott et al., 2005). An example of an ethnically targeted marketing effort to Hispanics/Latinos is PepsiCo’s Frito-Lay™ Flaming Hot Corn Chips advertising campaign (MPA, 2004c).
The Hispanic/Latino teen market is the fastest growing ethnic youth segment in the United States. This market currently represents 4.6 million young consumers, or 20 percent of all U.S. teens. Market researchers forecast that the Hispanic/Latino youth population is expected to grow six times faster than the rest of the teen market by 2020 (MPA, 2004c). Marketers view the Hispanic/Latino youth market as providing a variety of business opportunities across many types of products and services (Valdés, 2000). In 1998, the total annual purchasing power of Hispanic/Latino teens was estimated at $19 billion—4 percent higher than non-Hispanic/Latino teens (MPA, 2004c). This so-called Generation Ñino includes tweens, teens, and young people who are bilingual and bicultural as they retain their Hispanic/Latino identity and navigate comfortably in this culture and American cultures (Valdés, 2000).
Cultural influences among different racial/ethnic groups are also possible. For example, “hip-hop” youth culture originated among African American youth in the inner city, and is now embraced by a generation of African American, white, Hispanic/Latino, and Asian youth (Williams and Tharp, 2001). “Urban culture” is a term used to describe a target market that has a particular lifestyle. Urban culture transcends both racial and ethnic boundaries by bringing together a lifestyle of fashion, attitudes,
street language, and music from all backgrounds (Williams and Tharp, 2001). MTV has been a leading entertainment network partnering with PepsiCo and The Coca-Cola Company to launch advertising campaigns featuring hip-hop culture such as break dancing to market CSDs and urban culture to teens (Holt, 2004; PBS Frontline, 2001).
With respect to economic segmentation, there is some descriptive evidence suggesting that ethnic minorities living in poorer neighborhoods have fewer healthier options and neighborhood restaurants heavily promote less healthful foods (Lewis et al., 2005; Chapter 3). Despite concerns expressed that marketers disproportionately target racial/ethnic minorities with high-calorie, low-nutrient foods and beverages, there is a need for greater empirical evidence to support the claim (Grier, 2005; Samuels et al., 2003). The committee was not able to find available evidence to assess whether market segmentation has been a significant influence on children’s food and beverage product development.
Embedded Marketing Strategies
Embedded marketing strategies blend commercial content with programming or editorial content, or other lifestyle experiences, to add brand exposure and avoid resistance to direct advertising. Product placement, or brand placement, is an embedded marketing technique that refers to the inclusion of a corporate or brand name, product package, signage, or other trademark either visually or verbally in television programs, films, video games, magazines, books, and music, or across a range of these media simultaneously (Babin and Carder, 1996; Nebenzahl and Secunda, 1993; PQMedia, 2005). Product placement is generally arranged in return for a fee payment, although occasionally other quid pro quo accommodations are involved (Balasubramanian, 1994; PQMedia, 2005).
Another form of embedded marketing technique used by marketers is known as viral marketing, representing the “buzz,” “word of mouth,” or “street marketing” that occurs when individuals talk about a product to one another, either in conversations or virtual communication via an electronic platform such as the Internet (Henry, 2003; Holt, 2004; Kaikati and Kaikati, 2004). Viral branding and marketing focus on the paths of public influence, including diffusion of innovation, word of mouth, and public relations (Holt, 2004).
Measured Media and Unmeasured Media
Marketers pay to advertise and promote branded products through a variety of media channels, termed measured and unmeasured media in the marketing literature. Measured media spending refers to the categories that
are tracked by media research companies such as Nielsen, TNSMI/CMR, and Forrester. Commonly tracked measured media spending categories include television (e.g., network, spot, cable, syndicated, Spanish-language network), radio (e.g., network, national spot, local), magazines (e.g., local, Sunday magazine), business publications, newspapers (e.g., local, national), outdoor, the Yellow Pages, and the Internet (Brown et al., 2004, 2005).
Unmeasured media spending refers to the difference between a company’s reported or estimated advertising costs and its measured media spending. Unmeasured media spending includes activities such as sales promotions, coupons, direct mail, catalogs, and special events, and it is not systematically tracked (Brown et al., 2004, 2005). Marketers use a variety of techniques to assess the effects of advertising in measured media on consumers. They measure the cost of advertising or promotion, usually expressed in terms of consumer exposure to advertising messages or “impressions,” representing a message seen by one viewer. Thus, consumers who report that they remember or recall an advertisement have “retained impressions” of the specific advertisement. Marketers also track consumers’ recall, retention, processing of messages, and purchase intent or purchase behavior. A second measure of the impact of an advertisement used by marketers is the increase in sales as a result of the advertising or promotional campaign. Because several factors may influence sales in the marketplace, it may be difficult to isolate the effect of advertising on sales of a particular product during a given time period. Thus, companies and marketers use other measures to guide their decisions, including communications research, an analysis of purchase dynamics (e.g., trial purchase, repeat purchase, frequency of purchase), and tracking consumer awareness and attitudes regarding specific product categories and specific brands (Collier Shannon Scott and Georgetown Economic Services, 2005c).
Once the purchase behavior of the exposed and unexposed groups are evaluated for a pre- and post-period, marketers determine brand penetration (the percentage of households that purchased an advertised product), volume (the average number or weight of an advertised product for every 100 households), dollars spent (the average dollars spent on the advertised product for every 100 households), and the dollar share (the percentage of sales that the advertised brand represents of total category sales) (MPA, 1999).
Marketing Research
Substantial investments have been made in marketing research directed to U.S. children and youth, and this research has grown into a major marketing tool over the past 30 years (Austin and Rich, 2001; McNeal,
1999; Schor, 2004). Its evolution and focus on youth has been rapid. Companies and private marketing research and public relations firms currently conduct marketing research that involves children and adolescents of all ages in the stages of product development, market testing, and the design of messages that are delivered to them (Schor, 2004). Examples of selected marketing research firms and marketing reports that the committee considered through its data-gathering process are listed in Appendix E, Table E-1.
Marketing research firms use a variety of methods, such as convenience surveys, opinion polls, focus groups, participant observation, photography, and ethnographic studies to collect information about their target markets (e.g., age and income of consumers, purchasing power, spending patterns, consumer attitudes and opinions)—including, in some cases, market research focus groups with early- and preschool age children (Austin and Rich, 2001; Buzz Marketing Group, 2004; Friend and Stapylton-Smith, 1999; Nestle, 2002; PBS Frontline, 2001; Peleo-Lazar, 2005; Schor, 2004; Teinowitz and McArthur, 2005; Yankelovich, 2005). Cultural anthropologists and psychologists have become regular resources for marketing research firms to study the culture of children and youth, and to research how children and teens process information and respond to advertising (Montgomery and Pasnik, 1996; Schor, 2004).
Some marketing research is developed for public use but most is proprietary. Public research is conducted primarily by academic institutions and may be financed by public or private funds. Proprietary research is conducted for commercial purposes by private companies, marketing research and public relations firms, or companies that are associated with the marketing industry, and is not publicly available. Appendix E, Table E-1 provides examples of the types of proprietary research focused specifically on the eating habits and lifestyles of children and youth and the companies or marketing research firms that collect and sell these data. Because the majority of nonacademic research conducted by marketing research firms, public relations firms, and companies is proprietary, these data are unavailable to help assess the direct relationship between advertising and sales (Nestle et al., 1998), as well as the impact of advertising and other forms of marketing on children’s and adolescents’ food choices and diet (Swinburn et al., 2004; Chapter 5).
Finding: Marketing research can provide important insights about how marketing techniques might help improve the diets of children and youth. Yet, much of the relevant marketing research on the profile and impact of food and beverage marketing to children and youth is currently unavailable to the public, including for use in designing and targeting efforts to improve the diets of children and youth.
MARKETING ENVIRONMENT
Companies, Retailers, Restaurants, and Trade Associations
Food and Beverage Companies
Two federal government series reports provide estimates of food expenditures in the United States: The Economic Research Service (ERS) Food Expenditure Series published by the U.S. Department of Agriculture (USDA), which provides actual food sales information obtained from total food sales of retail establishments that sell food items, based on food sales in the Bureau of the Census Retail Trade Reports; and the U.S. Bureau of Labor Statistics (BLS) Consumer Expenditure Survey, which is based on annual household expenditure surveys that measure food purchases of the consuming units or households surveyed (ERS/USDA, 2005a). Food and beverage expenditures have grown at approximately 6.4 percent per year for the past 40 years5 (ERS/USDA, 2004, 2005b). Sales for total U.S. food and beverage consumption were $895.4 billion in 2004 (ERS/USDA, 2005b). The BLS survey reports the distribution of food expenditures for food categories by selected demographic categories. Consumer expenditures for food in 2002 accounted for 13.2 percent of a household’s disposable income, with 7.6 percent spent for foods at home and 5.6 percent for foods acquired away from home (U.S. Department of Labor, 2004; Table 4-2).
Many factors have contributed to the growth of the modern American food industry, including agricultural improvement, new food processing technologies, expanded transportation facilities, and evolving communication systems (Tillotson, 2004). Historically, the growth of the processed-food retail sector in the United States has been important both for supporting economic growth and feeding an evolving, nonagricultural society (Tillotson, 2004).
The majority of the top 25 global food and beverage companies are also leading producers of child- or youth-specific branded food and beverage products (Food Engineering, 2004). These companies include Nestlé S.A., Kraft Foods, Cargill, PepsiCo, The Coca-Cola Company, Cadbury Schweppes, Mars, ConAgra, General Mills, and the Kellogg Company (Williams, 2005b). Worldwide revenues for leading food and beverage companies in 2003 and 2004 are shown in Table 4-3.
TABLE 4-2 Average Annual Expenditures of Households and Percent Distribution of Total Food Expenditures, 2002
TABLE 4-3 Selected Leading Food and Beverage Companies’ Global Revenues, 2003 and 2004
Companies continuously develop new products or reformulate existing products to keep pace with changing consumer tastes and preferences, new technology, and competition. In 2000, a typical supermarket offered an estimated 40,000 products from more than 16,000 food processing companies (Harris, 2002). Selected leading food companies’ top brands, total sales, and marketing media expenditures for these brands in 2004 are shown in Table 4-4.
The beverage industry includes the manufacturers, distributors, and franchise companies engaged in the production and sale of many different product brands, including regular, no-calorie, and low-calorie CSDs; ready-to-drink teas and coffees; bottled waters, fruit juices, and nonjuice fruit drinks; sports and energy drinks; and milk-based beverages (ABA, 2004, 2005a). Over the past several years, there has been a significant expansion of diet, low-fat, low-calorie, and caffeine-free varieties of traditional beverage products (FitchRatings, 2004). In 2003, more than 5,200 new ready-to-drink, nonalcoholic beverages were introduced in the United States (ABA, 2004). In the same year, single-serving bottled water sales increased by 21.5 percent and single-serving sports drink sales increased by 17.9 percent.
In 2003, two companies represented 75 percent of the market share for CSDs—The Coca-Cola Company (44 percent) and PepsiCo (31.8 percent) (Beverage Digest, 2004). The leading beverage brands, companies, and marketing media expenditures in 2004 are shown in Table 4-5.
The food and beverage industry attracts large financial investments based on the expectation of continued growth and profitability (Tillotson, 2004). According to an opinion survey of the 10 leading global food companies, the strategies identified as most likely to help the leading food companies grow over the next 3 years were: (1) innovating and launching new products into developed markets; (2) category expansion such as moving from confectionery to frozen foods; and (3) merger and acquisition activities in developed markets and high-growth potential markets (Business Insights, 2005a).
With respect to healthful products, the prospects were viewed as mixed. The heightened public interest in health and wellness and increased concern about obesity presents certain marketing risks—such as increased costs associated with developing, reformulating, packaging, test marketing, and promoting food and beverage products, as well as uncertainty related to creating and sustaining consumer demand for these new products. However, the public interest and concern also presents potentially profitable marketing opportunities not yet fully explored—food and beverage manufacturers can compete for and expand their market share for healthier food and beverage product categories, be role models for the industry by substantially shifting overall product portfolios toward healthier products, and
TABLE 4-4 Selected Leading Companies’ Top Food Brands, Total Sales, and Marketing Media Expenditures by Category, 2004
|
Brand |
Company Name |
Headquarters |
Total Sales ($ millions) |
Marketing Media Expenditures ($ millions) |
|
Ready-to-Eat Cereals |
|
|||
|
Cheerios |
General Mills |
Minneapolis, MN |
289.7 |
34.5 |
|
Frosted Flakes |
Kellogg NA Company |
Battle Creek, MI |
243.3 |
10.0 |
|
Honey Nut Cheerios |
General Mills |
Minneapolis, MN |
239.6 |
38.3 |
|
Honey Bunches of Oats |
Kraft Foods |
Tarrytown, NY |
222.8 |
17.8 |
|
Cinnamon Toast Crunch |
General Mills |
Minneapolis, MN |
164.9 |
24.9 |
|
Cereal Bars |
|
|||
|
Chewy Granola |
Quaker Oats |
Chicago, IL |
125.7 |
2.8 |
|
Nature Valley |
Campbell Mithun |
Minneapolis, MN |
107.6 |
7.1 |
|
Nutri-Grain |
Kellogg NA Company |
Battle Creek, MI |
102.5 |
23.3 |
|
Rice Krispies Treats |
Kellogg NA Company |
Battle Creek, MI |
70.5 |
n/a |
|
Crackers |
|
|||
|
Ritz |
Kraft Foods |
Glenview, IL |
232.4 |
12.9 |
|
Pepperidge Farm Goldfish |
Campbell Soup Company |
Camden, NJ |
167.8 |
9.1 |
|
Premium Saltines |
Kraft Foods |
East Hanover, NJ |
157.5 |
n/a |
|
Cheez-It Savory |
Kellogg NA Company |
Battle Creek, MI |
139.8 |
22.2 |
|
Wheat Thins |
Kraft Foods |
East Hanover, NJ |
126.2 |
21.9 |
|
Triscuit |
Kraft Foods |
East Hanover, NJ |
108.2 |
16.3 |
|
Salty Snacks |
|
|||
|
Lay’s |
PepsiCo |
Purchase, NY |
743.1 |
23.7 |
|
Doritos |
PepsiCo |
Purchase, NY |
657.0 |
9.7 |
|
Tostitos |
PepsiCo |
Purchase, NY |
417.0 |
1.3 |
|
Cheetos |
PepsiCo |
Purchase, NY |
380.3 |
2.4 |
|
Wavy Lay’s |
PepsiCo |
Purchase, NY |
278.3 |
n/a |
|
Brand |
Company Name |
Headquarters |
Total Sales ($ millions) |
Marketing Media Expenditures ($ millions) |
|
Refrigerated Orange Juice |
|
|||
|
Tropicana Pure Premium |
PepsiCo |
Purchase, NY |
1,149.8 |
31.9 |
|
Minute Maid |
The Coca-Cola Company |
Atlanta, GA |
402.8 |
28.1 |
|
Florida’s Natural |
Citrus World |
Lake Wales, FL |
234.2 |
20.7 |
|
Refrigerated Yogurt |
|
|||
|
Yoplait |
General Mills |
Minneapolis, MN |
283.5 |
36.0 |
|
Yoplait Light |
General Mills |
Minneapolis, MN |
174.4 |
n/a |
|
Dannon Light |
Dannon Company |
Tarrytown, NY |
164.1 |
3.9 |
|
Luncheon Meats |
|
|||
|
Oscar Mayer |
Kraft Foods |
Madison, WI |
808.8 |
18.0 |
|
Hillshire Farm Deli |
Sara Lee Corporation |
Chicago, IL |
244.0 |
20.1 |
|
Buddig |
Carl Buddig & Company |
Homewood, IL |
138.0 |
0.1 |
|
Meat Alternatives |
|
|||
|
Morningstar Farms |
Kellogg NA Company |
Battle Creek, MI |
73.7 |
8.9 |
|
Boca Burger |
Kraft Foods |
Madison, WI |
53.1 |
1.7 |
|
Morningstar Farms Grillers |
Kellogg NA Company |
Battle Creek, MI |
28.2 |
n/a |
|
SOURCE: Reprinted with permission, from BrandWeek (2005). ©Brandweek Research 2005 / Sources: Information Resources, Inc. (sales); TNS (media). Sales data reflect U.S. supermarkets, drugstores, and mass merchandisers, excluding Wal Mart. |
||||
TABLE 4-5 Leading Beverage Brands, Total Sales, and Marketing Media Expenditures by Category, 2004
|
Brand |
Company Name |
Headquarters |
Total Sales (millions of cases)* |
Marketing Media Expenditures ($ millions) |
|
Carbonated Soft Drinks |
|
|||
|
Coke Classic |
The Coca-Cola Company |
Atlanta, GA |
1,832.7 |
123.4 |
|
Pepsi |
PepsiCo |
Purchase, NY |
1,179.5 |
104.0 |
|
Diet Coke |
The Coca-Cola Company |
Atlanta, GA |
998.0 |
22.8 |
|
Mountain Dew |
PepsiCo |
Purchase, NY |
648.0 |
52.5 |
|
Diet Pepsi |
PepsiCo |
Purchase, NY |
625.0 |
32.9 |
|
Sprite |
The Coca-Cola Company |
Atlanta, GA |
580.5 |
43.9 |
|
Dr Pepper |
Cadbury Schweppes |
London, U.K. |
574.1 |
68.8 |
|
Caffeine Free Diet Coke |
The Coca-Cola Company |
Atlanta, GA |
170.0 |
n/a |
|
Diet Dr Pepper |
Cadbury Schweppes |
London, U.K. |
140.1 |
24.6 |
|
Sierra Mist |
PepsiCo |
Purchase, NY |
138.8 |
41.4 |
|
Brand |
Company Name |
Headquarters |
Total Sales ($ millions) |
Marketing Media Expenditures ($ millions) |
|
New Age/Sports/Water |
|
|||
|
Gatorade |
PepsiCo |
Purchase, NY |
2,648.9 |
127.6 |
|
Aquafina |
PepsiCo |
Purchase, NY |
1,061.1 |
21.4 |
|
Dasani |
The Coca-Cola Company |
Atlanta, GA |
925.1 |
17.5 |
|
Lipton |
PepsiCo |
Purchase, NY |
668.3 |
0.2 |
|
Red Bull |
Red Bull NA |
Santa Monica, CA |
594.5 |
31.6 |
|
Snapple |
Cadbury Schweppes |
London, U.K. |
531.1 |
10.5 |
|
Minute Maid Single Serve |
The Coca-Cola Company |
Atlanta, GA |
503.4 |
35.7 |
|
Powerade |
The Coca-Cola Company |
Atlanta, GA |
460.2 |
10.5 |
|
Poland Spring |
Nestlé Waters |
Greenwich, CT |
450.3 |
3.1 |
|
AriZona |
Ferolito |
Vultaggio, NY |
369.0 |
n/a |
|
SOURCE: Reprinted with permission, from BrandWeek (2005). ©Brandweek Research 2005 / Sources: Beverage Digest (sales in millions of cases); TNS (media). *Total sales in dollars were not reported. |
||||
serve as socially responsible corporate stakeholders in the response to childhood obesity. In making positive changes that expand consumers’ selection of healthier foods and beverages, despite the challenges of market forces and the marketplace, companies may also be seeking to avoid the risk of either stronger government regulation or litigation possibilities that have been identified by industry analysts (FitchRatings, 2004; JP Morgan, 2003; UBS Warburg, 2002).
Food and Beverage Retailers
In 2004, Americans visited supermarkets an average of 2.2 times per week (FMI, 2004). A supermarket is defined as any full-line, self-service grocery store generating a sales volume of $2 million or more annually (FMI, 2004). Supermarket sales in 2004 totaled $457.4 billion (FMI, 2004). Several supermarket designs exist in the United States including conventional, superstore, combination food and drug, warehouse clubs, economy limited-assortment store,6 and hypermarket7 (Kaufman, 2002). A variety of principles shape the marketing strategies of food retailers: penetration, to attract the maximum number of households; frequency, to engage shoppers so they will make repeat shopping trips; and spending, to encourage consumers to purchase more during each trip (ACNielsen, 2004). Carbonated beverages, candy, and snack foods were identified as top food categories that drove penetration and frequency in 2003 (ACNielsen, 2004; Kelley et al., 2004).
A recent consumer survey conducted by the Food Marketing Institute found that women are the primary grocery shoppers in two-thirds of households, and only 16 percent have a shared responsibility between women and men. According to the survey, the most common reasons why shoppers report not eating a healthful diet is the desire for convenience foods (which they believe are not as healthful as home-prepared meals), perceived cost, and confusion about what constitutes healthful choices (FMI, 2003). The survey found that younger shoppers are especially interested in prepared foods, partly because they report that food preparation is more difficult for them.
Shopping frequency in traditional retail outlets, such as grocery stores, declined from 1993 to 2001 (Deutche Bank Securities, 2004) but increased in superstores (e.g., Wal-Mart), warehouse clubs (e.g., B.J’s, Costco, Sam’s), and nontraditional outlets such as convenience stores and drug stores, which are among the fastest growing venues where shoppers purchase food (ACNielsen, 2004; Deutche Bank Securities, 2004). Food merchandising at drug stores has increased in recent years with the more aisles offering seasonally available, limited assortments of food. In 2003, food and beverages led drug store sales at 27 percent of total sales. Candy was the third largest category of food sold in drug stores, based on total sales, followed by carbonated beverages (ACNielsen, 2004).
Full Serve and Quick Serve Restaurants
People are getting their meals from outside the home more often. In 2002, approximately half (46 percent) of Americans’ food dollar was spent on away-from-home foods that were either fully prepared and eaten either outside the home or brought into the home for consumption, up from 27 percent of Americans’ food dollar in 1962 (Variyam, 2005b; Table 4-2). With increases in household incomes and the proportion of two-working-parent families, a larger share of food spending is devoted to prepared and out-of-home foods and meals (Jekanowski, 1999; Kaufman, 2002; Variyam, 2005a). The share of Americans’ daily caloric intake from away-from-home foods increased from 18 percent in 1977–1978 to 32 percent in 1994–1996 (Variyam, 2005b).
Restaurants have become part of the American lifestyle. The restaurant industry estimates that the full serve restaurant and quick serve restaurant (QSR)8 or fast food restaurant sector will provide approximately 70 billion meals or snacks to U.S. consumers in 2005 (NRA, 2005). More than 900,000 commercial restaurants are projected to generate an estimated $476 billion in annual sales in 2005, up from $42.8 billion in 1970 (NRA, 2005). Consumer per-capita spending at fast food outlets such as QSRs are expected to rise by 6 percent between 2000 and 2020 (Stewart et al., 2004). In 2004, the leading 10 QSR chains accounted for $73.4 billion in sales (Table 4-6).
TABLE 4-6 Leading QSR Chains by Total Sales and Marketing Media Expenditures, 2004
|
Brand |
Segment |
Company Name |
Headquarters |
Total Sales ($ billions) |
Marketing Media Expenditures ($ millions) |
|
McDonald’s |
Burger |
McDonald’s Corporation |
Oak Brook, IL |
24.4 |
528.8 |
|
Wendy’s |
Burger |
Wendy’s International |
Dublin, OH |
7.7 |
331.3 |
|
Burger King |
Burger |
Burger King Corporation |
Miami, FL |
7.7 |
287.1 |
|
Subway |
Sandwich |
Doctor’s Associates |
Milford, CT |
6.3 |
287.1 |
|
Taco Bell |
Mexican |
Yum! Brands, Taco Bell Corporation |
Irvine, CA |
5.7 |
194.4 |
|
Pizza Hut |
Pizza/pasta |
Yum! Brands, Pizza Hut |
Dallas, TX |
5.3 |
185.2 |
|
KFC |
Chicken |
Yum! Brands, KFC Corporation |
Louisville, KY |
4.9 |
212.1 |
|
Starbucks |
Snack |
Starbucks |
Seattle, WA |
4.8 |
26.4 |
|
Dunkin’ Donuts |
Snack |
Dunkin’ Brands |
Canton, MA |
3.4 |
61.8 |
|
Domino’s Pizza |
Pizza/pasta |
Domino’s Pizza |
Ann Arbor, MI |
3.2 |
130.8 |
|
SOURCE: Reprinted with permission, from BrandWeek (2005). ©Brandweek Research 2005 / Sources: Technomic (sales); TNS (media). |
|||||
TABLE 4-7 Major Trade Associations Representing U.S. and Global Food and Beverage Manufacturers and Distributors
|
Association |
Segment Represented |
|
American Bakers Association |
Wholesale baking industry |
|
American Beverage Association |
Beverage manufacturers, marketers, distributors, franchise companies of nonalcoholic beverages |
|
Food Products Association |
Food and beverage manufacturers |
|
Grocery Manufacturers Association |
Branded food, beverage, and consumer product companies |
|
International Dairy Foods Association |
Dairy food manufacturers, marketers, distributors, and industry suppliers |
|
National Confectioners Association |
Confectionery and candy manufacturers and suppliers |
|
National Restaurant Association |
Full serve restaurants and QSRs |
|
Snack Food Association |
Snack manufacturers and suppliers |
|
United Fresh Fruit & Vegetable Association |
Growers, shippers, processors, brokers, wholesalers and distributors of produce |
Trade Associations
Trade associations represent their industry members in several capacities including government relations, regulatory guidance, media interactions, and nutrition institutions. These organizations often compile data on annual industry sales and consumer trends pertaining to their segments, educate manufacturers on technological advances and retailing practices, offer standards and guidelines for practice, and provide their member companies with technical research and support. A variety of trade associations represent different segments of the food and beverage industry, retail and wholesale sectors, and the restaurant industry (Table 4-7).
Growing Purchasing Power of Children and Youth
Children and youth collectively represent a powerful economic and demographic segment. They are a primary market, spending discretionary income on a variety of products that they acquire from allowances and other sources. Children and youth are also an influence market, determining a large proportion of what is spent by parents and households. Finally, children and youth are the future market, representing tomorrow’s adult customers for branded products and services (McNeal, 1999; MPA, 2004a).
With discretionary income from allowances and other sources including gifts from parents, relatives, and friends, household chores, and outside
jobs (Doss et al., 1995; McNeal, 1998; Teenage Research Unlimited, 2004), in 2002 children ages 4–12 years spent $30 billion on direct purchases (Schor, 2004), up from $6.1 billion in 1989 and $23.4 billion in 1997 (McNeal, 1999). Of the various spending categories, one-third of children’s direct purchases are for sweets, snacks, and beverages followed by toys and apparel (Schor, 2004). Of the top 10 items children ages 8–12 years reported they could select without parental permission, the top 4 were for food categories: candy or snacks (66 percent did not need permission to purchase), soft drinks (63 percent), fast food (54 percent), and breakfast cereals (49 percent) (Chaplin, 1999).
In 2003, 12- to 19-year-olds alone spent an estimated $175 billion (Teenage Research Unlimited, 2004). Income varies greatly within the teen market as the population matures (MPA, 2004a). Adolescents have more discretionary income than their peers a few decades ago. Approximately 37.2 percent of all teens ages 12–17 years have savings or checking accounts in their own name, and 5.3 percent have access to credit cards in their own name or their parents’ name (MPA, 2004a). According to Teenage Research Unlimited (2005), which provides a continuous tracking and segmentation of the U.S. teen market to assess trends, lifestyles, attitudes, product and brand usage, the total weekly spending by teens is $98.25, with Hispanic ($107.48) and African American ($100.25) teens’ weekly spending being slightly higher than white ($95.72) teen spending. As shown in Table 4-8, food or beverages—particularly candy, soda or soft drinks,
TABLE 4-8 Top 10 Items Teens, Ages 13–17 Years, Purchased with Their Own Money
|
|
Overall Teen Rank/Item |
Percent (%) |
|
|
Boys |
Girls |
||
|
1 |
Clothes |
21 |
43 |
|
2 |
Food |
30 |
31 |
|
3 |
Candy |
24 |
34 |
|
3 |
Soda or soft drinks |
26 |
32 |
|
4 |
Salty snacks |
15 |
22 |
|
4 |
CDs or recorded music |
19 |
18 |
|
5 |
Lunch |
13 |
22 |
|
6 |
Shoes |
15 |
16 |
|
7 |
Video games |
18 |
5 |
|
8 |
Jewelry |
7 |
15 |
|
9 |
Magazines |
9 |
12 |
|
10 |
Ice cream |
7 |
10 |
|
SOURCE: Reprinted with permission from the Roper Youth Report (2003). |
|||
and salty snacks/chips—were ranked among the top 4 items that teens ages 13–17 years last bought with their own money in 2003 (Roper Youth Report, 2003). Another marketing research study reports that younger and older children purchase candy most frequently with their own money while teens also frequently purchase gum, drinks, and other snacks in addition to candy (Yankelovich, 2003).
Shopping malls represent the most frequent shopping place for adolescents. Boys and girls ages 14–17 years who shop at malls spend a reported $46.80 per visit. They visit malls more frequently than any other age group at a rate of once weekly, and also spend the most time per visit when compared to other places (MPA, 2004a). Teens also shop in many other venues including discount stores, convenience stores, and grocery stores. Girls shop more frequently than boys at almost every shopping venue (MPA, 2004a).
Children and adolescents also influence household purchase decisions. The purchase influence of children and adolescents increases with age and is currently estimated at $500 billion annually for 2- to 14-year-olds (U.S. Market for Kids’ Foods and Beverages, 2003). In 1993, children and youth together wielded a purchase influence of $295 billion. Of this amount, children ages 3–11 years exerted a purchase influence totaling $125 billion and youth ages 12–17 years represented a purchase influence of $170 billion (Stipp, 1993). In recent years, there has been a substantial increase in the number of children and their parents who report that young consumers ages 8–17 years are playing more prominent roles in household purchasing decisions ranging from food to entertainment to media (Roper Youth Report, 2003).
Both parents and their children report that young people have the highest purchase influence on food, when compared to other nonfood spending categories such as music, electronics, and home decor (Roper Youth Report, 2003). In 2003, 78 percent of children and youth ages 8–17 years reported that they influenced family food purchases and 84 percent of their parents concurred (Roper Youth Report, 2003). Children and youth, ages 6–17 years report that they help their parents select snack foods, breakfast cereal, soft drinks, candy, cookies, and even the QSRs where they eat (Yankelovich, 2003). Marketing research has found that nearly three-quarters (73 percent) of mothers of children and teens ages 6–17 years state that their children have influence over the types of brands and groceries they buy for the family (Yankelovich, 2003). Marketing research also suggests that parents believe that their children’s preferences are important in determining where food is purchased, as 21 percent of parents in one survey report that their child’s preference for certain snack foods is an important factor in deciding where to shop (Yankelovich, 2003).
New Product Development Targeted to Children and Youth
New product development is a central focus of innovation in the food and beverage industry. A recent survey of 30 U.S. food and beverage companies found that 71 percent had reformulated products and 29 percent had introduced new products across 3,000 product categories since 2002 (GMA, 2004). Many of these were targeted to children. Annual sales of food and beverages to children and youth were more than $27 billion in 2002 (U.S. Market for Kids’ Foods and Beverages, 2003). In 2004, product introductions targeted to children appeared to account for more than 10 percent of all new food and beverage products according to an analysis of the ProductScan® database (Harris, 2005). Candy was the largest category (46 percent) and others included snacks (8 percent), cookies (6 percent), cereals (5 percent), and beverages (5 percent). Nearly half of the new beverage products were fruit and fruit-flavored drinks. About 15 percent of all new children’s foods and beverages between 2000 and 2004 were whole-grain, low-fat, and low-sugar products, up from 9 percent for the previous 5 years (Harris, 2005).
Proliferation of Children’s Products
The committee analyzed the 50 food categories and 16 beverage categories contained in the ProductScan® database for trends in new product introductions targeted to children (Williams, 2005b). ProductScan® is an online global database that has tracked new consumer products and packaged goods introductions into the U.S. marketplace since 1980 (Marketing Intelligence Service, 2005). In the ProductScan® database, a new product is defined as a packaged, branded item that constitutes a new brand, line, variety, package type, package size or formulation, introduced to the retail shelf within the previous 90 days (Williams, 2005b).
Since 1994, the ProductScan® database has been structured to allow identification of products specifically targeted to children (ages 4–12 years) and to teens (ages 13–19 years). Searching the full 1980–2004 database using the keyword “children,” suggests generally that new products targeted to children during 1980–1994 were significantly fewer than from 1994 to the present (Williams, 2005b). However, the age specificity of the search capacity has been improved for recent years. Figure 4-2a shows the year-by-year new product introductions in the ProductScan® database from 1994 to 2004 for all food products targeted to the total market and Figure 4-2b shows the year-by-year new product introductions in the ProductScan® database from 1994 to 2004 to children and youth. The number of new food and beverage products targeted to children and adolescents by
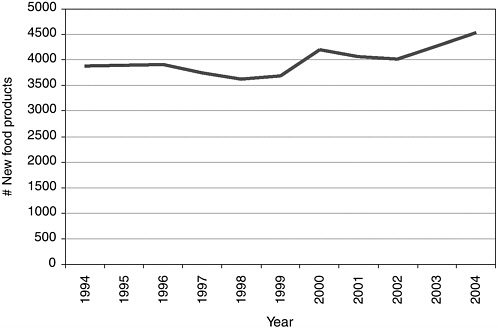
FIGURE 4-2a New food products targeted to the total market, 1994–2004.
SOURCE: Williams (2005b).
company, manufacturer, or distributor from 1994–2004 is shown in Appendix E, Table E-2.
Figure 4-3a shows similar data for all beverage products targeted to the total market, and Figure 4-3b shows data for beverage products targeted specifically to children and adolescents.
For both foods and beverages, the overall trend lines increased upward from 1994 to 2004, but as indicated by the slope of the trend lines, the growth rate in new product introductions for both food and beverage products targeted to children and youth is greater than the growth rate for food and beverage products targeted to the general market. The decline that occurred between 2003 and 2004 for both food and beverage products targeted to children and youth, relative to those targeted to the general market, may be due to recent scrutiny addressed to the introduction of new products targeted to children. It is uncertain whether the recent decline in new products targeted to children is attributed to an overall
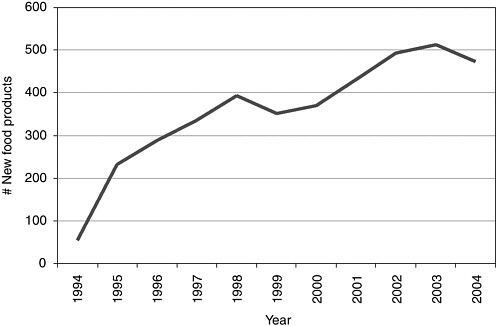
FIGURE 4-2b New food products targeted to children and adolescents, 1994–2004.
SOURCE: Williams (2005b).
decrease in all new products, or whether it represents a selective reduction in certain categories, such as those products deemed to be less healthful for children and youth. Overall, in the period 1994–2004, there were 3,936 new food products and 511 new beverage products targeted to children and youth (Williams, 2005b). Products high in total calories, sugar, or fat and low in nutrients dominated the profile of new foods and beverages targeted to children and youth, as indicated in Tables 4-9 and 4-10.
For example, for food products, the categories of candies, snacks, cookies, and ice cream accounted for 58 percent of all new products targeted to children in 1994–2004, compared to 27 percent of all new products targeted to the general market. For beverage products, the categories of fruit and fruit-flavored drinks accounted for 40 percent of all new products targeted to children, compared to 22 percent of all new products targeted to the general market. These results concur with those reported by Harris (2005). On the other hand, one industry analysis has forecasted that healthful food and beverage products for children will be among the most active and profitable new product categories for industry over the next 5 years from 2005 to 2009 (Business Insights, 2005b).
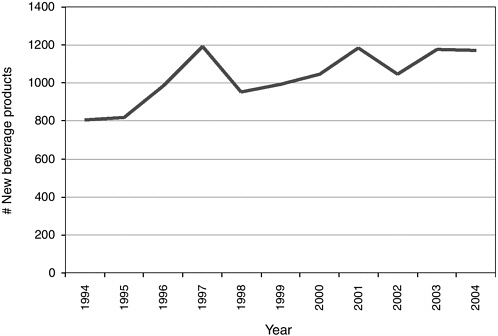
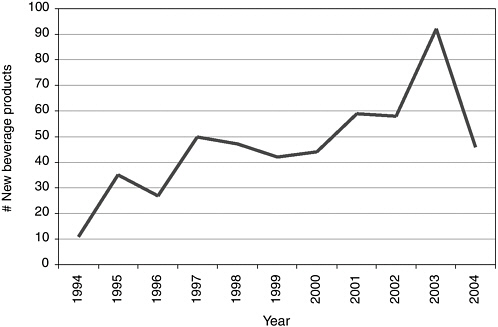
TABLE 4-9 Top Food Categories for New Products Targeted to Children and Adolescents, 1994–2004
|
Category |
Number of New Products |
|
Candies—nonchocolate |
1,407 |
|
Chewing gum |
354 |
|
Snacks |
265 |
|
Candies—chocolate |
236 |
|
Cereals |
231 |
|
Cookies |
225 |
|
Meals |
171 |
|
Ice cream & frozen yogurt |
168 |
|
Pasta |
98 |
|
Yogurt |
77 |
|
Crackers |
71 |
|
Snack bars |
70 |
|
Pastry |
66 |
|
Desserts |
55 |
|
Cheese |
50 |
|
Mixes |
49 |
|
Fruits |
41 |
|
Sweet toppings |
27 |
|
Cakes |
25 |
|
Chips |
25 |
|
Popcorn |
25 |
|
Soup |
21 |
|
Bread products |
20 |
|
Jams |
20 |
|
Poultry |
16 |
|
Nut butters |
13 |
|
Vegetables |
11 |
|
Meat |
11 |
|
Sauces & gravies |
11 |
|
Meat substitutes |
10 |
|
Catsup |
10 |
|
Meal replacements |
9 |
|
Fish |
8 |
|
Staples |
8 |
|
Baby food |
6 |
|
Rice |
4 |
|
Salad dressings |
4 |
|
Spices |
3 |
|
Nuts & seeds |
2 |
|
Dairycase foods |
2 |
|
Mustard |
2 |
|
Sauces |
2 |
|
Salads |
1 |
|
Entré mixes |
1 |
|
Category |
Number of New Products |
|
Margarine, butter, & spreads |
1 |
|
Oil, shortening, & cooking sprays |
1 |
|
Pickles, olives, & condiments |
1 |
|
Dips & salad toppings |
1 |
|
Miscellaneous foods |
1 |
|
Total |
3,936 |
|
SOURCE: Williams (2005b). |
|
TABLE 4-10 Top Beverage Categories for New Products Targeted to Children, 1994–2004
|
Category |
Number of New Products |
|
Fruit drinks |
203 |
|
Milk, nondairy milk, & yogurt drinks |
96 |
|
Beverage mixes & flavorings |
60 |
|
Carbonated soft drinks |
39 |
|
Bottled water |
34 |
|
Sports beverages |
34 |
|
Health drinks |
10 |
|
Baby beverages |
10 |
|
Vegetable drinks |
3 |
|
Miscellaneous drinks |
22 |
|
Total |
511 |
|
SOURCE: Williams (2005b). |
|
Finding: Children and youth ages 4–17 years have increasing discretionary income and purchasing capacity, are being targeted more directly by marketers, and frequently spend their discretionary income on high-calorie and low-nutrient foods and beverages.
Children’s Versions of Classic Products
In addition to the development of new products oriented to children and youth, food and beverage companies have devoted considerable attention to enhancing the appeal of existing products to a younger market, using novel package designs, names, and co-branding with recognizable cartoon or fictional characters (Mintel International Group Ltd., 2003). For example, Heinz introduced Heinz EZ Squirt™, a “kid-friendly”
ketchup, available in “Blastin’ Green” and “Funky Purple” colors, and substantially increased the company’s market share in 2003 (McGinn, 2003). However, like many products, they proved to have a short-lived novelty appeal and were withdrawn from the market soon after their introduction.
By contrast, conventional wisdom suggested that children would not like yogurt due to its generally sour flavor. Yogurt has demonstrated an interesting evolution both in product and child taste adaptation. Whole new products have been introduced that appeal to children’s preferences for sweet tastes. Dannon pioneered children’s yogurt with Dannon Sprinklin’s®, a version of its regular yogurt flavors with candy sprinkles encased on the cap that children could add to the yogurt (Dannon, 2005). Dannon later developed a drinkable yogurt called Danimals®, and Frusion® smoothies, a 10-ounce bottle of real fruit and low-fat yogurt within its child product portfolio. Both of these brands offer sweeter yogurt taste and portability for children (Dannon, 2005). General Mills followed with several innovations in the yogurt category that intended to make yogurt appealing to children. The first of these products was a line extending its Trix® cereal into its Yoplait® yogurt line with a mixed fruit and sweetened formulation of traditional yogurt (General Mills, 2005a). General Mills changed the yogurt packaging format with the launch of Go-Gurt®, which comes in long tubes, and Go-Gurt® smoothies that are sold in small plastic bottle-shaped containers (General Mills, 2005b). Other companies that have developed and market dairy-based products for children include Kraft Foods, which developed Twist-ums™ string cheese sticks, and The Coca-Cola Company, which manufactures Swerve™, a milk-based beverage product consisting of 51 percent skim milk (The Coca-Cola Company, 2005a).
Convenience and Portability
Convenience and portability have become guiding principles in the food company business. Swanson & Sons began this trend when the company created the first TV dinner in 1953 (Lauro, 2002). The dinners were marketed as quick meals that required minimal preparation time. The meals came in various forms and generally included meat, a starch, a vegetable, and dessert. In the 1960s, Swanson removed the words “TV dinner” from the packaging and has since introduced lighter meals in microwave-safe trays for consumers. Swanson TV dinners still remain in the public memory as the dinner phenomenon of the 1950s generation that grew up with television (Pinnacle Foods Corporation, 2003).
Easy preparation of meals has allowed children greater flexibility and independence in preparing their own meals. The concept of the TV dinner evolved into child-targeted variations of the dinner meal in the 1980s.
ConAgra Foods launched Kid Cuisine® as a line of frozen food entrés intended especially for children and young teens (ConAgra Foods, 2004). Using various character appeals, first a cartoon chef and later an animated penguin, Kid Cuisine® offered meals similar to Swanson TV dinners. ConAgra Foods markets 11 different varieties of the Kid Cuisine® meal, from chicken breast nuggets to alien invasion pepperoni pizza (ConAgra Foods, 2004).
Marketing research conducted by Nickelodeon suggests that nearly three-quarters of children and youth report that they decide on their own what they eat for breakfast most or all of the time (Smalls, 2005b). Breakfast options have undergone substantial innovations over the past 40 years from ready-to-eat (RTE) sweetened breakfast cereals to breakfast bars and pastries. The breakfast pastry category was pioneered by the Kellogg Company with the introduction of Pop-Tarts® in 1963, allowing children to prepare their own breakfasts by putting a flat pastry into the toaster, an approach since adopted by a number of companies. The company has doubled sales in the United States from 1 billion in the early 1990s to an estimated 2 billion Pop-Tarts® annually (Prichard, 2003). Other breakfast innovations with child appeal include a number of breakfast bars by various companies with ingredients ranging from cereal, fruit, and milk to chocolate and cookies.
A new lunch combination category was specifically designed for children by Kraft Foods in 1988 when the Oscar Mayer Lunchables® was launched (Kraft Foods, 2005a). This line of convenience foods was the first prepackaged, RTE lunch that offered meat, cheese, and crackers, now in three sizes of packages—the largest with 40 percent more food (Kraft Foods, 2005a). Sports drink beverages have also become popular over the past three decades. Gatorade® Thirst Quencher was created in 1965 at the University of Florida to help athletes stay hydrated during active sports (Gatorade, 2004), and now represents a category of products marketed widely as a product for children and youth.
Finding: Child-targeted food and beverage products have steadily increased over the past decade, and are typically high in total calories, sugars, salt, fat, and low in nutrients.
MARKETING STRATEGIES, TACTICS, AND MESSAGING
Advertising and Marketing of Foods and Beverages in the United States
The scope of marketing expenditures in the United States is very large. Gross marketing expenditures in 2004 for all products, including food, beverages, and other manufactured items, totaled $264 billion, including
TABLE 4-11 U.S. Advertising Spending in Selected Food-Related Categories by Purchased Measured Media, 2004
|
Category |
Total Measured Media ($ millions) |
U.S. Measured Media |
|
|
Magazine |
Newspaper |
||
|
Food, beverages, candya |
6,840 |
1,743 |
51 |
|
Restaurants and fast food |
4,418 |
179 |
176 |
|
aThis category includes beverages, confectionery, snacks, dairy, produce, meat, bakery goods, prepared foods or ingredients, and mixes and seasonings (Brown et al., 2005). SOURCE: Brown et al. (2005). Reprinted with permission from the June 27, 2005, issue of Advertising Age. © Crain Communications, Inc. 2005. |
|||
$141 billion for advertising in measured media (Brown et al., 2005). Appendix E, Table E-3 lists selected leading advertisers ranked by category, total U.S. revenues, and total advertising spending for 2003 and 2004. The committee does not have a definitive breakout of the portion devoted to food and beverages. As a proxy, Table 4-11 displays total advertising spending in measured media for selected categories: food and beverages including candy, and restaurants and fast food outlets.
An estimated $6.84 billion was spent on advertising in the food, beverage, and candy category, and $4.42 billion was spent on advertising for restaurants and fast food for a total of $11.26 billion in food and beverage advertising (Brown et al., 2005; Table 4-11). In 2003, food marketers spent $1.75 billion to advertise products to children on national cable television alone, which included NICK ($756.5 million), TDSN ($86 million), and TOON ($910 million) (Nielsen Monitor-Plus, 2005). The children’s media and entertainment industry are represented by four major companies—Disney, Time Warner, News Corporation, and Viacom—which own several forms of children’s media production and distribution systems, including ownership in broadcast networks and children’s cable networks (Allen, 2001).
Advertising intensity is one measure of the marketing emphasis given to a product category. It represents the ratio of a food’s share of advertising to its share of consumers’ disposable income. Although food accounts for approximately 16 percent of total advertising, it accounts for a much smaller percentage of disposable income, suggesting a high level of advertising intensity. This intensity varies significantly across different food categories. In 1999, confectionery and salty snacks (e.g., candy, gum, mints, cookies, crackers, nuts, and chips) accounted for 13.2 percent of total food advertising expenditures, but only 5.4 percent of the household food budget share, which represented an advertising intensity of 2.4, the highest of any food
|
Outdoor |
Television |
Cable Network |
Radio |
Internet |
|
78 |
3,418 |
1,331 |
140 |
79 |
|
204 |
3,123 |
567 |
147 |
22 |
category examined (Gallo, 1999). CSDs have an advertising intensity of 1.8, the third highest category. Fruits, vegetables, and grains have the lowest advertising intensity of 0.1—though these products account for 1.9 percent of advertising expenditures, they represent 14.7 percent of food-at-home budget shares (Gallo, 1999). More recent data for advertising intensity of various food and beverage categories are not available.
Changing Composition of Marketing Expenditures
There is evidence that the balance between advertising in measured media and other marketing techniques is changing. Available analyses use different techniques, data, and time frames, complicating precise tracking of trends. One unpublished analysis of estimated inflation-adjusted expenditures for U.S. food and restaurant television advertising from 1993 to 2004, based on Nielsen Media Research data, has suggested that real expenditures on food and restaurant advertising on television viewed by adult, child, and youth audiences have fallen over the past decade, from nearly $6 billion in 1994 to less than $5 billion in 2004 (Collier Shannon Scott and Georgetown Economic Services, 2004; Figure 4-4).
Industry sources have reported several converging trends that are attributed to reducing television’s effectiveness in reaching consumers and target markets, including declining brand loyalty across a variety of product categories, audience fragmentation9 across different channels and di-
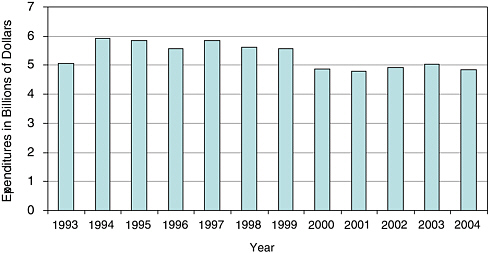
FIGURE 4-4 Estimated inflation-adjusted expenditures on food, beverages, and restaurant advertising on television, 1993–2004.
NOTE: Based on an analysis of Nielsen Media Research data.
SOURCE: Collier Shannon Scott and Georgetown Economic Services (2005b).
verse media platforms, increased advertising costs, rising price elasticity, and increased trade promotion spending by food and beverage manufacturers that is accompanied by decreased spending for advertising and consumer promotion (Deutche Bank Securities, 2004; Smith et al., 2005). Industry and marketing sources suggest that food and beverage companies and restaurants have been progressively reducing their television advertising budgets, reinvesting in other communication channels, and using integrated marketing strategies to reach consumers more effectively (Collier Shannon Scott and Georgetown Economic Services, 2005b; Deutche Bank Securities, 2004). An independent analysis that could confirm these trends was not available to the committee.
A recent trade promotion spending and merchandising study, based on 400 responses from an array of retailers and manufacturers across all connected sectors (Cannondale Associates, 2005), estimated the general distribution of companies’ marketing expenditures for trade promotion, account-specific marketing, consumer promotion, and advertising from 1997 to 2004 (GMA Forum, 2005) (Figure 4-5). In general, for all companies, trade promotion was approximately 44 percent of marketing expenditures in 1997 and 48 percent in 2004. Advertising expenditures increased slightly from 23 percent in 1997 to 26 percent in 2004 (GMA Forum, 2005). Marketing budget allocations may differ based on the type of company and the size of the company, with food companies generally allocating more for
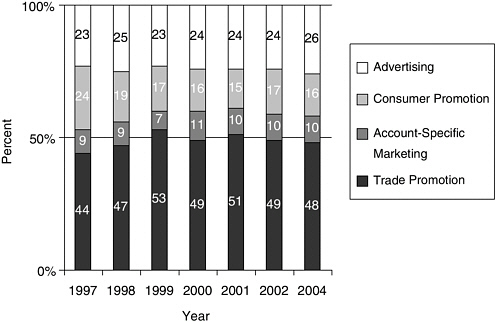
FIGURE 4-5 Allocation of all companies’ marketing expenditures (including food companies), 1997–2004.
NOTE: See pages 137-138 for a description of marketing categories.
SOURCE: Reprinted with permission, from GMA Forum (2005).
trade promotion than other types of companies. One analysis indicates that food companies devote 55 percent of their marketing budgets for trade promotion, 25 percent for consumer promotion (including account-specific marketing), and 20 percent for advertising (GMA Forum, 2005).
Although expenditures on traditional television advertising for food and beverage products have slowed over the past decade, television still remains the primary promotional medium when compared to other measured media categories (Brown et al., 2005; Table 4-11). It appears that more food, beverage, and restaurant advertising dollars are shifting from television into unmeasured media sales promotion (e.g., product placement, character licensing, in-school marketing, special event marketing) (Collier Shannon Scott and Georgetown Economic Services, 2004, 2005b; PQMedia, 2005). For example, the investment in the value of all product placement increased from $190 million in 1974 to $3.46 billion in 2004, reflecting a trend away from traditional advertising to alternative marketing strategies (PQMedia, 2005; Figure 4-6). From 1974 to 2004, all product placement (including food and beverages) in television increased from $71 million to $1.88 billion. During the same period, as reported by
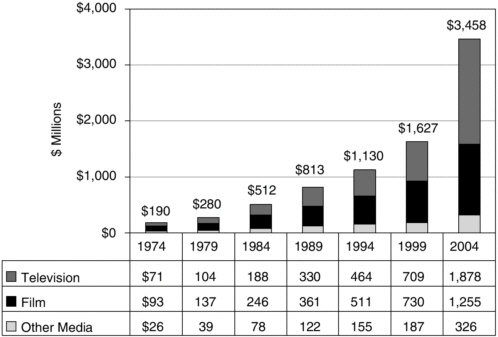
FIGURE 4-6 Product placement spending in media, 1974–2004.
NOTE: Other media include magazines, newspapers, video games, music, books, radio, and the Internet.
SOURCE: Reprinted with permission, from PQMedia (2005).
PQMedia (2005), product placement expenditures in film increased from $93 million to $1.26 billion, and increased more slowly in other media such as video games, magazines, music, books, and the Internet, from $26 million to $326 million (Figure 4-6).
Finding: Television is the primary promotional medium for measured media marketing of food and beverage products to children and youth, but a notable shift is occurring toward unmeasured sales promotion (e.g., product placement, character licensing, in-school marketing, special event marketing).
Advertising and Marketing to Children and Youth
In 2004, an estimated $15 billion was spent on all advertising and marketing directed at children and youth (Schor, 2004), of which a substantial share was devoted to food and beverage marketing. Advertising food and beverage products to children began to emerge in the United States as early as the 1950s (Guest, 1955), and grew during the 1960s,
with the growth of the baby boomers as an untapped consumer market (McNeal, 1964, 1999). Over the decade of the 1990s, there was an estimated 20-fold increase in expenditures on advertisements that targeted children (Strasburger, 2001). Currently, advertising and marketing reach young consumers through many settings (e.g., schools, child care, grocery stores, shopping malls, theaters, sporting events, sponsored events, kids’ clubs) and media (e.g., network and digital television, cable television, radio, magazines, books, the Internet, video games, and advergames). Marketing is both direct, targeted to children and youth, and indirect, targeted to mothers who are the gatekeepers of the household (Powell, 2005). Companies often design dual-marketing strategies to reach children and youth with attractive product packaging and marketing communications that promote messages emphasizing taste, convenience, and fun whereas mothers are more often targeted with messages about the nutritional qualities such as the wholesomeness or health benefits of branded products (Schor, 2004).
The expenditures on food, beverage, and restaurant marketing are substantial. The advertising component alone amounted to industry expenditures of more than $11 billion in 2004, a sizable portion of which targets young people (Brown et al., 2005; Table 4-11). Of this, an estimated $5 to $6.5 billion was spent on televised food, beverage, and restaurant advertisements (Brown et al., 2005; Collier Shannon Scott and Georgetown Economic Services, 2004, 2005a), including about $1 billion to advertise directly to young consumers, primarily through television (McNeal, 1999). Additionally, more than $4.5 billion a year is spent on promotions such as premiums and coupons, $2 billion is spent on youth-targeted public relations including event marketing and school-based marketing, and $3 billion annually is spent on food product packaging designed for children and youth (McNeal, 1999). In all, an estimated more than $10 billion per year is now expended to market food, beverage, and restaurant products to children and youth (Brownell and Horgen, 2004).
Product Appeals
Fun, taste, and product performance are the predominant appeals used in children’s food and beverage television advertising (Tseng, 2001). Television commercials use music and familiar songs and jingles to enhance the perceived quality of a brand and to serve as a vehicle for children to remember the name of a product (Scammon and Christopher, 1981; Schor, 2004). Child actors portrayed in food and beverage commercials have traditionally been depicted as having fun with their peers when they consume the advertised product (CSPI, 2003). Audiovisual production techniques accentuate and enhance positive feelings about products by using action, rapid pacing,
loud music, animation mixed with live action, close-ups, and rapid cuts. Marketers also use food as entertainment where the product is linked to a desirable emotional state (CSPI, 2003; Samuels et al., 2003). Flavor, texture, and fun are the characteristics that foster brand appeal for products such as RTE sweetened breakfast cereals. Accompanying the close-ups of these food products are verbal references to product flavors or textures such as fruity or chocolaty, honey taste or marshmallow texture, crunchy or crispy. In many instances, the breakfast cereal product names reflect their contents (e.g., Frosted Flakes®, Frosted Mini Wheats®, Honey Comb®, Cocoa Pebbles®, Cookie Crisp®), underscoring and reinforcing sweet flavor qualities.
Branded Spokescharacters
Advertising approaches for breakfast cereals have generally revolved around characters that represented, promoted, or embodied specific brands. Many of the branded spokescharacters used today have been used for decades and often carry across several forms of communication including package designs, events, promotions, and advertising (Lawrence, 2003). The RTE breakfast cereal category represents a $6 billion annual business (Thompson, 2004). In 2004, the three major breakfast cereal companies—Kellogg Company, General Mills, and Kraft Foods—collectively invested $380 million in children’s advertisements in the United States (Ellison, 2005). These companies have used spokescharacters to market and build brand awareness, appeal, and loyalty for their respective packaged products.
Spokescharacters symbolize brands, often with a particular demeanor intended to set a tone for the product (Enrico, 1999). These anthropomorphic figures are designed to be fun and friendly for children, and each is
TABLE 4-12 Spokescharacters for Selected Ready-to-Eat Breakfast Cereal Brands
|
The Kellogg’s Company Cereals |
Kraft Foods’ Post Cereals |
|
|
Cereal |
Character |
Cereal |
|
Frosted Flakes® |
Tony the Tiger™ |
Golden Crisp® |
|
Froot Loops!® |
Toucan Sam® |
Honeycomb® |
|
Kellogg’s Smacks® |
Dig ‘Em™ Frog |
Alpha-Bits® |
|
Rice Krispies® |
Snap! Crackle! Pop!® |
Fruity Pebbles® and Cocoa Pebbles® |
associated with the company’s branded breakfast cereal. Table 4-12 shows spokescharacters for selected RTE cereal brands. Some of the characters have undergone physical transformations over the decades. For example, Tony the Tiger™ was created in 1951 to promote Kellogg’s Sugar Frosted Flakes® that was later changed to Frosted Flakes®. More recently, he has been designed as slimmer and more muscular as Americans became more health conscious (Enrico, 1999). In 2005, the Tony the Tiger™ mascot was launched to reach 2- to 5-year-olds through a $20 million television and print campaign targeted to mothers as the household gatekeepers with a reformulated cereal as a “food to grow by” and to help active children “earn their stripes” (Thompson, 2004).
Real-life branded spokescharacters have also been used by companies to market their image and branded products. A clown named Ronald McDonald was created in 1963 and used as a spokescharacter to appeal to children, with the intent of associating him with a fun experience and the food offered at McDonald’s (Enrico, 1999; Ritzer, 2004). Selected as the second most famous advertising image of the 20th century, after the Marlboro Man, Ronald McDonald’s face is recognized by nearly 96 percent of American children, and is used to sell fast food for the QSR internationally in more than 25 languages (Enrico, 1999).
Employing the same type of advertising used for RTE breakfast cereals, manufacturers of bakery products such as snack cakes, cupcakes, and Twinkies used spokescharacters in enjoyable adventures. For example, Hostess uses Happy Hoho® and Captain Cupcake® (Hostess, 2005) and Nestlé uses the Nesquik Bunny™ to promote its chocolate-flavored beverage directly to children (Nestlé, 2004). Kool-Aid®, created in the 1920s, was promoted by two spokescharacters, the Smiling Face Kool-Aid® Pitcher, and in 1975, the Kool-Aid® Man (Hastings Museum of Natural and Cultural History, 2004; Kraft Foods, 2005b).
|
|
General Mills’ Cereals |
|
|
Character |
Cereal |
Character |
|
Sugar Bear |
Trix® |
The Trix® Rabbit |
|
Crazy Craver |
Cocoa Puffs® |
Sonny the Cuckoo Bird |
|
Alpha-Bit Characters |
Lucky Charms® |
Lucky the Leprechaun |
|
Fred Flintstone and Barney Rubble |
Count Chocula® |
Count Chocula® |
Character Merchandising, Co-Branding, Cross-Promotions
Character merchandising, co-branding, and cross-promotions are techniques used to further the reach of brands by building brand awareness and brand loyalty. Character merchandising refers to the licensing of popular fictional characters, such as Harry Potter™, Spiderman®, Scooby-Doo®, SpongeBob Square Pants®, Winnie the Pooh®, Rugrats®, and Elmo® to promote the sale of many types of products (CSPI, 2003; Mintel International Group Ltd., 2003). Licensing is a contractual arrangement that allows copyright holders to loan their intellectual property to another company in exchange for payment (Allen, 2001). Co-branding is a technique where two companies partner to create one product. It is used to reach new customers and to extend a company’s name and trademark to new areas of the consumer market (Pollack Associates, 2003). Cross-promotion is a technique in which a manufacturer sells a new product related to an existing product a consumer already uses or which the marketer has available. Cross-promotions have been mutually profitable and beneficial for companies that build business relationships across products and media.
In the children’s media industries, companies may license the characters and images of their media products to other companies for a fee. The characters are taken from a variety of media sources including film cartoons, toy creations, live-action feature films, comic and fiction books, newspaper strip cartoons, video games, and advergames (Mintel International Group Ltd., 2003). The toy industry has benefited greatly from character licensing of children’s movies and television. Other industries that have generated profits from character merchandising are snack food companies, QSRs, and clothing manufacturers that incorporate popular characters into their products to increase the likelihood that children or their parents will buy their products (Allen, 2001).
Certain licensed characters, such as Spiderman® and Scooby-Doo®, are designed to appeal to children and parents who remember them from their own childhoods (Mintel International Group Ltd., 2003). Many of the characters are found in multiple forms of media, such as Harry Potter™, a fictional character from a book, who also appears in live-action films and computer games (Mintel International Group Ltd., 2003). Different characters are used for various age groups depending on a child’s cognitive abilities and the appeal of the character to children and to parents. For example, mothers tend to have a preference for gentle, one-dimensional, friendly, and safe characters such as Barney™, Mickey Mouse™, and Teletubbies™ (Hind, 2003; Lawrence, 2003). Marketers seek to establish positive relationships among a brand, the parent, and a very young child by developing programs with branded stories, in order to promote an ongoing relationship with the spokescharacter that endorses the brand and that also provides input to marketers for new product development targeted to young children (Hind, 2003).
By the time children reach the age of 6–7 years, they prefer humorous and sometimes more aggressive characters, such as Looney Tunes’ Road Runner (Lawrence, 2003). As they get older, tweens ages 8–13 years prefer more complicated characters such as The Simpsons™. As their lifestyle interests broaden to include music and sports celebrities, cartoon characters become less important and certain brands are less appealing when compared to teen or adult brands (Lawrence, 2003). Based on these trends, it is apparent that different developmental stages carry the prospect of different responses to marketing by children and youth.
Character licensing has been a prominent means of cross-promoting and increasing product interest and brand awareness in foods and beverages either as versions of the product (e.g., SpongeBob SquarePants® Mac ‘n Cheese), or as premiums (toys, prizes, or giveaways) associated with traditional products. Some companies develop business relationships with food and beverage companies and purchase registered trademarks, such as General Mills’ Cheerios® and Kraft Foods’ Oreos®, and use them under a license agreement to co-brand and market products such as books or toys to children under the age of 6 years. Children’s books such as Kellogg’s Froot Loops!®Counting Fun Book (Barbieri McGrath, 2000), The Oreo™ Cookie Counting Book (Lukas, 2000), The M&M’s®Brand Chocolate Candies Counting Board Book (Barbieri McGrath, 1997), and the Cheerios®Play Book (Wade, 1998) are examples of licensing brands and co-branding aimed at young children. Products that have used cartoon characters on packaging to promote foods include Nabisco’s Dora the Explorer® crackers and cookies, Edy’s Fish ‘N Chips® ice cream featuring Disney’s Finding Nemo characters, Kellogg’s Spiderman® Pop-Tarts®, and Kraft Macaroni and Cheese® with noodle shapes in SpongeBob SquarePants®, Rugrats®, and Scooby-Doo® varieties.
Licensed characters have only recently been used to market healthful food and beverage products that are designed for consumption by preschoolers. Sesame Street has licensed several of its characters to companies for products such as Apple & Eve Sesame Street Juices® (Apple & Eve, 2005), Earth’s Best® line of organic breakfast foods and snacks (Earth’s Best, 2005), and IN ZONE Brands’ Tummy Tickler 100 percent fruit juices (IN ZONE Brands, 2004). IN ZONE Brands has also licensed the use of several other cartoon characters targeted at younger children including Bob the Builder™, Clifford the Big Red Dog™, Barney™, and Snoopy™ in programs such as Baby Looney Tunes™, Dragon Tales™, and Land Before Time® (IN ZONE Brands, 2004). The Fluid Milk Processor Promotion Board has used cartoon characters such as Garfield the cat, Superman™, Rugrats®, and Blue’s Clues™ characters to promote the consumption of milk in children to promote bone health (Graetzer, 2005).
Cascadian Farm® promotes a high-fiber and reduced-sugar RTE breakfast cereal featuring Clifford the Big Red Dog™ (Cascadian Farm,
2003). Cascadian Farm built on its marketing of Clifford Crunch cereal to create “Clifford’s Guide to the Guidelines.” This online resource is an example of how some companies are reaching out to engage parents by providing tools for them to create healthful diets for their children. The guide was designed to help parents understand and follow the 2005 U.S. Department of Health and Human Services (DHHS)/USDA Dietary Guidelines for Americans when planning their children’s meals (General Mills, 2005c; Chapters 2 and 3). Recently, Nickelodeon announced that it has begun licensing its popular cartoon spokescharacters, SpongeBob SquarePants® and Dora the Explorer®, to produce companies for promoting fruits and vegetables such as carrots and spinach, although it will still be used on less healthful branded processed food products (Smalls, 2005b). In addition, Sunkist® has recently collaborated with Sesame Workshop™ to encourage children and youth to choose citrus fruits as a healthful snack alternative, using Sesame Street’s Cookie Monster® (Sunkist, 2005). Long-term evaluations of the use of licensed characters are needed to assess the characters’ appeal and influence on children’s food preferences and consumption habits.
Food and beverage companies also use the highly profitable market of children’s toys, books, and clothing to co-brand their products. In the toy market, Mattel’s Barbie® doll has a variety of food-related dolls including McDonald’s Fun Time™ Barbie (Mattel, 2001) and The Coca-Cola® Barbie® series (Mattel, 2005). Each of the dolls comes with the food company’s logo and miniature examples of the company’s products (CSPI, 2003; Samuels et al., 2003; Mattel, 2005). Hasbro offers several PlayDoh® play sets for children featuring familiar food brands such as Little Debbie®, Chuck E. Cheese®, and Lunchables®. Easy-Bake Oven® play sets from Hasbro provide children with real-life examples of branded foods. Examples feature Chips Ahoy®, Oreos®, Pizza Hut®, and M&M’s® (Story and French, 2004).
Marketing tie-ins with children’s movies and fast food are becoming more common (Lippman and McKay, 2001). For the first three Harry Potter™ movies, The Coca-Cola Company spent $287 million on a co-branding campaign (Walley, 2002), which guaranteed tie-ins with the movie and the character of Harry Potter™ in any promotional material through product packaging, games, the website, and in-store displays (Lippman and McKay, 2001). In partnership with DreamWorks entertainment company, Baskin-Robbins ran Sinbad-themed television spots endorsing its deep blue menace sundae and Sinbad’s triple punch sherbet (PRIMEDIA Business Magazines & Media, 2004), and Masterfoods’ M&M’s® new color-changing candies, M&M’s® Magic Minis, had Sinbad themes (PRIMEDIA Business Magazines & Media, 2004).
Two QSR chains, McDonald’s Corporation and Burger King, maintain
exclusive contracts with movie production companies. Burger King partners with DreamWorks and Nickelodeon for co-branding (Ordonez, 2001). In 1996, McDonald’s Corporation signed a 10-year contract with Disney (McDonald’s Corporation, 1996). It has also started a new multicategory licensing initiative called McKIDS™ that unifies its branded product line including toys, interactive videos, books, and DVDs to reflect active lifestyles (McDonald’s Corporation, 2003). In 2005, the McKIDS™ line of products will offer branded bikes, scooters, skateboards, outdoor play equipment, and interactive DVDs.
Finding: The use of child-oriented licensed cartoon and other fictional or real-life spokescharacters has been a prevalent practice used to promote low-nutrient and high-calorie food and beverage products. Use of such characters to promote more healthful foods, particularly for preschoolers, is relatively recent.
Celebrity Endorsement
Manufacturers of CSDs have become highly competitive to capture the youth market, and youth appeal is being built into advertising targeted to broader audiences and specifically to adolescents. Celebrity endorsements of CSDs, such as the popular cola wars advertisement between Britney Spears, who advertised Pepsi®, and Christina Aguilera, who endorsed Coca-Cola®, links a brand to a fan base (TTT West Coast, 2002), and are designed to appeal to older children, tweens, and teens in the course of their exposure to advertising in adult and prime-time programming. Celebrity endorsement is also used for products from categories viewed as more healthful. Since 1994, the Fluid Milk Processor Promotion Board has sponsored the popular “Milk Mustache” celebrity advertising campaign that has featured entertainers and athletes promoting the benefits of milk and milk product consumption to promote bone health and to prevent osteoporosis, especially targeted to teens (Graetzer, 2005).
Premiums and Premium Advertising
Premium offers, such as toys or giveaways, are commonly used in children’s food marketing. The Coca-Cola Company, which considered youth an important market for its drink by the early 1930s, was one of the first companies to use premiums to market to children and teens, which included special offers and premiums such as yo-yos, marbles, jump ropes, kites, whistles, wagons, and scooters provided by local bottlers (Petretti, 1992). Premiums are often used in RTE breakfast cereal marketing. The practice of providing product “news” on a cereal package was used as an
added incentive to make the food product desirable with the premium centrally featured in an advertisement. The most successful RTE breakfast cereal premiums were “collectibles,” such as action figures from a movie; children were encouraged to buy the same brand to acquire an entire collection. Premiums have included beauty kits (e.g., Brach’s Rapunzel fruit snacks), trading cards (e.g., Nabisco Ritz crackers), dolls (e.g., Kellogg’s Rice Krispies), and an E.T. Finger Flashlight (e.g., Kraft Food’s Oreo O’s cereal) (CSPI, 2003). At many QSR chains, meals are created and marketed as child-specific portion-sized meals that contain premiums and premium advertising inside the container to attract children and their parents to QSRs (Schlosser, 2001). In some cases, children are encouraged to purchase a product several times to obtain a toy or the other premium (CSPI, 2003). A variety of marketing opportunities promote collectible brands that increase in value over time (Neopets®, 2003). McDonald’s Corporation celebrated its 25th anniversary of the Happy Meal by providing Ty Teenie Beanie Babies® as a collectible premium (McDonald’s Corporation, 2004).
Media Use and Advertising Exposure
Information and data about the types and roles of the multiple media are changing rapidly, without common databases or categories. This means that there will inevitably be some uncertainty and some inconsistency in the ways available data may be interpreted. The descriptions that follow are intended to provide a general sense of the trends, in the face of the uncertainty.
Media Use Patterns
Television. Television advertising has been the largest media carrier of food and beverage marketing to children and adolescents. At the end of the 1950s, 87 percent of American households had televisions, which were the primary venues for advertising to children and parents (Alexander et al., 1998). Today, nearly all children ages 2–18 years live in households with a television—60 percent have three or more television sets (Roberts et al., 1999). Approximately 60 percent of all meals that the average family eats together are consumed while the television is on (Roberts et al., 2005). One-third (36 percent) of young children under age 6 years have a television in their own bedrooms (Rideout et al., 2003), as do two-thirds of those 8 years and older (Roberts et al., 1999; Roberts et al., 2005). Children and youth who have a television in their own bedrooms tend to watch more television than children who do not, and their parents have fewer rules about their children watching television (Roberts et al., 2005).
Television becomes a part of children’s lives from infancy onward
(Rideout et al., 2003). Studies suggest that even 1- and 2-year-old children watch television regularly (Barr and Hayne, 1999; Meltzoff, 1988), and between the ages of 2 and 4, children view approximately 2 hours of television a day (Rideout et al., 2003). By elementary school, television viewing increases to more than 3 hours a day of “live” broadcasts, or more if videotaped watching is included (Comstock and Scharrer, 1999; Roberts and Foehr, 2005; Roberts et al., 2005). After age 14, “live” television viewing drops slightly to about 2.5 hours a day during late adolescence (ages 15–18) (Roberts and Foehr, 2005).
Although television viewing remains the vehicle through which children and youth spend a significant amount of their discretionary recreational time, they are also now using other types of electronic media, including video games, DVDs, computers, and wireless devices that provide access to the Internet (Rideout et al., 2003, 2005; Roberts et al., 1999, 2005; Rubin, 2004). In fact, it appears that, when given a choice, children and adolescents choose the Internet over television by a two-to-one margin (Gardner, 2000).
Computer use. Computer use begins early in life and increases rapidly. An estimated 21 percent of children under age 2, 58 percent of 3- to 4-year-olds, and 77 percent of 5- to 6-year-old children use a computer (Calvert et al., 2005; U.S. Department of Education, 2003). By the time they are 3 to 4 years old, many children can turn on a computer, point and click with a computer mouse, load a CD-ROM, and use or “surf” the Internet (Calvert et al., 2005).
From 2000 to 2005, the percentage of 8- to 18-year-olds who have computers in their homes increased from 73 percent to 86 percent, and three-quarters of them have Internet connections at home (Roberts et al., 2005). Between 1998 and 2001, the percentage of teens ages 14–18 years using the Internet increased from 51 percent to 75 percent, and the percentage of tweens ages 10–13 years using the Internet increased from 39 percent to 65 percent (U.S. Department of Commerce, 2002). One estimate suggests that more than 34 million children and youth ages 3 to 17 years in the United States use the Internet, representing 20 percent of the total Internet user population (Rubin, 2004). However, there is a difference in access and use of computers and the Internet, based on demographics and socioeconomic status. Among children ages 6 months to 6 years, Hispanics/ Latinos are less likely to have used a computer than African Americans or whites (Calvert et al., 2005). Use of both computers and the Internet is higher among whites and Asians than African American and Hispanic/ Latino children (U.S. Department of Education, 2003). Children and youth ages 5 to 17 years who live with more highly educated parents or in households with higher family incomes are more likely to use computers and the
Internet than those who live with less well-educated parents or in lower-income households (U.S. Department of Education, 2003). While Hispanic/ Latino and African American children and youth ages 6–17 years have less Internet access at home than white children and youth of the same ages, they have increased access to the Internet at school (Rubin, 2004).
Other media use and multitasking. Total media exposure differs by age, ethnicity, and gender. When multitasking is considered, the combined screen time of 8- to 18-year-olds drops to an estimated 6.5 hours per day (Roberts et al., 2005). Older adolescents report watching television, videos/ DVDs, and movies less than tweens or older children. Specifically, 8- to 10-year-olds report viewing 4.75 hours of screen time and 11- to 14-year-olds report viewing 4.5 hours of screen time. There is a significant drop to about 3.75 hours of viewing screen time for 15- to 18-year-olds (Roberts et al., 2005). There are social and ethnic differences in media use patterns. Among 8- to 18-year-olds, African American children and youth report the most screen time (e.g., representing television, videos, DVDs, and movies) at almost 6 hours per day; Hispanic/Latino children and youth follow at about 4.5 hours per day; and white children and youth report about 3.75 hours per day (Roberts et al., 2005). Time spent multitasking is a prominent characteristic of the media use patterns of youth ages 8–18—with multitasking an activity for 36 percent of African Americans, 27 percent of Hispanics/Latinos, and 21 percent of whites during media use time (Roberts et al., 2005).
There are also differences in how children and youth allocate their time to each individual medium. Table 4-13 highlights the percentage of time children and youth report use of budgeted screen time for different types of media by age. Older teens (ages 15–18 years) spent significantly less time
TABLE 4-13 Percentage of Time Children and Youth Report Using Budgeted Screen Time for Different Types of Media by Age
|
|
Television (%) |
Video/Movies (%) |
Video Games (%) |
Audio (%) |
Computers (%) |
Print (%) |
|
Total sample |
35 |
13 |
9 |
22 |
11 |
11 |
|
Age |
|
|||||
|
8–10 |
39 |
16 |
12 |
14 |
7 |
12 |
|
11–14 |
38 |
12 |
9 |
20 |
11 |
10 |
|
15–18 |
28 |
11 |
6 |
30 |
15 |
10 |
|
SOURCE: Roberts et al. (2005). Reprinted with permission. © 2005 by The Kaiser Family Foundation. |
||||||
watching television or videos and significantly more time using computers or listening to audio media (e.g., radio, CD players, MP3 players, multimedia) than children and young teens. While older teens also spent more time on computers, they spent less time using video games than children ages 8–10 years (Roberts et al., 2005). Use of newer types of media, particularly computers, the Internet, and video games, appears to occur without a reduction in the time devoted to more traditional forms of media such as television, print, and music (Roberts et al., 2005). Video games are a primary activity of the 22.4 million 2- to 18-year-old children, tweens, and teens who use the Internet (Byrnes, 2000). The video game industry is now estimated to be between a $7–10 billion market (Entertainment Software Association, 2005; McCarthy, 2005). Console and personal computer-based video games surpassed movie-ticket box office sales worldwide in 2002 (Mack, 2004).
Youth are particularly adept at using wireless devices and incorporating them into their lifestyles. They provide social connectivity and entertainment, as a way to build relationships, convenience and multitasking capabilities, and fill in gaps of free time or boredom (Cheskin, 2001). Children ages 10 and older are projected to be one of the fastest growing markets for wireless voice and data services (Williamson, 2001). A 2001 survey of youth ages 12 and older reported that 63 percent owned at least one mobile device—58 percent owned a mobile phone, 13 percent owned a beeper or one-way pager, and 6 percent owned a hand-held personal digital assistant (PDA) (Upoc, 2002). African American and Hispanic/Latino youth markets have very high mobile device penetration rates—59 percent of 12-to 24-year-olds from these ethnic groups own a mobile phone and 11 percent own a two-way pager (Upoc, 2002). The fastest growing group of users of mobile data is children ages 10–14 years (Thomas, 2004). Cell phones may be increasingly attractive to marketers because they offer direct communication with young consumers, either through voice or touch-key interactive programs, and they bypass parental monitoring.
Television Advertising Exposure: Amount and Content
Estimates of the amount and trends in television advertising exposure, like all media use, vary substantially and use different data sources and analytic techniques. Some estimates show higher levels of exposure and trends that are flat or moderately increasing. Other assessments generally show lower levels of exposure, and trends that are decreasing. All analyses show substantial exposure to television advertising by children and youth.
Most of the available research about children’s media use and advertising exposure is derived from studies of television viewing (Chapter 5). Although new media options are evolving at an unprecedented rate, the larg-
est recent studies of children’s media use concur that television remains the primary venue for reaching children and adolescents with marketing messages, especially younger children (Rideout et al., 2005; Roberts et al., 2005). Television receives the majority of advertising budgets as a measured media category because it reaches a larger proportion of a targeted audience compared to the newer interactive media (Stanley, 2004).
Since the Federal Trade Commission (FTC) first considered television advertising to children in 1978, researchers have tried to estimate accurately the extent of commercial content to which children are typically exposed. The methodology by which most estimates have been derived consists of integrating evidence about children’s normative viewing patterns with evidence about the amount of commercial time contained in children’s programming or overall television programming (including adult prime-time television viewing). There are varying estimates of the total number of commercials that are viewed by children. The data presented in this section provide a background to these estimates and support the view that children are heavily exposed to commercials. What is not reflected in the available data are children’s long-term exposure to other forms of marketing techniques in television programming such as product placement in children’s programs, product placement in adult television shows that children may co-view with their parents, and product placement in videos and DVDs viewed by children and adolescents.
Television advertising to children began in the 1950s when persuasive messages were placed on youth-oriented programs such as Howdy Doody, The Mickey Mouse Club, and Roy Rogers (Alexander et al., 1998). Saturday morning emerged as a time for children’s programming on all three major networks—ABC, CBS, and NBC. The significance of Saturday morning programming was that it was the first time that mass media programming was specifically dedicated to the child audience. The emergence of a block of programs dedicated to children allowed marketers to target children with advertisements designed for and directed specifically at them. As early as the 1950s, the hosts of television programs were marketing products within these programs (Alexander et al., 1998). Television became a venue for 30-second commercials that had memorable jingles and lively spokescharacters that advertised food products such as RTE sweetened breakfast cereals (Kotz and Story, 1994). Other food products that were often marketed during youth television programming included candy, snacks, cookies, and sweetened CSDs. Few television commercials promoted food options such as fruits and vegetables or reduced-calorie and noncaloric beverages (Barcus, 1981; Kunkel and Gantz, 1992).
Children and adolescents have television viewing choices today that did not exist more than 35 years ago including syndicated and cable television. Nickelodeon (2005) is an example of the numerous children’s program-
ming networks that exist today. Other networks such as ABC Family, Discovery Kids, Cartoon Network, Fox Kids, and the Disney Channel target this age group by providing children and teens with a variety of programming options. Radio is another medium through which marketers reach to children and youth. Disney has made this medium a viable channel for advertising both to children and parents, who often listen to the radio together in the car. Radio Disney also offers promotions and contests that involve audiences in more active interactions with products advertised (Radio Disney, 2005).
The Federal Communications Commission’s (FCC) regulation of commercial time through the Children’s Television Act of 1990 limited commercial time on children’s programs to 10.5 minutes per hour on weekends and 12 minutes per hour on weekdays. However, food is the most frequently marketed product in television advertisements during children’s television programming, and accounts for 50 percent of the total advertisements viewed (Coon and Tucker, 2002; Gamble and Cotugna, 1999; Kotz and Story, 1994). Some estimates suggest that children view a food advertisement every 5 minutes of television viewing time (Kotz and Story, 1994).
Estimates of annual exposure to television advertising from nearly three decades ago indicated that an average viewer (child or adult) would be exposed to more than 20,000 television commercials per year (Adler et al., 1977). Subsequent data gathered between 1983 and 1987 indicated that the average child, watching roughly 4 hours of television per day, would see more than 30,000 commercials per year for all products, including food and beverages (Condry et al., 1988). Based on advertising content data gathered in 1990, and extrapolation using children’s viewing patterns, some have estimated that children currently view as many as 40,000 commercials on television and cable per year (Kunkel and Gantz, 1992; Kunkel, 2001). The increasing estimates stem primarily from the growing trend of airing 15-second commercials, rather than longer 30- or 60-second commercials, as was common in the past (TV Bureau of Advertising, 2005). Taras and Gage (1995), for example, observed an increase of 11 percent in the number of commercials aired per hour of children’s programming between 1987 and 1993, despite the fact that the total amount of advertising time remained relatively stable.
Given an apparent, albeit small, drop in children’s time spent watching television in recent years (Zywicki et al., 2004), this estimate merits additional examination. Two preliminary unpublished analyses of primary data have been made public and suggest a possible reversal of the childhood advertising exposure trend. The first analysis is based on 4 weeks of Nielsen Monitor-Plus/Nielsen Media Research data for 1977 and 2004 examining children’s programs and adult prime-time programs, advertisements, and audiences (e.g., children ages 2–11 and 12–17 years) (Ippolito, 2005). The
first analysis reports that children ages 2–11 years viewed a total of 22,000 advertisements for all products in 1977 versus 23,530 in 2004 (Ippolito, 2005). These figures include paid advertisements, which decreased from 20,000 in 1977 to 17,507 in 2004, and promotional advertisements and public service announcements (PSAs), which increased from 2,000 in 1977 to 6,023 in 2004 (Ippolito, 2005).10 The second analysis is also based on Nielsen Media Research data and measured total food, beverage, and restaurant commercials viewed per child from 1993 to 2004 (Collier Shannon Scott and Georgetown Economic Services, 2005b). This unpublished analysis reports that the number of food and beverage advertisements seen by children in programs where children are at least half the audience declined approximately 13 percent over this period.
Advertising on television overall has been about 11.5 minutes per hour since the mid-1980s (Cobb-Walgren, 1990). An industrywide survey conducted by MindShare, a widely recognized advertising firm, confirms that the level remained virtually unchanged in 2001, with an average of 11 minutes and 24 seconds per hour devoted to commercial messages (Downey, 2002). Thus, the data reviewed strongly support that U.S. children and youth are currently exposed to a large amount of commercial advertising on television.
For several reasons, it is difficult to identify with precision the total amount of time children are exposed to television advertising. There are both age-related and individual differences in the relative mix of programming types and times that children may view, as well as variability in the amount of commercial content presented across channel types, program genres, and times of day. There is also a lack of clarity about the precise amount of time currently devoted to advertising on children’s programming. One study in the 1970s measured the time as approximately 12 minutes per hour (Barcus, 1981), but a study in the late 1980s measured only 8.3 minutes per hour (Condry and Scheibe, 1989). Although the FCC regulations of commercial programming through the Children’s Television Act of 1990 provide maximum limits, there is some indication that the FCC’s policies are not always followed. For example, in 2004, the FCC fined Nickelodeon $1 million for violating the per-hour time limit 591 times for
advertising in children’s programming (Broadcasting and Cable, 2004), and enforcement actions against other channels for excessive advertising time have occurred in the past.
Marketing of food products has been a common practice on children’s programming since the early days of television. In a study examining 24 children’s programs from the 1950s, 45 percent of all commercials observed were for sweetened breakfast cereals, confectionery, or snacks (Alexander et al., 1998). Starting in the 1970s, content analysis researchers began to produce a relatively clear picture of the overall profile of products typically presented in children’s television advertising. Patterns in the distribution of product types promoted in commercials during children’s shows demonstrate strong stability since regular measurement began approximately 30 years ago (Kunkel and McIlrath, 2003). In general, about half of all commercials during children’s television programming have consisted of food and beverage products, primarily comprised of RTE sweetened breakfast cereals, candy, CSDs and sweetened drinks, and QSRs (Gamble and Cotugna, 1999). This pattern can be seen in Table 4-14, which compares findings from three of the largest studies of children’s advertising, one each conducted in the 1970s, 1980s, and 1990s.
Although there has been a decline in the percentage of commercials for the food product categories from the 1970s to the 1990s (Ippolito, 2005), food product commercials predominate in the advertising directed to children. From a chronological perspective, Cotugna (1988) reports that 71 percent of all such commercials are food advertisements; Kotz and Story (1994) report 56.5 percent; Taras and Gage (1995) report 48 percent; Gamble and Cotugna (1999) report 63 percent; and Byrd-Bredbenner (2002) reports 78 percent. The samples for these smaller studies are typically in the range
TABLE 4-14 Common Types of Food Advertising as a Proportion of All Commercials in Children’s Television Programming
|
Product Type |
Barcus (1977) |
Condry et al. (1988)a |
Kunkel and Gantz (1992)b |
|
Cereals |
25% |
25% |
22% |
|
Candies/snacks/beverages |
29% |
17% |
18% |
|
Fast food/restaurants |
10% |
10% |
6% |
|
Total of primary food categories |
64% |
52% |
46% |
|
aPercentages were derived by combining data reported for advertising sampled in 1983, 1985, and 1987. bKunkel and Gantz (1992) report data for broadcast networks that yielded a total of 72 percent for these three categories, but their overall totals included advertising on independent broadcast and cable channels, which were not surveyed by the previous studies. |
|||
of 10–20 hours each, which may account in part for the range of outcomes; nonetheless the pattern is clear that food commercials predominate in television advertising directed to children.
On the other hand, there continues to be some uncertainty about the trends for the actual numbers of television commercials seen by children. An analysis of Nielsen Media Research data conducted for the Association of National Advertisers (ANA) and GMA reports that the number of food, beverage, and restaurant commercial impressions viewed annually by children ages 2–11 years has declined from 5,909 in 1994 (or roughly 16 commercials a day) to 5,152 in 2004 (or roughly 14 commercials a day) (Collier Shannon Scott and Georgetown Economic Services, 2005b). This is the first study to indicate any reduction in the number of television commercials seen by children. Preliminary findings of an unpublished study similar to the ANA/GMA study were presented publicly at a joint workshop sponsored by the DHHS and the FTC. That comparison covers a longer period, from 1977 to 2004, and reports a larger decline with 34 percent fewer food and beverage advertisements in programs watched mainly by children (Ippolito, 2005). Others have found either stability or increases in the number of food and beverage commercials appearing in children’s programming during this same period (Byrd-Bredbenner, 2002; Gamble and Cotugna, 1999; Story and French, 2004; Taras and Gage, 1995).
With respect to commercial content, the content analysis research indicates that the nutritional characteristics of the food advertised in children’s programming are generally for high-calorie (e.g., high sugar or high fat) and low-nutrient foods and beverages. Applying nutritional categories, Kotz and Story (1994) found that 44 percent of all food advertising in a sample of children’s television programming were in the “fats, oils, and sweets” food group, the category of foods recommended to be the smallest proportion of one’s overall food consumption in the USDA food guidance system. Taras and Gage (1995) indicate that 85 percent of advertised RTE breakfast cereals were high in sugar, as were 100 percent of advertised candy and sweets. In a more recent analysis of food advertisements viewed by children, Harrison and Marske (2005) found that 83 percent were for convenience or fast foods and sweets. Another analysis showed that sugar and corn syrup are the most common ingredients in food products marketed to children (Gamble and Cotugna, 1999). Virtually all studies find limited commercial advertising of healthful food and beverage products to children and youth such as for fruits or vegetables.
Young viewers are also often exposed to general audience oriented shows and the advertising that accompanies them. For example, far greater numbers of children watch such programs as The Simpsons on Sunday evenings than view any Saturday morning children’s show, despite the fact
that the latter group has a much higher concentration of children in the audience although smaller numbers overall.
Similar findings for general audience programming that may be seen by children are reported by Kuribayashi et al. (2001), who compared commercials on Saturday morning children’s shows to Saturday evening adult programs. These researchers categorized foods as “unhealthy” if they contained significant amounts of fat (30 percent or more), sodium (360 mg), cholesterol (35 mg), or sugar (33 percent of calories). Applying this definition, the researchers found that 78 percent of food advertising during evening programming was for less healthful food products, compared to 97 percent for the children’s programs.
There are limited data for determining the types of food and beverage advertisements seen by children and youth of different racial and ethnic groups. Two content analysis studies found that food advertisements aired on prime-time television programs directed to African American households feature more high-calorie and low-nutrient food and beverage products than prime-time programs intended for white audiences (Henderson and Kelly, 2005; Tirodkar and Jain, 2003). There has been limited funding to support research to study the relationship between English-language and Spanish-language television viewing and Hispanic/Latino children and youth in the United States (Subervi-Velez and Colsant, 1993), despite a variety of Hispanic-oriented media (Endicott et al., 2005). There were no content analyses of food and beverage advertisements directed at Hispanic/ Latino children and youth available to the committee. This is an important area for future research.
Finding: Children are exposed to extensive advertising for high-calorie and low-nutrient foods and beverages and very limited advertising of healthful foods and beverages during their daily television viewing.
Print Media
Children and teens read a variety of magazines, ranging from fashion, sports, and entertainment to automotive and electronic games (MPA, 2004a). Some of the more popular children’s magazines are Nickelodeon Magazine, Sports Illustrated for Kids, and Disney Adventures (CSPI, 2003), and some popular teen magazines include Teen People, Seventeen, CosmoGirl, Dirt Rider, and Boys’ Life (MPA, 2004a). Advertisers use the magazines as vehicles to market to teens according to life stage, interests, and gender (MPA, 2004a). Certain teen magazines focus on celebrities and the entertainment industry, and teen publications carry advertisements as well as product placement (KFF, 2004). A recent survey con-
ducted by Neopets® (2003) showed that more than 30 percent of teens’ purchases were directly influenced by magazine advertisements for music, games, makeup, and clothes. According to that survey, magazines have even more influence on entertainment choices, persuading 37 percent of teens to see a movie in the theater and 36 percent to purchase a video or DVD (Neopets®, 2003). Recently, teen magazines have started to use the Internet to recruit individuals to inform the magazine staff about emerging trends in youth culture (KFF, 2004). For example, Teen People accesses a network of 9,000 “trendspotters” across the United States who keep the editorial staff up to date on teen issues and concerns (KFF, 2004).
Other Marketing Strategies
Newer marketing approaches directed at children are beginning to appear in Internet applications and video games, including advergames. In an era of television advertisement-skipping technologies such as TiVo and audience fragmentation, the placement of products in venues (e.g., television, films, music, the Internet) that are not readily recognizable by consumers as marketing venues has become a growing practice, with products integrated seamlessly into programming content (Balasubramanian, 1994; Gardner, 2000; Mazur, 1996; PQMedia, 2005). There are also event and loyalty marketing such as kids’ clubs, school-based marketing, and promotions and public relations. Interactive technologies, particularly the Internet, and the more recent wireless technologies such as cell phones, are emerging in new interactive marketing plans (Calvert, 2003).
Systematic and reliable estimates are not readily available for how much marketers are spending in the newer media channels, but the amounts are substantially less than for traditional television advertising. For example, Wild Planet Toys spent only $50,000 for a 4-month online promotion rather than a $2 million traditional television advertising campaign (Gardner, 2000). Similarly, Nabisco spent less than one percent of its advertising and marketing budget at its online site, and produced games that could later be exported (Gardner, 2000). Advertising in and around online games is still relatively rare but is expected to grow rapidly, expanding from a $77 million dollar budget in 2002 to an estimated $230 million dollars in 2007 (Mack, 2004).
Outdoor media include the use of billboards, buses, and projected images. This type of outdoor promotion goes well beyond the traditional roadside billboard. Companies and brands are finding new mechanisms for marketing such as hot air balloons, sides of buses, and “wrapping” buildings and cars with promotional material and signage to generate attention and interest among young people. In 1998, a study conducted by the J. Walter Thompson Media Research Group concluded that outdoor venues
can have a significant impact on children, especially when familiar brands or familiar characters are used. In the study, a campaign by the Fox Kids Network found that awareness of the network among children rose by 27 percent as a result of using billboards (Freitas, 1998).
Event and Loyalty Marketing
Event sponsorships can occur in a variety of settings including schools, shopping malls, and county fairs. The practice enables children to have a fun experience with brands and often to sample new brands (CSPI, 2003). Kids’ clubs organized by specific companies represent a vehicle for these companies to target the child and teen markets. Kids’ clubs distribute coupons and catalogs after learning vital demographic and consumer profile information through “member” registration (Consumers Union, 1990). Baskin-Robbins offers a birthday club program for children, offering a free coupon for a kid-size scoop of ice cream on the child’s birthday (Baskin-Robbins, 2005). Kids’ clubs and birthday clubs target children through e-mail and direct mail to the home mailbox. Coupons and catalogs are forms of advertising and promotional efforts to encourage children to purchase items (CSPI, 2003; Consumers Union, 1990).
School-Based Marketing
Commercial activities in schools appear to be increasing, although published documentation is limited. In one survey of high school principals, half—51.1 percent—believed that corporate involvement in their school had increased within the previous 5 years (Di Bona et al., 2003), the largest involvement being in the form of incentive programs (41.4 percent). Such changes have been noted by the press. An analysis of media references to school commercialism has found significant increases over the past 6 years (Molnar, 2003). These trends have raised particular concerns due to the extent of the activities and the vulnerabilities of children (Palmer et al., 2004). Reasons for the increase of in-school marketing to children and adolescents include the desire to increase sales and generate product loyalty, the ability to reach large numbers of children and adolescents in a contained setting, and the financial vulnerability of schools due to chronic funding shortages (Story and French, 2004).
In-school commercial activities related to food and beverages include product sales, direct advertising, indirect advertising, and marketing research on students (GAO, 2000; Palmer et al., 2004; Story and French, 2004). Direct advertising seeks to gain students’ discretionary money through a diversity of in-school venues, while indirect advertising and marketing conveys a favorable industry image to students which may in-
fluence their brand preferences, brand loyalty, and purchasing behaviors (GAO, 2000). Examples of marketing practices used in schools are shown in Table 4-15.
Multimillion-dollar contracts between manufacturers and school systems have become common. One of the most controversial contract practices is the “pouring contract” or “pouring rights” with school districts for the exclusive use of particular brands of beverages (Nestle, 2000). Many of these contracts are negotiated on a districtwide basis and offer a specified amount for signing a multiyear contract, with additional funds tied to success in meeting specified sales quotas (Nestle, 2000). In 1998, more than 100 schools or school districts had signed exclusive contracts to sell either Coke® or Pepsi®, and by 2000, there were an estimated 180 “pouring rights” contracts in 33 states (Nestle, 2000). In 2001, The Coca-Cola Enterprises had signed 20 exclusive multiyear contracts (McKay, 2001). Recent media attention about food and beverage marketing practices to children has led companies to change their school programs. The Coca-Cola Company and its bottlers have publicly stated that they have collaborated with leaders from major educational institutions to develop model guidelines for school beverage sales and partnerships (Short, 2005; The Coca-Cola Company, 2003). In 2005, the American Beverage Association (ABA) developed new school vending policy guidelines restricting the sale of beverages in elementary, middle, and high schools (ABA, 2005b), discussed later in the chapter.
Contract arrangements are also made with QSR chains to sell food on the school premises, a form of competitive foods to the National School Lunch Program (Chapters 3 and 6). Additional ways to raise funds for schools include cash and credit rebate programs in which stores or other businesses agree to donate a percentage of revenues generated by sales in the form of either cash or supplies and equipment. More traditional school fundraising activities include the sales of items such as candy by students or their parents (GAO, 2000).
Direct advertising seeks to gain the students’ purchasing dollars through a diverse range of in-school marketing venues (e.g., billboards, posters, book covers, school buses, and kiosks). It also includes media-based advertising which goes directly into school classrooms, hallways, lunchrooms, and computer labs. Channel One has been the leading example of direct advertising in the classroom during school hours, providing schools free television equipment and satellite access in return for reaching approximately 8 million secondary students in 370,000 classrooms (Atkinson, 2005; GAO, 2000). Channel One was introduced in 1990 as a 10-minute originally produced news program that had content written specifically for teenage students and presented by young adult anchors and correspondents, accompanied by 2 minutes of commercials (Greenberg and Brand,
TABLE 4-15 Marketing Practices in U.S. Schools
|
Activities |
Examples |
|
Product Sales |
|
|
Food/beverage sales benefiting a district, school, or student activity |
|
|
Branded fast food |
|
|
Cash or credit rebate programs |
|
|
Fundraising activities |
|
|
Direct Advertising |
|
|
Advertising in schools, in school facilities, and on school buses |
|
|
Advertisements in school publications |
|
|
Media-based advertising |
|
|
Samples |
|
|
Indirect Advertising |
|
|
Industry-sponsored educational materials |
|
|
Industry-sponsored contests and incentives |
|
|
Industry grants or gifts |
|
|
Marketing Research |
|
|
Surveys or polls |
|
|
Internet panels |
|
|
Internet tracking |
|
|
SOURCES: GAO (2000); Story and French (2004). |
|
1993). A content analysis of commercials that aired on Channel One in the early 1990s revealed that in the commercials examined, 86 percent were for products (including candy, gum, and chips) and 14 percent were for PSAs (Wulfemeyer and Mueller, 1992). Its advertising revenue decreased from $50.2 million in 2002 to $39.1 million in 2004, in part due to decisions by companies such as Kraft Foods and the Kellogg Company to eliminate in-school marketing (Atkinson, 2005).
Indirect advertising in schools encompasses a range of activities. One of the most controversial forms of indirect advertising is industry-sponsored educational materials (SEMS), which are materials donated by corporations to supplement the curriculum. In its evaluation of 77 SEMS, Consumers Union found nearly 80 percent to be either biased or topically incomplete (Consumers Union, 1995). Other common forms of indirect advertising include the following: industry-sponsored contests or incentives (e.g., providing coupons for free pizza for reading a specified number of books); inclusion of brand-name products as examples in textbooks; provision of industry-sponsored teacher training; donation of hardware for computer labs; or branded scoreboards for gymnasiums or athletic fields.
The National Association of Secondary School Principals (NASSP) has developed guidelines for school beverage partnerships that apply to middle schools and high schools that address vending machine policies, use of logos and signage on school grounds, visibility of company logos, and product promotions and fundraising in schools (NASSP, 2005). Additionally, many state and local school districts have enacted legislation regarding the availability and nutritional quality of beverages sold in public schools (Chapter 6).
Finding: The competitive multifaceted marketing of high-calorie and low-nutrient food and beverage products in school settings is widely prevalent and appears to have increased steadily over the past decade.
New Venues and Vehicles
New and innovative marketing approaches that are used in the adult marketplace are now being adapted for children and youth (Kaikati and Kaikati, 2004), including marketing research. Emerging marketing practices often blur the line between product and content through practices such as product placement in movies, television programs, websites, or games; viral marketing; information collection from youth as they spend time on Internet websites; interactions with online dialogues; and video news releases (Gardner, 2000; Mazur, 1996). At home and in public, children and youth are surrounded by a mobile, fast-paced, high-tech world, which they find comfortable, easy to navigate, and populated with branded characters.
Many websites collect aggregate data from the children who visit them; however the Children’s Online Privacy Protection Act (COPPA) requires parental permission before children ages 12 and younger can provide personal data that may be used in future advertisements directed to them (Montgomery, 2001; Chapter 5).
The Internet and Websites
The Internet is a form of measured media that provides many opportunities for marketers to reach children and adolescents about food choices. Online interactive technology provides the means for companies to attract and develop one-to-one relationships with youth through websites for games, contests, discounts, and prizes. Many websites require registration to visit; therefore, all personal information such as a child’s or teen’s e-mail address, home address, age, and phone number are stored. Children can be sent promotional items, such as newsletters and coupons, to their e-mail address for redemption. “Cookies” can also be placed on individual computers to trace the online activities of a child or adolescent. The tracking makes it relatively easy for marketers to connect advertising messages to youth at popular websites. Online advertising to older children and teens is becoming more common on sites where they purchase MP3 music files to download onto their digital music players. Websites with e-mail, chat rooms, and instant messaging capabilities are also very popular among adolescents and with marketers for targeting purposes. Nearly three-fourths of online teens use instant messaging (Lenhart et al., 2001).
With the advent of personal video recorders and TiVo that can limit exposure to, and the cost-effectiveness of, traditional commercials, creative alternatives are spawned. For example, many branded products marketed to youth maintain websites that are created to supplement traditional forms of mass media advertising, and they are much less expensive to create and sustain. These “branded environments” are popular with older children, tweens, and teens, and use a range of online activities to keep them on the website (Montgomery, 2001). Many popular youth television programs encourage children and youth to visit the website advertised during the end-of-show credits to provide an additional experience with the audience where they find tailored messages. These websites use attractive language, humor that appeals to teens, and interactive games that are likely to increase their appeal to underage youth (Williams et al., 1997). The video news release, in which companies circulate stories about its products, is another form of virtual advertising that is used on television by many news organizations (Mazur, 1996). This kind of technique is less expensive than traditional advertisements and not labeled as an advertisement for the public, which views it as a news program.
Product Placement Across Multiple Forms of Media
Product placement is a marketing strategy aimed at placing products in a visible setting outside a typical marketing context (PQMedia, 2005). Movie placement is a good example. Food product placement made its most prominent debut when Steven Spielberg’s ET character ate Reese’s Pieces® candy in the movie ET, and short-term national sales of the candy increased by 66 percent (Mazur, 1996).The role of product placement in television has become more popular over the past 5 years as an integral component of a larger marketing strategy (PQMedia, 2005). Product placements are increasingly being used across various media vehicles simultaneously including network and cable television programs; films; radio lyrics; pop, hip-hop, and rap music; videos and DVDs; comic strips; books; plays; video games; and advergames (Gupta and Gould, 1997; Holt, 2004; Mortimer, 2002). Marketers recognize the importance of product placement with children and youth who have grown up using technology and turn to other media outlets than television for entertainment and information.
Product placement is part of a broader segment of marketing services called branded entertainment (PQMedia, 2005). Although a product is visible in television shows or films, it is often not the focus, and fits seamlessly into the context of a story or program. Product integration is a special type of product placement where an advertised product is central to the program’s content (PQMedia, 2005). Product placement is designed by media production agents to provide realism to movie and television scenes while attempting to influence viewers through increased brand awareness and product endorsement (Karrh, 1994).
Product placement in prime-time television programs and movies. Although product placement is prohibited by law in programs directed at children (Linn, 2004), it is common in prime-time television programming. There has been limited research investigating the frequency of placement of branded food and beverage products in television programming. One examination of their frequency on prime-time television programming found that nearly 3,000 brand appearances occurred in 154 prime-time programs over a week of programming aired in 1997 on the four major networks—ABC, NBC, CBS, and Fox (Avery and Ferraro, 2000). Some evidence shows that the amount of money spent on product placement for food and beverage products may be substantial. For example, The Coca-Cola Company paid $20 million for product placement on American Idol, a television program that is heavily viewed by tweens and teens (Linn, 2004).
Product placements are abundant in children’s and teens’ movies. In the 2002 film, Spiderman®, the action hero used his web-spinning capabilities
to retrieve a can of Dr. Pepper® to quench his thirst. Heinz Ketchup® was featured in the movie, Scooby Doo. Another popular movie among children, Spy Kids 2, had a character opening a lunch box which included items such as a Big Mac®, french fries, and a CSD with the golden arches of the McDonald’s Corporation prominently displayed. There has also been limited research on the effect of product placement in television or films on consumer behavior. In one study, children were shown amended versions of a brief film clip from a popular movie, half with a prominent branded CSD and half without the branded CSD. Those who had viewed the branded clip selected the branded beverage more frequently after the viewing (Auty and Lewis, 2004).
Product placement in music. The inclusion of branded beverage products into popular songs is emerging as a new type of product placement. Certain media and entertainment companies actively seek brand-spot placements on their CDs and DVDs while a growing number of industry sponsors seek product placements in hip-hop lyrics and music videos (Holt, 2004; Kaikati and Kaikati, 2004).
Product placement in video games and advergames. Product placement is also a growing phenomenon on the Internet. Companies typically retain a product placement agency for an annual fee, then pay additional fees for actual placements, with the cost dependent on whether the product just appears or if the product is actually used and labeled (Mazur, 1996). Video game manufacturers previously paid companies for use of their logos and brands in video games. Now the practice is reversing as video game revenues rival those for movies. It is estimated that industry sponsors will spend $750 million to embed products in electronic games including advergames and video games. Online advergaming revenue (including both traditional advertising and advertising within games) is estimated to increase from $134 million in 2002 to $774 million by 2006 (Fattah and Paul, 2002).
Although it is difficult to assess the impact that advergames (see below) may have on consumers’ brand loyalty, a distinct advantage of embedding products within video games is brand repetition. The average online gamer spends 5 to 7 minutes on an advergaming site, which is an estimated 14 times the amount of time spent watching a television commercial (Fattah and Paul, 2002). Additionally, the nature of the interaction with product brands online compared with a television commercial is very different. An online user is an active receiver of marketing messages, whereas a television viewer may look away or leave a room during a television commercial (Fattah and Paul, 2002; CSPI, 2003). Companies survey consumers to determine positive brand impressions and branded product recall. Product
recall demonstrates the effectiveness of this embedding. When players were interviewed, they generally did not find the product embedding intrusive or offensive (Fattah and Paul, 2002; Kaikati and Kaikati, 2004).
Food marketers are increasingly building brand awareness and loyalty through product placement through video games on CD-ROMs, consoles, or the Internet (Freeman, 1998). A successful game, regardless of the platform, is equivalent to a successful product because the consumer is engaged, interested, and focused on the product (Mack, 2004). Games offer the capacity to foster and enhance chat room “buzz” and “word of mouth,” thereby compounding its promise as a marketing technique. Brands are placed in realistic situations within the video game to simulate their real-world use, to enhance branding, and to increase interest in specific products (Mack, 2004).
Traditional console or hand-held games are a more expensive venue for product placement than are online venues. In a console game, planning must be done in advance, and once it appears on the market, the product placement cannot be changed. Although slower than console games, simple flash animation games, available only on the Internet, can be created and updated rather quickly as one online version can simply replace an earlier version (Mack, 2004).
Advergames are Internet-based video games with a subtle or overt commercial message (Eisenberg et al., 2002). A recent unpublished analysis of Nielsen Media Research and Nielsen//NetRatings data examined the exposure of children ages 2–11 years to Internet entertainment sponsored by 23 food and restaurant companies. Findings suggested that entertainment content on food and restaurant websites accounted for a very small amount (0.025 percent) of the combined total Internet and television impressions for these companies (Collier Shannon Scott and Georgetown Economic Services, 2005b).
However, advergames are a way to build brand awareness and brand loyalty, ensuring that immersive branding occurs through extended periods of time of exposure versus an “impression,” so that children and teens may develop favorable views and memories of specific branded products (Calvert, 2003). Food marketers are building brand awareness and loyalty with advergames such as “Big G All-Stars vs. Major League Baseball,” a CD-ROM game in which cereal characters from General Mills play against major league baseball teams (Freeman, 1998). The Hostess Company has a website featuring interactive advergames with the Twinkie® brand intended for children ages 7 to 11 years. Although the website does not sell products or provide information about the products, it serves to imprint the brand name and build brand loyalty among children (Hunter, 2002). Advergaming has also reached toddlers and infants with familiar rhymes within carefully designed Internet-based games (Friedman, 2001).
While gaming has generally been favored by boys more than girls (Subramanyam et al., 2001), most companies now attempt to attract both genders through a branded advergame that revolves around action or role play (Mack, 2004). Websites that are popular with tween girls, such as Neopets.com®, use marketing techniques such as product placement and immersive advertising, which integrates sponsors’ products or services into activities available on a website (Fonda and Roston, 2004; Neopets®, 2005). In the land of Neopia®, children create pets with cuddly names and the play with them (Snider, 2002). In the Neopia® food shop, young children can “spend” their Neopoints to purchase Uh Oh Oreo® cookies, Nestlé SweeTarts®, and Laffy Taffy® candy. They can gain Neopoints by viewing cereal advertisements and Disney movie trailers and participate in marketing surveys. Tie-ins to new CDs and other products are also featured. Neopets® advertisers include Discovery Kids Channel, Disney, Frito-Lay, General Mills, Hasbro, Kellogg Company, Kraft Foods, Mars, McDonald’s Corporation, Nabisco, Nestlé, Universal Studios, and Warner Brothers (Neopets®, 2005). Although Neopets® was initiated in 2000, the company describes itself as “the world’s largest and fastest growing youth entertainment network on the Internet” (Neopets®, 2005). Neopets® describes itself as having pioneered the technique called “immersive advertising,” which seamlessly integrates sponsors’ products or services into activities available on the Neopets.com® website (Neopets®, 2005). Neopets® reports that it has 30 million members, 39 percent under 13 years of age, and 40 percent between 13–17 years of age (Neopets®, 2005). Postopia.com® is another website. Hosted by Viacom International, the parent company of Nickelodeon, it features Kraft Foods’ food and beverage brands (Viacom International, 2005). Another website, Candystand.com®, is hosted by various companies that make confectionery such as Life Savers® and provides arcade games, card games, and downloads (Skyworks Technologies, 2004).
Digital Television
A new marketing technique called “interactive product placement” merges television and the Internet through channels such as digital television and Web television. With these technologies becoming more available, products are expected to become featured as part of program stories and will be available for purchase by clicking a mouse that is connected to a television screen (Montgomery, 2001). This type of interactive media that allows the purchase of merchandise through television using a remote control is also called “t-commerce” or “embedded commerce,” and is currently available on websites of television programs. A new form of technology will provide a one-click ordering opportunity from the television screen for all products including food and beverage products (Children Now, 2005;
Tarpley, 2001). This type of technology may also allow marketers to track and store users’ personal data for marketing purposes (Children Now, 2005).
Viral Marketing
Viral marketing is a form of “under the radar” marketing (sometimes called “stealth marketing” in popular vernacular), which represents the “buzz” or “word of mouth,” which occurs when people talk about a product to one another, either with real words or through virtual communication through an electronic platform (Henry, 2003; Kaikati and Kaikati, 2004). Viral marketing may be effective with teens, particularly if discounts, desirable products, and free premiums are provided (Schor, 2004). Buzz or viral marketing functions in the electronic marketplace through trendsetters who “seed” messages, brand preferences, and incentives (e.g., gift coupons for websites, product samples) (Gladwell, 2000). In some instances, the trendsetters may receive training and be aware of their role. In other instances, it is entirely web-based communication, creating a “blogging network.” The buzz tools are Internet chat rooms, news groups, and “blogs” (e.g., personal online journals; the term is short for “web logs”) (Kaikati and Kaikati, 2004).
With viral marketing, a company may hire young actors who sign a confidentiality agreement and then interact with unsuspecting consumers in a popular or public gathering spot. Music industry marketers have used the approach by sending pairs of young, trend-conscious consumers into stores to talk about a new CD or DVD to each other, knowing that they are overheard by unsuspecting customers (Kaikati and Kaikati, 2004). Although the strategies vary in venues and demographics, they share the same basic approach and goals, which are to arouse curiosity and encourage consumers to develop a focused interest in a specific product they may otherwise not have considered purchasing (Kaikati and Kaikati, 2004). Buzz marketing is often a component of an integrated media and marketing mix (Henry, 2003). The potential utility of viral marketing for food and beverage promotion is just emerging, in particular for CSDs, but its effectiveness is not yet known (Holt, 2004).
Mobile Marketing
Cellular telephones are now ubiquitous in the United States. Most cell phones are now able to process data services such as text messaging, information, Internet access, and entertainment. The Mobile Marketing Association has established a voluntary code of conduct for wireless marketing campaigns. One of the code’s requirements is that consumers must select
all marketing programs or be able to easily decline certain programs; however, not all marketers have followed the standards (Joyce, 2004). Although marketing through a cell phone can be legally achieved only with a recipient’s consent, technological developments with cell phones and marketing efforts to older children and youth may significantly change this premise in the future. For example, The Coca-Cola Company launched a marketing campaign in Germany that allows consumers to send text message codes found under bottle caps in return for receiving a branded cell-phone game (Red Herring, 2005). Young consumers are also enthusiastic adopters of text messaging and other mobile features such as transmitting electronic games on the Internet between friends (Calvert, 2003). Many marketers believe that the relative ease with which teens and tweens use mobile technology offers a large, untapped potential market (Preschel, 2005; Thomas, 2004).
In 2005, Nickelodeon and Verizon Wireless launched the Nick Mobile, which brings Nickelodeon video content to users of Verizon Wireless’s V CAST wireless phones (Verizon Wireless, 2005). A selection of 1- to 3-minute Nickelodeon videos that have recognizable characters from Dora the Explorer, Blue’s Clues, and LazyTown are available to view on cell phones (Verizon Wireless, 2005), and these videos may contain embedded food and beverage products.
Cell phones are also equipped with global positioning satellite tracking capabilities and will be able to provide businesses and companies with the ability to “find” consumers anywhere and tailor advertising messages to them. For example, it is possible that an individual walking the streets of a major city may someday receive advertisements by cell phone instantly when passing by a store. Cell phones may also be used to allow young consumers to purchase products without using cash (Calvert, 2003), already occurring outside the United States. For example, consumers in Japan are able to use their mobile phones to purchase products from Coca-Cola™’s “Cmode” vending machines (Red Herring, 2005).
Adult cell phone users are able to download store merchandise coupons, instant-win games, and sweeps, and these features could potentially be used when marketing to children. Current mobile phone owners ages 12 and older were surveyed about their willingness to accept and use wireless coupons or special offers. Of those polled, 79 percent of African Americans ages 12–34 years and 61 percent of Hispanics/Latinos ages 12–34 years were somewhat or very likely to use wireless coupons or special offers (Upoc, 2002).
Finding: Food and beverage marketing is increasingly delivered through integrated vehicles other than the traditional television advertising (e.g., Internet, event sponsorships, outdoor media, kid’s clubs, video games,
advergames, product placement, music, and schools) that are especially appealing to children and youth.
COMPANY AND INDUSTRY GUIDELINES AND POLICIES
Self-Regulation: Children’s Advertising Review Unit
Mindful of the need for responsible practices in marketing food and beverage products to children and youth, the industry has developed its own program of self-regulation that has two basic elements: (1) a code of practice, representing a set of ethical guidelines that provide oversight for the content of advertising activities, and (2) a process for implementing, reviewing, and enforcing the code of practice. The purpose of industry self-regulation is to ensure that advertising messages directed to young children are truthful, accurate, and sensitive to this audience, thereby “preserving their freedom to direct their messages to young children” (CARU, 2003b). To administer the industry program of self-regulation, the Children’s Advertising Review Unit (CARU) was formed in 1974 to promote “responsible children’s advertising.” CARU is part of an alliance with the major advertising trade associations through the National Advertising Review Council (NARC), which is the body that establishes the policies and procedures for CARU. NARC members include the Association of National Advertisers (ANA), the American Association of Advertising Agencies (AAAA), the American Advertising Federation (AAF), and the Council of Better Business Bureaus (CBBB) (CARU, 2003a).
CARU’s board consists of academic and business members. It is financed entirely by the business community, and receives support from the various sectors that advertise to children, including advertising agencies, toy and video game manufacturers, food and beverage companies, QSRs, and Internet providers (CARU, 2003b). CARU is the investigative arm of the advertising industry’s voluntary self-regulation program for children and youth. Cases are brought to the attention of these two entities from competitive challenges from other advertisers, and also from self-monitoring traditional and newer media, including the Internet (CARU, 2003b).
CARU’s Self-Regulatory Guidelines for Children’s Advertising include seven basic principles for responsible advertising directed to children under the age of 12 years that relate to specific advertising techniques, such as advertising that involves endorsement and promotion by program or spokescharacters (Box 4-1). The CARU guidelines are adopted voluntarily and emphasize nondeceptive communication for children; however, CARU does not have oversight of product content or services being advertised (CARU, 2003a).
|
BOX 4-1
SOURCE: CARU (2003a). |
CARU’s guidelines are formally supported by many food, beverage, and QSR member companies, including General Mills, Kellogg Company, Kraft Foods, McDonald’s Corporation, Nestlé, and PepsiCo (CARU, 2003b). Many companies and trade associations representing the food and beverage industry have adopted some of these principles in their own sets of standards, such as accurate and age-appropriate advertising, acknowledgment of children’s imaginations, and attention to the fact that children are often unable to distinguish a commercial from information. For ex-
ample, in January 2005, Kraft Foods publicly clarified existing policies and announced changes in the company’s product portfolio and advertising policies to children under 12 years of age. The company stated that it does not advertise to children ages 6 years and younger on television, radio, and print media; it discontinued advertising and promotion in schools, including Channel One; and it had developed nutrition standards for all products sold through vending machines in schools (Friedmann, 2005).
An independent assessment of company compliance with the CARU guidelines across a sample of 10,000 advertisements directed to children in the early 1990s found a high overall rate of adherence (Kunkel and Gantz, 1993). An assessment conducted by NARC (2004) suggested that within its designated technical purview, the CARU guidelines have been generally effective in enforcing voluntary industrywide standards for traditional advertising, and that the number of advertisements that contain words and images that directly encourage excessive food consumption in children has been reduced. Implicit in these findings, however, is their limited scope. The guidelines do not address issues related to the volume of food advertising targeted to children, the broader marketing environment, or the many alternative integrated marketing approaches that are rapidly increasing as primary strategies for reaching children and youth.
There has been growing concern among consumer advocacy groups about CARU’s ability to monitor children’s food and beverage advertising and newer forms of marketing across several types of media. In response to this concern, the Grocery Manufacturers Association (GMA, 2005a) recently proposed several changes to enhance CARU’s resources, transparency, and enforcement capacity to strengthen the CARU self-regulatory system (GMA, 2005d). GMA’s proposal includes provisions that would (1) expand CARU’s advisory board to support the monitoring and review process; (2) allow CARU to work with advertisers to develop approaches that would encourage constructive and consistent healthy lifestyle messages; (3) strengthen voluntary pre-dissemination review of advertisements; (4) expand CARU’s guidelines to address advertising contained in commercial computer games, video games, and interactive websites where children and teens are exposed to advergames; (5) prohibit paid product placement on children’s programming; and (6) use third-party licensed characters appropriately in children’s advertising. GMA also proposed two recommendations for the government. The first calls on the private sector to build a closer relationship with the FTC and DHHS to strengthen the voluntary self-regulatory system. The second is for the government to support the private-sector initiatives. GMA suggested that the DHHS develop an awards program that would recognize companies for promoting healthy lifestyles in such areas as consumer communications, employee health and wellness,
community activities, product development, and public–private partnerships (GMA, 2005d).
Finding: Efforts by the Children’s Advertising Review Unit have influenced certain elements of traditional advertising within its designated purview, but these standards do not address the impact of the volume of advertising, the appeal of its association with other elements of the popular culture for children and youth, or the influences of rapidly increasing marketing approaches. Furthermore, there is a need for a more formal evaluation of the effectiveness of its impact and enforcement capacity.
Food and Beverage Companies
Individual companies, and industry collectively, are motivated to make changes in their product portfolios toward more healthful choices in the marketplace for a variety of reasons, including expanding their market share, displaying social responsibility, avoiding regulation, and avoiding litigation. In terms of expanding market share, some companies are taking advantage of consumer interest in nutrition and health by developing and promoting new food and beverage products, and reformulating existing products, to meet specific nutritional guidelines. Several are also creating new packaging to reduce portion sizes of certain products, supporting community health and wellness initiatives, promoting nutrition education and physical activity in schools, initiating consumer research to develop more effective ways to convey nutrition information, and delivering information about more healthful company products to consumers. By manifesting social responsibility through the marketing of healthier products, companies anticipate strengthening both their market position and their credibility with consumers. Although hardly a mainstream practice, some early positive signs suggest the possibility for leading companies to serve as role models for the entire industry sectors (e.g., food and beverage companies, restaurants, entertainment sector).
Recent statements made by theAmerican Council for Fitness and Nutrition and GMA have acknowledged that the food and beverage industry can play a positive role in assisting children, youth, their families, and communities to lead more healthful lives (ACFN, 2004; GMA, 2005b). GMA’s public statements also underscore a commitment to reverse the obesity trend in the United States, and acknowledges that the solution will involve a long-term investment as well as multiple and integrated strategies across many sectors (GMA, 2005b).
There is some indication that several of the leading food and beverage companies are reformulating some popular brands to eliminate or reduce
trans fats and saturated fats as well as to develop reduced sugar, low-fat, or fat-free choices, and higher nutrient products, and to shift overall product portfolios toward healthier options on a small scale (Collier Shannon Scott and Georgetown Economic Services, 2005c; Friedmann, 2005; GMA, 2004; PepsiCo, 2004a; Powell, 2005; Taaffe, 2005). The shift in product portfolios has been stimulated in part by competition. Some companies have set internal goals to ensure that increasing portions of their revenues come from either new or reformulated products in response to consumers’ growing interest in healthful options and concern about less healthful products. Several large companies have targeted their product research and development for all age groups. Consumer demand will assist in the development and reformulation of existing company products to more nutritious foods and beverages. A major challenge for these companies is to develop marketing plans and communication strategies that complement efforts undertaken by government and nonprofit groups to educate consumers about the distinguishing nutrition and health-related features of their particular brands within the context of general nutrition education, and how these messages fit into a healthful diet balanced with physical activity.
One strategy employed by several companies seeking to market more specifically on health grounds, has been the development of proprietary logos or icons that communicate the nutritional qualities of their branded products. PepsiCo uses the SmartSpot™ logo, Kraft Foods uses the Sensible Solution™ logo, General Mills promotes 14 different Goodness Corner icons, and the Kellogg Company promotes its Healthy Beginnings Program and its Breakfast Nook logo on packages to identify their products and convey nutritional content information to consumers (Collier Shannon Scott and Georgetown Economic Services, 2005c; Friedmann, 2005; Powell, 2005; Taaffe, 2005). Typically, such products are given “healthier” icons by the companies if they provide key nutrients at targeted levels, meet FDA specifications for “reduced,” “low” or “free” in calories, fat, saturated fat, sugar, or sodium, or contribute to some functional benefit such as promoting heart health or hydration. While representing important steps toward drawing attention to more nutritious products, the array of categories, icons, and other graphics, as well as the different standards employed may introduce some confusion, particularly for young consumers, raising the need for standard and consistent approaches.
An example of work to embed an icon initiative in a larger effort is Kraft Foods’ announcement of marketing changes to enhance the visibility of the healthier choices in its product line. Emphasizing the Sensible Solution™ labeling icon that provides a “flag” on food and beverage products that meet specific “better-for-you” criteria, Kraft announced a shift in the mix of products it advertises in television, radio, and print media viewed
primarily by children ages 6–11 years during children’s programming. The company has committed to advertising, over the course of 2005, only those products that meet its Sensible Solution™ criteria. In this plan, products not meeting these criteria (e.g., Kool-Aid® beverages, Oreos®, and Chips Ahoy!® cookies, and many types of Post breakfast cereals and Lunchables®) would no longer be advertised and would be progressively phased out in marketing communications in 2006 (Kraft Foods, 2005c). The company also announced that only the products that meet the Sensible Solution™ criteria will appear on company websites that primarily reach children ages 6–11 years, and it released a new line of Nabisco 100 percent whole grain cookies and crackers (Kraft Foods, 2005d). Still to be addressed are issues such as advertising to youth, ages 12–17 years, and application of the marketing guidelines to the use of fictional or cartoon spokescharacters on product packages, contests, premiums, and advergames on the Internet (CSPI, 2005).
In a narrower example, PepsiCo has announced an initiative focused on schools, in which it will provide 100 percent SmartSpot™ products and less-than-150-calorie single-serve packages in elementary school vending machines (Taaffe, 2005). For middle and high schools, it will provide 50 percent SmartSpot™ products that meet company-designated nutrition criteria of “good for you” or “better for you”, and 50 percent “fun-for-you” products (that do not have any nutritional qualities) (Taaffe, 2005).
In addition to branded products, there are potential opportunities for packaging innovations for usually unbranded products to meet the demands of consumer convenience while meeting the goals laid out in the Dietary Guidelines for Americans. Fresh and dried fruits, vegetables, and whole grains have not been marketed extensively, perhaps because most are not branded products (Gallo, 1999). Due to the increasing concern about childhood obesity, new product and packaging innovations are expanding the availability of fruits, vegetables, and whole grain products to children and adolescents. The introduction of time-saving products such as bagged, prewashed lettuce and salad ingredients and “snack pack” shaved baby carrots have provided adult consumers and their children with convenient preparations and take-out options (Guthrie et al., 2005).
Finding: The consistency, accuracy, and effectiveness of the proprietary logos or icons introduced by several food companies as positive steps to communicate the nutritional qualities of some of their branded products to consumers have not been evaluated. Without an empirically validated industrywide rating system and approach, efforts to use such graphic portrayals on food labels may fall short of their potential as guides to better food and beverage choices by children, youth, and their parents.
Full Serve and Quick Serve Restaurants
Some QSRs are also exploring ways they might market healthier products. For example, the largest QSR, McDonald’s, announced both that it would seek to transform Ronald McDonald into a spokesperson advocating physical activity, and to introduce and promote some healthier food and beverage options that are lower in total calories and fat at its QSR franchises. Happy Meals now offer the choice of apple dippers (fresh, peeled apple slices) served with a low-fat caramel dipping sauce as an alternative to french fries, and beverages include apple juice and low-fat white and chocolate milk served in child-friendly containers (McDonald’s Corporation, 2004). The company has also begun offering a range of premium salads that are lower in calories than burgers, french fries, and CSDs (McDonald’s Corporation, 2005a; Warner, 2005). Additionally, McDonald’s has announced that it will add nutritional information on its food packaging starting in 2006 (Barrionuevo, 2005). On the other hand, McDonald’s also points out that their initiative is contingent upon consumer demand. An additional challenge is the special handling and packaging that the new offerings require due to a shorter shelf life (Plunkett Research Ltd., 2005).
The SUBWAY® chain restaurants developed the F.R.E.S.H. Steps initiative that was inspired by children and adults requesting healthier meals. The initiative was advertised as helping children and their parents to pledge to living more healthfully by being physically active and eating a variety of nutritious choices. The restaurant also offers voluntary nutrition information about their menu options, and lower-calorie options through the SUBWAY® Kids’ Pak® meal that has less fat, saturated fat, and cholesterol than the burger and french fries. The sandwiches can be custom made to children’s needs (Subway, 2005).
While the healthier menu options are gaining media attention, most QSRs continue to offer choices that are predominantly high in total calories, saturated fat, sugar, and salt. For example, Ruby Tuesday’s operates a fast-growing chain of family-style restaurants known for their salad bar, sandwiches, soups, burgers, and platters. In 2003, the restaurant chain developed a program to provide consumers with nutrition information to make healthier choices at point-of-purchase. However, like other QSR and casual dining restaurant chains, they are gradually reintroducing high-calorie, high-fat choices on their menus because customers are not ordering the healthier low-calorie selections (Pressler, 2005). Many QSRs point out that since consumer demand is the true test of a healthier food and beverage initiative, their success is dependent upon a broader-based sustained societal effort focused on healthier choices.
Finding: Certain food and beverage companies and quick serve restaurants with products prominently consumed by children are actively exploring more balanced and health-promoting product development and marketing strategies. Prevailing industry practices, guidelines, and efforts remain limited.
Food and Beverage Retailers
Supermarkets and other venues such as convenience stores, drug stores, superstores, and warehouse clubs all influence consumers’ choices through their display of healthful foods, beverages, and meals. Activities and changes implemented by some food retailers include offering products that are healthier, less costly, and packaged in smaller portions; promoting healthier products for children through special displays, shelf markers, cross-merchandising, incentives and premiums, in-store product samples, and related activities and events; and sponsoring school nutrition tours, Web and nutrition information on health and weight management, menu planning for children, and in-store health checkups including determinations of children’s Body Mass Index levels (Childs, 2005). Nonetheless, a typical retailer is more likely to flag such items as CSDs, ice cream, and cookies in their promotions (Information Resources, 2005).
It has been suggested that retailers have both profit and public relations incentives to help consumers purchase and consume a healthful diet and to demonstrate that industry can be responsive to public concerns (IOM, 2005). Public-sector initiatives at the federal, state, and local levels might also facilitate activities undertaken by food retailers that support healthful diets, including public recognition, company awards for excellence, competitions, and performance-based tax breaks.
Finding: The food retail sector has taken some steps to promote healthful products to young consumers and their families, but there are abundant opportunities to do more to promote child-oriented foods and beverages that are healthful, visually accessible, and economically affordable.
Trade Associations
Trade associations represent the interests of food and beverage companies, restaurants, the entertainment industry, and the advertising and marketing sector. The GMA has taken steps to survey its member companies with regard to product development, product packaging innovations, providing consumer information resources, public–private partnerships, and the promotion of healthful lifestyles, employee wellness, and public health
initiatives (GMA, 2004). GMA has also developed guidelines for competitive foods and beverage provisions in schools and advertising to children, emphasizing products in schools that meet the Dietary Guidelines for Americans; adhere to an age-appropriate product mix as determined by school systems; and ensure school administrators’ control over vending machines, including choices of food offerings, locations, and times of operation (GMA, 2005b,c; Chapter 6). Although the GMA also has an active Food and Health Strategy Group and it endorses stronger CARU guidelines, as noted earlier in this chapter, it has not yet developed or institutionalized formal company guidelines, best practices, competitions, incentives, or recognition programs that encourage and reward its members to develop and promote healthier food and beverage products. Government agencies could provide technical assistance to help ensure the consistency of these efforts with sound nutrition principles, as well as to help in monitoring compliance and publicizing results.
The largest food and beverage trade association, the Food Products Association (FPA, formerly the National Food Processors Association), uses its scientific and laboratory capacity to provide technical support to member companies in their efforts to improve the safety and nutritional quality of their products, as well as to help them in the application of relevant policies—such as the Dietary Guidelines, MyPyramid, and food labeling requirements—to their product lines. FPA has also implemented various food and nutrition labeling education initiatives to help families and educators assist in making wise food choices, and FoodFit.com, a website devoted to promoting and enhancing the health of consumers through healthful eating and active living. It places an emphasis on advocacy for nutrition and health claims on food products to benefit consumer food choices, and has, in this respect, the potential to facilitate public–private collaboration on industrywide standards and graphic representation for products that support healthful diets (FPA, 2005).
The American Marketing Association (AMA) has developed its own guidelines regarding how its members conduct promotional activities. The AMA has stated that it is committed to clear communication and full disclosure of product risks, and its ethical guidelines for members emphasize that marketers must do no harm; marketers must foster trust in the marketing system; and marketers must embrace, communicate, and practice the fundamental ethical values that will improve consumer confidence in the integrity of the marketing exchange system (AMA, 2005b). Unlike CARU, the AMA guidelines are designed to govern the marketing practices of professionals rather than to encourage self-regulation by the food and beverage industry.
The American Beverage Association, representing distributors, bottlers, and vending machine companies, developed school vending policy guide-
lines in 2005 to limit the availability of CSDs in schools, and increase the availability of lower calorie and higher nutrient beverages.
Under the new voluntary industry-supported policy: (1) elementary schools would only make available water and 100 percent juice; (2) middle schools would only provide low-calorie or noncaloric beverages such as water, noncaloric CSDs, low-calorie juice drinks, 100 percent juice, and sports drinks during school hours and no full-calorie CSDs or full-calorie juice drinks with 5 percent or less juice until after school hours; and (3) high schools would provide a variety of beverage choices including bottled water, 100 percent juice, sports drinks, and juice drinks, with no more than 50 percent of the vending selections dedicated to CSDs (ABA, 2005b). The guidelines are supported by 20 companies comprising 85 percent of the U.S. school vending beverage sales by bottlers. Because the implementation of the policy is voluntary, determination of its effectiveness will depend on monitoring.
Media and Entertainment Industries
The media and entertainment industries have a powerful impact and important potential to change the social norms around food choices and physical activity behaviors. The news and entertainment media can potentially reach children, teens, and their parents through print, broadcast (television and radio), cable, music, and Internet-based programming that incorporates healthy dietary messages, images, and placements. Through news reporting, the media also has potential to strengthen their capacity to serve as interpretive and monitoring authorities with respect to the meaning of emerging findings in nutrition, the truthfulness of various nutrition claims, and the implications of developments for the nutrition and physical activity status of children and youth. Although various consumer groups have suggested certain criteria for media and entertainment practices related to food and nutrition, including the use of cartoon spokescharacter licensing and celebrity endorsements, the entertainment industry has not yet developed specific guidelines for their licensing companies. Similarly, the interactive video game industry as yet lacks standards that might guide food and beverage encouragement in the games used by children and teens (Walsh et al., 2004).
Several steps are under consideration by certain companies reaching large numbers of children. Nickelodeon, for example, supports balanced programming, which means that advertisements for food products should depict food and beverages within a healthful lifestyle. In 2005, Nickelodeon has reportedly implemented a companywide policy to discontinue advertisements that do not meet these standards (Smalls, 2005a). Nickelodeon is
also changing the way their characters and brands can be used, limiting promotions that contradict messages that do not promote healthful lifestyles, and eliminating the use of food in promotional activities including prizes in game shows and sweepstakes (Smalls, 2005a).
Health and Wellness Advisory Groups
A number of food and beverage companies, including Kraft Foods, PepsiCo, and McDonald’s Corporation, have established advisory groups as a step to respond to a variety of marketing concerns. These advisory groups are intended to help the companies to develop strategies to promote more healthful food and beverage product options to consumers that are also economically viable. Examples include PepsiCo’s Blue Ribbon Advisory Board (PepsiCo, 2004b), McDonald’s Corporation’s Global Advisory Council on Balanced Lifestyles (McDonald’s Corporation, 2005b), and Kraft Foods’ Worldwide Health & Wellness Advisory Council (Kraft Foods, 2005e). Members are intended to offer expertise in health and wellness disciplines that include nutrition, obesity, physical activity, public health, human behavior, and the impact of media on child development, and they are to assist the companies in developing policies, standards, and measures for implementing specific health-related initiatives. The long-term impact of these advisory groups is undetermined.
Public–Private Partnerships
Developing and sustaining partnerships that foster community-based health and wellness programs is an important component of promoting marketing of more healthful products to children and youth. A number of food, beverage, and restaurant companies have developed partnerships with sports, educational institutions, or scientific institutions to promote and encourage children and youth to lead more active lifestyles (Collier Shannon Scott and Georgetown Economic Services, 2005c). There are multiple examples. PepsiCo has developed a partnership with the University of North Carolina to promote a $4 million campaign called Get Kids in Action to reduce and prevent childhood obesity; a partnership with America on the Move called Balance First to disseminate lesson plans that teach the concept of energy balance in elementary and middle schools, with the goal of reaching 2.5 million U.S. students; and a partnership with the School Nutrition Association to develop wellness solutions in schools. General Mills has developed a partnership with the President’s Council on Physical Fitness and the American Dietetic Association to promote The Champions Program. Kraft Foods has a partnership with the Latino Children’s Institute to promote Salsa Sabor y Salud. The Coca-Cola Company has developed
Live It!, a health and fitness school partnership initiative advertised as helping sixth graders build healthier lifestyles (The Coca-Cola Company, 2005b). The impact and reach of these programs is undetermined.
Industry Coalitions
Many in the food and beverage industry are actively involved in various coalitions to promote healthier choices and lifestyles for U.S. children, youth, and their parents, and they have widely differing perspectives and strategies. The American Council for Fitness and Nutrition (ACFN) is a nonprofit coalition formed by more than 90 food and beverage companies, trade associations, and professional health and nutrition societies, including the American Dietetic Association and the American Association of Diabetes Educators, with the goal of promoting comprehensive and achievable solutions to the growing obesity rates in the United States (ACFN, 2004). ACFN members work in support of the CARU guidelines and initiatives that emphasize motivation rather than economic and regulatory incentives in child nutrition (ACFN, 2004).
The Advertising Council, a nonprofit member of the ANA, formed the Coalition for Healthy Children in 2005, also including the food, beverage, restaurant, and advertising industries. This coalition works to engage members to address childhood obesity by harnessing key messages into their internal communications programs as well as their advertising, packaging, websites, community-based programs, and marketing events with consistent key messages (Ad Council, 2005).
The Alliance for American Advertising (AAA) consists of a variety of food and beverage companies, and advertising and media associations, that works to discourage government regulation of advertising, and supports its members’ ability to advertise to all people, including children (ANA, 2004). Members of the coalition include the American Advertising Federation, American Association of Advertising Agencies, ANA, General Mills, Kellogg Company, Kraft Foods, PepsiCo, GMA, and the Snack Food Association (Office of the Clerk, U.S. House of Representatives, 2004). The ANA describes the coalition members as supporting CARU’s self-regulatory approach to advertising, public education approaches for addressing the causes of obesity, and supporting effective ways to reverse the obesity trend (ANA, 2004).
SUMMARY
Food and beverage products are among the products most heavily marketed to children and youth in the United States. The increased purchasing power, and influence of young people has drawn more and more
industry attention, creativity, and resources to the production and marketing of food and beverages for children and youth. Product branding has become a normalized part of the lives and culture of American children and youth, and the majority of food and beverage marketing practices promote branded products instead of unbranded food groups. Marketers use a range of strategies to build brand awareness and brand loyalty early in life that is intended to be sustained into adulthood.
The growth rate in recent years in new product introductions for both food and beverage products targeted to children and adolescents, is greater than the growth rate for food and beverage products targeted to the general market. The majority of these new food and beverage products were branded products that are high in total calories, sugar, salt, fat, and low in nutrients.
Television remains the primary promotional medium for measured media marketing of food and beverage marketing to children and youth, but a shift is occurring toward other sales promotion such as product placement, character licensing, the Internet, advergames, in-school marketing, and special events marketing. Viral marketing and product placement that traverse many types of media are newer marketing strategies being used more commonly to reach consumers. Commercial and noncommercial content are becoming more indistinguishable, sophisticated, and blended, presenting a special challenge, given the limited capacity of younger children to process these messages cognitively. Guidelines developed by the National Advertising Review Council and administered by the Children’s Advertising Review Unit have contributed to the enforcement of industrywide standards for traditional advertising. However, these standards have not kept pace with the expanded forms of marketing communication.
The heightened public interest in health and wellness and increased concern about obesity presents certain marketing risks—such as increased costs associated with developing, reformulating, packaging, test marketing, and promoting food and beverage products, as well as uncertainty related to creating and sustaining consumer demand for these new products—as well as potentially profitable yet unexplored marketing opportunities. Food and beverage manufacturers can compete for and expand their market share for healthier food and beverage product categories, be role models for the industry by substantially shifting overall product portfolios toward healthier products, and serve as socially responsible corporate stakeholders in the response to childhood obesity. In making positive changes that expand consumers’ selection of healthier foods and beverages, despite the challenges of market forces and the marketplace, companies may avoid the risk of either government regulation or litigation.
Leading food, beverage, and restaurant companies have taken certain,
limited constructive steps to develop more balanced and health promoting-strategies, such as reformulating or developing new products, changing product packaging to reduce portion sizes, establishing health and wellness councils, developing public–private partnerships to promote energy balance education in schools, and supporting community-based health and wellness initiatives. Still, the food and beverage industry, restaurants, entertainment and media companies, the food retail sector, and trade associations remain far short of their full potential to do much more to develop and consistently promote healthful food, beverage, and meal options to children and youth.
REFERENCES
ABA (American Beverage Association). 2004. It’s a “Bevolution”: National Soft Drink Association Changes Name to American Beverage Association to Reflect Wide Range of Beverages Industry Produces. [Online]. Available: http://www.ameribev.org/pressroom/111104namechange.asp [accessed June 12, 2005].
ABA. 2005a. What is ABA? [Online]. Available: http://www.ameribev.org/about/ [accessed June 12, 2005].
ABA. 2005b. Beverage industry announces new school vending policy: Plan calls for lower-calorie and/or nutritious beverages in schools and new limits on soft drinks. News Release. August 16. [Online]. Available: http://www.ameribev.org/pressroom/2005_vending.asp [accessed September 20, 2005].
ACFN (American Council for Fitness and Nutrition). 2004. Tipping the Scales on Obesity: Meeting the Challenges of Today for a Healthier Tomorrow. [Online]. Available: http://www.acfn.org/resources/TTS.pdf [accessed July 12, 2005].
ACNielsen. 2004. Consumer Insight. Eighth Annual ACNielsen Consumer and Market Trends Report. Schaumburg, IL: ACNielsen.
Ad Council. 2005. Ad Council announces collaboration to combat childhood obesity “coalition for healthy children.” News Release. July 13. [Online]. Available: http://www.adcouncil.org/about/news_071305/ [accessed September 20, 2005].
Adler R, Friedlander B, Lesser G, Meringoff L, Robertson T, Rossiter J, Ward S. 1977. Research on the Effects of Television Advertising to Children: A Review of the Literature and Recommendations for Future Research. Washington, DC: U.S. Government Printing Office.
Alexander A, Benjamin L, Hoerrner K, Roe D. 1998. We’ll be back in a moment: A content analysis of advertisements in children’s television in the 1950s. Journal of Advertising 27(3):1–9.
Allen JC. 2001. The economic structure of the commercial electronic children’s media industries. In: Singer D, Singer J, eds. Handbook of Children and the Media. Thousand Oaks, CA: Sage Publications.
AMA (American Marketing Association). 2005a. Marketing Definitions. [Online]. Available: http://www.marketingpower.com/content4620.php [accessed May 23, 2005].
AMA. 2005b. Ethical Norms and Values for Marketers. [Online]. Available: http://www.marketingpower.com/content435.php [accessed July 10, 2005].
ANA (Association of National Advertisers). 2004. ANA Compendium of Legislative, Regulatory and Legal Issues. [Online]. Available: http://www.ana.net/govt/2004_compendium.pdf [accessed June 29, 2005].
Apple & Eve. 2005. Just for Kids. [Online]. Available: http://www.appleandeve.com.kids.asp [accessed June 20, 2005].
Atkinson C. 2005. Channel One hits bump, losing ads and top exec. Advertising Age 76(11): 3–38.
Austin SB, Rich M. 2001. Consumerism: its impact on the health of adolescents. Adolesc Med 12(3):389–409.
Auty S, Lewis C. 2004. Exploring children’s choice: The reminder effect of product placement. Psychol Marketing 21(9):697–714.
Avery R, Ferraro R. 2000. Verisimilitude or advertising? Brand appearances on prime-time television. J Consum Affairs 34(2):217–244.
Babin LA, Carder ST. 1996. Viewers’ recognition of brands placed within a film. Int J Ad 15(2):140–151.
Balasubramanian SK. 1994. Beyond advertising and publicity: Hybrid messages and public policy issues. J Advertising 23(4):29–46.
Barbieri McGrath B. 1997. The M&M’s Brand Chocolate Candies Counting Board Book. Watertown, MA: Charlesbridge Publishing.
Barbieri McGrath B. 2000. Kellogg’s Froot Loops! Counting Fun Book. New York: Harper-festival.
Barcus FE. 1977. Children’s Television: An Analysis of Programming and Advertising. New York: Praeger.
Barcus F. 1981. The nature of television advertising to children. In: Palmer E, Dorr D, eds. Children and the Faces of Television. New York: Academic Press. Pp. 273–285.
Barr R, Hayne H. 1999. Developmental changes in imitation from television during infancy. Child Dev 70(5):1067–1081.
Barrionuevo A. 2005. McDonald’s to add facts on nutrition to packaging. NY Times. October 25.
Baskin-Robbins. 2005. Baskin-31-Robbins®Birthday Club. [Online]. Available: http://www.baskinrobbins.com/BDayClub/ [accessed June 7, 2005].
Beverage Digest. 2004. Special Issue: Top-10 U.S. Carbonated Soft Drink Companies and Brands for 2003. [Online]. Available: http://www.beverage-digest.com/pdf/top-10_2004.pdf [accessed June 10, 2005].
Boone LE, Kurtz DL. 1998. Contemporary Marketing Wired. 9th ed. Orlando, FL: The Dryden Press.
BrandWeek. 2005. A Special Report: Superbrands. Plus: America’s Top 2000 Brands. [Online]. Available: http://www.brandweek.com [accessed August 8, 2005].
Broadcasting and Cable. 2004. Breaking … ABC family, Nick fined by FCC. Broadcasting & Cable October 25. P. 394.
Brown K, Endicott RC, Macdonald S, Schumann M, Macarthur G, Sierra J, Matheny L, Green A, Ryan M. 2004. 100 leading national advertisers. Advertising Age June 28. Pp. 1–83.
Brown K, Endicott RC, Macdonald S, Schumann M, Macarthur G, Sierra J, Matheny L, Green A, Ryan M. 2005. 50th annual 100 leading national advertisers. Advertising Age June 27. Pp. 1–84. [Online]. Available: http://www.adage.com/images/random/lna2005.pdf [accessed September 16, 2005].
Brownell KD, Horgen KB. 2004. Food Fight: The Inside Story of the Food Industry, America’s Obesity Crisis, and What We Can Do About It. New York: The McGraw-Hill Companies.
Business Insights. 2005a. The Top 10 Global Leaders in Food. Brochure. [Online]. Available: http://www.globalbusinessinsights.com/etwodir/mailings/rc412/rc412pdfs/rc412j-brochure.pdf [accessed June 3, 2005].
Business Insights. 2005b. New Profit Opportunities in Health and Nutrition to 2009. [Online]. Available: http://www.globalbusinessinsights.com/etwodir/mailings/rc445/rc445pdfs/rc445e-brochure.PDF [accessed August 29, 2005].
Business Wire. 2005. Mars, Incorporated Announces New Nutrition-Focused Business. June 30.
Buzz Marketing Group. 2004. Blue Fusion Releases National Youth Survey on the Brand Loyalty of Teens. Press Release. [Online]. Available: http://buzzmg.com/pressrelease/040217.pdf [accessed July 12, 2005].
Byrd-Bredbenner C. 2002. Saturday morning children’s television advertising: A longitudinal content analysis. Fam Consum Sci Res J 30(3):382–403.
Byrnes N. 2000. Babes in virtual toyland. Business Week 3672:62–64.
Calvert SL. 2003. Future faces of selling to children. In: Palmer EL, Young BM, eds. The Faces of Televisual Media . Mahwah, NJ: Lawrence Erlbaum Associates. Pp. 347–357.
Calvert SL, Rideout VJ, Woolard JL, Barr RF, Strouse GA. 2005. Age, ethnicity, and socioeconomic patterns in early computer use. A national survey. Am Behav Scientist 48(5): 590–607.
Cannondale Associates. 2005. Cannondale Study Identifies Trade Promotion Best Practices. Press Release. November 25. [Online]. Available: http://www.cannondaleassoc.com/upload/61525-39.doc [accessed July 28, 2005].
CARU (Children’s Advertising Review Unit). 2003a. Self-Regulatory Guidelines for Children’s Advertising. 7th ed. New York: Council of the Better Business Bureaus.
CARU (Children’s Advertising Review Unit). 2003b. About the Children’s Advertising Review Unit (CARU). [Online]. Available: http://www.caru.org/ [accessed November 10, 2005].
Cascadian Farm. 2003. Cascadian Farm®Products. [Online]. Available: http://www.cascadianfarm.com/cfarm/products/product_detail.asp?category=8 [accessed June 20, 2005].
Chaplin H. 1999. Food fight. Am Demographics 21(6):64–65.
Cheskin. 2001. The Wireless Future: A Look at Youth Unplugged. [Online]. Available: http://www.cheskin.com/docs/Sites/1/wirelessexecsumm.pdf [accessed September 11, 2005].
Children Now. 2005. Interactive Advertising and Children: Issues and Implications. [Online]. Available: http://www.childrennow.org/assets/pdf/issues_media_dtv_brief1.pdf [accessed October 11, 2005].
Childs N. 2005. Selected opportunities for food retailers to address childhood obesity. Presentation at the DHHS-FTC Workshop about Perspectives on Marketing, Self-Regulation, and Childhood Obesity. July 14–15. [Online]. Available: http://www.ftc.gov/bcp/workshops/foodmarketingtokids/index.htm [accessed September 23, 2005].
Cobb-Walgren CJ. 1990. The changing commercial climate. Current Issues and Research in Advertising 13(1-2):343–368.
Collier Shannon Scott, PLLC, Georgetown Economic Services, LLC. 2004. Television Advertising for Food and Restaurants: Total Expenditures and Number of Commercials Seen by Children. A Report to The Grocery Manufacturers of America and The Association of National Advertisers. October 1.
Collier Shannon Scott, PLLC, Georgetown Economic Services, LLC. 2005a. Report Methodology Presented to the IOM Committee on Food Marketing and the Diets of Children and Youth for Television Advertising for Food and Restaurants: Total Expenditures and Number of Commercials Seen by Children. April 11.
Collier Shannon Scott, PLLC, Georgetown Economic Services, LLC. 2005b. Television Advertising and Internet Viewing of Food and Restaurant Messages: Total TV Ad Expenditures, Total Screen Time, TV Commercials and Web Pages Seen by Children. May 13.
Collier Shannon Scott, PLLC, Georgetown Economic Services, LLC. 2005c. Issues in Advertising and Promotion of Food and Health—IOM Panelists’ Response to IOM Questions. May 12.
Comstock G, Scharrer E. 1999. Television: What’s On, Who’s Watching, and What It Means. San Diego, CA: Academic Press.
ConAgra Foods. 2004. Kid Cuisine Product Fact Sheet. [Online]. Available: http://www.conagrafoods.com/brands/kid_cuisine.jsp [accessed May 8, 2005].
Condry J, Bence P, Scheibe C. 1988. Nonprogram content of children’s television. J Broadcasting Electronic Media 32(3):255–270.
Condry J, Scheibe C. 1989. Nonprogram content of television: Mechanisms of persuasion. In: Condry J, ed. The Psychology of Television. Hillsdale, NJ: Lawrence Erlbaum Associates. Pp. 173–231.
Consumers Union. 1990. Selling America’s Kids: Commercial Pressures on Kids of the 90s. [Online]. Available: http://www.consumersunion.org/other/sellingkids/ [accessed September 19, 2005].
Consumers Union. 1995. Captive Kids: Commercial Pressures on Kids at School. Yonkers, NY: Consumers Union Education Series. P. 29.
Coon K, Tucker K. 2002. Television and children’s consumption patterns: A review of the literature. Minerva Pediatrician 54(5):423–436.
Cotugna N. 1988. TV ads on Saturday morning children’s programming—What’s new? J Nutr Ed 20(3):125–127.
CSPI (Center for Science in the Public Interest). 2003. Pestering Parents: How Food Companies Market Obesity to Children. Washington, DC: CSPI. [Online]. Available: http://www.cspinet.org/new/200311101.html [accessed September 19, 2005].
CSPI. 2005. Kraft advertising-to-kids policy applauded. News Release. January 12. [Online]. Available: http://cspinet.com/new/200501125.html [accessed September 22, 2005].
Dannon. 2005. Our Products. [Online]. Available: http://www.dannon.com/dn/dnstore/cgibin/ProdSubEV_Cat_240859_NavRoot_200.htm [accessed June 5, 2005].
DataMonitor. 2004. Company Overviews. [Online]. Available: http://www.DataMonitor.com [accessed July 19, 2005].
DataMonitor. 2005. Company Overviews. [Online]. Available: http://www.DataMonitor.com [accessed October 27, 2005].
Deutche Bank Securities. 2004. Why TV Advertising Doesn’t Work for Mature Brands. May 18. Pp. 1–18.
Di Bona J, Chaudhuri R, Jean-Baptiste J, Menachem P, Wurzburg M. 2003. Commercialism in North Carolina high schools: A survey of principals’ perceptions. Peabody Journal of Education 78(2):41–62.
Doss VS, Marlowe J, Godwin DD. 1995. Middle-school children’s sources and uses of money. J Consum Affairs 29(1):219–241.
Downey K. 2002. Clutter Rises Even in Weak Ad Economy. April 5. [Online]. Available: http://www.medialifemagazine.com/news2002/apr02/apr01/5_fri/news2friday.html [accessed July 11, 2005].
Earth’s Best. 2005. Let’s Make a Great Start to a Lifetime of Good Health. [Online]. Available: http://www.earthsbest.com/sesame_street/ [accessed June 20, 2005].
Eisenberg D, McDowell J, Berestein L, Tsiantar D, Finan E. 2002. It’s an ad, ad, ad, ad world. Time 160(10):38–41.
Ellison S. 2005. Divided, companies fight for right to plug kids’ food. The Wall Street Journal January 26. P. B-1.
Endicott RC, Brown K, MacDonald S, Schumann M, Ryan M, Sierra J, Wentz L. 2005. Hispanic Pact Pack. Advertising Age (Supplement) July 18. Pp. 1–51. [Online]. Available: http://www.adage.com/images/random/hispfactpack05.pdf [accessed September 16, 2005].
Enrico D. 1999. Top 10 advertising icons. The Advertising Century: Special Issue. Advertising Age vol 43. [Online]. Available: http://www.adage.com/century/century.html [accessed April 11, 2005].
Entertainment Software Association. 2005. Computer and Video Game Software Sales Reach Record $7.3 Billion in 2004. [Online]. Available: http://www.theesa.com/archives/2005/02/computer_and_vi.php [accessed March 10, 2005].
ERS/USDA (Economic Research Service/United States Department of Agriculture). 2004. Food CPI, Prices, and Expenditures. Food and Alcoholic Beverages: Total Expenditures. [Online]. Available: http://www.ers.usda.gov/Briefing/CPIFoodAndExpenditures/Data/table1.htm [accessed June 17, 2005].
ERS/USDA. 2005a. Food CPI, Prices, and Expenditures. [Online]. Available: http://www.ers.usda.gov/Briefing/CPIFoodAndExpenditures/ [accessed October 27, 2005].
ERS/USDA. 2005b. Food expenditures. In: Agricultural Outlook: Statistical Indicators. [Online]. Available: http://www.ers.usda.gov/Publications/Agoutlook/AOTables/ [accessed July 7, 2005].
Fattah H, Paul P. 2002. Gaming gets serious. Am Demographics. 24(5):38–44.
FitchRatings. 2004. Can Coca-Cola Products Be Replaced? The Future of the Beverage Industry and the Effect of Consumer Dietary Trends. November 16.
FMI (Food Marketing Institute). 2003. Shopping for Health: Whole Health for the Whole Family. Washington, DC: FMI and Prevention Magazine.
FMI. 2004. Supermarket Facts: Industry Overview 2004. [Online]. Available: http://www.fmi.org/facts_figs/superfact.htm [accessed May 3, 2005].
Fonda D, Roston E. 2004. Pitching it to kids. Time 163(26):52–54.
Food Engineering. 2004. The World’s Top 100 Food and Beverage Companies. [Online]. Available: http://www.foodengineeringmag.com/FILES/HTML/PDF/Top100chart.pdf [accessed July 12, 2005].
FPA (Food Products Association). 2005. [Online]. Available: http://www.fpa-food.org/ [accessed November 19, 2005].
Freeman L. 1998. Selling kids (building brand loyalty among children). Food and Beverage Marketing 17(6).
Freitas S. 1998. Reflecting America’s Changing Face. Advertising Age 69(29):A6.
Friedman W. 2001. Nestle goes gaming. Advertising Age 72(43):50.
Friedmann L. 2005. Marketing Strategies That Foster Healthy Food and Beverage Choices in Children and Youth. Presentation at a Workshop for the Committee on Food Marketing and the Diets of Children and Youth. Washington, DC, January 27.
Friend B, Stapylton-Smith M. 1999, April. Through the Eyes of Children. Presentation at the ESOMAR Marketing in Latin America Conference. Santiago, Chile.
Gallo AE. 1999. Food advertising in the United States. In: Frazao E, ed. America’s Eating Habits: Changes & Consequences. Washington, DC: U.S. Department of Agriculture.
Gamble M, Cotugna N. 1999. A quarter century of TV food advertising targeted at children. Am J Health Behav 23:261–267.
GAO (U.S. General Accounting Office). 2000. Commercial Activities in Schools. GAO/HEHS-00-156. Washington, DC: GAO. [Online]. Available: http://www.gao.gov/archive/2000/he00156.pdf [accessed May 3, 2005].
Gardner E. 2000. Understanding the net’s toughest customer. Internet World 6(3):66–72.
Gatorade. 2004. The Gatorade Story. [Online]. Available: www.gatorade.com [accessed November 10, 2005].
General Mills. 2005a. Brands: Yoplait and Columbo. [Online]. Available: http://www.generalmills.com/corporate/brands/product.aspx?catID=55# [accessed June 5, 2005].
General Mills. 2005b. New Go-GURT Smoothie Introduced By Yoplait. [Online]. Available: http://www.generalmills.com/corporate/health_wellness/in_the_news_detail.aspx?itemID=8156&catID=7586§ion=news [accessed June 12, 2005].
General Mills. 2005c. Cascadian Farm Unveils Guide to the Guidelines to Educate Parents About Kid Nutrition. Clifford the Big Red Dog Goes to Washington D.C. to Bring Fun to the Breakfast Table. [Online]. Available: http://www.generalmills.com/corporate/health_wellness/in_the_news_detail.aspx?itemID=9695&catID=7586§ion=news [accessed June 20, 2005].
Gladwell M. 2000. The Tipping Point: How Little Things Can Make a Big Difference. Boston, MA: Back Bay Books.
GMA (Grocery Manufacturers of America). 2002. New survey shows national brand loyalty high among american consumers. News Release. [Online]. Available: http://www.gmabrands.com/news/docs/NewsRelease.cfm?DocID=971& [accessed July 12, 2005].
GMA. 2004. GMA Members: Part of the Solution. October 2004.
GMA. 2005a. Grocery Manufacturers Association. [Online]. Available: http://www.gmabrands.com/ [accessed July 22, 2005].
GMA. 2005b. GMA Board Statement and Guiding Principles for the Food and Beverage Industry on Diet, Physical Activity and Health. Washington, DC: GMA.
GMA. 2005c. Industry Position Statement on School Wellness Policy. Washington, DC: GMA.
GMA. 2005d. GMA statement regarding proposals to strengthen advertising self-regulation. News Release. July 15. [Online]. Available: http://www.gmabrands.com/news/docs/NewsRelease.cfm?DocID=1542& [accessed July 22, 2005].
GMA Forum. 2005. Cannondale Trade Promotion Study 2005. Saying No to the Status Quo. Second Quarter. Pp. 72–84.
Graetzer K. 2005. Comments of the MilkPEP Board Concerning Advertising and Marketing Strategies Effective in Fostering Healthy Food Choices in Children and Youth. IOM Committee on Food Marketing and the Diets of Children and Youth. June 2.
Greenberg BS, Brand JE. 1993. Television news and advertising in schools: The “Channel One” controversy. J Commun 43(1):143–151.
Grier SA. 2005. The Past, Present, and Future of Marketing of Foods to Children. Presentation at the DHHS-FTC Workshop about Perspectives on Marketing, Self-Regulation, and Childhood Obesity. July 14–15. [Online]. Available: http://www.ftc.gov/bcp/workshops/foodmarketingtokids/index.htm [accessed July 27, 2005].
Grier SA, Brumbaugh AM. 2004. Consumer distinctiveness and advertising persuasion. In: Williams JD, Lee W-N, Haugtvedt CP, eds. Diversity in Advertising. Hillsdale, NJ: Lawrence Erlbaum Associates, Inc.
Guest LP. 1955. Brand loyalty—twelve years later. J Appl Psychol 39:405–408.
Gupta P, Gould S. 1997. Consumers’ perceptions of the ethics and acceptability of product placement in movies: Product category and individual differences. J Current Issues and Res Ad 19(1):37–50.
Guthrie JF, Lin BH, Reed J, Stewart H. 2005. Understanding economic and behavioral influences on fruit and vegetable choices. Amber Waves 3(2):36–41. [Online]. Available: http://www.ers.usda.gov/AmberWaves/April05/pdf/april05_feature_fruitsandvegetables.pdf [accessed April 14, 2005].
Harris JM. 2002. Food manufacturing. In: Harris J, Kaufman P, Martinez S, Price C. 2002. The U.S. Food Marketing System, 2002. Agricultural Economic Report No. (AER811). Washington, DC: Economic Research Service, U.S. Department of Agriculture. Pp. 3–11. [Online]. Available: http://www.ers.usda.gov/publications/aer811/aer811.pdf [accessed May 2, 2005].
Harris JM. 2005. Companies continue to offer new foods targeted to children. Amber Waves 3(3):4. [Online]. Available: http://www.ers.usda.gov/AmberWaves/June05/pdf/FindingsDHJune05.pdf [accessed June 6, 2005].
Harrison K, Marske AL. 2005. Nutritional content of foods advertised during the television programs children watch most. Am J Public Health 95(9):1568–1574.
Hastings Museum of Natural and Cultural History. 2004. Hey Kool-Aid®! [Online]. Available: http://www.hastingsmuseum.org/koolaid/history.htm [accessed June 11, 2005].
Henderson VR, Kelly B. 2005. Food advertising in the age of obesity: Content analysis of food advertising on general market and African American television. J Nutr Educ Behav 37:191–196.
Henry A. 2003. How buzz marketing works for teens. Advertising & Marketing to Children. World Advertising Research Center. Pp. 3–10.
Hind A. 2003. Brands for the under-3s: Teletubbies, a case study. Advertising & Marketing to Children. World Advertising Research Center. Pp. 25–33.
Holt DB. 2004. How Brands Become Icons: The Principles of Cultural Branding. Boston, MA: Harvard Business School Press.
Hostess. 2005. Planet Twinkie. [Online]. Available: http://www.twinkies.com/index.asp [accessed May 8, 2005].
Hunter BT. 2002. Marketing foods to kids: Using new avenues. Consumers’ Research Pp. 23–25.
Information Resources. 2005. Time and Trends: A Snapshot of Trends Shaping the CPG Industry. [Online]. Available: http://www.gmabrands.com/publications/gmairi/2005/may/may.pdf [accessed June 20, 2005].
IN ZONE Brands. 2004. Tummy Tickler Products. [Online]. Available: http://www.tummytickler.com/products.htm [accessed June 20, 2005].
IOM (Institute of Medicine). 2005. Preventing Childhood Obesity: Health in the Balance. Washington, DC: The National Academies Press.
Ippolito PM. 2005. TV Advertising to Children 1977 v. 2004. Presentation at the DHHS-FTC Workshop about Perspectives on Marketing, Self-Regulation, and Childhood Obesity. July 14–15. [Online]. Available: http://www.ftc.gov/bcp/workshops/foodmarketingtokids/index.htm [accessed July 27, 2005].
Jekanowski MD. 1999. Causes and consequences of fast food sales growth. Food Review. 22(1):11–16.
Joyce K. 2004. MMA in the News. PROMO Magazine. [Online]. Available: http://mmaglobal.com/modules/news/print.php?storyid=26 [accessed July 26, 2005].
JP Morgan. 2003. Food Manufacturing. Obesity: The Big Issue. European Equity Research. April 16.
Kaikati AM, Kaikati JG. 2004. Stealth marketing: How to reach consumers surreptitiously. University of California, Berkeley: California Management Review 46(4):6–22.
Karrh JA. 1994. Effects of brand placements in motion pictures. In: King AW, ed. Proceedings of the 1994 American Academy of Advertising. Athens, GA: American Academy of Advertising.
Kaufman PR. 2002. Food retailing. In: Harris J, Kaufman P, Martinez S, Price C. The U.S. Food Marketing System. Agricultural Economic Report No. (AER811). Washington, DC: Economic Research Service, U.S. Department of Agriculture. [Online]. Available: http://www.ers.usda.gov/publications/aer811/aer811.pdf [accessed May 2, 2005].
Kelley B, Graham L, Quinn T, Sears B. 2004. Changes in the Confectionery Industry. 2004 All Candy Expo®. [Online]. Available: http://www.allcandyexpo.com/industry_forum.cfm [accessed June 16, 2005].
KFF (Kaiser Family Foundation). 2004. Tweens, Teens and Magazines Fact Sheet. [Online]. Available: http://www.kff.org/entmedia/loader.cfm?url=/commonspot/security/getfile.cfm&PageID=47098 [accessed May 3, 2005].
Kotler P, Armstrong G. 2004. Principles of Marketing. 10th Edition. Upper Saddle River, NJ: Pearson Education/Prentice Hall.
Kotz K, Story M. 1994. Food advertisements during children’s Saturday morning television programming: Are they consistent with dietary recommendations? J Am Diet Assoc 94(11):1296–1300.
Kraft Foods. 2004. Form 10-K Annual Report for the Fiscal Year Ended December 31, 2004. [Online]. Available: http://kraft.com/pdfs/KraftAR04_10K.pdf [accessed June 6, 2005].
Kraft Foods. 2005a. Our Products: Lunchables®. [Online]. Available: http://www.kraftfoods.com/om/bn/c_Products/Lunchables.htm [accessed June 3, 2005].
Kraft Foods. 2005b. Kool-Aid Man. [Online]. Available: http://www.kraft.com/100/innovations/koolaidman.html [accessed June 11, 2005].
Kraft Foods. 2005c. Kraft Foods announces marketing changes to emphasize more nutritious products. [Online]. News Release. January 12. Available: http://www.kraft.com/newsroom/01122005.html [accessed September 21, 2005].
Kraft Foods. 2005d. Kraft Foods announces healthy lifestyle initiatives at California summit on health, nutrition and obesity. News Release. January 12. [Online]. Available: http://www.kraft.com/newsroom/09152005.html [accessed September 22, 2005].
Kraft Foods. 2005e. Obesity Initiatives. [Online]. Available: http://www.kraft.com/obesity/advisory.html [accessed November 15, 2005].
Kunkel D. 2001. Children and television advertising. In: Singer D, Singer J, eds. Handbook of Children and the Media. Thousand Oaks, CA: Sage.
Kunkel D, Gantz W. 1992. Children’s television advertising in the multi-channel environment. J Commun 42(3):134–152.
Kunkel D, Gantz W. 1993. Assessing compliance with industry self-regulation of television advertising to children. J Applied Communication 21(2):148–162.
Kunkel D, McIlrath M. 2003. Message content in advertising to children. In: Palmer E, Young B, eds. Faces of Televisual Media: Teaching, Violence, Selling to Children. Mahwah, NJ: Erlbaum Associates. Pp. 287–300.
Kuribayashi A, Roberts MC, Johnson RJ. 2001. Actual nutritional information of products advertised to children and adults on Saturday. Children’s Health Care 30(4):309–322.
Lauro PW. 2002. Swanson focuses on its new, fashionable TV dinner. The New York Times October 30. [Online]. Available: http://inventors.about.com/od/inventionsalphabet/a/tv_dinner.htm [accessed May 8, 2005].
Lawrence D. 2003. The role of characters in kids marketing. Advertising & Marketing to Children. World Advertising Research Center. 4(3):43–48.
Lenhart A, Rainie L, Lewis O. 2001. Teenage Life Online: The Rise of the Instant-Messaging Generation and the Internet’s Impact on Friendships and Family Relationships. Pew Internet & American Life Project. [Online]. Available: http://www.pewinternet.org/pdfs/PIP_Teens_Report.pdf [accessed July 9, 2005].
Lewis LB, Sloane DC, Nascimento LM, Diamant AL, Guinyard JJ, Yancey AK, Flynn G. 2005. African Americans’ access to healthy food options in South Los Angeles restaurants. Am J Public Health 95(4):668–673.
Linn S. 2004. Food marketing to children in the context of a marketing maelstrom. J Public Health Policy 25(3/4):24–35.
Lippman J, McKay B. 2001. Warner Bros. choose Coke to bestow marketing magic on Harry Potter film. Wall Street Journal. P. A3.
Lukas C. 2000. The Oreo Cookie Counting Book. New York: Little Simon.
Mack A. 2004. Gaming scores with advertisers. Media Week 14(26):18–20.
Marketing Intelligence Service. 2005. ProductScan®Online Database of New Products. [Online]. Available: http://www.productscan.com [accessed April 30, 2005].
Mattel. 2001. Barbie®Doll Puts on Another Famous Uniform to Serve Up Smiles. [Online]. Available: http://www.shareholder.com/mattel/news/20010501-43068.cfm [accessed June 5, 2005].
Mattel. 2005. Barbie®Collector. [Online]. Available: http://www.barbiecollector.com [accessed June 5, 2005].
Mazur L. 1996. Marketing madness. Environ Magazine 7(3):36–41.
McCarthy M. 2005. Disney plans to mix ads, videogames to target kids, teens. USA Today. [Online]. Available: http://usatoday.com/money/media/2005-01-17-disney-advergaming_x.htm [accessed March 15, 2005].
McDonald’s Corporation. 1996. The power of our global brand. In: 1996 Summary Annual Report. [Online]. Available at: http://www.mcdonalds.com/corp/invest/pub/annual_rpt_archives/1996_annual.html [accessed April 11, 2005].
McDonald’s Corporation. 2003. McDonald’s™ introduces new McKIDS™ multi-category, worldwide licensing program. News Release. [Online]. Available: http://www.media.mcdonalds.com/secured/news/pressreleases/2003/Press_Release11132003.html [accessed July 10, 2005].
McDonald’s Corporation. 2004. McDonald’s®Celebrates 25 Years of Happy Meals with the Return of Ty Teenie Beanie Babies®. [Online]. Available: http://www.mcdonalds.com/usa/news/2004/conpr_07222004.html [accessed July 5, 2005].
McDonald’s Corporation. 2005a. McDonald’s Press Release. [Online]. Available: http://www.mcdonalds.com/usa/news/current/conpr_05042005.html [accessed July 8, 2005].
McDonald’s Corporation. 2005b. Global Advisory Council on Balanced Lifestyles. [Online]. Available: http://www.mcdonalds.com/corp/values/socialrespons/resrecog/expert_advisors0/advisory_council_on.html [accessed July 8, 2005].
McGinn D. 2003. Pitching to kids. Boston Globe. [Online]. Available: www.boston.com/globe/magazine/2003/0416/kids.html [accessed February 20, 2005].
McKay B. 2001. Coke finds its exclusive contracts aren’t so easily given up. Wall Street Journal (Eastern Edition) June 26. Pp. B1, B4.
McNeal JU. 1964. Children as Consumers. Austin: Bureau of Business Research, University of Texas at Austin.
McNeal JU. 1998. Tapping the three kids’ markets. Am Demographics 20(4):37–41.
McNeal JU. 1999. The Kids Market: Myth and Realities. Ithaca, NY: Strategist.
Meltzoff A. 1988. Imitation of televised models by infants. Child Development 59(5): 1221–1229.
Mintel International Group Ltd. 2003. Character Merchandising in Food and Drink–UK. [Online]. Brief summary of full report. Available: http://www.the-infoshop.com/study/mt17377_food_drink.html [accessed June 6, 2005].
Molnar, A. 2003. No Student Left Unsold: The Sixth Annual Report on Trends in School-house Commercialism 2002–2003. [Online]. Available: http://www.asu.edu/educ/epsl/CERU/CERU_Annual_Report.htm [accessed November 19, 2005].
Montgomery K. 2001. Digital kids: The new online children’s consumer culture. In: Singer DG, Singer JL, eds. Handbook of Children and the Media. Thousand Oaks, CA: Sage Publications. Pp. 625–650.
Montgomery K, Pasnik S. 1996. Web of Deception. Washington, DC: Center for Media Education.
Moore ES, Wilkie WL, Lutz RJ. 2002. Passing the torch: Intergenerational influences as a source of brand equity. J Marketing 66(2):17–37.
Mortimer, R. 2002. Box office brand bonanzas. Brand Strategy 166:25.
MPA (Magazine Publishers of America). 1999. Highlights of Sales Scans. [Online]. Available: http://www.magazine.org/content/Files/Sales%5FScan%5FHighlights.pdf [accessed June 20, 2005].
MPA. 2004a. Teen Market Profile. [Online]. Available: http://www.magazine.org/content/files/teenprofile04.pdf [accessed April 24, 2005].
MPA. 2004b. African American Market Profile. [Online]. Available: http://www.magazine.org/content/files/market_profile_black.pdf [accessed June 18, 2005].
MPA. 2004c. Hispanic/Latino Market Profile. [Online]. Available: http://www.magazine.org/content/Files/MPAHispMktPro.pdf [accessed June 17, 2005].
NARC (National Advertising Review Council). 2004. Guidance for Food Advertising Self-Regulation. New York: NARC. [Online]. Available: http://www.narcpartners.org/NARC_White_Paper_6-1-04.pdf [accessed April 10, 2005].
NASSP. 2005. NASSP Guidelines for Beverage-Provider Business Agreements. [Online]. Available: http://www.principals.org [accessed October 27, 2005].
Neal WD. 2005. Principles of Market Segmentation. [Online]. Available: http://www.marketingpower.com/content1006.php# [accessed June 14, 2005].
Nebenzahl ID, Secunda E. 1993. Consumers’ attitudes toward product placement in movies. Int J Ad 12(1):1–11.
Neopets®. 2003. Youth Study 2003. [Online]. Available: http://demo.neopets.com/presskit/articles/research/ym2003.html [accessed July 7, 2005].
Neopets®. 2005. Corporate Fact Sheet. [Online]. Available: http://demo.neopets.com/presskit/compinfo.html [accessed July 3, 2005].
Nestlé. 2004. Nesquik. [Online]. Available: http://www.nestle.com/Our_Brands/Beverages/Nesquik/ [accessed June 6, 2005].
Nestle M. 2000. Soft drink “pouring rights”: Marketing empty calories. Public Health Reports 115(4):308–319.
Nestle M. 2002. Food Politics: How the Food Industry Influences Nutrition and Health. Berkeley, CA: University of California Press.
Nestle M, Wing R, Birch L, DiSogra L, Drewnowski A, Middleton S, Sigman-Grant M, Sobal J, Winston M, Economos C. 1998. Behavioral and social influences on food choice. Nutr Rev 56(5):S50–S74.
Nickelodeon. 2005. All Nick TV Shows. [Online]. Available: http://www.nick.com/all_nick/ [accessed May 28, 2005].
Nielsen Monitor-Plus. 2005. National Cable Television Advertising Spending (NAN, NICK, TOON, TDSN), Full Day. January 1, 2003–December 31, 2004.
NRA (National Restaurant Association). 2005. Restaurant Industry Fact Sheet 2005. [Online]. Available: http://www.restaurant.org/pdfs/research/2005factsheet.pdf [accessed June 15, 2005].
Office of the Clerk, U.S. House of Representatives. 2004. Alliance for American Advertising House ID Numbers. [Online]. Available: http://clerk.house.gov/pd/houseID.html?reg_id=37455 [accessed July 27, 2005].
Ordonez J. 2001. Burger King pairs with DreamWorks and Nickelodeon. Wall Street Journal. P. B2.
Palmer E, Cantor J, Kunkel D, Dowrick P, Linn S, Wilcox B. 2004. Psychological Implications of Commercialism in Schools. Washington, DC: American Psychological Association Task Force on Advertising and Children.
PBS (Public Broadcasting System) Frontline. 2001. Merchants of Cool. [Online]. Available: http://www.pbs.org/wgbh/pages/frontline/shows/cool/etc/script.html [accessed June 5, 2005].
Peleo-Lazar M. 2005. McDonald’s Presentation at the IOM Workshop on Strategies That Foster Healthy Food and Beverage Choices in Children and Youth. Committee on Food Marketing and the Diets of Children and Youth. Washington, DC, January 27.
PepsiCo. 2004a. Sustainable Advantage. Annual Report 2004. [Online]. Available: http://www.pepsico.com/investors/annual-reports/2004/247528PepsicoLR.pdf [accessed July 3, 2005].
PepsiCo. 2004b. Blue Ribbon Advisory Board. [Online]. Available: http://www.smartspot.com/commitment_to_health/420.php [accessed July 8, 2005].
Petretti A. 1992. Coca-Cola Collectibles Price Guide. 8th Edition. Hackensack, NJ: Nostalgia Publications.
Pinnacle Foods Corporation. 2003. Swanson 50th Anniversary Celebration. [Online]. Available: http://www.swansonmeals.com/50th/ [accessed May 6, 2005].
Plunkett Research Ltd. 2005. Food Industry Almanac 2005. Brief Summary. [Online]. Available: http://www.mindbranch.com/products/R207-0054.html [accessed September 21, 2005].
Pollack Associates. 2003. Special Report: 2003. Supermarkets: Brands & Private Label. New York, NY. [Online]. Available: http://www.supermarketalert.com/pdf%20docs/3BrandsPriLabel.pdf [accessed September 16, 2005].
Pollack Associates. 2004. Special Report: 2004. Private Label & Branding. New York. [Online]. Available: http://www.supermarketalert.com/pdf%20docs/04specrptsfr03/4prilabel-web.pdf [accessed September 16, 2005].
Powell K. 2005. Fostering Healthy Choices. Presentation at the IOM Workshop on Strategies that Foster Healthy Food and Beverage Choices in Children and Youth. Committee on Food Marketing and the Diets of Children and Youth. Washington, DC, January 27.
PQMedia. 2005. Product Placement Spending in Media 2005: Executive Summary. [Online]. Available: http://www.pqmedia.com/product-placement-spending-in-media.html [accessed June 10, 2005].
Preschel S. 2005. Backpacks, Lunch Boxes and Cells? … Nearly Half of U.S. Teens and Tweens Have Cell Phones, According to NOP World mKids Study. New York. [Online]. Available: http://www.nopworld.com/new.asp?go=news_item&key=151 [accessed July 26, 2005].
Pressler MW. 2005. Hold the health, serve that burger: Restaurant chains find low-fat means lean sales. Washington Post. August 18.
Prichard J. 2003. Kellogg’s popular, pioneering Pop-Tarts turn 40 this year. The Detroit News. [Online]. Available: http://www.detnews.com/2003/business/0304/06/business-128483.htm [accessed June 5, 2005].
PRIMEDIA Business Magazines & Media. 2004. DreamWorks Brings Back Partners for Sinbad DVD. [Online]. Available: http://promomagazine.com/deals/marketing_dreamworks_brings_back/ [accessed July 7, 2005].
QuickMBA. 2004. Market Segmentation. [Online]. Available: http://www.quickmba.com/marketing/market-segmentation/ [accessed June 14, 2005].
Radio Disney. 2005. Radio Disney. [Online]. Available: http://radio.disney.go.com/music/projectfamily/ [accessed July 7, 2005].
Red Herring. 2005. Brand-name companies have caught on to the interactive power of mobile phone marketing. Is it a new advertising medium, or just glorified spam? [Online]. Available: http://www.redherring.com/PrintArticle.aspx?a=12506§or=Industries [accessed July 26, 2005].
Rideout V, Hoff T. 2002. Shouting to Be Heard: Public Service Advertising in a New Media Age. Menlo Park, CA: Henry J. Kaiser Family Foundation.
Rideout VJ, Vandewater EA, Wartella EA. 2003. Zero to Six: Electronic Media in the Lives of Infants, Toddlers and Preschoolers. Menlo Park, CA: Henry J. Kaiser Family Foundation.
Rideout V, Roberts DF, Foehr UG. 2005. Executive Summary: Generation M: Media in the Lives of 8–18 Year Olds. Menlo Park, CA: Henry J. Kaiser Family Foundation.
Ritzer G. 2004. The McDonaldization of Society. Thousand Oaks, CA: Sage Publications, Inc.
Roberts D, Foehr U. 2005. Kids and Media in America. Cambridge, UK: Cambridge University Press.
Roberts D, Foehr U, Rideout V, Brodie M. 1999. Kids and Media @ the New Millennium: A Comprehensive National Analysis of Children’s Media Use. Menlo Park, CA: Kaiser Family Foundation.
Roberts DF, Foehr UG, Rideout V. 2005. Generation M: Media in the Lives of 8–18 Year Olds. Menlo Park, CA: Henry J. Kaiser Family Foundation.
Roberts K. 2004. Lovemarks: The Future Beyond Brands. New York: PowerHouse Books.
Roper Youth Report. 2003. American Youth Wielding More Household Buying Power. New York. [Online]. Available: http://www.nopworld.com/news.asp?go=news_item&key=59 [accessed April 11, 2005].
Rubin R. 2004. Kids vs. Teens: Money and Maturity Guide Online Behavior. eMarketer. [Online]. Available: http://www.emarketer.com/Report.aspx?kids_may04 [accessed November 21, 2005].
Samuels SE, Craypo L, Dorfman L, Purciel M, Standish MB. 2003. Food and Beverage Industry Marketing Practices Aimed at Children: Developing Strategies for Preventing Obesity and Diabetes. A report on the proceedings from a meeting sponsored by The California Endowment held in San Francisco in June 2003.
Scammon DL, Christopher CL. 1981. Nutrition education with children via television: A review. J Advertising 19(2):26–36.
Schlosser E. 2001. Fast Food Nation. New York: Houghton Mifflin Company.
Schor JB. 2004. Born to Buy: The Commercialized Child and the New Consumer Culture. New York: Scribner.
Short D. 2005. When science met the consumer: The role of industry. Am J Clin Nutr 82(suppl):256S–258S.
Siegel DL, Coffey TJ, Livingston G. 2001. The Great Tween Buying Machine. Ithaca, NY: Paramount Market Publishing, Inc.
Skyworks Technologies. 2004. Life Savers Candystand. [Online]. Available: http://candystand.com [accessed July 10, 2005].
Smalls M. 2005a. Moving the Needle. Presentation at the IOM Workshop on Strategies that Foster Healthy Food and Beverage Choices in Children and Youth. Committee on Food Marketing and the Diets of Children and Youth. Washington, DC, January 27.
Smalls M. 2005b. Current Media Efforts to Foster Healthier Choices for Children. Presentation at the DHHS-FTC Workshop about Perspectives on Marketing, Self-Regulation, and Childhood Obesity. July 14–15. [Online]. Available: http://www.ftc.gov/bcp/workshops/foodmarketingtokids/index.htm [accessed July 27, 2005].
Smith JW, Clurman A, Wood C. 2005. Coming to Concurrence: Addressable Attitudes and the New Model for Marketing Productivity. Evanston, IL: Racom Communications.
Snider M. 2002. Hey kids! Let’s play adver-games! Maclean’s 115(51):36–37.
Stanley T. 2004. Marketers aim for parents via TV. Advertising Age 75(40):75.
Stewart H, Blisard N, Bhuyan S, Nayga RM Jr. 2004. The Demand for Food Away from Home. Full Service or Fast Food? Agricultural Economic Report No. 829. Washington, DC: Economic Research Service, U.S. Department of Agriculture. [Online]. Available: http://www.ers.usda.gov/publications/aer829/aer829.pdf [accessed September 17, 2005].
Stipp H. 1993. New ways to reach children. Am Demographics 15(8):50–56.
Story M, French S. 2004. Food advertising and marketing directed at children and adolescents in the US. Int J Behav Nutr Phys Act 1(1):3–20. [Online]. Available: http://www.ijbnpa.org/content/1/1/3 [accessed April 11, 2005].
Strasburger VC. 2001. Children and TV advertising: Nowhere to run, nowhere to hide. J Dev Behav Pediatr 22(3):185–187.
Subervi-Velez FA, Colsant S. 1993. The television world of Latino children. In: Berry GL, Asamen JK. Children & Television: Images in a Changing Sociocultural World. Newbury Park, CA: Sage Publications.
Subramanyam K, Greenfield P, Kraut R, Gross E. 2001. The impact of computer use on children’s and adolescents’ development. J Appl Dev Psychol 22(1):7–30.
Subway. 2005. F.R.E.S.H. Steps Initiative. [Online]. Available: http://www.subway.com/subwayroot/MenuNutrition/index.aspx [accessed October 27, 2005].
Sunkist. 2005. “C” is for Citrus as Sunkist and Sesame Workshop Announce Healthy Habits for Life Partnership. [Online]. Available: http://www.sunkist.com/press/release.asp?id=72 [accessed November 18, 2005].
Survey Value. 2005. Brand Loyalty. [Online]. Available: http://www.surveyvalue.com [accessed July 12, 2005].
Swinburn BA, Caterson I, Seidell JC, James WPT. 2004. Diet, nutrition and the prevention of excess weight gain and obesity. Pub Health Nutr 7(1A):123–146.
Taaffe E. 2005. PepsiCo Health & Wellness: Capturing Growth at the Intersection. Presentation at the IOM Workshop on Strategies that Foster Healthy Food and Beverage Choices in Children and Youth. Committee on Food Marketing and the Diets of Children and Youth. Washington, DC, January 27.
Taras HL, Gage M. 1995. Advertised foods on children’s television. Arch Pediatr Adolesc Med 149(6):649–652.
Tarpley T. 2001. Children, the Internet, and other new technologies. In: Singer D, Singer J, eds. Handbook of Children and the Media. Thousand Oaks, CA: Sage.
Teenage Research Unlimited. 2004. The TRU Study. [Online]. Available: http://www.teenresearch.com/PRview.cfm?edit_id=168 [accessed May 3, 2005].
Teenage Research Unlimited. 2005. Weekly spending. TRU Study Update. [Online]. Available: http://www.teenresearch.com/view.cfm?page_id=87&txt=txt1.cfm&pic=tru1.cfm [accessed September 24, 2005].
Teinowitz I, MacArthur K. 2005. McDonald’s ads target children as young as 4. Government food marketing hearing told of elementary school programs. Advertising Age.com. January 28.
The Coca-Cola Company. 2003. Model Guidelines for School Beverage Partnerships. Atlanta, GA: Coca-Cola Company. [Online]. Available: http://www2.coca-cola.com/ourcompany/hal_school_beverage_guidelines.pdf [accessed July 7, 2005].
The Coca-Cola Company. 2005a. Brand Fact Sheets. [Online]. Available: http://www.virtualvender.coca-cola.com [accessed November 10, 2005].
The Coca-Cola Company. 2005b. Live It! Press Release. [Online]. Available: http://www2.coca-cola.com/presscenter/nr_20050526_americas_liveit.html [accessed October 19, 2005].
The Hershey Company. 2005. Company Profile. Available: http://www.thehersheycompany.com/about/profile.asp [accessed October 31, 2005].
The Intelligence Group/Youth Intelligence. 2005. Nickelodeon/Youth Intelligence Tween Report 2004. [Online]. Available: http://www.youthintelligence.com/cassandra/cassarticle.asp?cassArticleId=3 [accessed September 16, 2005].
Thomas D. 2004. Teens Driving Mobile Data Market. Operators Should Target Kids, Not Business Users, Says Research. Vnunet.com. [Online]. Available: http://www.vnunet.com/articles/print/2125293 [accessed July 26, 2005].
Thompson S. 2004. Kellogg pounces on toddlers. Advertising Age. December 6. P. 1.
Tillotson JE. 2004. America’s obesity: Conflicting public policies, industrial economic development, and unintended human consequences. Annu Rev Nutr 24:617–643.
Tirodkar MA, Jain A. 2003. Food messages on African American television shows. Am J Public Health 93(3):439–441.
Tseng ES. 2001. Content analysis of children’s television advertising today. Austin, TX: The University of Texas at Austin. Unpublished manuscript. [Online]. Available: http://www.ciadvertising.org/student_account/fall_01/adv392/estseng/ContentAnalysis/ContentAnalysis.html-72k [accessed February 22, 2005].
TTT West Coast. 2002. Cola wars: Britney vs. Christina. News Release. March 29. [Online]. Available: http://extratv.warnerbros.com/reframe.html?http://extratv.warnerbros.com/dailynews/pop/03_01/03_29a.html [accessed July 9, 2005].
TV Bureau of Advertising. 2005. [Online]. Available: http://www.tvb.org/nav/build_frameset.asp?url=/rcentral/index.asp [accessed October 27, 2005].
UBS Warburg. 2002. Absolute Risk of Obesity. Global Equity Research. November 27.
Upoc. 2002. Snapshot of the U.S. Wireless Market. [Online]. Available: http://www.genwireless.com/downloads/mobilestatssummary020802.ppt [accessed June 29, 2005].
U.S. Census Bureau. 2000. Sex by Single Years of Age (PCT12). [Online]. Available: http://www.census.gov/census2000/states/us.html [accessed August 26, 2005].
U.S. Census Bureau. 2001. National Intercensal Estimates (1990–2000). [Online]. Available: http://www.census.gov/popest/archives/EST90INTERCENSAL/US-EST90INT-04.html [accessed March 7, 2005].
U.S. Census Bureau. 2004. Annual Estimates of the Population by Sex and Selected Age Groups for the United States: April 1, 2000 to July 1, 2003. [Online]. Available at: http://www.census.gov/popest/national/asrh/NC-EST2003/NC-EST2003-02.pdf [accessed March 7, 2005].
U.S. Department of Commerce. 2002. A Nation Online: How Americans Are Expanding Their Use of the Internet. [Online]. Available: http://www.ntia.doc.gov/ntiahome/dn/html/anationonline2.htm [accessed April 9, 2005].
U.S. Department of Education. 2003. Computer and Internet Use by Children and Adolescents in 2001. NCES 2004-014. Washington, DC: National Center for Education Statistics.
U.S. Department of Labor. 2004. Consumer Expenditures in 2002. Report 974. Washington, DC: U.S. Department of Labor. [Online]. Available: http://www.bls.gov/cex/csxann02.pdf [accessed October 26, 2005].
U.S. Market for Kids’ Foods and Beverages. 2003. 5th edition. Report summary. [Online]. Available: http://www.marketresearch.com/researchindex/849192.html#pagetop [accessed May 3, 2005].
Valdés MI. 2000. Marketing to American Latinos: A Guide to the In-Culture Approach. Part 1. Ithaca, NY: Paramount Market Publishing, Inc.
Variyam JN. 2005a. The price is right. Amber Waves. February. Pp. 20–27.
Variyam JN. 2005b. Nutrition Labeling in the Food-Away-From-Home Sector. Economic Research Report No. 4. Washington, DC: Economic Research Service, U.S. Department of Agriculture. [Online]. Available: http://www.ers.usda.gov/publications/err4/err4.pdf [accessed April 30, 2005].
Verizon Wireless. 2005. Nickelodeon and Verizon Wireless launch Nick Mobile on V CAST, bringing kid TV favorites to Verizon Wireless V CAST phones. News Release. [Online]. Available: http://news.vzw.com/news/2005/05/pr2005-05-05.html [accessed July 11, 2005].
Viacom International. 2005. Welcome to Postopia! [Online]. Available: http://www.postopia.com [accessed July 9, 2005].
Wade L. 1998. The Cheerios®Play Book. New York: Little Simon.
Walley W. 2002. Taubin has Warner executives raving, “I’m Just Wild about Harry.” Advertising Age 73(12):S10.
Walsh D, Gentile D, Gieske J, Walsh M, Chasco E. 2004. Mediawise Video Game Report Card. [Online]. Available: http://www.mediafamily.org/research/2004_VGRC.pdf [accessed July 7, 2005].
Warner M. 2005. You want any fruit with that Big Mac? The New York Times. February 20.
Williams J. 2005a. Advertising of Food and Beverage Products to Children, Teen, and Adult Multicultural Markets. University of Texas at Austin Working Paper.
Williams J. 2005b. Product Proliferation Analysis for New Food and Beverage Products Targeted to Children 1994–2004. University of Texas at Austin Working Paper.
Williams JD, Tharp MC. 2001. African Americans: Ethnic roots, cultural diversity. In: Tharp MC, ed. Marketing and Consumer Identity in Multicultural America. Thousand Oaks, CA: Sage Publications. Pp. 165–211.
Williams W, Montgomery K, Pasnik S. 1997. Alcohol and Tobacco on the Web: New Threats to Youth. Washington, DC: The Center for Media Education.
Williamson. 2001. Creating a Better Brighter Smarter Internet. Interactive Week 8(39):26–29.
Wulfemeyer KT, Mueller B. 1992. Channel One and commercials in classrooms: Advertising content aimed at students. Journalism Quarterly 69(3):724–742.
Yankelovich. 2003. Youth Monitor™. Youth Today: Shaping Tomorrow. Chapel Hill, NC: Yankelovich Partners, Inc.
Yankelovich. 2005. Youth Monitor™. [Online]. Available: http://www.yankelovich.com/products/youth2005_ps.pdf [accessed May 3, 2005].
Zywicki TJ, Holt D, Ohlhausen M. 2004. Obesity and Advertising Policy. George Mason Law and Economics Research Paper No. 04-45. [Online]. Available: http://papers.ssrn.com/sol3/papers.cfm?abstract_id=604781 [accessed June 7, 2005].


