
2
Health, Diet, and Eating Patterns of Children and Youth
INTRODUCTION
Over the past four decades, lower rates of nutrient deficiencies, dental caries, infectious diseases, and injuries have all contributed to lower childhood morbidity and mortality and better health for children. In that same period, a troubling new trend has steadily and dramatically emerged, threatening to reverse many of these gains. From 1963 to 2002, rates of obesity tripled for older children ages 6–11 years and adolescents ages 12–19 years. For consistency between Institute of Medicine (IOM) reports, the term obesity is used to refer to children and youth who have a body mass index (BMI) equal to or greater than the 95th percentile of the age- and gender-specific BMI charts developed by the Centers for Disease Control and Prevention (CDC). By this definition, an estimated 9.18 million U.S. children and adolescents ages 6–19 years are considered obese. If obesity levels continue at the current rate, the lifetime risk of being diagnosed with type 2 diabetes at some point in their lives is 30 percent for boys and 40 percent for girls. Moreover, an estimated 1 million 12- to 19-year-old American adolescents have the metabolic syndrome, described later in this chapter.
Health-related behaviors such as eating habits and physical activity patterns develop early in life and often extend into adulthood. They consequently affect risk for a variety of chronic diseases including type 2 diabetes and cardiovascular disease. Parents, communities, government, the public health sector, and health care systems accordingly face the significant challenge of creating a supportive environment in which children can grow up
in a way that maximizes their chances for a healthy life. As a result of the distinct trend toward the onset of chronic disease risks much earlier in life, dietary guidance for children and youth has evolved from an historic emphasis on ensuring nutrient and energy (calorie) adequacy to meet basic metabolic needs to the more recent focus on ensuring dietary quality while avoiding calorie excesses. The current goal is to promote a lifestyle for children and youth that incorporates nutrient-dense foods and beverages into their diet, and balances their calorie consumption with levels of physical activity sufficient to create energy balance at a healthy weight.1
This chapter provides an overview of the dietary intake, eating patterns, and sources of nutrients for infants and toddlers, younger children, school-aged children, and adolescents. It examines how nutrient and food intakes compare to reference standards and guidelines, and it also addresses regional and income-related differences in food consumption and nutrient intake.
OVERVIEW OF CHILDREN’S HEALTH AND DIET
Public health and technological improvements over the past century have enhanced the survival and health of infants, school-aged children, and adolescents in the United States (NRC and IOM, 2004). Widespread access to potable water, vaccines, and antibiotics has reduced child morbidity and mortality rates attributed to infectious diseases (CDC, 1999; IOM, 2005b). Safety initiatives targeted to motor vehicles and children’s home and recreational environments have led to a 39 percent decline in unintentional injury deaths among children ages 14 and under from 1987 to 2000 (National SAFE KIDS Campaign, 2003). The introduction of various fluoride vehicles through municipal water systems and other sources has prompted a substantial decline in dental caries in children over the past two decades (DHHS, 2000b; Dye et al., 2004).
The health and nutritional well-being of millions of Americans have benefited from a number of interventions, including the fortification of the food supply with essential micronutrients such as B vitamins, iron, iodine, and folic acid (Hetzel and Clugston, 1999; Honein et al., 2001; IOM, 2003; Park et al., 2000; Pfeiffer et al., 2005). The diets of low-income families, their infants, and school-aged children have improved through the creation and expanded coverage of domestic food assistance programs to increase
food security, such as the Special Supplemental Nutrition Program for Women, Infants, and Children (WIC), the National School Meals Program, and the Food Stamp Program (IOM, 2005b,c; USDA, 2005c); and improved state health insurance coverage for children living in poor families (Cohen and Bloom, 2005; Wise, 2004). The outcomes have been linked to increased birth weights (IOM, 2005c), and a steady decline in the prevalence of micronutrient-deficiency diseases in childhood such as rickets, pellagra, goiter, iron-deficiency anemia, and neural tube defects (CDC, 1999, 2002; Honein et al., 2001).
Obesity
Although the health of children and youth has improved in many respects, they face new diet-related health problems today that were unexpected just a generation ago. The increasing prevalence over the past three decades of children who are obese, defined in this report as children and youth who have a BMI equal to or greater than the 95th percentile of the age- and gender-specific BMI charts developed by the CDC, and those who are at risk for becoming obese, defined in this report as children and youth who have a BMI between the 85th and 95th percentile of the age- and gender-specific CDC BMI charts, makes it the most common serious contemporary public health concern faced by young people in the United States (IOM, 2005b; Land, 2005). The average weight for a 10-year-old boy increased from 74.2 pounds in 1963 to nearly 85 pounds in 2002. The average weight for a 10-year-old girl went from 77.4 pounds to an estimated 88 pounds. The average 15-year-old boy weighed 135.5 pounds in 1966, and 150.3 pounds in 2002. The average weight of a 15-year-old girl rose from 124.2 pounds to 134.4 pounds during the same time frame (Ogden et al., 2004). The trends are similar for American adults. Improved nutrition has helped them grow taller over the past four decades, but it has also made them heavier. Adults are an average of 1 inch taller than they were in the 1960s but about 25 pounds heavier (Ogden et al., 2004).
Obesity has both short- and long-term consequences for children’s emotional health and physical and social functioning and well-being (IOM, 2005b; Williams et al., 2005). Obesity also produces significant burdens on the health care system. Obesity-associated annual hospital costs for children and adolescents more than tripled over two decades, rising from $35 million (1979–1981) to $127 million (1997–1999, based on 2001 dollars) (Wang and Dietz, 2002). After adjusting for inflation and converting to 2004 dollars, the national direct and indirect health care expenditures associated with adult overweight and obesity range from $98 billion to $129 billion (IOM, 2005b). If the childhood obesity epidemic continues at its current rate, conditions related to type 2 diabetes, such as blindness,
coronary artery disease, stroke, and kidney failure, may become ordinary conditions in middle age (IOM, 2005b).
Between 1999 and 2002, the prevalence of obesity was 10.3 percent for younger children ages 2–5 years, 15.8 percent among children ages 6–11 years, and 16.1 percent among adolescents ages 12–19 years (Hedley et al., 2004). Overall, 31 percent of U.S. children and adolescents are either obese (16 percent) or at risk of becoming obese (15 percent)—figures that are three and six times greater than the Healthy People 2010 goal of 5 percent (DHHS, 2000a; Hedley et al., 2004). Since the 1970s, the rate of obesity has more than doubled for preschool children ages 2 to 5 years (IOM, 2005b; Ogden et al., 2003). As shown in Figure 2-1, between 1963 and 2002, obesity rates tripled for older children ages 6–11 years and youth ages 12–19 years (CDC, 2005). More than 9 million U.S. children and adolescents ages 6–19 years are considered to be obese (CDC, 2004).
Leaner children and youth have remained more or less the same weight,
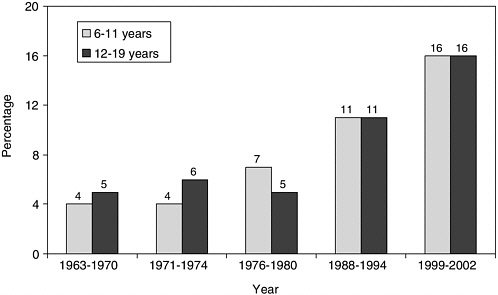
FIGURE 2-1 Prevalence of obesity among U.S. children and adolescents by age group and selected period, 1963–2002.
NOTE: In this report, children with a body mass index (BMI) value at or above the 95th percentile of the CDC age- and gender-specific BMI curves for 2000 are referred to as obese, and children with a BMI value between the 85th percentile and 95th percentile are referred to as at risk for becoming obese. These cut-off points correspond to the terms, overweight and at risk for overweight, used for children and youth by the CDC.
SOURCE: CDC (2005).
but those in the upper percentiles of the BMI charts are heavier. The CDC compiled BMI charts on the basis of combined survey data from several nationally representative cross-sectional samples of the U.S. population that were collected between 1963 and 1980.2 It is notable that the BMI levels for children in the lower part of the BMI chart distribution (the 5th to the 50th percentiles) remained stable when comparing the national surveys (Flegal and Troiano, 2000). Thus, a child in the 1990s who is at or below the 50th percentile is more likely to have a similar BMI when compared to a child in the 1970s; however, a child in the 1990s who is at or above the 85th percentile is more likely to have a significantly higher BMI when compared to a cohort from the 1970s.
Related Chronic Disease Risk
Even among children and youth who are not obese, diets too high in saturated fats, trans fat, and sodium predispose them to the risk of heart disease, stroke, and certain cancers. Moreover, approximately 1 million 12-to 19-year-olds in the United States have the metabolic syndrome (AHA, 2005; Cook et al., 2003), defined as having three or more of the following abnormalities: blood triglyceride level of 110 milligrams per deciliter (mg/ dL) or higher; high-density lipoprotein levels of 40 mg/dL or lower; elevated fasting glucose of 110 mg/dL or higher; blood pressure above the 90th percentile for age, sex, and height; and waist circumference at or above the 90th percentile for age and sex.
About 30 percent of obese adolescents will develop the metabolic syndrome, and nearly two-thirds who develop the syndrome are obese (AHA, 2005). In adults, the metabolic syndrome is associated with type 2 diabetes (Cook et al., 2003; Haffner et al., 1992), cardiovascular disease (Cook et al., 2003; Isomaa et al., 2001), and a higher mortality rate (Cook et al., 2003; Lakka et al., 2002). Even among those obese youth who do not yet have clinical diabetes, components of the metabolic syndrome appear to contribute to the development of atherosclerosis (Berenson et al., 1998; Mahoney et al., 1996; McGill et al., 2002). The association of childhood and youth obesity with the metabolic syndrome, rather than exclusively with diabetes, may present the greatest physical health threat of childhood obesity.
Micronutrient Inadequacies
Although progress has been made in certain areas, subgroups of children and adolescents still experience micronutrient inadequacies that may adversely affect their health, particularly insufficient intakes of vitamins A, E, B6, and folate as well as calcium, iron, potassium, zinc, and magnesium (DHHS and USDA, 2004; Ganji et al., 2003; IOM, 2005c).
Inadequate dietary calcium intake combined with physical inactivity during childhood, adolescence, and early adulthood compromises peak bone mass and contributes to bone resorption and bone diseases, including osteomalacia and osteoporosis in later adulthood (NIH, 2001). Young adults who do not reach a normal peak bone mass by 20 years of age have the greatest risk of developing osteoporosis in later years (Beck and Shoemaker, 2000). Osteoporosis is a serious health problem for today’s youth that has been associated with a decline in calcium intake (NIH, 2001), attributed in part to increased consumption of sweetened beverages (such as carbonated soft drinks, fruit drinks, and sweetened teas) and reduced consumption of milk—the primary source of calcium in U.S. children’s and adolescents’ diets (AAP, 2004; Fisher et al., 2004; Mrdjenovic and Levitsky, 2003). Studies suggest that a higher consumption of carbonated beverages in adolescent girls may be associated with incidence of bone fracture (Wyshak, 2000). Moreover, rickets among infants is attributed to inadequate vitamin D intake and reduced exposure to sunlight, and remains a problem in the United States. For example, reemergence of nutritional rickets has been reported in some African American infants3 (Weisberg et al., 2004).
Dental Caries
Diets high in added sugars also predispose to dental caries. Although the prevalence of dental caries has decreased in the United States, in particular due to topical and water supply fluoridation, lack of access to care has contributed to declines in dental visits and increased rates of untreated dental caries for children and adolescents (DHHS, 2000b; Gift et al., 1996). More than one-half of low-income children without health insurance had no preventive dental care visits (Kenney et al., 2005). The Surgeon General’s
Report on Oral Health in America (DHHS, 2000b) has documented that despite progress in reducing dental caries, children and adolescents in families living below the poverty level experience more dental decay than those in higher socioeconomic levels. In addition, the proportion of teeth affected by dental caries varies by age and race/ethnicity. Poor Mexican-American children ages 2–9 have the highest proportion of untreated decayed teeth (70.5 percent), followed by poor African-American children (67.4 percent), as compared to poor white children (57.2 percent). Poor adolescents ages 12–17 years in each racial/ethnic group have a higher percentage of untreated decayed primary teeth than their peers who do not live in poverty (DHHS, 2000b). Changes in dietary patterns of younger children ages 2–5 years (e.g., increased frequency of sweetened snacks) may also contribute to the reversal of oral health benefits of fluoridation observed since the 1980s (Dye et al., 2004).
DIETARY RECOMMENDATIONS AND GUIDELINES
A healthful diet for children and adolescents provides recommended amounts of nutrients and other food components within estimated energy requirements (EER)4 to promote normal growth and development, a healthy weight trajectory, and energy balance.5 A healthful diet also reduces the long-term risk for obesity and related chronic diseases associated with aging, including type 2 diabetes and the metabolic syndrome (IOM, 2005b).
Thirty years ago, diet quality for children and youth focused on the consumption of a sufficient and balanced intake of foods providing calories, protein, and micronutrients to prevent deficiency diseases. Today, by contrast, dietary quality emphasizes the principles of adequacy, variety, proportionality, and moderation, as well as reinforcing recommendations for a high intake of fruits, vegetables, and whole grains; nutrient-dense foods providing sufficient calories that are balanced with daily physical activity levels; and limited consumption of total fat, saturated fat, trans fatty acids, cholesterol, sodium, and added sugars (DHHS and USDA, 2005).
The average healthy child ages 2 to 5 years gains 4.5 to 6.5 pounds and grows 2.5 to 3.5 inches each year (Story et al., 2003). Child growth continues at a slow and steady rate until the onset of puberty in late middle childhood or early adolescence. A healthy child’s appetite and food intake
|
4 |
Estimated energy requirements (EER) are available for children and youth ages 2–18 years and calculated based gender, age, and three different activity levels (IOM, 2002–2005; Appendix D-1). |
|
5 |
In this report, energy balance in children and youth refers to a state in which energy intake equals energy expenditure; energy balance supports normal growth and development without promoting excess weight gain and body fat. |
varies with the rate of growth, which occurs unevenly in spurts and periods of slower growth. The growth that occurs during adolescence is significant and comparable to the growth that occurs during the first year of life. During adolescence, nutrition needs are higher than during any other period of the lifecycle. Puberty is when adolescents gain approximately 50 percent of their adult body weight, accumulate an estimated 40–45 percent of skeletal muscle mass, and achieve the final 15–20 percent of their linear growth (Shils et al., 1999; Story et al., 2003).
National dietary recommendations and guidelines established for the American population have been used to assess the diets of children and youth. These recommendations and guidelines collectively include the Dietary Reference Intakes (DRIs), the Dietary Guidelines for Americans, and the Food Guide Pyramid (FGP) and MyPyramid.
Dietary Reference Intakes
The DRIs is a term used for a set of distinct, nutrient-based reference values that are based on scientifically grounded relationships between nutrient intake and indicators of good health and chronic disease prevention (IOM, 1997, 1998, 2001, 2002–2005, 2005a). The DRIs, which replaced the former Recommended Dietary Allowances in the United States (NRC, 1989), include values for the following:
-
Estimated Average Requirement (EAR), which is the nutrient intake level estimated to meet the requirements of half the healthy individuals in a given life stage and gender group for a specific indicator or outcome; it is the median of a distribution and can be used to estimate the prevalence of inadequacy in a group;
-
Recommended Dietary Allowance (RDA), which is a nutrient intake level estimated to meet the needs of nearly all individuals (97.5 percent) within a given life stage and gender group, and is calculated as two standard deviations above the EAR;
-
Adequate Intake (AI),6 which is a nutrient intake level based on observed or experimentally derived estimates of nutrient intake of healthy
-
people and used as a guide for individual intake when there is insufficient scientific evidence to calculate an RDA for a specific nutrient; and
-
Tolerable Upper Intake Level (UL), which is based on a risk assessment model and used in the highest average daily intake likely to pose no risk of adverse health effects.
The DRI report series was released by the IOM between 1997 and 2004. The 2002–2005 IOM report provided EER levels, which are suggested calorie7 intakes based on age, sex, and physical activity level, and DRIs for carbohydrate and fat (including saturated, unsaturated, and trans fats), cholesterol, total protein, and individual amino acids (IOM, 2002–2005). This report introduced the concept of an Acceptable Macronutrient Distribution Range (AMDR), representing a range of intakes for carbohydrates, fats, and protein expressed as a percentage of calorie intake. Consumption outside the AMDR is associated with an increased risk of chronic disease and insufficient nutrient intake (IOM, 2002–2005).
Energy intakes based on the EER for proposed food consumption patterns have been developed for boys and girls ages 2 to 18 years for three physical activity levels—sedentary, low active, and active (USDA, 2003a; Appendix D, Table D-1). The DRI report on electrolytes and water provides total water AI levels for children and adolescents of different ages, which can be used as guidelines for total fluid intake obtained from beverages and foods (IOM, 2005a). Macronutrient and micronutrient recommendations for children and adolescents from the DRI reports are summarized in Appendix D, Tables D-2 and D-3. Many EAR, RDA, and AI levels for children and adolescents are estimates or extrapolations from data on adults (IOM, 1997, 1998, 2001, 2002–2005).
Finding: More certain determinations of nutritional requirements for children and adolescents await the development of better techniques and data sets.
Dietary Guidelines for Americans
The Dietary Guidelines for Americans are developed jointly by the U.S. Department of Health and Human Services (DHHS) and the U.S. Department of Agriculture (USDA) and draw from recommendations of a nonfederal Dietary Advisory Committee. The Dietary Guidelines for Americans present summary dietary recommendations for the public based on current scientific evidence and medical knowledge. They represent the government
|
BOX 2-1
SOURCE: DHHS and USDA (2005). |
policy document on dietary practices and are mandated to be promoted in all federal nutrition education programs. Initially published in 1980, they are revised every 5 years. The sixth edition was released in 2005. The key recommendations of the Dietary Guidelines, summarized in Box 2-1, are based on a preponderance of the scientific evidence of nutritional factors that are important in lowering the risk of chronic disease and promoting health, including specific recommendations for weight management, physical activity, food safety, and consumption patterns among food groups, saturated fats, trans fats, cholesterol, sugars, other carbohydrates, sodium and potassium, and alcoholic beverages (DHHS and USDA, 2005).
Food Guide Pyramid and MyPyramid
The FGP is an educational tool for the public that was designed by the USDA in 1992 as the graphic representation of the Dietary Guidelines for Americans. It takes the Dietary Guidelines, along with the Recommended Dietary Allowances, and translates them into servings from various food groups with the goal of promoting a healthful diet for the U.S. population. The qualitative dietary guidance depicted by the FGP is based on the principles of balance, variety, proportionality, and moderation (USDA, 1992, 1996). The FGP for Young Children is similar in content to the FGP but was adapted for younger children ages 2 to 6 years, and recommended fewer serving sizes from certain food groups (USDA, 2003b).
In 2005, an interactive food guidance system, MyPyramid, was re-
leased that replaced the existing FGP (USDA, 2005b). MyPyramid is a component of an overall food guidance system that emphasizes a more individualized approach to improving diet and lifestyle. In particular, it offers personalized recommendations for the types and amounts of food for individuals to consume each day, recommends gradual improvement in daily diet and lifestyle habits including physical activity, and underscores the principles of variety, moderation, and proportionality. A child-friendly version of MyPyramid was recently released to reach children ages 6–11 years with targeted messages about the importance of making healthful eating and physical activity choices and an interactive computer game to apply these messages (USDA, 2005b).
Linked to MyPyramid is the MyPyramid Tracker, which has two components—assessment of food intake and physical activity. The food intake assessment component incorporates what was previously the Interactive Healthy Eating Index (HEI) as an online educational tool for individuals who would like to assess their dietary intake according to MyPyramid and the Dietary Guidelines for Americans (USDA, 2005a). The USDA and other researchers use the HEI for research and assessment purposes to assess and monitor diet quality of the U.S. population according to the Dietary Guidelines for Americans and to investigate relationships between diet and health (USDA, 2005d). The HEI evaluates food consumption patterns against the FGP recommendations using five food-based components (grains, vegetables, fruits, dairy, and meat) and it uses four nutrient-based components to assess adherence to recommendations in the 2000 Dietary Guidelines for Americans for maximum daily intake of total fat and saturated fat, as well as the IOM recommendations for daily cholesterol and sodium (Basiotis et al., 2002; Lin, 2005).8
WHAT CHILDREN AND YOUTH EAT
The Dietary Guidelines Advisory Committee Report (DHHS and USDA, 2004) noted that, based on available food consumption data, children’s and adolescents’ dietary intakes of saturated fatty acids, trans fatty acids, and sodium are higher than recommended (DHHS and USDA, 2004). Additionally, the rising prevalence of obesity in children and adolescents of all ages and across all ethnic groups over the past four decades indicates that their calorie intakes are not balanced with their energy expenditure levels over
time (CDC, 2005; IOM, 2005b). The Dietary Guidelines Advisory Committee Report also identified sufficiently low intakes of dietary calcium, potassium, fiber, magnesium, and vitamin E by children and adolescents to raise concern about nutrient adequacy, and highlighted the need for sufficient intake of iron and folic acid by adolescent girls of childbearing age (DHHS and USDA, 2004). Substantial evidence reviewed in this chapter underlies the concern about the intake of certain nutrients and food components in the diets of children and adolescents, the food consumption patterns associated with these intakes, and changes observed over time.
Sources of Nutrient and Food Intake Information
Major sources of information about the food and nutrient intakes of nationally representative groups of children and youth are the USDA’s older Nationwide Food Consumption Survey (NFCS) (through 1977) and its more recent Continuing Survey of Food Intakes by Individuals (CSFII) and the DHHS’s series of National Health and Nutrition Examination Surveys (NHANES).9 In general, these cross-sectional surveys are complex stratified samples of the population and sampling weights varied depending on the design and oversampling of selected subgroups. The design, sampling, and methods for collecting dietary data differ among the surveys and have evolved over time, confounding conclusions as to trends. Information about the dates, population, sample size, and methodology for assessing dietary intake for the main surveys referenced in this chapter is summarized in Appendix D (Table D-4).
Challenges of Dietary Assessment Methods
Dietary assessment methods are subject to a variety of reporting errors, including problems associated with individuals accurately recalling the types and quantities of foods and beverages consumed; estimating portion sizes; general misreporting according to what is considered socially desirable, especially among individuals who are overweight or obese; and selective underreporting of specific foods (e.g., foods high in fat, sugars, and refined carbohydrates) (Huang et al., 2004; IOM, 2002–2005, 2005b).
To compensate for these methodological limitations, multiple passes were added to the 24-hour dietary recall starting with CSFII 1994–1996, including detailed questions addressing food preparation and frequently unreported foods. These have improved the completeness of data collec-
tion. The combination of improved methodology for collecting dietary information and the pervasive problems of underreporting total food and calorie intake confound the assessment of an individual’s actual dietary intake as well as trends in dietary intake over time. However, the dietary data from each survey provide the best estimate of a group’s intake at that point in time. The assessment of children’s dietary intake poses additional problems due to the nature, extent, and determinants of underreporting or overreporting for children and adolescents because the combination of methodological limitations are not well understood (Livingstone and Robson, 2000). Additionally, food intake for younger children is provided by proxy. Although the primary caregiver may be a reliable reporter of a child’s food intake in the home setting, that may not be the case for foods and beverages consumed away from home.
In NFCS 1977–1978 and CSFII 1989–1991, an adult household member reported information for children younger than age 12 years (Enns et al., 2002). In CSFII 1994–1996 and 1998, children ages 6–11 years were interviewed directly when asked to describe their individual food intake and were assisted as necessary by an adult household member (Enns et al., 2002). When needed, additional information was obtained from the school cafeteria personnel or care providers to improve completeness of data collected. In NHANES III, proxy respondents provided information for 97 percent of the children younger than age 6 years; children ages 6–11 years were permitted to report their own intake but only 55 percent did so, with the remaining respondents either completed by proxy (23 percent) or by both a child and a proxy (23 percent) (Troiano et al., 2000). Children ages 12 years and older typically reported their own dietary intake information (Enns et al., 2002; Troiano et al., 2000).
Huang and colleagues (2004) estimated that 55 percent of children and adolescents in CSFII 1994–1996 and 1998 had reported calorie intakes that were not scientifically reliable or plausible. In children with plausible data, calorie intake tended to be overreported for younger children and underreported more often in obese older children, thereby concluding that it is necessary to exclude implausible dietary reports to draw dietary associations between children’s dietary intake and BMI percentiles. Experimental studies in children and adolescents have shown that mean daily calorie intakes can be underreported by as much as 17 to 33 percent of energy expenditure and that underreporting tends to increase with age (Bandini et al., 2003; Champagne et al., 1998). Similar methodological challenges exist for conducting research on children’s physical activity levels (IOM, 2005b).
Finding: More accurate methods are needed to assess the dietary intakes of children and youth, including calorie intakes and expenditures.
Nutrient Intakes of Children and Youth
Mean Nutrient Intakes and Changes Between the 1970s and 1990s
Data from different sources on calorie intakes present variable results by age and gender. Substantial overall increases were reported in the mean calorie intakes of children and youth from the mid-1970s to the mid-1990s. Average calorie intakes by younger children ages 2–5 years increased by 172 calories (Kranz et al., 2004), among adolescent boys by 243 calories (Enns et al., 2003), and among adolescent girls by approximately 113 calories (Enns et al., 2003). Detailed data on the nutrient intakes of different racial/ethnic groups is limited; thus, there is a need to be cautious when extrapolating the results to the various groups of U.S. ethnic minority children and youth.
Finding: Total calorie intake appears to have increased substantially over the past 25 years for preschool children and adolescent boys and girls, with more modest changes for children ages 6–11 years.10
Trends in percentage of calorie intake of specific foods and beverages in U.S. children and adolescents, ages 2–18 years, are available from 1977–1978 to 1994–1996 (Nielsen et al., 2002b). Some foods, such as low- and medium-fat milk, and medium- and high-fat beef and pork, declined as a percentage of overall calorie intake from 1977–1978 to 1994–1996. Other foods and beverages revealed a modest increase in percentage of total calorie intake during this period, such as carbonated soft drinks (3 percent to 5.5 percent), fruit drinks (1.8 percent to 3.1 percent), candy (1.1 percent to 2.1 percent), french fries (1.7 percent to 2.6 percent), and pizza (1.4 percent to 3.4 percent) (Nielsen et al., 2002b). In this data analysis, mean calorie intake increased 118 calories (6.4 percent), from 1,840 calories in 1977–1978 to 1,958 calories in 1994–1996.
Another analysis of CSFII 1989–1991 data examined major food sources of nutrients and dietary constituents in 4,008 U.S. children ages 2–18 years (Subar et al., 1998). Milk, yeast breads/donuts, beef, and cheese were ranked among the top 10 sources of total calories, fat, and protein in children’s and youths’ diet. Many of the top 10 sources of carbohydrates and fat contributed more than 2 percent each to children’s calorie intake
(Subar et al., 1998; Appendix D, Table D-6). Carbohydrate sources include yeast breads, soft drinks, sodas, milk, ready-to-eat (RTE) cereals, cakes/ cookies/quick breads/donuts, sugars/syrups/jams, fruit drinks, pasta, and white potatoes. Fat sources include milk, cheese, cakes/cookies/quick breads/ donuts, potato chips/corn chips, and ice cream/sherbet/frozen yogurt. Based on this analysis, low-nutrient foods are a significant contributor to the total calorie, fat, and carbohydrate intake of children and youth (Subar et al., 1998). These results were confirmed in a more recent analysis of NHANES III and NHANES 1999–2000 that examined foods and food groups contributing the most to population intake of calories (Block, 2004). Although the analysis did not report percentage of calorie intake by age, it found that the top 10 food items that contributed the most to calorie intake in the entire U.S. population were high-calorie, low-nutrient foods and beverages (e.g., sweets and carbonated soft drinks), which contributed nearly one third of all the calories consumed (Block, 2004; Appendix D, Table D-7).
Finding: Children and youth consume a large proportion of their total calories from foods and beverages that are of high-calorie and low-nutrient content.
Obesity may develop from a relatively small excess of daily calories consumed (e.g., 50 to 100 calories/day) versus calories expended over several months and years (IOM, 2005b). Both excessive calorie intake and physical inactivity are likely contributors to the calorie imbalance that leads to obesity. Further study is needed on the relative contribution to childhood obesity of excess calorie intake versus insufficient calorie expenditure (IOM, 2005b).
NFCS and CSFII data indicate changes in the macronutrient sources of calories for children (6–11 years) and adolescents (12–19 years) over time, suggesting a possible decrease in the gram (g) amounts of fat and protein and an increase in the gram amounts of carbohydrate (Enns et al., 2002, 2003) with associated changes in the percentage of calorie intake from protein, fat, and carbohydrates (Appendix D, Table D-5) (Enns et al., 2002, 2003).
Carbohydrate intake increased both in total amount and as a percent of calories for boys, ages 6–11 years, from 226 g in 1977–1978 to 280 g in 1994–1996 and 1998 (representing an increase from 46.8 percent to 54.8 percent of carbohydrates as a percent of total calories) and for girls, ages 6–11 years, an increase from 212 g in 1977–1978 to 250 g in 1994–1996 and 1998 (representing an increase from 47.4 percent to 54.9 percent of carbohydrates as a percent of total calories) (Enns et al., 2002). An analysis of the same data showed similar increased trends in carbohydrate intake for adolescent boys, ages 12–19 years, from 279 g in 1977–
1978 to 366 g in 1994–1996 and 1998 (representing an increase from 44.6 percent to 53.2 percent of carbohydrates as a percent of total calories) and for girls, ages 12–19 years, an increase from 45.4 g in 1977–1978 to 55 g in 1994–1996 and 1998 (representing an increase from 45.4 percent to 55 percent of carbohydrates as a percent of total calories) (Enns et al., 2002).
Finding: Carbohydrate intake has increased substantially among children and youth over approximately the past two decades.
Total fat intake of children and adolescents was 38–40 percent of calories in 1977–1978 (Enns et al., 2002, 2003). Based on data from CSFII 1994–1996 and 1998, total fat intake in children and adolescents (ages 6–18 years) was 32 percent of calories (Enns et al., 2002, 2003). Only an estimated 25 percent of children and adolescents had usual total fat intakes that were 30 percent of energy or less (Gleason and Suitor, 2001). Non-Hispanic black adolescents had slightly higher fat intakes (36 percent of calories) than non-Hispanic white adolescents (33 percent of calories) and Mexican American adolescents (34 percent of calories) (Troiano et al., 2000).
Another study based on CSFII 1994–1996 and 1998 showed a decline in fat and saturated fat intake as a percentage of calories for younger children (ages 2–5 years) (Kranz et al., 2004). Fat intake decreased from 36 percent of calories in 1977–1978 to 32 percent of calories in 1994–1996 and 1998, and saturated fat intake decreased from 14 percent of calories to 12 percent. However, the absolute amount of fat intake (measured by grams/day) in younger children increased slightly (Kranz et al., 2004). Although children and youth may have reduced their fat intake and saturated fat intake over the past 25 years, a large proportion still consume amounts that exceed recommended levels.
Mean intakes of cholesterol ranged from 257 mg in younger children (ages 2–5 years) to 340 mg in youth (ages 12–19 years) in NHANES I, and intakes were highest in adolescent boys (411 mg) (Troiano et al., 2000). The higher cholesterol intake in adolescent boys is consistent with their higher calorie intake. Cholesterol intakes declined consistently between NHANES I, II, and III across all age, race, and sex groups to 193–211 mg, except for adolescent African American boys whose cholesterol intake remained at about 355 mg.
Of the vitamins and minerals reported in NFCS 1977–1978 and CSFII 1994–1996 and 1998, the mean intake of vitamin B12 decreased significantly; thiamin and iron increased; and calcium, phosphorus, magnesium, and vitamin A did not change for children or adolescents (Enns et al., 2002, 2003; Appendix D, Table D-5). Intakes of vitamin C, riboflavin, niacin,
and vitamin B6 either increased or did not change significantly, depending on age and sex. The nutrient intakes of girls did not appear to differ appreciably between 6- to 11-year-olds and 12- to 19-year-olds, except for 8 percent lower riboflavin and 10 percent lower calcium intakes in adolescents despite a higher calorie intake. Vitamin and mineral intakes for adolescent boys were higher than for the younger boys, and were most likely related to the overall higher calorie intake of older boys. Iron intakes in younger children (ages 2–5 years) increased between 1977–1978 and 1994–1996 and 1998 from 9.9 mg to 12.3 mg (Kranz et al., 2004).
Sodium intake data from the NHANES series reveal an increase in mean intake among all age groups of children and adolescents between 1971–1974 and 1999–2000 (Briefel and Johnson, 2004; Appendix D, Table D-8). For example, sodium intake in older adolescent boys (ages 16–19 years) increased 34 percent between 1971–1977 and 1999–2000 from 3,219 mg to 4,415 mg. Mean intakes increased 32–36 percent for children (ages 3–11 years) and younger adolescent boys (ages 12–15 years) and 45–68 percent for adolescent girls (ages 12–19 years). Assessment of sodium intakes and trends is difficult because sources include salt added in cooking, salt added at the table, and processed foods, and there are uncertainties associated with the exact sodium content of each source. Nonetheless increased consumption of processed foods and a greater frequency of eating away from home have contributed to the increased sodium intakes observed over the past three decades.
Nutrient Intakes Compared with the Dietary Reference Intakes and Dietary Guidelines
Usual nutrient intakes of U.S. children and adolescents (ages 1–18 years) from the dietary interview component of the NHANES 2001–2002 have been compared to the DRIs (Moshfegh et al., 2005). In general, less than 4 percent of 1- to 8-year-old children had nutrient intakes less than the EAR. Nutrients identified as potential problems in comparison with the EAR for boys and girls ages 9–18 years include vitamin A (13 percent to 55 percent),11 vitamin E (80 percent to >97 percent), vitamin C (8 percent to 42 percent), and magnesium (14 percent to 91 percent). Adolescent girls were at highest risk for having nutrient intakes below the EAR, especially for folate (19 percent), phosphorus (49 percent),12 vitamin B6 (16 percent), zinc (26 percent), and copper (16 percent).
Although the AI cannot be used to estimate the prevalence of inad-
equate nutrient intakes in a group, the prevalence of inadequacy should be low if at least 50 percent of a group has intakes greater than the AI. More than 50 percent of 1- to 8-year-olds had calcium intakes above the AI, but less than 5 percent of 9- to 18-year-old girls had usual calcium intakes above the recommended AI. The difference between the younger children and older girls is related primarily to the difference in the calcium AI values for the two age groups (800 mg for 4- to 8-year-olds versus 1,300 mg for 9-to 18-year-olds), but is also related to the lower calcium intakes observed in adolescent girls. Only 6 percent of girls, ages 9–13 years, and 9 percent of girls, ages 14–18 years, had calcium intakes greater than the AI (Moshfegh et al., 2005).
Other analyses of foods indicate that dairy foods and ingredients contribute more than 60 percent of the dietary calcium, nearly 25 percent of total fat, 39 percent of saturated fat, and 31 percent of cholesterol to the total dietary intakes of children and adolescents from birth to 19 years of age (Weinberg et al., 2004). Several studies have demonstrated that higher intakes of total dairy and milk are not only associated with increases in the intake of calcium but also often with significant increases in other essential nutrients, including magnesium, potassium, zinc, iron, vitamin A, riboflavin, and folate (Subar et al., 1998; Weinberg et al., 2004).
An analysis of calorie intakes in relation to the EER was not available. An older analysis compared calorie intakes with the 1989 Recommended Energy Allowances (REA) (NRC, 1989). Calorie intakes were above the REA for more than half the children, but technically below the REA for the remainder of the children studied (Suitor and Gleason, 2002). Factors discussed earlier that may explain why such a large proportion of children were below the REA include underreporting of food intake, a level of physical activity that is below the REA, or a combination of both factors (Suitor and Gleason, 2002). Additionally, the REA for children and adolescents was based on a theoretical estimation of total energy expenditure for a defined activity pattern rather than on measured energy expenditure. As a result the 1989 REA levels were based on a low to moderate activity level that is higher than the EER calculated for a sedentary activity level for the same age groups reported in the DRI report on macronutrients (IOM, 2002–2005) (Figure 2-2). The differences between the REA and EER suggest that children’s calorie needs were overestimated from the 1970s to 2002. Some have suggested that decreased physical activity was likely more important than increased calorie intake as a contributor to the increase in obesity prevalence (Troiano et al., 2000). If children and adolescents were more sedentary over the past 20–30 years, then their REA levels should have been adjusted accordingly to account for the lower energy expenditure levels.
The current EER allows calorie requirements to be calculated based on
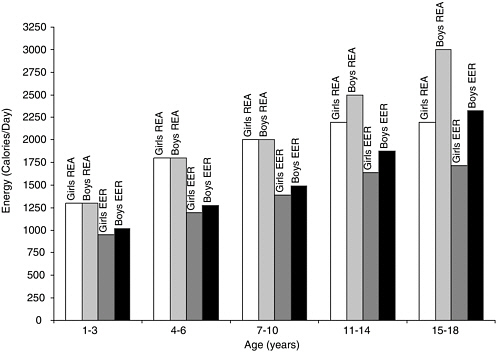
FIGURE 2-2 Recommended Energy Allowances (REA) compared with Estimated Energy Requirements (EER) for U.S. children and adolescents, ages 1–18 years, 1989 and 2002.
NOTE: The REA for girls and boys, ages 1–18 years, were calculated based on a low to moderate activity level that is higher than the EER calculated for a sedentary activity level for the same age groups reported in the DRI report on macronutrients.
SOURCES: IOM (2002–2005), NRC (1989).
several different physical activity levels and the corresponding DRI report provides guidance for using the EER to maintain body weight, to prevent weight gain, and assess intake in individuals and groups (IOM, 2002–2005).
A total fat intake of 30–40 percent of calories is recommended for children ages 1–3 years and 20–35 percent of calories for ages 4–18 years (IOM, 2002; Appendix D, Table D-2), and saturated fat intakes should be as low as possible—less that 10 percent of calories according to the Dietary Guidelines for Americans (DHHS and USDA, 2005). Data from CSFII 1994–1996 found the mean usual intake of saturated fat among school-aged children to be 12 percent of calories (Gleason and Suitor, 2001). Only an estimated one-quarter of girls (23 percent) and boys (25 percent) ages 6–11 years and about one-third of girls (34 percent) and boys (28 percent) ages 12–19 years had saturated fat intakes less than 10 percent of calories (USDA, 1999).
Based on percent of calories, the majority of children and adolescents ages 6–18 years met the intake recommendations for total fat (74 percent) and saturated fat (53 percent) during breakfast; however many fewer children met the recommendations (24 percent and 21 percent, respectively) during their lunch meals (Gleason and Suitor, 2001). Less Hispanic (17 percent; 10 percent) and African American (7 percent; 6 percent) children and adolescents achieved intakes within the recommendations for total fat and saturated fat, respectively, compared to 29 percent and 18 percent of non-Hispanic whites (Gleason and Suitor, 2001). The overall mean saturated fat intake reported in NHANES III (1988–1994) also was 12 percent of calories, varied little by sex and age, and displayed no consistent pattern by race or ethnicity (Troiano et al., 2000). Data from 1988–1994 showed an improvement in that about one-quarter of individuals under age 20 years had saturated fat intakes less than the recommended 10 percent of total calories (Carriquiry et al., 1997).
Similar to saturated fats, the intake of trans fatty acid should be kept as low as possible within the context of a nutritionally adequate diet (DHHS and USDA, 2005; IOM, 2002). Trans fatty acid intakes estimated from food intake data reported in CSFII 1989–1991 was 2.6 to 2.8 percent of calorie intake for children and adolescents ages 3–19 years (Allison et al., 1999). Approximately 80 percent of trans fatty acid intake in the U.S. diet is attributed to partially hydrogenated vegetable oil, which is used in products such as cakes, cookies, crackers, pies, and breads; margarine; fried potatoes; and potato chips, corn chips, and popcorn. Trans fatty acids also occur naturally in animal products, which account for 20 percent of intake.
Cholesterol intake also should be as low as possible within the context of a nutritionally adequate diet (IOM, 2002) with less than 300 mg/day recommended by the Dietary Guidelines for Americans (DHHS and USDA, 2005). Mean and median cholesterol intakes from NHANES III (1988–1994) were below 300 mg/day, except for adolescent boys (Troiano et al., 2000); between 50 to 75 percent of individuals under age 20 years had mean intakes below 300 mg/day (Carriquiry et al., 1997). Data from CSFII 1994–1996 and 1998 indicate that at least 80 percent of children and adolescents ages 6–19 years had cholesterol intakes below 300 mg, except adolescent boys, 56 percent of whom achieved desirable intakes below 300 mg/day (USDA, 1999).
Finding: Total fat and saturated fat intakes among children and youth remain at levels that exceed dietary recommendations.
A fiber intake of 14 g/1,000 calories is recommended as adequate (IOM, 2002). This translates to a daily total fiber intake of 19 to 38 grams for children and adolescents depending on age and sex
(Appendix D, Table D-2). However, mean dietary fiber intakes based on CSFII 1994–1996 and 1998 were 12–13 g for girls and 14–17 g for boys (Enns et al., 2002, 2003), suggesting that most children and adolescents are not consuming recommended amounts of dietary fiber. In this same survey, with the exception of vitamin B12 and calcium, nutrient and food group consumption was better in younger children ages 2–5 years who consumed higher levels of dietary fiber, indicating a higher quality diet (Kranz et al., 2005a).
There is no DRI for added sugars13 because there was insufficient evidence to set a UL (IOM, 2002–2005). However, the suggested limit for added sugars is that they should not exceed 25 percent of total calories to ensure adequate micronutrient intakes (IOM, 2002–2005, 2005). The 2005 Dietary Guidelines for Americans recommend that consumers choose and prepare foods and beverages with little added sugars, in amounts suggested by the USDA food guidance system, MyPyramid, and the DASH Eating Plan (DHHS and USDA, 2005). The actual amount of added sugars that is consistent with these eating plans varies and depends on total calorie intake and the amount of discretionary fat14 consumed. The FGP suggested the following daily amounts of added sugars intake: 6 teaspoons for a 1,600-calorie diet, 12 teaspoons for a 2,200-calorie diet, and 18 teaspoons for a 2,800-calorie diet; these amounts are approximately 6, 9, and 10 percent of calories, respectively (USDA, 1996). A recent analysis that joined data from CSFII 1994–1996 and 1998 and from the U.S. sweetener supply and utilization information indicate that sweetener consumption varies with age (Haley et al., 2005). At an average of over 135 pounds per year, adolescent boys and girls, ages 12–19 years had the highest per capita sweetener consumption (including refined sugar and corn sweeteners) compared to younger children and adults (Haley et al., 2005). USDA dietary intake and survey data show that on average, older children ages 6–11 years consumed 21–23 teaspoons per day of added sugars in diets that provided 1,800–2,000 calories, adolescent girls ages 12–19 years consumed 23 teaspoons in an 1,800-calorie diet, and adolescent boys consumed 34 teaspoons in a 2,700–calorie diet (Enns et al., 2002, 2003). These amounts of added sugars provided approximately 20 percent of total calorie intake. Only 28 per-
cent of younger preschoolers and 21 percent of older preschoolers had added sugar intakes below 10 percent of total calories; 11 percent and 12 percent, respectively, had intakes greater than 25 percent of calories which is the maximal intake level (Kranz et al., 2005b).
Data comparing the sugar consumption of 743 sixth graders, ages 11–13 years, who had purchased and consumed school lunches in middle school cafeterias in Kentucky found that the mean sugar intake for students consuming only the school lunch was 14.1 g, whereas students consuming one or more food items in addition to the school lunch had a mean sugar intake of 30.7 g (Templeton, 2005; Templeton et al., 2005). Chapters 3 and 6 have a more extensive discussion about such supplemental or “competitive” foods.
Finding: Most preschool children consume added sugars well above suggested limits, and older children and adolescents consume about double the suggested limit of added sugars in their diets.
Adequate intakes of potassium for children and adolescents range from 3,000 mg/day (ages 1–3 years) to 4,700 mg/day (ages 14–18 years) (DHHS and USDA, 2005; IOM, 2005a). Virtually all children and adolescents ages 4–19 years had a potassium intake that exceeded their AI (Moshfegh et al., 2005).
The AI for sodium in children and adolescents ranges from 1,000 mg (1–3 years) to 1,500 mg (9–18 years), and the UL ranges from 1,500 mg (1–3 years) to 2,300 mg (14–18 years) (IOM, 2005a). An intake of less than 2,300 mg is recommended by the Dietary Guidelines for Americans (DHHS and USDA, 2005). However, according to data from NHANES III (1988–1994), mean sodium intakes ranged from 2,114 mg (ages 1–3 years) to 4,598 mg (adolescent boys ages 14–18 years) (Briefel and Johnson, 2004). All of the children and adolescents—100 percent—ages 4–18 years exceeded the AI for sodium (IOM, 2005a; Appendix D, Table D-8). Approximately 75 percent (children ages 4–6 years and adolescent girls ages 14–18 years) to more than 91 percent (adolescent boys ages 14–18 years) had sodium intakes greater than 2,300 mg/day (Briefel and Johnson, 2004). In general, non-Hispanic whites, non-Hispanic blacks, and Mexican Americans consume similar amounts of dietary sodium (DHHS, 2000a). The estimates of sodium intake did not include discretionary intake—what children and adolescents added to their meals at the table. Mean sodium intakes reported in NHANES 1999–2000 are even higher than NHANES III (1988–1994) for children ages 1–2 years and 6–11 years; however intakes seem to decline slightly for all other age groups during that time period (Briefel and Johnson, 2004; Appendix D, Table D-8).
Finding: Mean sodium intake of children and youth has increased over the past 35 years, and the majority of children and adolescents are consuming sodium in greater amounts than recommended levels.
Dietary Supplement Use
Although essential nutrients can be obtained from a balanced diet, many individuals take dietary supplements. NHANES III (1988–1994) collected data on supplement use for all individuals including children (ages 2 months–11 years) and adolescents (ages 12–19 years). About 40 percent of children and 25 percent of adolescents took some type of supplement (Ervin et al., 2004). Of those taken, multivitamins plus vitamin C (47 percent) was the leading supplement reported for children, followed by multivitamins/multiminerals (13 percent), multivitamins plus iron (10 percent), vitamin C (7 percent), and multivitamins plus fluoride (6 percent). The supplements reported by adolescent boys included vitamin C (24 percent); multivitamins/multiminerals (21 percent); multivitamins plus vitamin C (17 percent); supplements such as herbs, botanicals, and sport drinks (8 percent); and all other supplements such as single vitamins or minerals (29 percent). Those reported by adolescent girls included multivitamins/multiminerals (23 percent), multivitamins plus vitamin C (20 percent), vitamin C (16 percent), iron (6 percent), vitamin E (5 percent), and a mixture of assorted other supplements (30 percent). The contribution of dietary supplements usually is not included in past assessments of nutrient intakes from dietary survey data.
Dietary Intake and Eating Pattern Trends
Mean Food Intakes and Changes Between the 1970s and 1990s
Children’s and adolescents’ nutrient intakes reflect their food and beverage choices, which have changed substantially over time. In general, there have been increases in consumption of sweetened carbonated soft drinks, noncitrus juices/nectars, and fruit drinks/ades; grain mixtures such as pasta with sauces, rice dishes, and pizza; salty snacks; fried potatoes; candy; low-fat and skim milk; and cheese. Intakes have decreased for total milk and whole milk; yeast breads and rolls; green beans, corn, peas, and lima beans; and beef and pork (Enns et al., 2002, 2003). For younger children (ages 2–5 years) between 1977 and 1998, the percentage of total calories from added sugars increased during the same time period (Kranz et al., 2004). There has been a small improvement in dietary quality since 1977. Preschoolers had an increased number of servings of grains, dairy products, juice, and fruits and vegetables, although the types of fruits and vegetables
were not reported (Kranz et al., 2004). The improvements in fruit and vegetable consumption may be marginal. Data from the Feeding Infants and Toddlers Study (FITS) found that up to one-third of infants and toddlers ages 7–24 months did not consume a discrete serving of vegetables; fewer than 10 percent consumed dark green leafy vegetables; and consumption of potatoes and starchy vegetables consumption increased with age (Fox et al., 2004; Skinner et al., 2004b). Up to one-third of infants and toddlers in this age group did not consume a discrete serving of fruit and 46–62 percent consumed fruit juice (Fox et al., 2004; Skinner et al., 2004b).
Food Intakes Compared with the Food Guide Pyramid
Although the FGP was updated and replaced with MyPyramid in 2005, a comparison of intakes with FGP servings still provides a general picture of food consumption patterns. In CSFII 1994–1996 and 1998, less than half of children ages 6–11 years consumed the number of servings recommended by the FGP for any one food group (Enns et al., 2002; USDA, 1996). In CSFII 1994–1996 and 1998, less than half of children ages 6–11 years consumed the number of servings recommended by the FGP for any one food group (Enns et al., 2002; USDA, 1996). On average, children in this age group consumed only one serving of whole grains per day, compared to the recommended three servings per day (DHHS and USDA, 2004); 80 percent did not meet the recommended servings for vegetables or legumes; and about a quarter met the recommendation for fruit intake (Enns et al., 2002). These dietary patterns contribute to the reported low dietary fiber, potassium, and magnesium intakes. Only 29 percent of girls and 40 percent of boys ages 6–11 years consumed the recommended daily servings of dairy products, which explains the low calcium intakes in this group (Enns et al., 2002). Twelve percent of girls and 21 percent of boys consumed the recommended servings from the meat and meat alternatives group, but this may reflect methodological problems with assessing the meat content of meals such as casseroles in which overall protein intake is adequate (Enns et al., 2002). Low intakes of nuts, dark green leafy vegetables, and vegetable oils account for children’s low vitamin E intakes. While overall reported energy intakes were below the REA, children ages 6–11 years had intakes of discretionary fat and added sugars that were higher than levels consistent with the healthy eating pattern suggested by the FGP. These food intake patterns reveal that children are not achieving optimal diet quality and nutrient density.
Similar proportions of adolescents (ages 12–19 years) as younger children consumed the recommended servings of whole grains, vegetables, and legumes, and had intakes of discretionary fat and added sugars that exceeded the FGP healthy eating pattern (Enns et al., 2003). Fewer adoles-
cents than children consumed the recommended servings of fruits (18 percent of adolescent girls and 14 percent of adolescent boys) and dairy products (12 percent of adolescent girls and 30 percent of adolescent boys), whereas a slightly higher percentage consumed the recommended servings of meat and meat alternatives (22 percent of adolescent girls and 44 percent of adolescent boys) (Enns et al., 2003).
Dietary quality scores for intakes of grains (8–9), fruits and vegetables (6–7), and dairy products (6) by younger children in CSFII 1994–1996 and 1998 were below the maximum possible for each group (10), and the amount of fruit juice consumed exceeded recommendations by the AAP by approximately one 6-ounce (oz) serving (Kranz et al., 2004).15 In general, younger preschoolers (ages 2–3 years) had better dietary quality scores than older preschoolers (ages 4–5 years).
Finding: Over the past decade, most children and youth have not met the daily recommended servings for vegetables, fruits, or whole grains.
Low-Nutrient Foods
Dietary calorie density is the calorie content in a given weight of food (calories/gram) and influences the calorie intake of individuals (Ledikwe et al., 2005). Low-nutrient foods contribute a relatively low amount of essential nutrients when expressed per serving or calorie content. Low-nutrient foods are high in calorie density; they include fats, oils, and sugars (e.g., sweets and confectionery), desserts (e.g., ice cream, puddings, cheese-cakes, pastries, cookies, cakes, pies), and salty snacks (e.g., potato, corn, tortilla chips), which are included in the dairy or grain groups of the FGP (Kant, 2004; Kant and Graubard, 2003). Carbonated soft drinks are low in nutrient density but are not particularly calorie dense because of their high water content. Fruits and vegetables are relatively nutrient dense, but not calorie dense, because of their high water content (Rolls et al., 2004).
Low-nutrient foods contributed more than 30 percent of daily calories to the diets of children and adolescents ages 8–18 years who participated in NHANES III (1988–1994) (Kant and Graubard, 2003). Of the low-nutrient foods, sweets (e.g., sugar, syrup, candy, carbonated soft drinks) and desserts (e.g., cookies, cakes, ice cream) accounted for nearly 25 percent of total calorie intake (Kant and Graubard, 2003; Figure 2-3). The
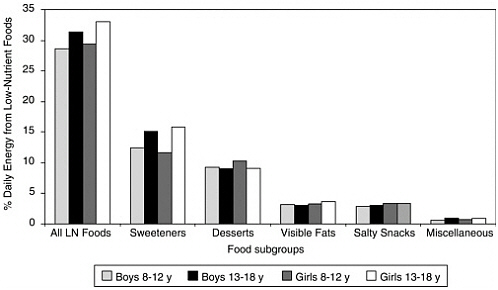
FIGURE 2-3 Percentage of daily calories from low-nutrient food subgroups for U.S. children and adolescents, ages 8–18 years, from National Health and Nutrition Examination Survey (NHANES) III, 1988–1994.
SOURCE: Kant and Graubard (2003).
reported number of low-nutrient foods was positively related to total calorie intake and the percentage of calories from carbohydrate and fat, and was negatively related to the intakes of fiber, vitamins A and B6, folate, calcium, magnesium, iron, and zinc. The strongest negative predictor of the reported number of low-nutrient foods was the amount of nutrient-dense foods consumed from the five major food groups (Kant and Graubard, 2003). Weekly consumption of a complete school lunch also was a negative predictor, whereas the number of reported eating occasions was a positive predictor.
Stated another way, those children who consumed fewer low-nutrient foods had better quality diets as reflected by fewer eating occasions reported, eating school lunch more regularly, and consuming more foods from the major food groups. Gender- and age-adjusted BMI, sociodemographic and family characteristics, and the reported hours spent in physical activity or watching television were not associated with the number of low-nutrient foods reported. The data suggest that increased access and availability of nutrient-dense foods and decreased access to low-nutrient foods in schools, homes, and other places will moderate low-nutrient food and calorie intake.
Increasing added sugars intake in younger children ages 2–5 years from CSFII 1994–1996 and 1998 was associated with decreasing intakes of sev-
eral micronutrients (e.g., calcium, iron, folate, and vitamins A and B12) and food groups (e.g., grains, vegetables, fruits, and dairy), and increasing proportions of children with intakes below the EAR or decreasing proportion above the AI for selected nutrients (Kranz et al., 2005b). Younger children at the lowest level of added sugars intake (<10 percent of total calories) consumed approximately one serving more of grains, fruits, and dairy compared to those in the highest added sugar intake group (>25 percent of total calories). Approximately 75 percent of younger preschoolers (ages 2–3 years) and 50 percent of older preschoolers (ages 4–5 years) had calcium intakes above the AI with added sugar intakes of 16–25 percent of total calories; 60 percent and 30 percent of younger and older preschoolers, respectively, had calcium intakes above the AI when added sugars exceeded 25 percent of total calories.16 The main sources of added sugars were fruit drinks (19–20 percent), sweetened carbonated soft drinks (14–16 percent), and high-fat desserts (15–16 percent).
Beverages
The potential calorie and nutrient composition of beverages in the diets of children and youth have important implications for diet-related health risks such as obesity and osteoporosis. Data from the national dietary surveys indicate that beverage consumption habits have changed for children and adolescents over the past 35 years. Between 1965 and 2001, the intake of sweetened beverages (e.g., carbonated soft drinks and fruit drinks) by children and adolescents ages 2–18 years increased and milk decreased—whether expressed as percentage of per capita total calorie intake, percentage of consumers, mean servings per day, or mean portions (Cavadini et al., 2000; Nielsen and Popkin, 2004; Appendix D, Table D-9). Milk consumption decreased from 13.2 percent of total calories in 1977–1978 to 8.3 percent in 2001 for children and youth ages 2–18 years (Nielsen and Popkin, 2004). During this same time period, soft drink consumption in this age group increased from 3 to 6.9 percent, and fruit drink consumption increased from 1.8 to 3.4 percent (Nielsen and Popkin, 2004).
The decline in total milk consumption over time by children (ages 6–11 years) and adolescents (ages 12–19 years) is related to a decline in the consumption of whole milk that is not offset by a commensurate increase in consumption of low-fat milk and skim milk (Enns et al., 2002, 2003). From 1965 to 1996, low-fat milk replaced higher-fat milk intake in 11- to 18-
year-olds, yet total milk consumption decreased by 36 percent, and was accompanied by a three-fold increase in the consumption of sweetened carbonated soft drinks and a two-fold consumption of fruit-flavored beverages (Cavadini et al., 2000; Huang and McCrory, 2005; Figure 2-4).
A recent study of more than 3,000 children and youth ages 2–18 years using NHANES 1999–2000 data found that sweetened beverages provided approximately 13 percent of adolescents’ total caloric intake and represented the single leading source of added sugars in adolescents’ diets (Murphy et al., 2005). The study also found that the consumption of carbonated soft drinks and sweetened fruit drinks increased and milk decreased in a step-wise direction as children aged (Murphy et al., 2005).
Diet carbonated soft drinks and water consumption have not been systematically evaluated in national consumption surveys for children and youth, although databases are available to assess nutrient availability per capita of beverages by nationally representative samples of U.S. household purchases. Understanding the beverage choices made by households is important to assess the contribution of caloric beverages to total calorie intake. A USDA analysis used the 1999 ACNielsen Homescan Consumer Panel, which tracked household purchases of beverages over an entire year, to assess the nutrient availability for nonalcoholic beverages consumed at home. The analysis reflected only the purchasing patterns of households and the total household availability of nutrients, and did not disaggregate the findings into intrahousehold differences (Capps et al., 2005). However,
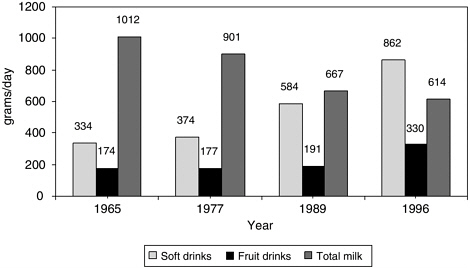
FIGURE 2-4 Trends in milk consumption versus carbonated soft drinks and fruit-flavored beverage consumption in U.S. adolescents, ages 11–18 years, 1965 to 1996.
SOURCES: Cavadini et al. (2000); Huang and McCrory (2005).
the analysis found that the average available calcium, vitamin C, and caffeine intakes from nonalcoholic beverages per person per day were lower in households with children younger than 6 years, ages 6–12 years, and 13–17 years (Capps et al., 2005). Additionally, households with children ages 13–17 years had higher daily available calorie intakes per person than did households with no children, though the analysis was unable to identify the reasons for this observation (Capps et al., 2005).
Data from the National Family Opinion Research/Beverage Unit’s Share of Intake Panel (SIP) show positive trends in beverage consumption by younger children (ages 1–5 years) during the periods of 1987–1988, 1992–1993, and 1997–1998 (Park et al., 2002). There was a decrease in the percentage of children who consumed carbonated soft drinks (84, 78, and 72 percent), powdered soft drinks17 (54, 51, and 45 percent), and tea (33, 21, and 17 percent); an increase in those who consumed fruit drinks (53, 55, and 61 percent); and no consistent change in juice (77, 77, and 79 percent) or milk consumption (94, 95, and 91 percent). There was also a decrease in the daily consumed quantity of carbonated soft drinks (from 5.2 to 3.7 oz) and powdered soft drinks (from 4 to 3.5 oz), and an increase in milk (from 11.6 to 13.5 oz), juices (from 5 to 7 oz), and fruit drinks (from 2.1 to 2.9 oz).
The age, gender, and race/ethnicity of children and adolescents affect beverage consumption patterns (Storey et al., 2004). In CSFII 1994–1996 and 1998, milk product consumption in general increased in boys and decreased in girls between ages 2–3 years and 14–18 years. Boys consumed more milk products than girls at all ages, with the difference widening as age increased; white boys drank more milk products than African American boys at all ages and more than Hispanic/Latino boys ages 4–8 years (Storey et al., 2004). White girls consumed similar amounts of milk products as Hispanic/Latina girls until ages 9–18 years when white girls consumed more milk products. African American girls consumed fewer milk products than white or Hispanic/Latino girls at all ages. Sweetened carbonated soft drinks and fruit drinks/ades consumption generally increased with age in both genders, with boys increasingly consuming more than girls as age increased (Storey et al., 2004). African American children and adolescents generally consumed more fruit drinks/ades and less sweetened carbonated soft drinks than whites (Storey et al., 2004). The amount of diet carbonated soft drinks consumed was insignificant at ages 2–3 years and increased slightly with age, but was relatively low compared to other beverage sources (Storey et al., 2004). Similar age and gender patterns in beverage intakes have been observed with data from SIP (Park et al., 2002).
Sweetened beverages (as a percentage of total calories in 1994–1996) were consumed by children and adolescents ages 2–18 years mostly at home (3.9 percent), followed by restaurants and quick serve restaurants (QSRs) (1.7 percent), obtained from a store but not eaten at home or ever brought into the home (0.7 percent), and vending machines (0.3 percent) (Nielsen and Popkin, 2004). Using a slightly different approach to analyzing the data, French et al. (2003) also reported an increase in the prevalence of sweetened carbonated soft drinks consumption and portion size among youth—with the largest source of consumption at home, followed by restaurants and QSRs, other locations (e.g., friends’ homes and entertainment venues), school cafeterias, and vending machines. Sweetened beverages were the largest contributors to added sweeteners in the diets of children and adolescents ages 2–18 years, from 34–52 percent depending on age and sex in 1994–1996 to 35–58 percent in 1999–2000 (Guthrie and Morton, 2000; Murphy et al., 2005). Sweetened beverages represent approximately 10 percent of their total calorie intake.
Finding: Sweetened beverage consumption (e.g., carbonated soft drinks and fruit drinks) by children and adolescents has increased considerably over the past 35 years and is now a leading source of added sugars, especially in adolescents’ diets. The consumption of milk, a major source of dietary calcium, has decreased among children and adolescents over the same period, and most have calcium intakes below the recommended adequate intake level.
Breakfast Consumption
Breakfast consumption also has changed over time. In NFCS 1965, 90 percent of boys and 84 percent of girls consumed a food, beverage, or both between 5 am and 10 am compared with 75 percent and 65 percent, respectively, in CSFII 1989–1991 (Siega-Riz et al., 1998). Consumption declined approximately 5 percentage points in younger children, 9 points in older children ages 8–10 years, and 13–20 points in adolescents. The greatest decline was among adolescent girls ages 15–18 years, who dropped from 84 percent in 1965 to 65 percent in 1991. Frequency of breakfast consumption declines with age. In 1965, African Americans and whites had similar breakfast consumption patterns; however, African American adolescents were less likely to consume breakfast by 1989–1991 (Siega-Riz et al., 1998). Data from the National Heart, Lung, and Blood Institute Growth and Health Study, a 9-year longitudinal biracial cohort of 2,379 girls, found that white girls reported more frequent breakfast consumption than African American girls, but the racial differences decreased with age
(Affenito et al., 2005). Beginning in 1977, more children attending school (preschool ages to 14 years) consumed breakfast than those not in school.
Breakfast consumption has been generally associated with higher parental income (Siega-Riz et al., 1998). Eating this meal also has been correlated with higher calcium and fiber intakes, and the number of days eating breakfast is predictive of lower BMI levels (Affenito et al., 2005). Breakfast food choices in 1989–1991 generally reflected fewer sources of dietary fat, especially lower consumption of whole milk, eggs, and bacon (Siega-Riz et al., 1998). Regular consumption of fortified RTE cereals with low-fat milk for breakfast has been correlated with (1) higher nutrient intakes (e.g., fiber, calcium, iron, folic acid, vitamin C, and zinc) (Barton et al., 2005; Subar et al., 1998), (2) decreased intake of fat and cholesterol (Barton et al., 2005), and (3) lower BMI levels in children ages 4–12 years (Albertson et al., 2003) and girls ages 9–19 years (Barton et al., 2005).
Finding: Breakfast consumption by children and adolescents has decreased considerably over the past 40 years and the occurrence of breakfast consumption declines with age. The frequency of breakfast consumption is predictive of lower BMI levels in children and adolescents.
Snacking Patterns
An examination of food intakes from NFCS and CSFII revealed an increase in snacking prevalence across all age groups of children and adolescents ages 2–18 years—from 77 percent in 1977–1978 to 91 percent in 1994–1996 (Jahns et al., 2001; Figure 2-5). Most of the increase occurred between 1989–1991 and 1994–1996. In 1994–1996, younger children (ages 2–5 years) and older children (ages 6–11 years), except for Hispanics/Latinos, were the highest proportion who snacked; slightly more boys than girls snacked; and more Hispanics/Latinos and whites snacked than African Americans.
The average size (in grams) or calorie content per snack remained relatively constant over time from 1977–1978 to 1994–1996, but the number of snacking occasions increased significantly, thereby increasing the average daily calories from snacks. The size of snacks increased with age during each time period (e.g., from 153 g for ages 2–5 years to 195 g for ages 6–11 years to 307 g for ages 12–18 years in 1994–1996). The average daily calorie intake from snacks increased over time for all age groups because the number of snacking occasions increased by about 0.4 snacking events per day overall. In 1994–1996, snacks contributed 378 calories per day for younger children ages 2–5 years, 462 calories for older children ages 6–11 years, and 612 calories for adolescents ages 12–
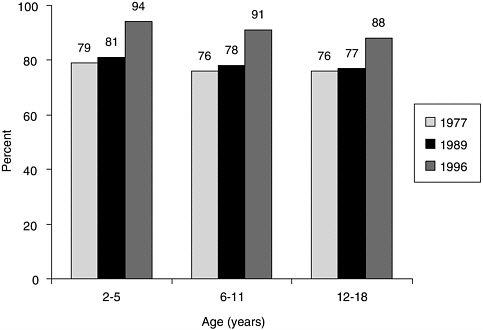
FIGURE 2-5 Trends in prevalence of snacking among U.S. children and adolescents, ages 2–18 years.
SOURCE: Jahns et al. (2001). Reprinted from Journal of Pediatrics, Jahns L, Siega-Riz AM, Popkin BM, The increasing prevalence of snacking among US children from 1977 to 1996, Pages 493–498, 2001, with permission from Elsevier.
18 years, representing an estimated 25 percent of total calorie intake (compared to an estimated 20 percent in 1977–1978). The calcium density (mg/1,000 calories) of both meals and snacks decreased over 20 years, with the magnitude of decline greater for snacks.
Finding: The prevalence of snacking and number of snacking occasions by children and youth have increased steadily over the past 25 years.
Portion Sizes
Although the size of each snack consumed by children and adolescents over the past 20 years has remained relatively constant (Jahns et al., 2001), the portion size and calorie contribution of selected foods per eating occasion did increase based on an analysis of data for all individuals (ages 2 years and older) who participated in NFCS 1977–1978, CSFII 1989–1991, and CSFII 1994–1996 and 1998 (Nielsen and Popkin, 2003). The quantity of salty snacks consumed per eating occasion increased by 0.6 oz
(93 calories), desserts by 0.6 oz (41 calories), carbonated soft drinks by 6.8 oz (49 calories), fruit drinks by 3.8 oz (50 calories), hamburgers by 1.3 oz (97 calories), cheeseburgers by 1.5 oz (138 calories), french fries by 0.5 oz (68 calories), and Mexican dishes by 1.7 oz (133 calories). According to these investigators, the portion size or calorie content of pizza did not change during the time frame examined. There were no statistically significant different trends between age groups, and in most but not all cases, portion sizes increased for these foods whether obtained at home or away from home, with the largest portion sizes in 1994–1998 found in QSRs and the smallest in full serve restaurants (Chapter 3).
When data from CSFII 1989–1991 and CSFII 1994–1996 for foods commonly consumed (e.g., by 7 percent or more of the population ages 2 years and older) were compared, larger portions were reported in 1994–1996 for several foods, including spaghetti with tomato sauce (16 percent increase in portion size), carbonated soft drinks (16 percent increase), fruit drinks (16 percent increase), orange juice (12 percent increase), and RTE cereals (9.6 percent increase) (Smiciklas-Wright et al., 2003). Smaller portions were reported for a few foods such as margarine (18 percent decrease), mayonnaise (10 percent decrease), chicken (11 percent decrease), pizza (14 percent decrease), and macaroni and cheese (17 percent decrease). An increase in portion size was significant for RTE cereals consumed by older children ages 6–11 years and adolescent boys ages 12–19 years, fruit drinks and spaghetti with tomato sauce consumed by adolescent boys, and carbonated soft drinks consumed by adolescent girls. A decrease in portion size was significant for chicken consumed by younger children ages 2–5 years and older children ages 6–11 years, french fries by younger children, and pizza by older children.
Eating Locations and Food Sources
Adolescents ages 12–18 years consumed most of their calorie intake from food prepared or obtained at home, but the percentage decreased between 1977–1978 and 1994–1996 (74 versus 60 percent, respectively) (Nielsen et al., 2002b). A higher percentage of calories was consumed from foods obtained at full serve restaurants and QSRs (6.5 versus 19 percent) and less at school (11 versus 8 percent). Less than 1 percent of calorie intake was from foods obtained from vending machines at both time periods (0.5 versus 0.9 percent) (Nielsen et al., 2002b). Children ages 2–12 years in 1994–1996 consumed more than two-thirds of their calories from food obtained or prepared at home (68 percent) (Lin et al., 1999). However, total calorie intake obtained from away-from-home food sources increased for children from 20 percent to 32 percent between 1977–1978 and 1994–1996 (Lin et al., 1999). Food obtained by children from schools,
QSRs, and full serve restaurants accounted for 9 percent, 10 percent, and 4 percent of total calorie intake, respectively. Similar trends have been reported overall for children and adolescents ages 2–18 years (Nielsen et al., 2002a,b; Figure 2-6; Chapter 3).
Finding: There has been a steady increase in the proportion of calories that children and youth have received from away-from-home foods over the past 20 years. Approximately one-third or more of their calories are derived from foods purchased outside of the home, nearly one-half of which is obtained at full serve restaurants and quick serve restaurants that contain higher fat content than food consumed at home.
In 1994–1996, food consumed by children and adolescents ages 2–17 years that was prepared away from home, compared to food prepared at home, contained more total fat (36.1 versus 31.6 percent of calories) and saturated fat (13.2 versus 11.5 percent of calories), and less cholesterol (106 versus 118 mg/1,000 calories), dietary fiber (6.2 versus 6.9 g/1,000 calories), calcium (437 versus 474 mg/1,000 calories), and iron (6 versus 8.3 g/1,000 calories) (Guthrie et al., 2002). There was no difference in the sodium content (per 1,000 calories) between food consumed at home and food prepared away from home.
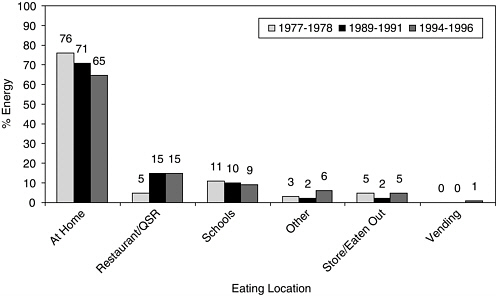
FIGURE 2-6 Trends in energy intake of U.S. children and adolescents, ages 2–18 years, by selected eating location, 1977–1978 to 1994–1996.
SOURCE: Nielsen et al. (2002a).
Infants and Toddlers
Reports from the national dietary surveys usually provide limited details of the food and nutrient intakes of infants (ages <12 months) and toddlers (ages 12–24 months). Yet the first 2 years of life are associated with a transition from a largely milk-based diet to an increasingly complex diet that includes a variety of common foods.
As discussed in Chapter 3, food preferences develop early in life and have been shown to predict consumption habits. Thus, it is important to understand the overall nutritional adequacy and nature of the diets consumed by infants and toddlers. The 2002 Feeding Infants and Toddlers Study has provided important information about the nutrient intakes, food group consumption, and meal and snack patterns for a large, nationally representative, random sample of 3,022 infants and toddlers ages 4 to 24 months (Devaney et al., 2004; Fox et al., 2004; Skinner et al., 2004a,b). FITS intake data are based on multiple-pass 24-hour dietary recalls conducted with a parent or caregiver.
Nutrient and Calorie Intakes
The usual nutrient intakes, from both foods and dietary supplements, of young (4–6 months) and older (7–11 months) infants exceeded the AI, often with the 10th percentile of usual intake either equaling or exceeding the AI (Devaney et al., 2004). The estimated prevalence of nutrient inadequacy for older infants was relatively low for iron (7.5 percent) and zinc (4.2 percent). For toddlers, the prevalence of inadequacy was low (<1 percent) for most nutrients, except for vitamin E. More than half (58 percent) of toddlers had vitamin E intakes below the EAR. The mean intakes for calcium and vitamin D exceeded the AI. The percentages of usual intakes that exceeded the UL were less than 1 percent for most nutrients. However, a relatively high percentage of toddlers had usual intakes for vitamin A (35 percent) and zinc (43 percent) that exceeded the UL. Overall the data suggest that the diets of infants and toddlers are nutritionally adequate, with less than 1 percent of total nutrient intakes coming from supplements. The mean, median, and estimated percentiles of the usual calorie intake distribution all exceeded the comparable EER. The mean usual calorie intake was higher than the mean EER by 10 percent for young infants, 23 percent for older infants, and 31 percent by toddlers. Maternal employment status did not influence calorie intake. The mean intakes of fat, carbohydrates, and protein of young infants exceeded the AI, as did the mean intakes of fat and carbohydrates for older infants. Thirty-eight percent of toddlers had fat intakes outside the AMDR: 29 percent had fat intake below 30 percent of calories and 9 percent had intakes above 40 percent of
calories. Mean fiber intake for toddlers was 8 g/day, far below the AI of 19 g.
Finding: Calorie intake by infants and toddlers substantially exceeds their estimated requirements, although validation is needed on the reliability of food intake reporting by parents and caregivers, as well as on body weight estimates.
Food and Beverage Intakes
Food and beverage consumption patterns—reported as the percentage of infants and toddlers who consumed an item at least once in a day—from FITS have been described (Fox et al., 2004; Skinner et al., 2004b). Patterns that have been observed in older children and adults were observed in infants as young as 7 months. Up to one-third of infants and toddlers ages 7–24 months did not consume a discrete serving of a vegetable (18–33 percent) (Fox et al., 2004). In virtually all age groups, fewer than 10 percent consumed dark green leafy vegetables. Potato, starchy vegetable, and other vegetable consumption increased with age, with french fries or other fried potatoes being the third most consumed vegetable at 9–11 months (8.6 percent), second most consumed at 12–14 months (12.9 percent), and most consumed at ages 15–18 months (19.8 percent) and 19–24 months (25.5 percent) (Fox et al., 2004). Similar to vegetable consumption, up to one-third of infants and toddlers ages 7–24 months did not consume a discrete serving of a fruit (23–33 percent) and 46–62 percent consumed fruit juice (primarily apple juice). Most toddlers consumed cereals that were not presweetened, but 18–26 percent of toddlers, depending on age, consumed presweetened cereal (defined as 21.2 g of sugar/100 g). The percentage of infants and toddlers who consumed desserts, sweets, or sweetened beverages increased sharply after the age 6 months (from about 10 percent at age 6 months to 91 percent by ages 19–24 months). Among older toddlers ages 19–24 months, 60 percent consumed a baked dessert (e.g., cake, cookie, pie, or pastry) and 20 percent consumed candy.
Older toddlers primarily drank milk (93 percent), water (77 percent), 100 percent fruit juices (62 percent), and fruit drinks (43 percent), and to a lesser extent carbonated soft drinks (12 percent) and other beverages (11 percent) (Skinner et al., 2004b). Many infants and toddlers consumed at least one sweetened beverage each day, infants ages 7–8 months (7.5 percent), toddlers ages 12–14 months (28.2 percent), and older toddlers ages 19–24 months (44.3 percent) (Fox et al., 2004). Toddlers, ages 12–14 months and 15–18 months, who were in the upper quartile of to-
tal calorie intake, showed a higher consumption of sweetened beverages when compared to toddlers in the lower quartile (Briefel et al., 2004).
Beverages, including milks and fruit juices, provided 36 percent of total calorie intake for older toddlers, with less than 25 percent of calories coming from milks. The calcium density of the diet was negatively associated with intake of 100 percent juice, fruit drinks, and carbonated soft drinks. The AAP recommendations for limiting 100 percent juice consumption—age of introduction and amount consumed (to 4–6 oz/day)—were not followed by a majority of parents.
Finding: Infants and toddlers are consuming diets disproportionately high in sweetened foods and beverages and fried potatoes, and disproportionately low in green leafy vegetables.
Meal and Snack Patterns
The median number of daily eating occasions was 7 for infants and toddlers in FITS, regardless of age, and ranged from 3 to 15 (Skinner et al., 2004a). More than 89 percent ate breakfast, lunch, and dinner, and the percentage reported to be eating snacks increased with age. More than 80 percent of toddlers ages 12–24 months ate afternoon snacks, 66 percent consumed a morning snack, and slightly more than 50 percent consumed an evening snack. Among toddlers, snacks provided about 25 percent of daily calorie intake; typical snacks were milk, water, and crackers but also fruit drinks, candy, chips, and cookies. Frequent eating occasions are important for infants and toddlers because of their small stomachs and usually high levels of activity.
Income and Regional-Related Food and Nutrient Patterns
Income and Childhood Obesity
Children who live in poverty experience greater health, social, and nutrition disparities when compared with middle- and high-income children (DHHS, 2000a, 2003; Evans, 2004; Wise, 2004). In 2002, approximately 11.6 million children (17 percent) under the age of 18 years lived in families with incomes below 100 percent of the federal poverty level, and an additional four million children lived in families just above poverty (Federal Interagency Forum on Child and Family Statistics, 2004; Wise, 2004). The poverty rate is much higher for ethnic minority children. In 2000, 32 percent of African American children and 28 percent of Hispanic/Latino children lived in poverty compared to 9 percent of white children (Federal Interagency Forum on Child and Family Statistics, 2004).
Moreover, less than 70 percent of people living at or above the federal poverty level have health insurance (DHHS, 2003). Despite evidence documenting health disparities by income, including nutrition-related health disparities, evidence on the relationship between household income and nutrient intake levels is mixed, and the relationship has varied over time (Devaney et al., 2005).
The prevalence of obesity in children and youth reveals significant disparities by sex and between racial/ethnic groups (Hedley et al., 2004). As seen in Figure 2-7, NHANES data reveal that non-Hispanic black and Mexican-American children and adolescents ages 6–19 years have a greater prevalence of obesity (with a BMI equal to or greater than the 95th percentile of the CDC BMI charts) and are at greater risk of becoming obese (defined as having a BMI between the 85th and the 95th percentile of the CDC BMI charts) than are non-Hispanic whites (Hedley et al., 2004).
Despite the substantial variation in BMI that exists as a function of both socioeconomic status and ethnicity based on NHANES III in girls ages 6–9 years (Winkleby et al., 1999), and the increase in obesity prevalence among African American youth at the lowest income (Strauss and Pollack, 2001), uncertainties remain as to whether these rates can be attributed only to socioeconomic status because these disparities are not the same across ethnic groups and they do not emerge at comparable times during childhood. Also, there is no consensus, albeit many theories, about the mechanisms by which they occur. For example, analysis of the data from the 1988–1994 NHANES shows that the prevalence of obesity in white adolescents is higher among those in low-income families, but there is no clear relationship between family income and obesity in other age or ethnic subgroups (Ogden et al., 2003; Troiano and Flegal, 1998). Two analyses of nationally representative longitudinal data—the National Longitudinal Survey of Youth (Strauss and Knight, 1999; Strauss and Pollack, 2001) and the National Longitudinal Study of Adolescent Health (Goodman, 1999)—have suggested that family socioeconomic status is inversely related to obesity prevalence in children and that the effects of socioeconomic status and race or ethnicity were independent of other variables.
Food insecurity—the limited or uncertain availability of nutritionally adequate and safe foods, or the inability to acquire such foods in a socially acceptable way—is a significant issue for low-income18 families, especially African American and Hispanic/Latino households that experience this condition at double the national average rate (Food Research Action Center, 2005). In 2004, 38.2 million individuals, including 13.8 million children,
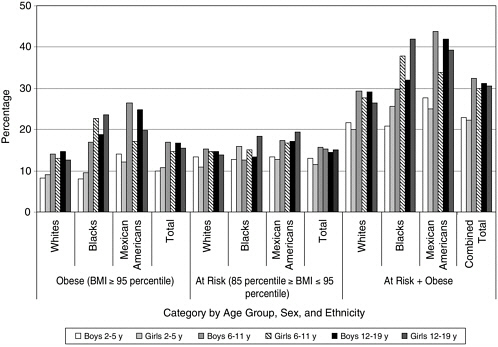
lived in food-insecure households (an estimated 11.9 percent of all U.S. households), and 3.9 percent (4.4 million) of U.S. households were food insecure with hunger (Nord et al., 2005). An estimated 19 percent of all U.S. children and 38 percent of children living in poverty were classified as living in food-insecure households (Nord et al., 2005).
State-specific prevalence and trends among 2- through 4-year-old children from low-income U.S. families were examined from 1989 to 2000. Results showed significant increases in obesity among low-income children in 30 states and significant decreases in childhood underweight in 26 states (Sherry et al., 2004). Although no geographic predominance was apparent, the number of states reporting obesity prevalence of more than 10 percent increased from 11 in 1989 to 28 in 2000. Reported underweight decreased during the same time frame, as reflected by 9 states in 1989 and 23 states in 2000 that had a prevalence equal to or less than 5 percent (Sherry et al., 2004).
Food insecurity is associated with adverse health outcomes in infants and toddlers younger than 36 months of age (Cook et al., 2004) and with negative academic and psychosocial outcomes including depression in older children (Alaimo et al., 2001a, 2002). When compared with higher income households that were food insufficient, defined as inadequacy in the amount of food intake because of limited money or resources, low-income food insufficient households had more obese children. The available evidence shows that food insufficiency alone has not been associated with obesity except in white girls ages 8 to 16 years (Alaimo et al., 2001b; Casey et al., 2001). Other studies have not been able to show a clear relationship between childhood obesity and food insufficiency or food insecurity after adjusting for other confounding variables (Kaiser et al., 2002; Matheson et al., 2002).
Several states have examined the relationship of federal food assistance policies and programs to obesity in low-income participants. One analysis of the National Longitudinal Survey of Youth has suggested that long-term Food Stamp Program (FSP) participation was positively associated with obesity in young girls, ages 5–11 years; negatively related to obesity in young boys, ages 5–11 years; and not significantly related to obesity in older children (Gibson, 2004). However, the analysis did not control for food insecurity. Another recent analysis, based on the 1997 Child Development Supplement to the Panel Study of Income Dynamics, examined the BMI levels of 1,268 children between the ages of 6 and 12 years, and families and children who participated in the National School Lunch Program (NSLP) or School Breakfast Program (SBP), either for a free, reduced, or subsidized school meal. The sample included children from five family income categories: poor, near poor, working class, moderate income, and high income. Results found that children in the poorest families were less
likely to be obese and have lower BMI levels than most other children. Children from high-income families were also less likely to be obese. In contrast, children from families with incomes just above the poverty level—the near poor—are the children at greatest risk for obesity. School meal participation was not a determining factor in a child’s risk of obesity (Hofferth and Curtin, 2005). Another published study found that school-aged girls from food-insecure households who participated in the FSP, SBP, and NSLP had a lower risk of becoming obese than their cohorts in food-insecure households who did not participate in food assistance programs (Jones et al., 2003). It cannot yet be concluded whether FSP participation results in obesity. Further research is needed to understand the mechanisms operating among poverty, food insecurity, federal food assistance program participation, and obesity in children and youth (Frongillo, 2003).
Income and Diet Among Younger Children
Dietary intakes of younger children (ages 2–4 years) in NHANES III (1988–1994) who participated in the Special Supplemental Nutrition Program for Women, Infants, and Children have been compared to WIC income-eligible but nonparticipating children and higher income noneligible children (Cole and Fox, 2004). More WIC children consumed fewer than three meals per day than higher income children (16 percent versus 10 percent), with fewer consuming breakfast (88 percent versus 94 percent) (Cole and Fox, 2004). WIC children had higher calorie and calcium intakes compared to the other two groups; however, all three groups appeared to have adequate calcium as well as vitamin C, iron, and zinc intakes when compared to the DRIs. The diets of children participating in WIC generally were similar to the diets of income-eligible, nonparticipants and higher income children. Notable exceptions were higher intakes of calories, total fat, saturated fat, cholesterol, and sodium compared to the higher income children (Cole and Fox, 2004). Also, the WIC children had higher scores for the fruit component of the HEI compared to the income-eligible children, which suggests that eligible but nonparticipating WIC children had lower quality diets.
Income and Diet Among School-Age Children
The diets of school-aged children, ages 5–18 years, who participated in NHANES III (1988–1994) have been analyzed based on income status: income at or below 130 percent of poverty (lowest income), income between 131 and 185 percent of poverty (low income), and income higher than 185 percent of poverty (higher income) (Fox and Cole, 2004). Children in the lowest income group were eligible for participation in the FSP
and free meals in the NSLP and SBP; those in the low-income group were eligible for reduced-price meals.
Slightly more children in the lowest income group consumed fewer than three meals per day than those in the higher income group (39 versus 34 percent), and slightly fewer had breakfast (44 versus 48 percent). Only 14 percent of children in the lowest income group met the Dietary Guidelines for total fat (no more than 30 percent of calories) compared to 10 percent in the low-income group and 22 percent in the higher income group. The available evidence reveals that compared with the higher income group, slightly more of the lowest income children consumed less than three meals per day and did not eat breakfast; they had lower intakes of calcium and higher intakes of total fat, saturated fat, and sodium. Few of the children had good diets based on the HEI (Fox and Cole, 2004).
The prevalence of iron deficiency19 has decreased in the United States (Sherry et al., 2001). This decrease is attributed in part to the widespread use and greater bioavailability of iron-fortified foods and infant formula (IOM, 2005c; Sherry et al., 2001). However, iron deficiency remains a nutritional concern for toddlers and younger children, especially low-income and minority children, and adolescent girls (CDC, 2002; DHHS, 2000a; IOM, 2005c; Looker et al., 1997). Although iron-deficiency anemia is uncommon in the United States, population levels of iron deficiency exceed the Healthy People 2010 objectives of 5 percent for toddlers, 1 percent for younger children, and 7 percent for adolescent girls (DHHS, 2000a). Iron-deficiency anemia is associated with low energy levels, reduced attention span, compromised cognitive performance, developmental delays, and poor educational achievement (IOM, 2001; Pollitt, 1993).
Finding: Certain subgroups, such as low-income and minority children and adolescent girls, have inadequate dietary intakes of specific micronutrients (e.g., vitamins D and B6, folate, iron, zinc, and magnesium).
Regional Patterns
The NFCS, CSFII, and NHANES provide dietary information for a nationally representative sample of the U.S. civilian, noninstitutionalized population and were not designed to evaluate specific regional differences in dietary habits. Other studies have provided insights into regional differences, especially in selected southern states.
The Foods of Our Delta Study was a cross-sectional survey of a culturally diverse population residing in the Lower Mississippi Delta region of Arkansas, Louisiana, and Mississippi (Champagne et al., 2004). Calorie intake did not differ between the children ages 3–18 years in the Delta and CSFII 1994–1996 and 1998.20 Average intakes of folate were consistently higher in the Delta children due to the mandatory fortification of enriched grain products that occurred between the time of the national survey and the Delta Study. The average food and nutrient intakes of African American children in the Delta region were similar to those of African American children in the U.S. population, with the only difference being fewer servings of RTE cereals in the Delta region.
However, intakes for white children in the Delta Study were significantly lower for dietary fiber, vitamin A, carotene, riboflavin, vitamin B6, vitamin C, calcium, and iron than for the white U.S. population, and more similar to intakes for African American children both in the Delta region and nationally—except for vitamin C, which was lower, and calcium, which was higher, for whites. Lower intakes of RTE breakfast cereals, fruit, vegetables, and dairy foods accounted for the lower nutrient intakes of the white Delta children. White Delta children had higher added sugar intakes than those in the U.S. population. Overall the intake of fruits, vegetables, and dairy products was poor for the children in the Delta region—similar to children in the U.S. population in general.
Data from the Bogalusa Heart Study21 provide additional insight into dietary patterns of children (ages 10 years) residing in the South, including trends from 1973 to 1994. The trends in general are consistent with national trends, with a few notable exceptions. For example, the percentage of Bogalusa children consuming desserts and candy and the mean gram amount consumed, decreased significantly, although they have increased nationally (Nicklas et al., 2004a). Similar to national trends, however, the mean amount consumed increased for cheese, salty snacks, and sweetened beverages, and decreased for milk. Unlike the national population, though, the increase in overall sweetened beverage intake in Bogalusa was due to an increase in the amount of tea with sugar consumed, as the amount of fruit drinks and carbonated soft drinks did not change significantly (Rajeshwari et al., 2005).
Examination of the sweetened beverage data from Bogalusa by tertiles of consumption revealed no significant change in mean consumption be-
tween 1973 and 1994 by children in the low tertile (68 g versus 77 g), but an increase for those in the middle (325 g versus 408 g) and high (770 g versus 868 g) tertiles. The total amount of milk consumption was significantly lower (~20 percent) in the middle and high sweetened beverage consumption groups compared to the low or no sweetened beverage consumption groups (Rajeshwari et al., 2005).
The percentage of Bogalusa children who skipped breakfast increased from 8 percent in 1973 to 30 percent in 1978, but decreased to 13 percent after the introduction of the SBP in 1981 (Nicklas et al., 2004b), a level lower than that observed nationally. Also unlike national trends, the percentage of children consuming snacks as well as total eating episodes decreased. On the other hand, similar to national trends, the percentage of Bogalusa children consuming a dinner at home decreased and those consuming a dinner prepared outside the home or a meal at a restaurant increased.
SUMMARY
The committee’s review of the health, diet, and eating patterns of children and youth finds several issues and trends relevant to its consideration of the potential for marketing practices to influence these patterns. Children and youth today face new diet-related health problems that were unexpected just a generation ago. The increased prevalence of obesity and type 2 diabetes and the growing incidence of the metabolic syndrome in children and adolescents of all ages and across all ethnic groups have the potential to affect health gains that children have experienced in other dimensions over the past 30–40 years. Children and adolescents today have higher than recommended intakes of saturated fatty acids, trans fatty acids, and sodium. Moreover, dietary intakes of calcium, potassium, fiber, magnesium, and vitamin E are sufficiently low to warrant concern. Adolescent girls of childbearing age and low-income toddlers are especially at risk of inadequate intake of iron. Furthermore, recent trends in child health disparities reveal that social disparities persist despite significant improvements in absolute levels of child health. Children who live in poverty experience greater health, social, and nutrition disparities when compared with middle- and high-income children.
The nutrient intakes of children and adolescents reflect their food and beverage choices, which have changed substantially over time. A healthful diet provides recommended amounts of nutrients and other food components within estimated calorie needs to promote normal growth and development, a healthy weight trajectory, and caloric balance. Yet, current consumption patterns suggest disproportionately low intakes of fruits, veg-
etables, legumes, whole grains, and dairy products, and disproportionately high intakes of high-calorie and low-nutrient foods and beverages.
REFERENCES
AAP (American Academy of Pediatrics). 2001. The use and misuse of fruit juice in pediatrics. Pediatrics 107(5):1210–1213.
AAP. 2004. Soft drinks in schools. Pediatrics 113(1):152–154.
Affenito SG, Thompson DR, Barton BA, Franko DL, Daniels SR, Obarzanek E, Schreiber GB, Striegel-Moore RH. 2005. Breakfast consumption by African-American and white adolescent girls correlates positively with calcium and fiber intake and negatively with body mass index. J Am Diet Assoc 105(6):938–945.
AHA (American Heart Association). 2005. Heart Disease and Stroke Statistics—2005 Update. Dallas, TX: AHA. [Online]. Available: http://www.americanheart.org/downloadable/heart/1105390918119HDSStats2005Update.pdf [accessed April 23, 2005].
Alaimo K, Olson CM, Frongillo EA Jr. 2001a. Food insufficiency and American school-aged children’s cognitive, academic, and psychosocial development. Pediatrics 108(1):44–53.
Alaimo K, Olson CM, Frongillo EA Jr. 2001b. Low family income and food insufficiency in relation to overweight in US children: Is there a paradox? Arch Pediatr Adolesc Med 155(10):1161–1167.
Alaimo K, Olson CM, Frongillo EA. 2002. Family food insufficiency, but not low family income, is positively associated with dysthymia and suicide symptoms in adolescents. J Nutr 132(4):719–725.
Albertson AM, Anderson GH, Crockett SJ, Goebel MT. 2003. Ready-to-eat cereal consumption: Its relationship with BMI and nutrient intake of children ages 4 to 12 years. J Am Diet Assoc 103(12):1613–1619.
Allison DB, Egan K, Barra LM, Caughman C, Infante M, Heimbach JT. 1999. Estimated intakes of trans fatty and other fatty acids in the US population. J Am Diet Assoc 99(2):166–174.
Bandini LG, Must A, Cyr H, Anderson SE, Spadano JL, Dietz WH. 2003. Longitudinal changes in the accuracy of reported energy intake in girls 10–15 y of age. Am J Clin Nutr 78(3):480–484.
Barton BA, Eldridge AL, Thompson D, Affenito SG, Striegel-Moore RH, Franko DL, Albertson AM, Crockett SJ. 2005. The relationship of breakfast and cereal consumption to nutrient intake and body mass index: The National Heart, Lung, and Blood Institute Growth and Health Study. J Am Diet Assoc 105(9):1383–1389.
Basiotis PP, Carlson A, Gerrior SA, Juan WY, Lino M. 2002. The Healthy Eating Index: 1999–2000. U.S. Department of Agriculture, Center for Nutrition Policy and Promotion. Report No. CNPP-12. [Online]. Available: http://www.usda.gov/cnpp/Pubs/HEI/HEI99-00report.pdf [accessed March 15, 2005].
Beck BR, Shoemaker MR. 2000. Osteoporosis: Understanding key risk factors and therapeutic options. The Physician and Sports Medicine 28(2).
Berenson GS, Srinivasan SR, Bao W, Newman WP III, Tracy RE, Wattigney WA. 1998. Association between multiple cardiovascular risk factors and atherosclerosis in children and young adults: The Bogalusa Heart Study. N Engl J Med 338(23):1650–1656.
Block G. 2004. Foods contributing to energy intake in the US: Data from NHANES III and NHANES 1999–2000. J Food Comp Analysis 17(3-4):439–447.
Briefel RR, Johnson CL. 2004. Secular trends in dietary intake in the United States. Annu Rev Nutr 24:401–431.
Briefel R, Reidy K, Karwe V, Jankowski L, Hendricks K. 2004. Toddlers’ transition to table foods: Impact on nutrient intakes and food patterns. J Am Diet Assoc 104(1 Suppl): S38–S44.
Capps O Jr, Clauson A, Guthrie J, Pittman G, Stockton M. 2005. Contributions of Nonalcoholic Beverages to the U.S. Diet. U.S. Department of Agriculture. Economic Research Service. Economic Research Report No. 1. [Online]. Available: http://www.ers.usda.gov/publications/err1/err1.pdf [accessed April 26, 2005].
Carriquiry AL, Kodd KW, Nusser SM. 1997. Estimating Adjusted Intake and Biochemical Measurement Distributions for NHANES III. Hyattsville, MD: National Center for Health Statistics.
Casey PH, Szeto K, Lensing S, Bogle M, Weber J. 2001. Children in food-insufficient, low-income families: Prevalence, health, and nutrition status. Arch Pediatr Adolesc Med 155(4):508–514.
Cavadini C, Siega-Riz AM, Popkin BM. 2000. US adolescent food intake trends from 1965 to 1996. Arch Dis Child 83(1):18–24.
CDC (Centers for Disease Control and Prevention). 1999. Ten great public health achievements—United States, 1990–1999. MMWR 48(12):241–243.
CDC. 2002. Iron deficiency—United States, 1999–2000. MMWR 51(40):897–899. [Online]. Available: http://www.cdc.gov/mmwr/preview/mmwrhtml/mm5140a1.htm [accessed April 24, 2005].
CDC. 2004. Obesity Still a Major Problem, New Data Show. National Center for Health Statistics. [Online]. Available: http://www.cdc.gov/nchs/pressroom/04facts/obesity.htm [accessed November 3, 2004].
CDC. 2005. QuickStats: Prevalence of overweight among children and teenagers, by age group and selected period—United States, 1963–2002. MMWR 54(8):203. [Online]. Available: http://www.cdc.gov/mmwr/preview/mmwrhtml/mm5408a6.htm [accessed March 9, 2005].
Champagne CM, Baker NB, DeLany JP, Harsha DW, Bray GA. 1998. Assessment of energy intake underreporting by doubly labeled water and observations on reported nutrient intakes in children. J Am Diet Assoc 98(4):426–433.
Champagne CM, Bogle ML, McGee BB, Yadrick K, Allen HR, Kramer TR, Simpson P, Gossett J, Weber J. 2004. Dietary intake in the lower Mississippi delta region: Results from the Foods of Our Delta Study. J Am Diet Assoc 104(2):199–207.
Cohen RA, Bloom B. 2005. Trends in health insurance and access to medical care for children under age 19 years: United States, 1998–2003. Advance Data from Vital and Health Statistics, No. 355. Hyattsville, MD: National Center for Health Statistics. [Online]. Available: http://www.cdc.gov/nchs/data/ad/ad355.pdf [accessed April 18, 2005].
Cole N, Fox MK. 2004. Nutrition and Health Characteristics of Low-Income Participants. Volume II, WIC Program Participants and Nonparticipants . Report No. E-FAN-04-014-2. Washington, DC: U.S. Department of Agriculture, Economic Research Service.
Cook JT, Frank DA, Berkowitz C, Black MM, Casey PH, Cutts DB, Meyers AF, Zaldivar N, Skalicky A, Levenson S, Heeren T, Nord M. 2004. Food insecurity is associated with adverse health outcomes among human infants and toddlers. J Nutr 134(6):1432–1438.
Cook S, Weitzman M, Auinger P, Nguyen M, Dietz WH. 2003. Prevalence of a metabolic syndrome phenotype in adolescents: Findings from the third National Health and Nutrition Examination Survey, 1988–1994. Arch Pediatr Adolesc Med 157(8):821–827.
Devaney B, Ziegler P, Pac S, Karwe V, Barr SI. 2004. Nutrient intakes of infants and toddlers. J Am Diet Assoc 104(1 Suppl):S14–S21.
Devaney B, Kim M, Carriquiry A, Camano-Garcia G. 2005. Assessing the Nutrient Intakes of Vulnerable Subgroups. Washington, DC: Economic Research Service, U.S. Department of Agriculture.
DHHS (U.S. Department of Health and Human Services). 2000a. Healthy People 2010: Understanding and Improving Health. Washington, DC: DHHS.
DHHS. 2000b. Oral Health in America: A Report of the Surgeon General. Rockville, MD: DHHS, National Institute of Dental and Craniofacial Research, National Institutes of Health.
DHHS. 2003. National Healthcare Disparities Report. Rockville, MD: DHHS, Agency for Healthcare Research and Quality.
DHHS and USDA (U.S. Department of Agriculture). 2004. Nutrition and Your Health: Dietary Guidelines for Americans. 2005 Dietary Guidelines Advisory Committee Report. [Online]. Available: http://www.health.gov/dietaryguidelines/dga2005/report/ [accessed August 10, 2004].
DHHS and USDA. 2005. Dietary Guidelines for Americans 2005. [Online]. Available: http://www.healthierus.gov/dietaryguidelines [accessed January 12, 2005].
Dye BA, Shenkin JD, Ogden CL, Marshall TA, Levy SM, Kanellis MJ. 2004. The relationship between healthful eating practices and dental caries in children ages 2–5 years in the United States, 1988–1994. J Am Dent Assoc 135(1):55–66.
Enns CW, Mickle SJ, Goldman JD. 2002. Trends in food and nutrient intakes by children in the United States. Fam Econ Nutr Rev 14(2):56–68.
Enns CW, Mickle SJ, Goldman JD. 2003. Trends in food and nutrient intakes by adolescents in the United States. Fam Econ Nutr Rev 15(2):15–27.
Ervin RB, Wright JD, Reed-Gillette D. 2004. Prevalence of leading types of dietary supplements used in the Third National Health and Nutrition Examination Survey, 1988–94. Advance Data from Vital and Health Statistics, No. 349. Hyattsville, MD: National Center for Health Statistics.
Evans GW. 2004. The environment of child poverty. American Psychologist 59(2):77–92.
Federal Interagency Forum on Child and Family Statistics. 2004. America’s Children in Brief: Key National Indicators of Well-Being, 2004. Washington, DC: U.S. Government Printing Office. [Online]. Available: http://childstats.gov [accessed March 8, 2005].
Fisher JO, Mitchell DC, Smiciklas-Wright H, Mannino ML, Birch LL. 2004. Meeting calcium recommendations during middle childhood reflects mother–daughter beverage choices and predicts bone mineral status. Am J Clin Nutr 79(4):698–706.
Flegal KM, Troiano RP. 2000. Changes in the distribution of body mass index of adults and children in the US population. Int J Obes 24(7):807–818.
Food Research Action Center. 2005. State of the States: 2005. A Profile of Food and Nutrition Programs Across the Nation. [Online]. Available: http://www.frac.org/State_Of_States/2005/Report.pdf [accessed March 9, 2005].
Fox MK, Cole N. 2004. Nutrition and Health Characteristics of Low-Income Populations. Vol III, School-age Children. Report No. E-FAN-04-014-3. Washington, DC: Economic Research Service, U.S. Department of Agriculture.
Fox MK, Pac S, Devaney B, Jankowski L. 2004. Feeding Intakes and Toddlers Study: What foods are infants and toddlers eating? J Am Diet Assoc 104(1 Suppl):S22–S30.
French SA, Lin BL, Guthrie JF. 2003. National trends in soft drink consumption among children and adolescents age 6 to 17 years: Prevalence, amounts, and sources, 1977/ 1978 to 1994/1998. J Am Diet Assoc 103(10):1326–1331.
Frongillo EA. 2003. Understanding obesity and program participation in the context of poverty and food insecurity. J Nutr 133(7):2117–2118.
Ganji V, Hampl JS, Betts NM. 2003. Race-, gender- and age-specific differences in dietary micronutrient intakes of US children. Int J Food Sci and Nutr 54(6):485–490.
Gartner LM, Greer FR, Section on Breastfeeding and Committee on Nutrition, American Academy of Pediatrics. 2003. Prevention of rickets and vitamin D deficiency: New guidelines for vitamin D intake. Pediatrics 111(4):908–910.
Gibson D. 2004. Long-term food stamp program participation is differentially related to overweight in young girls and boys. J Nutr 134(2):372–379.
Gift HC, Drury TF, Nowjack-Raymer RE, Selwitz RH. 1996. The state of the nation’s oral health: Mid-decade assessment of Healthy People 2000. J Public Health Dent 56(2): 84–91.
Gleason P, Suitor C. 2001. Children’s Diets in the Mid-1990s: Dietary Intake and Its Relationship with School Meal Participation. Report No. CN-01-CD1. Alexandria, VA: U.S. Department of Agriculture.
Goodman E. 1999. The role of socioeconomic status gradients in explaining differences in US adolescents’ health. Am J Public Health 89(10):1522–1528.
Guthrie JF, Morton JF. 2000. Food sources of added sweeteners in the diets of Americans. J Am Diet Assoc 100(1):43–48, 51.
Guthrie JF, Lin B, Frazão E. 2002. Role of food prepared away from home in the American diet, 1977–78 versus 1994–96: Changes and consequences. J Nutr Educ Behav 34(3): 140–150.
Haffner SM, Valdez RA, Hazuda HP, Mitchell BD, Morales PA, Stern MP. 1992. Prospective analysis of the insulin-resistance syndrome (syndrome X). Diabetes 41(6):715–722.
Haley S, Reed J, Lin B-H, Cook A. 2005. Sweetener Consumption in the United States. Report No. SSS-243-01. Washington, DC: Economic Research Service, U.S. Department of Agriculture.
Hedley AA, Ogden CL, Johnson CL, Carroll MD, Curtin LR, Flegal KM. 2004. Prevalence of overweight and obesity among US children, adolescents, and adults, 1999–2002. J Am Med Assoc 291(23):2847–2850.
Hetzel BS, Clugston GA. 1999. Iodine. In: Shils ME, Olson JA, Shike M, Ross AC, eds. Modern Nutrition in Health and Disease. 9th ed. Baltimore, MD: Williams and Wilkins. Pp. 253–263.
Hofferth S, Curtin S. 2005. Poverty, food programs, and childhood obesity. J Policy Analysis Management 24(4):703–726.
Honein MA, Paulozzi LJ, Mathews TJ, Erickson JD, Wong LY. 2001. Impact of folic acid fortification of the US food supply on the occurrence of neural tube defects. J Am Med Assoc 285(23):2981–2986.
Huang TT, McCrory MA. 2005. Dairy intake, obesity, and metabolic health in children and adolescents: Knowledge and gaps. Nutr Rev 63(3):71–80.
Huang TT, Howarth NC, Lin BH, Roberts SB, McCrory MA. 2004. Energy intake and meal portions: Associations with BMI percentile in U.S. children. Obes Res 12(11):1875–1885.
IOM (Institute of Medicine). 1997. Dietary Reference Intakes for Calcium, Phosphorus, Magnesium, Vitamin D, and Fluoride. Washington, DC: National Academy Press.
IOM. 1998. Dietary Reference Intakes for Thiamin, Riboflavin, Niacin, Vitamin B6, Folate, Vitamin B12, Pantothenic Acid, Biotin, and Choline. Washington, DC: National Academy Press.
IOM. 2001. Dietary Reference Intakes for Vitamin A, Vitamin K, Arsenic, Boron, Chromium, Copper, Iodine, Iron, Manganese, Molybdenum, Nickel, Silicon, Vanadium, and Zinc. Washington, DC: National Academy Press.
IOM. 2002–2005. Dietary Reference Intakes for Energy, Carbohydrate, Fiber, Fat, Fatty Acids, Cholesterol, Protein, and Amino Acids (Macronutrients). Washington, DC: The National Academies Press.
IOM. 2003. Dietary Reference Intakes: Guiding Principles for Nutrition Labeling and Fortification. Washington, DC: The National Academies Press.
IOM. 2005a. Dietary Reference Intakes for Water, Potassium, Sodium, Chloride, and Sulfate. Washington, DC: The National Academies Press.
IOM. 2005b. Preventing Childhood Obesity: Health in the Balance. Washington, DC: The National Academies Press.
IOM. 2005c. The WIC Food Package: Time for a Change. Washington, DC: The National Academies Press.
Isomaa B, Almgren P, Tuomi T, Forsen B, Lahti K, Nissen M, Taskinen MR, Groop L. 2001. Cardiovascular morbidity and mortality associated with the metabolic syndrome. Diabetes Care 24(4):683–689.
Jahns L, Siega-Riz AM, Popkin BM. 2001. The increasing prevalence of snacking among US children from 1977 to 1996. J Pediatr 138(4):493–498.
Jones SJ, Jahns L, Laraia BA, Haughton B. 2003. Lower risk of overweight in school-aged food insecure girls who participate in food assistance. Results from the panel study of income dynamics child development supplement. Arch Pediatr Adolesc Med 157(8): 780–784.
Kaiser LL, Melgar-Quinonez HR, Lamp CL, Johns MC, Sutherlin JM, Harwood JO. 2002. Food security and nutritional outcomes of preschool-age Mexican-American children. J Am Diet Assoc 102(7):924–929.
Kant AK. 2004. Reported consumption of low-nutrient-density foods by American children and adolescents. National and health correlates, NHANES III, 1988 to 1994. Arch Pediatr Adolesc Med 157(8):789–796.
Kant AK, Graubard BI. 2003. Predictors of reported consumption of low-nutrient-density foods in a 24-h recall by 8–16 year old US children and adolescents. Appetite 41(2): 175–180.
Kenney GM, McFeeters JR, Yee JY. 2005. Preventive dental care and unmet dental needs among low-income children. Am J Public Health 95(8):1360–1366.
Kranz S, Siega-Riz AM, Herring AH. 2004. Changes in diet quality of American preschoolers between 1977 and 1998. Am J Public Health 94(9):1525–1530.
Kranz S, Mitchell DC, Siega-Riz AM, Smiciklas-Wright H. 2005a. Dietary fiber intake by American preschoolers is associated with more nutrient-dense diets. J Am Diet Assoc 105(2):221–225.
Kranz S, Smiciklas-Wright H, Siega-Riz AM, Mitchell D. 2005b. Adverse effect of high added sugar consumption on dietary intake in American preschoolers. J Pediatr 146(1): 105–111.
Lakka HM, Laaksonen DE, Lakka TA, Niskanen LK, Kumpusalo E, Tuomilehto J, Salonen JT. 2002. The metabolic syndrome and total and cardiovascular disease mortality in middle-aged men. J Am Med Assoc 288(21):2709–2716.
Land KC. 2005. The Foundation for Child Development Index of Child Well-Being (CWI), 1975–2003, with Projections for 2004. Durham, NC: Duke University.
Ledikwe JH, Blanck HM, Khan LK, Serdula MK, Seymour JD, Tohill BC, Rolls BJ. 2005. Dietary energy density determined by eight calculation methods in a nationally representative United States population. J Nutr 135(2):273–278.
Lin B. 2005. Nutrition and Health Characteristics of Low-Income Populations: Healthy Eating Index. Agriculture Information Bulletin 796-1. Washington, DC: Economic Research Service, U.S. Department of Agriculture.
Lin B, Guthrie J, Frazao E. 1999. Quality of children’s diets at and away from home: 1994–96. Food Review 22(1):2–10.
Livingstone MBE, Robson PJ. 2000. Measurement of dietary intake in children. Proc Nutr Soc 59(2):279–293.
Looker AC, Dallman PR, Carroll MD, Gunter EW, Johnson CL. 1997. Prevalence of iron deficiency in the United States. J Am Med Assoc 277(12):973–976.
Mahoney LT, Burns TL, Stanford W, Thompson BH, Witt JD, Rost CA, Lauer RM. 1996. Coronary risk factors measured in childhood and young adult life are associated with coronary artery calcification in young adults: The Muscatine Study. J Am Coll Cardiol 27(2):277–284.
Matheson DM, Varady J, Varady A, Killen JD. 2002. Household food security and nutritional status of Hispanic children in the fifth grade. Am J Clin Nutr 76(1):210–217.
McGill HC Jr, McMahan CA, Herderick EE, Zieske AW, Malcom GT, Tracy RE, Strong JP. 2002. Obesity accelerates the progression of coronary atherosclerosis in young men. Circulation 105(23):2712–2718.
Moshfegh A, Goldman J, Cleveland L. 2005. What We Eat in America, NHANES 2001–2002: Usual Nutrient Intakes from Food Compared to Dietary Reference Intakes. USDA Agricultural Research Service. [Online]. Available: http://www.ars.usda.gov/SP2UserFiles/Place/12355000/pdf/usualintaketables2001-02.pdf [accessed October 4, 2005].
Mrdjenovic G, Levitsky DA. 2003. Nutritional and energetic consequences of sweetened drink consumption in 6- to 13-year-old children. J Pediatr 142(6):604–610.
Murphy M, Douglass J, Latulippe M, Barr S, Johnson R, Frye C. 2005. Beverages as a source of energy and nutrients in diets of children and adolescents. Experimental Biology Meeting, San Diego, April 1–5. Abstract 275.4. FASEB J 19(4):A434.
National SAFE KIDS Campaign. 2003, May. Report to the Nation: Trends in Unintentional Childhood Injury Mortality, 1987–2000. [Online]. Available: http://www.usa.safekids.org/content_documents/nskw03_report.pdf [accessed July 22, 2005].
Nicklas TA, Demory-Luce D, Yang SJ, Baranowski T, Zakeri I, Berenson G. 2004a. Children’s food consumption patterns have changed over two decades (1973–1994): The Bogalusa Heart Study. J Am Diet Assoc 104(7):1127–1140.
Nicklas TA, Morales M, Linares A, Yang SJ, Baranowski T, De Moor C, Berenson G. 2004b. Children’s meal patterns have changed over a 21-year period: The Bogalusa Heart Study. J Am Diet Assoc 104(5):753–761.
Nielsen SJ, Popkin BM. 2003. Patterns and trends in food portion sizes, 1977–1998. J Am Med Assoc 289(4):450–453.
Nielsen SJ, Popkin BM. 2004. Changes in beverage intake between 1997 and 2001. Am J Prev Med 27(3):205–210.
Nielsen SJ, Siega-Riz AM, Popkin BM. 2002a. Trends in energy intake in U.S. between 1977 and 1996: Similar shifts seen across age groups. Obes Res 10(5):370–378.
Nielsen SJ, Siega-Riz AM, Popkin BM. 2002b. Trends in food locations and sources among adolescents and young adults. Prev Med 35(2):107–113.
NIH (National Institutes of Health). 2001. Osteoporosis: Prevention, diagnosis, and therapy. J Am Med Assoc 285(6):785–795.
Nord M, Andrews M, Carlson S. 2005. Household Food Security in the United States, 2004. Economic Research Report Number 11. Washington, DC: U.S. Department of Agriculture, Economic Research Service.
NRC (National Research Council). 1989. Recommended Dietary Allowances. 10th ed. Washington, DC: National Academy Press.
NRC and IOM. 2004. Children’s Health, the Nation’s Wealth. Washington, DC: The National Academies Press.
Ogden CL, Carroll MD, Flegal KM. 2003. Epidemiologic trends in overweight and obesity. Endocrinol Metab Clin North Am 32(4):741–760, vii.
Ogden CL, Fryar CD, Carroll MD, Flegal KM. 2004. Mean body weight, height and body mass index, United States, 1960–2002. Advance Data from Vital and Health Statistics, No. 347. Hyattsville, MD: National Center for Health Statistics. [Online]. Available: http://www.cdc.gov/nchs/data/ad/ad347.pdf [accessed March 20, 2005].
Park YK, Sempos CT, Barton CN, Vanderveen JE, Yetley EA. 2000. Effectiveness of food fortification in the United States: The case of pellagra. Am J Public Health 90(5): 727–738.
Park YK, Meier ER, Bianchi P, Song WO. 2002. Trends in children’s consumption of beverages: 1987 to 1998. Fam Econ Nutr Rev 14(2):69–79.
Pfeiffer CM, Caudill SP, Gunter EW, Osterloh J, Sampson EJ. 2005. Biochemical indicators of B vitamin status in the US population after folic acid fortification: Results from the National Health and Nutrition Examination Survey 1999–2000. Am J Clin Nutr 82(2): 442–450.
Pollitt E. 1993. Iron deficiency and cognitive function. Annu Rev Nutr 13:521–537.
Rajeshwari R, Yang SJ, Nicklas TA, Berenson GS. 2005. Secular trends in children’s sweetened-beverage consumption (1973 to 1994): The Bogalusa Heart Study. J Am Diet Assoc 105(2):208–214.
Rolls BJ, Ello-Martin JA, Tohill BC. 2004. What can intervention studies tell us about the relationship between fruit and vegetable consumption and weight management? Nutr Rev 62(1):1–17.
Sherry B, Mei Z, Yip R. 2001. Continuation of the decline in prevalence of anemia in low-income infants and children in five states. Pediatrics 107(4):677–682.
Sherry B, Mei Z, Scanlon KS, Mokdad AH, Grummer-Strawn LM. 2004. Trends in state-specific prevalence of overweight and underweight in 2- through 4-year-old children from low-income families from 1989 through 2000. Arch Pediatr Adolesc Med 158(12): 1116–1124.
Shils M, Shike M, Olson J, Ross AC. 1999. Modern Nutrition in Health and Disease. Baltimore, MD: Williams & Wilkins.
Siega-Riz AM, Popkin BM, Carson T. 1998. Trends in breakfast consumption for children in the United States from 1965 to 1991. Am J Clin Nutr 67(4S):748S–756S.
Skinner JD, Ziegler P, Pac S, Devaney B. 2004a. Meal and snack patterns of infants and toddlers. J Am Diet Assoc 104(1 Suppl 1):S65–S70.
Skinner JD, Ziegler P, Ponza M. 2004b. Transitions in infants’ and toddlers’ beverage patterns. J Am Diet Assoc 104(1 Suppl 1):S45–S50.
Smiciklas-Wright H, Mitchell DC, Mickle SJ, Goldman JD, Cook A. 2003. Foods commonly eaten in the United States, 1989–1991 and 1994–1996: Are portion sizes changing? J Am Diet Assoc 103(1)41–47.
Storey ML, Forshee RA, Anderson PA. 2004. Associations of adequate intake of calcium with diet, beverage consumption, and demographic characteristics among children and adolescents. J Am Coll Nutr 23(1):18–33.
Story M, Holt K, Sofka D, eds. 2003. Bright Futures in Practice: Nutrition. 2nd ed. Arlington, VA: National Center for Education in Maternal and Child Health. [Online]. Available: http://www.brightfutures.org/nutrition/index.html [accessed August 22, 2005].
Strauss RS, Knight J. 1999. Influence of the home environment on the development of obesity in children. Pediatrics 103(6):E85.
Strauss RS, Pollack HA. 2001. Epidemic increase in childhood overweight, 1986–1998. J Am Med Assoc 286(22):2845–2848.
Subar AF, Krebs-Smith SM, Cook A, Kahle LL. 1998. Dietary sources of nutrients among US children, 1989–1991. Pediatrics 102(4 Pt 1):913–923.
Suitor CW, Gleason PM. 2002. Using Dietary Reference Intake-based methods to estimate the prevalence of inadequate nutrient intake among school-aged children. J Am Diet Assoc 102(4):530–536.
Templeton S. 2005. Sugar intake from combined school lunch and competitive food consumption. J Am Diet Assoc 105(7):1066–1067.
Templeton SB, Marlette MA, Panemangalore M. 2005. Competitive foods increase the intake of energy and decrease the intake of certain nutrients by adolescents consuming school lunch. J Am Diet Assoc 105(2):215–220.
Troiano RP, Flegal KM. 1998. Overweight children and adolescents: Description, epidemiology, and demographics. Pediatrics 101(3 Pt 2):497–504.
Troiano RP, Briefel RR, Carroll MD, Bialostosky K. 2000. Energy and fat intakes of children and adolescents in the United States: Data from the National Health and Nutrition Examination Surveys. Am J Clin Nutr 72(5 Suppl):1343S–1353S.
USDA (U.S. Department of Agriculture). 1992. The Food Guide Pyramid. A Guide to Daily Food Choice. Home and Garden Bulletin 252. Washington, DC: USDA Human Nutrition Information Service.
USDA. 1996. The Food Guide Pyramid. Center for Nutrition Policy and Promotion. Washington, DC: U.S. Government Printing Office.
USDA. 1999. Food and Nutrient Intakes by Children, 1994–96, 1998, Table Set 17. Food Surveys Research Group, Agricultural Research Service. [Online]. Available: http://www.barc.usda.gov/bhnrc/foodsurvey/home.htm [accessed January 4, 2005].
USDA. 2003a. Federal Register Notice on Technical Revisions to the Food Guide Pyramid. Table 2: Energy Levels for Proposed Food Intake Patterns. Center for Nutrition Policy and Promotion. [Online]. Available: http://www.cnpp.usda.gov/pyramid-update/FGP%20docs/TABLE%202.pdf [accessed March 28, 2005].
USDA. 2003b. The Food Guide Pyramid for Young Children. Center for Nutrition Policy and Promotion. [Online]. Available: http://www.usda.gov/cnpp/KidsPyra/LittlePyr.pdf [accessed February 24, 2005].
USDA. 2005a. Interactive Healthy Eating Index. [Online]. Available: http://209.48.219.53/Default.asp [accessed July 6, 2005].
USDA. 2005b. MyPyramid: Steps to a Healthier You. [Online]. Available: http://www.mypyramid.gov/ [accessed April 25, 2005].
USDA. 2005c. The Food Assistance Landscape. Food Assistance and Nutrition Research Report No. 28-6. [Online]. Available: http://www.ers.usda.gov/publications/fanrr28-6/fanrr28-6.pdf [accessed April 24, 2005].
USDA. 2005d. USDA Healthy Eating Index. [Online]. Available: http://www.cnpp.usda.gov/healthyeating.html [accessed July 6, 2005].
Wang G, Dietz WH. 2002. Economic burden of obesity in youths aged 6 to 17 years: 1979–1999. Pediatrics 109(5):e81.
Weinberg, LG, Berner LA, Groves JE. 2004. Nutrient contributions of dairy foods in the United States, continuing survey of food intakes by individuals, 1994–1996, 1998. J Am Diet Assoc 104(6):895–902.
Weisberg P, Scanlon KS, Li R, Cogswell ME. 2004. Nutritional rickets among children in the United States: Review of cases reported between 1986 and 2003. Am J Clin Nutr 80(6 Suppl):1697S–1705S.
Williams J, Wake M, Hesketh K, Maher E, Waters E. 2005. Health-related quality of life of overweight and obese children. J Am Med Assoc 293(1):70–76.
Winkleby MA, Robinson TN, Sundquist J, Kraemer HC. 1999. Ethnic variation in cardiovascular disease risk factors among children and young adults: Findings from the Third National Health and Nutrition Examination Survey, 1988–1994. J Am Med Assoc 281(11):1006–1013.
Wise PH. 2004. The transformation of child health in the United States. Health Affairs 23(5):9–25.
Wyshak G. 2000. Teenaged girls, carbonated beverage consumption, and bone fractures. Arch Pediatr Adolesc Med 154(6):610–613.


