
Appendix F
Commissioned Paper
Improving the Quality of Quality Measurement
John D. Birkmeyer, Eve A. Kerr, and Justin B. Dimick
INTRODUCTION
With growing recognition that the quality of medical care varies widely across physicians, hospitals, and health systems, good measures of performance are in high demand. Patients and their families are looking to make informed decisions about where and by whom to get their care (Lee et al., 2004). Employers and payers need measures on which to base their contracting decisions and pay for performance initiatives (Galvin and Milstein, 2002). Finally, clinical leaders need measures that can help them identify “best practices” and guide their quality improvement efforts. An ever broadening array of performance measures is being developed to meet these different needs.
However, there remains considerable uncertainty about which measures are most useful. Current measures are remarkably heterogeneous, encompassing different elements of health care structure, process of care, and patient outcomes. Although each of these three types of performance measures has its unique strengths, each is also associated with conceptual, methodological, and/or practical problems. The clinical context (e.g., cancer screening vs. high risk surgery) is obviously an important consideration in weighing the strengths and weaknesses of different measures. So too is the underlying purpose of performance measurement. Measures that work well when the primary intent is to steer patients to the best hospitals or doctors (selective referral) may not be optimal for quality improvement purposes, and vice versa.
There is also disagreement about when a performance measure is “good enough.” Most would agree that a measure is good enough when acting upon
it results in a net improvement in quality. Thus, the direct benefits of implementing a particular measure cannot be outweighed by the indirect harms, e.g., resource and opportunity costs, antagonizing providers, incentivizing perverse behaviors, or negatively affecting other domains of quality. Although simple in concept, measuring these benefits and harm is often difficult and heavily influenced by which group—patients, payers, or providers—is doing the accounting.
Expanding on other recent reviews of performance measurement (Bird et al., 2005; Birkmeyer et al., 2004; Landon et al., 2003), this paper provides an overview of measures most commonly used to profile the quality of physicians, hospitals, or systems and their main limitations. We describe the trade-offs associated with structure, process, and outcome measures (see Table F-1). We address the question of “how good is good enough?” and make the case that the answer depends on the purpose of measurement—quality improvement or selective referral. Finally, we consider which measures are ready (or almost ready) for implementation right now and a research agenda aimed at improving performance measurement for the future.
OVERVIEW OF CURRENT MEASURES
A large number of performance measures has been developed for assessing health care quality. Tables F-2 and F-3 include a representative list of commonly used quality indicators and measurement sets. Almost all of these measures have been either endorsed by leading organizations in quality measurement and/or already applied in hospital accreditation, pay for performance, or public reporting efforts. A more exhaustive list of performance measures can be found on the Agency for Healthcare Research and Quality’s (AHRQ’s) National Quality Measures Clearinghouse Web site (www.qualitymeasures.ahrq.gov). Although the measures could be sorted on other dimensions, we consider them below according to whether they focus on ambulatory care (preventive care and chronic disease management) or hospital-based care (including surgery).
Ambulatory Care
Although not the only measurement set in ambulatory care, the Health Plan Employer Data and Information Set (HEDIS), developed by the National Committee on Quality Assurance is by far the most familiar (Table F-2). HEDIS measures focus largely on processes of care relating to preventive and other primary care services, but they also include measures of health plan stability, access to care, and use of services. The National Quality Forum (NQF) is endorsing a set of ambulatory care quality indicators devel-
TABLE F-1 Primary Strengths and Limitations of Structure, Process, and Outcome Measures
|
|
Structure |
Process |
Outcomes |
|
Examples |
Procedure volume, intensivists managed ICUs |
Majority of HEDIS performance measures for ambulatory care |
Risk-adjusted mortality rates for CABG from state or national registries |
|
Strengths |
Expedient, inexpensive Efficient—one measure may relate to several outcomes More predictive of subsequent performance than other measures for some procedures |
Reflect care that patients actually receive—buy-in from providers Directly actionable for quality improvement activities Don’t need risk adjustment for many measures Positive “spillover” effect to other processes |
Face validity Measurement alone may improve outcomes (i.e., Hawthorne effect) |
|
Limitations |
Limited number of measures, none for ambulatory care Generally not actionable Don’t reflect performance of individual hospitals or providers |
Sample size constraints for condition-specific measures May be confounded by patient compliance and other factors Variable extent to which process measures link to important patient outcomes Levels of metabolic control (e.g., intermediate outcomes) may not reflect quality of care |
Sample size constraints Concerns about risk adjustment with administrative data Expense of clinical data collection |
oped by other organizations based on the NQF Consensus Development Process (CDP). The set of measures under consideration includes many of the HEDIS measures, but also includes a longer list of more clinically relevant processes of care. These latter measures were developed with input from the American Medical Association’s Physician Consortium for Performance Improvement in an effort to make them more clinically meaningful. Additionally, the U.S. Department of Veterans Affairs uses a set of measures that expand upon HEDIS to regularly and intensively monitor quality of ambulatory (and some inpatient) care (Kizer et al., 2000).
TABLE F-2 Quality Indicators for Ambulatory Care from the 2005 Version of the Health Plan Employer Data and Information Set (HEDIS)
|
|
Measure |
|
Immunization |
|
|
Childhood |
Percentage of 2-year-olds with complete childhood immunizations |
|
Adolescent |
Percentage of 13-year-olds with complete adolescent immunizations |
|
Acute Illness |
|
|
Upper respiratory tract |
Percentage of children 3 months to 18 years with a diagnosis of infection upper respiratory infection who were not given antibiotics on or after 3 days from the diagnosis |
|
Pharyngitis |
Percentage of children 2 to 18 years old diagnosed with pharyngitis and given an antibiotic who received group A streptococcus testing |
|
Screening |
|
|
Colorectal cancer |
Percentage of adults 51 to 80 years old who had appropriate colorectal cancer screening |
|
Breast cancer |
Percentage of women aged 52 to 69 years old who had a mammogram within the last 2 years |
|
Cervical cancer |
Percentage of women aged 21 to 64 years old who had a Pap smear within the last 3 years |
|
Chlamydia |
Percentage of sexually active women aged 16 to 35 years old who had chlamydia testing within the last year |
|
Glaucoma |
Percentage of adults 65 years or older who received glaucoma screening in the past 2 years |
|
Chronic Disease Management |
|
|
Hypertension |
Percentage of patients with adequate blood pressure control (systolic <140 and diastolic <90) |
|
Heart attack |
1. Percentage of adults (35 years or older) discharged after heart attack with a beta-blocker 2. Percentage of adults (35 years or older) after heart attack still on a beta-blocker at 6 months |
|
Hypercholesterolemia |
Percentage of adult patients (18 to 75 years old) on cholesterol lowering medication after discharge for heart attack, coronary bypass surgery, or percutaneous coronary intervention |
|
Diabetes |
Percentage of patients age 18 through 75 with diabetes (type 1 or type 2) who met each of the recommended measures during the previous year (presented as 7 different measures):
|
|
Asthma |
Percentage of patients with persistent asthma 5 to 56 years old who are prescribed appropriate long-term medications (inhaled corticosteroids preferred but alternatives accepted) |
|
Mental Illness |
Percentage of patients 6 years and older who were hospitalized for mental illness and received appropriate follow up within 30 days |
|
|
Measure |
|
Depression |
Appropriate antidepressant medication management for depression patients 18 or older:
|
|
Low back pain |
Percentage of patients aged 18 to 50 years old who received imaging studies for low back pain (Plain X-ray, CT scan, or MRI) |
|
Smoking cessation |
Percentage of smokers 18 or older who received smoking cessation advice |
|
Influenza |
Percentage of adults 50–64 years old who received the influenza vaccine |
|
Physical activity level |
Percentage of patients age 65 or older who were asked and advised about increasing physical activity in the prior year |
|
Overall summary |
Medicare Health Outcomes Survey |
|
Access to Care |
|
|
Preventative/ambulatory services |
Percentage of adults who received a preventative/ambulatory visit during the past 3 years |
|
Primary care |
1. Percentage of children aged 1 year to 6 years with a visit during the past year 2. Percentage of children aged 7 to 19 with a visit during the past 2 years. |
|
Prenatal and postpartum care |
1. Percentage of women who received a prenatal visit during the first trimester 2. Percentage of women who received a postpartum visit within 21 to 56 days |
|
Dental care |
Percentage of patients with a dental visit in the past year |
|
Alcohol and drug dependence |
1. Percentage of patients with a diagnosis of dependency with inpatient or outpatient treatment 2. Percentage who initiated treatment (intermediate step) |
|
Claims timeliness |
Percentage of all claims for the last year paid or denied within 30 days of receipt |
|
Call answer timeliness |
Percentage of calls during business hours answered with a live voice within 30 seconds |
|
Call abandonment |
Percentage of calls made during the prior year abandoned by a caller before meeting a live voice |
|
Satisfaction with the Experience of Care |
|
|
Adult satisfaction |
Consumer Assessment of Health Plans (CAHPS®) 3.0H Adult Survey |
|
Child satisfaction |
Consumer Assessment of Health Plans (CAHPS®) 3.0H Child Survey |
|
Practitioner turnover |
Percentage of physicians leaving the health plan each year |
|
Years in business/size of plan |
Number of years in business and the total health plan membership |
|
|
Measure |
|
Use of Services |
|
|
Well-child visits |
1. Percentage of children with a well-child visit during the first 15 months of life 2. Percentage of 3-, 4-, 5-, and 6-year old children with a well-child visit within the past year |
|
Adolescent well-care visit |
Percentage of 12- to 21-year-olds with at least one primary care or OB/GYN visit during the past year |
|
Frequency of procedures |
Frequency of selected procedures that have wide regional variation |
|
Inpatient utilization |
Number of admissions for general hospital acute care |
|
Ambulatory care |
Number of ambulatory medical care visits |
|
Inpatient utilization |
Number of admissions for nonacute care (skilled nursing facilities, rehabilitation, transitional care, and respite) |
|
Postpartum care |
Number of discharges and average length of stay postpartum |
|
Births and newborns |
Number of births and average length of stay for newborns |
|
Mental health utilization |
1. Number of inpatient discharges and average length of stay 2. Percentage of members receiving services |
|
Outpatient drug utilization |
Age-specific estimates of average numbers and cost of prescription drugs for each member per month |
|
Chemical dependency utilization |
1. Number of inpatient discharges and average length of stay 2. Percentage of members receiving alcohol and other drug services |
TABLE F-3 Performance Measures for Hospital-Based Care
|
|
Endorser |
Current Users |
|||
|
NQF |
AHRQ |
JCAHO |
CMS |
Leapfrog |
|
|
Independent of Specific Diagnosis |
|||||
|
Critically ill patients |
|
||||
|
Board-certified intensivist staffing |
|
X |
|||
|
Medical or surgical inpatients |
|
||||
|
Computerized physician order entry |
|
X |
|||
|
Any surgical procedure |
|
||||
|
Appropriate antibiotic prophylaxis (correct choice; given 1 hour preoperatively; discontinued within 24 hours) |
X |
|
X |
X |
|
|
Medical Diagnoses |
|||||
|
Acute myocardial infarction |
|
||||
|
Smoking cessation counseling |
X |
|
X |
X |
|
|
|
Endorser |
Current Users |
|||
|
NQF |
AHRQ |
JCAHO |
CMS |
Leapfrog |
|
|
Aspirin at arrival (within 24 hours) |
X |
|
X |
X |
|
|
Aspirin at discharge |
X |
X |
X |
||
|
Beta-blocker at arrival and discharge |
X |
X |
X |
||
|
Thrombolytic agent (within 30 minutes) |
X |
X |
X |
||
|
Percutaneous coronary intervention (within 30 minutes) |
X |
X |
X |
X |
|
|
ACE inhibitor at discharge for patients with low left ventricular function |
X |
X |
X |
|
|
|
Risk-adjusted mortality rates |
X |
X |
X |
|
|
|
Congestive heart failure |
|
||||
|
Smoking cessation counseling |
X |
|
X |
X |
|
|
Standardized discharge instructions |
X |
X |
X |
||
|
Assessment of left ventricular function |
X |
X |
X |
||
|
ACE inhibitor at discharge for patients with low left ventricular function |
X |
X |
X |
||
|
Risk-adjusted mortality rates |
|
X |
|
||
|
Coronary artery disease |
|
||||
|
Hospital volume—Percutaneous coronary interventions |
X |
X |
|
X |
|
|
Bilateral cardiac catheterization |
|
X |
|
||
|
Gastrointestinal hemorrhage |
|
||||
|
Risk-adjusted mortality rates |
|
X |
|
||
|
Community acquired pneumonia |
|
||||
|
Smoking cessation counseling |
X |
|
X |
X |
|
|
Assessment of oxygenation at admission |
X |
X |
X |
||
|
Blood cultures prior to antibiotics |
X |
X |
X |
||
|
Antibiotics started within 4 hours |
X |
X |
X |
||
|
Appropriate initial choice of antibiotics |
X |
X |
X |
||
|
Pneumococcal screen or vaccination |
X |
X |
X |
||
|
Influenza screen or vaccination |
X |
X |
X |
||
|
Risk-adjusted mortality rates |
|
X |
|
||
|
Hip fracture |
|
||||
|
Risk-adjusted mortality rates |
|
X |
|
||
|
Asthma |
|
||||
|
Use of relievers (<18 years) |
X |
|
|||
|
Systemic steroids (<18 years) |
X |
||||
|
Acute stroke |
|
||||
|
Risk-adjusted mortality rates |
|
X |
|
||
|
|
Endorser |
Current Users |
|||
|
NQF |
AHRQ |
JCAHO |
CMS |
Leapfrog |
|
|
Obstetric Diagnoses |
|||||
|
Pregnancy and neonatal care |
|
||||
|
Rates of 3rd and 4th degree perineal lacerations |
X |
X |
X |
|
|
|
Risk-adjusted neonatal mortality |
X |
|
X |
||
|
Cesarean delivery in low risk women |
X |
X |
|
||
|
Vaginal births after cesarean delivery |
X |
X |
X |
|
|
|
Birth trauma |
|
X |
|
||
|
Hospital volume—Neonatal intensive care |
|
X |
|||
|
Neonatal immunizations after 60 days |
X |
|
|||
|
Surgical Procedures |
|||||
|
Abdominal aneurysm repair |
|
||||
|
Hospital volume |
|
X |
|
X |
|
|
Risk-adjusted mortality rates |
X |
|
|||
|
Carotid endarterectomy |
|
||||
|
Hospital volume |
|
X |
|
||
|
Esophageal resection for cancer |
|
||||
|
Hospital volume |
|
X |
|
X |
|
|
Risk-adjusted mortality rates |
X |
|
|||
|
Coronary artery bypass grafting |
|
||||
|
Hospital volume |
X |
X |
|
X |
|
|
Risk-adjusted mortality rates |
X |
X |
X |
||
|
Internal mammary artery use |
X |
|
X |
||
|
Pancreatic resection |
|
||||
|
Hospital volume |
|
X |
|
X |
|
|
Risk-adjusted mortality rates |
X |
|
|||
|
Pediatric heart surgery |
|
||||
|
Hospital volume |
|
X |
|
||
|
Risk-adjusted mortality rates |
X |
||||
|
Hip replacement |
|
||||
|
Risk-adjusted mortality rates |
|
X |
|
||
|
Craniotomy |
|
||||
|
Risk-adjusted mortality rates |
|
X |
|
||
|
Cholecystectomy |
|
||||
|
Laparoscopic approach |
|
X |
|
||
|
Appendectomy |
|
||||
|
Avoidance of incidental appendectomy |
|
X |
|
||
|
JCAHO = Joint Commission on Accreditation of Healthcare Organizations; CMS = Center for Medicare and Medicaid Services; NQF = National Quality Forum; AHRQ = Agency for Healthcare Research and Quality; Leapfrog = The Business Roundtable’s Leapfrog Group. |
|||||
Hospital-Based Care and Surgery
NQF has endorsed a set of quality indicators for hospital-based care that cover several medical specialties (Table F-3). They focus primarily on process of care variables and thus most require access to clinical data. The Joint Commission on Accreditation of Healthcare Organizations and CMS have adopted many of these quality indicators for their accreditation and pay for performance efforts, respectively. For these two efforts, hospitals are responsible for collecting and submitting the data themselves.
The AHRQ has endorsed its own set of quality measures (Table F-3). In contrast to the NQF measures, which rely on collection of clinical data, AHRQ’s Inpatient Quality Indicators were developed to take advantage of readily available administrative data. Because little information on process of care is available in these data sets, these measures focus mainly on structure and outcomes measures.
The Leapfrog group, a coalition of large employers and purchasers, has also created a set of quality indicators for its value-based purchasing initiative. Its original standards focused on three structural measures: hospital volume for high-risk surgery and neonatal intensive care; computerized physician order entry; and intensivist staffing for critical care units. Their recently updated standards have been expanded to include selected process and outcome measures. Hospitals voluntarily report their own procedure volumes and adherence to process measures. Risk-adjusted mortality rates for cardiovascular procedures are obtained from either state- or national-level clinical registries.
STRUCTURAL MEASURES OF QUALITY
Health care structure reflects the setting or system in which care is delivered. Many structural measures describe hospital-level attributes, such as the physical plant and resources or staff coordination and organization (e.g., RN–bed ratios, designation as Level I trauma center). Other structural measures reflect attributes associated with the relative expertise of individual physicians (e.g., board certification, subspecialty training or procedure volume).
Strengths
From a measurement perspective, structural measures of quality have several attractive features. First, many of these measures are strongly related to patient outcomes. For example, with esophagectomy and pancreatic resection, operative mortality rates at very-high-volume hospitals are as much as 10 percent lower, in absolute terms, than at lower volume centers (Dudley et al., 2000; Halm et al., 2002). In some instances, structural mea-
sures like procedure volume are considerably more predictive of subsequent hospital performance than any known processes of care or direct mortality measure (Figure F-1).
A second advantage is efficiency. A single structural measure may be associated with numerous outcomes. For example, with some types of cancer surgery, hospital or surgeon procedure volume is associated not only with lower operative mortality, but also with lower perioperative morbidity and higher late survival rates (Bach et al., 2001; Begg et al., 2002; Finlayson and Birkmeyer, 2003). Intensivist model ICUs are linked to shorter length of stay and reduced resource use, as well as lower mortality (Pronovost et al., 2002, 2004).
The third and perhaps most important advantage of structural variables is expediency. Many can be assessed easily with readily available administrative data. Although some structural measures require surveying hospitals or providers, such data are much less expensive to collect than measures requiring patient-level information.
Limitations
Among the downsides, there are relatively few structural measures that may be potentially useful as quality indicators. Their use in ambulatory care is particularly limited. Second, in contrast to process measures, most structural measures are not readily actionable. For example, a small hospital cannot readily make itself a high volume center, but it can increase how many of its surgical patients receive antibiotic prophylaxis. Thus, while selected structural measures may be useful for selective referral initiatives, they have limited value for quality improvement purposes.
Finally, structural measures generally describe groups of hospitals or providers with better performance, but they do not adequately discriminate performance among individuals. For example, in aggregate, high-volume hospitals have much lower mortality rates than lower volume centers for pancreatic resection. However, some individual high-volume hospitals may have high mortality rates, while some low-volume centers may have excellent performance (Shahian and Normand, 2003). In this way, structural measures are viewed as “unfair” by many providers.
PROCESS OF CARE MEASURES
Processes of care are the clinical interventions and services provided to patients. Although only occasionally applied as performance measures for surgery (e.g., appropriate use of perioperative antibiotics), process measures are the predominant quality indicators for both inpatient and outpatient medical care (Table F-2). In the latter setting, process measures
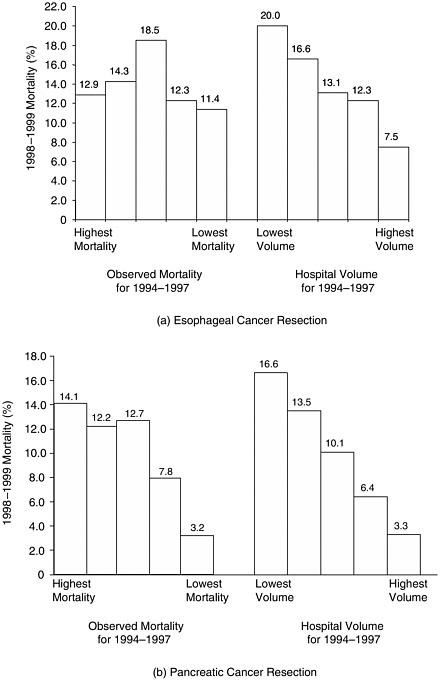
FIGURE F-1 Relative usefulness of historical (1994–1997) measures of hospital volume and operative mortality in predicting subsequent (1998–1999) mortality.
NOTE: Hospitals sorted by historical volume and mortality according to quintiles. Both historical and subsequent mortality rates are adjusted for Medicare patient characteristics.
are employed to reflect both preventive care (e.g., mammography in age-appropriate women) and chronic disease management (e.g., medication management for children with asthma; aspirin use for patients with coronary disease). Intermediate (or physiologic) outcomes (e.g., blood pressure control, glycemic control reflected by HbA1C levels) could be considered with processes or with outcomes. However, because these measures that focus on improvement of intermediate outcome control share more properties with process measures, we consider them with other process of care measures here.
Strengths
Process of care measures are the only practical way to judge performance with most types of medical care. In contrast to surgery, few structural measures are strongly linked to patient outcomes in non-procedure-based care. Processes of care and intermediate outcomes are far more common and easier to measure than the end outcomes of ultimate interest (e.g., stroke, end-stage renal disease). Since processes of care reflect the care that physicians deliver, they have face validity and enjoy greater buy-in from providers. They are usually directly actionable and thus are a good substrate for quality improvement activities.
Although risk adjustment may be important for assessing intermediate outcomes (Greenfield et al., 2002; Hofer et al., 1999; Landon et al., 2003), it is not required for many process measures. For example, aspirin therapy for patients with coronary disease is a common performance measure. Since virtually all patients with coronary disease should be offered aspirin, there is little need to collect detailed clinical data about illness severity (assuming that the small number of patients with contraindications to aspirin is equally distributed across providers).
Finally, assessing performance with process measures may have a positive “spillover effect” to other practices within the targeted clinical condition. For example, Asch and colleagues found that the quality of medical care in the Department of Veterans Affairs health system was better than in a comparable national sample of private sector hospitals (Asch et al., 2004). Differences in quality were largest for processes of care actively profiled by the VA, but also extended to processes within the same clinical areas that were not explicitly profiled.
Limitations
The reliability of some process measures is limited by sample size constraints, particularly when used to profile performance for individual physicians. Imprecision may not be a major problem for preventive care mea-
sures that apply to a large proportion of a provider’s panel. However, sample size limitations become more apparent for other process and intermediate outcome measures targeting specific conditions. For example, few individual providers see enough diabetic patients to measure laboratory test utilization or glycemic control with adequate reliability. Further, risk adjustment becomes particularly important when profiling intermediate outcomes, because it is likely that a provider’s quality profile would be adversely affected by having just a few patients in their panel with poor glycemic control, for example, even after detailed case-mix adjustment (Hofer et al., 1999).
Additionally, process measures may sometimes reflect nonclinical factors that may confound performance assessment. For example, a physician may prescribe a cholesterol-lowering medication to a patient with hypercholesterolemia, but whether she fills the prescription and continues to take the medication will be influenced by her financial status, personal preferences, and cultural factors related to compliance. Relative to clinical variables, these factors are difficult to measure and account for with risk adjustment.
Perhaps the major limitation of process of care measures is the variable extent to which they link to patient outcomes. Some measures are “tightly linked” to outcomes, confirmed by high-level scientific evidence. For example, there is no doubt that patients discharged on beta-blockers after an acute myocardial infarction have lower mortality rates. Improvement efforts aimed at increasing beta-blocker use would no doubt translate to fewer deaths. In contrast, for community-acquired pneumonia, performance measures endorsed by NQF include early assessment of oxygenation and drawing blood cultures before administration of antibiotics. Both no doubt reflect sound clinical practice, but there is little evidence to suggest either would measurably reduce mortality or other important adverse events.
Weak relationships between processes and outcomes are sometimes attributable to the manner in which process measures are assessed. For example, lipid control in high-risk patients is clearly associated with lower cardiovascular morbidity and mortality. However, assessing the results of cholesterol tests requires expensive medical record review and profiling based on control alone is plagued by problems of risk adjustment and possible perverse incentives. Instead, administrative data are often used to simply count how many cholesterol tests were obtained. While it may be appropriate to encourage hypercholesterolemia screening, a better performance measure would record how often the physician prescribed and intensified appropriate therapy (or fully informed the patient about it). Indeed, in a study evaluating the use of such measures of medication intensification, Kerr and colleagues found that although 27 percent of patients had substandard quality based on a measure of cholesterol control, only 13 percent
were classified as having substandard quality using a measure that took into account appropriate physician action in response to poor control (Kerr et al., 2003).
DIRECT OUTCOME MEASURES
Direct outcome measures reflect the “end result” of care, from a clinical perspective or as judged by the patient. Although mortality is by far the most commonly used measure, other outcomes which could be used as quality indicators include complications of care, hospital admission or readmission, and a variety of patient-centered measures of satisfaction, health status, or utility.
There are several ongoing, large-scale initiatives involving direct outcomes assessment. Although a few target one-time medical conditions (e.g., acute myocardial infarction), most relate to surgical care. A few proprietary health care rating firms and state agencies are assessing risk-adjusted mortality rates using Medicare or state-level administrative datasets. However, most of the momentum in outcomes measurement involves large clinical registries. Cardiac surgery registries in New York, Pennsylvania, and a growing number of other states are perhaps the visible examples. At the national level, the Society for Thoracic Surgeons and the American College of Cardiology have implemented systems for tracking morbidity and mortality with cardiac surgery and percutaneous coronary interventions, respectively. Although most outcomes measurement efforts have been procedure-specific (and largely limited to cardiac procedures), the National Surgical Quality Improvement Program (NSQIP) of the Department of Veterans Affairs (VA) assesses hospital-specific morbidity and mortality rates aggregated across a wide range of surgical specialties and procedures. Efforts to apply the same measurement approach outside the VA are currently under way.
Strengths
Direct outcome measures have at least two major advantages. First, direct outcome measures have obvious face validity, particularly for surgery, and thus are likely to get the greatest “buy-in” from hospitals and surgeons. Second, outcomes measurement alone may improve performance—the so-called Hawthorne effect. Surgical morbidity and mortality rates in VA hospitals have fallen dramatically since implementation of NSQIP in 1991 (Khuri et al., 2002). No doubt many surgical leaders at individual hospitals made specific organizational or process improvements after they began receiving feedback on their hospitals’ performance. However, it is very unlikely that even a full inventory of these specific changes
would explain such broad-based and substantial improvements in morbidity and mortality rates.
Limitations
Among the downsides, outcome measures are generally impractical for assessing the quality of most types of ambulatory medical care. Easily measured endpoints like mortality occur too infrequently or far downstream of the care being assessed. Patient-centered measures (e.g., health status) are much more difficult to collect and generally reflect illness severity in addition to provider quality.
Although outcome measurement is more practical and widely applied in surgery, hospital- or surgeon-specific outcome measures are severely constrained by small sample sizes. For the large majority of surgical procedures, very few hospitals (or surgeons) have sufficient adverse events (numerators) and cases (denominators) for meaningful, procedure-specific measures of morbidity or mortality. For example, Dimick and colleagues used data from the Nationwide Inpatient Sample to study 7 procedures for which mortality rates have been advocated as quality indicators by the AHRQ (Dimick et al., 2004). For 6 of the 7 procedures, a very small proportion of U.S. hospitals had adequate caseloads to rule out a mortality rate twice the national average. Although identifying poor-quality outliers is an important function of outcomes measurement, focusing on this goal alone significantly underestimates problems with small sample sizes. Discriminating among individual hospitals with intermediate levels of performance is more difficult.
Other limitations of direct outcomes assessment depend on whether outcomes are being assessed from administrative data or clinical information abstracted from medical records. For outcomes measurement based on clinical data, the major problem is expense. For example, it costs over $100,000 annually for a private-sector hospital to participate in NSQIP.
With administrative data, the adequacy of risk adjustment remains a major concern. High-quality risk adjustment may be essential for outcome measures to have face validity with providers. It may also be useful for discouraging gaming, e.g., hospitals or providers avoiding high-risk patients to optimize their performance measures. However, it is not clear how much the scientific validity of outcome measures is threatened by imperfect risk adjustment with administrative data. There is no disagreement that administrative data lack clinical detail and systematically under-represent patient comorbidities and other clinical variables related to baseline risk (Finlayson et al., 2002; Fisher et al., 1992; Iezzoni, 1997; Iezzoni et al., 1992).
Instead, lack of clarity about the importance of risk adjustment reflects uncertainty about the extent to which case-mix varies systematically across hospitals and physicians. In some clinical contexts, case mix varies markedly. In medical care, for example, physician practices may be markedly different in terms of patients’ diagnosis mix, illness severity, and socioeconomic status. Hospital case mix can vary similarly. Such factors can confound outcomes measures with even the best clinical data sources. For example, Rosenberg and colleagues found that even with identical efficiency and quality, a referral hospital with a 25 percent medical ICU transfer rate compared with another with a 0 percent transfer rate would appear to have 14 excess deaths per 1000 admissions—even after full adjustment for case mix and severity of illness (Rosenberg et al., 2003).
In contrast, for measures targeting narrower, more homogenous populations (e.g., patients undergoing the same surgical procedure), there is often surprisingly little variation in case mix. For example, we examined risk-adjusted mortality rates for hospitals performing CABG in New York State, as derived from their clinical registries. Unadjusted and adjusted hospital mortality rates were nearly identical in most years (correlations exceeding 0.90). Moreover, hospital rankings based on unadjusted and adjusted mortality were equally useful in predicting subsequent hospital performance (Figure F-2).
HOW GOOD IS GOOD ENOUGH?
Performance measures will never be perfect. Over time, analytic methods will be refined. Access to higher quality data may improve with the addition of clinical elements to administrative data sets or broader adoption of electronic medical records. However, some problems with performance measurement, including sample size limitations, are inherent and not fully correctable. Thus, clinical leaders, patient advocates, payers, and policy makers will not escape having to make decisions about when imperfect measures are good enough to act upon.
A measure should be implemented only with the expectation that acting will result in a net improvement in health quality. Thus, the direct benefits of implementing a particular measure cannot be outweighed by the indirect harms. Unfortunately, these benefits and harm are often difficult to measure and heavily influenced by the specific context and who—patients, payers, or providers—is doing the accounting. For this reason, there is no simple answer for where to “set the bar.”
Matching the Measure to the Purpose
Instead, it may be more important to ensure a good match between the performance measure and the primary goal of measurement. The right
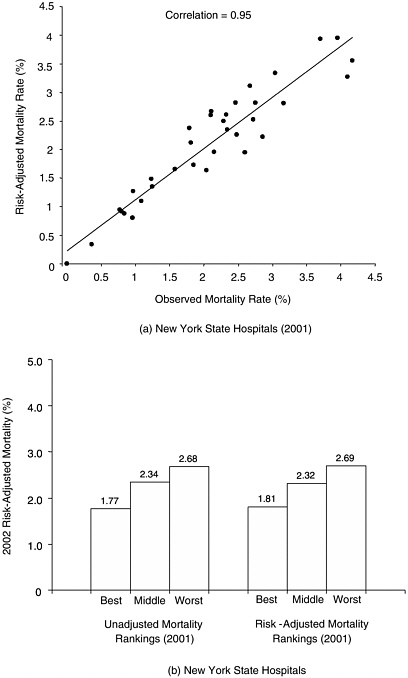
FIGURE F-2 Mortality associated with coronary artery bypass surgery in New York State hospitals, based on data from the state’s clinical outcomes registry. (a) Correlation between adjusted and observed (unadjusted) 2001 mortality rates for all New York state hospitals. (b) Relative ability of adjusted and unadjusted mortality rates to predict performance in subsequent year.
measure depends on whether the underlying goal is (1) quality improvement or (2) selective referral—directing patients to higher quality hospitals and/or providers. Although many pay-for-performance initiatives have both goals, one often predominates. For example, the ultimate objective of the CMS pay-for-performance initiative with acute myocardial infarction, pneumonia, and congestive heart failure is improving quality at all hospitals. Conversely, the Leapfrog Group’s efforts with selected surgical procedures and neonatal intensive care are primarily aimed at getting patients to hospitals likely to have better outcomes (selective referral).
For quality improvement purposes, a good performance measure—most often a process of care variable—must be actionable. Measurable improvements in the given process should translate to clinically meaningful improvements in patient outcomes. Although internally motivated quality improvement activities are rarely “harmful,” their major downsides relate to their opportunity cost. Initiatives hinged on bad measures siphon away resources (e.g., time and focus of physicians and other staff) from more productive activities.
Advocates of pay for performance believe that financial incentives and/or public reporting can motivate greater improvements from hospitals or providers. However, adding “teeth” to quality improvement also increases the potential harms if hospitals or individual providers are unfairly rewarded or punished. They may also be harmful if physicians respond by gaming (e.g., avoiding the sickest patients) or optimizing performance measures at the cost of exposing some patients to undue risks or side effects (e.g., using four antihypertensive medications to achieve ideal blood pressure control in frail elderly patients). Given the current lack of empirical information about either marginal benefits or harms, it is not clear whether measures used in pay-for-performance initiatives should have a higher (or lower) bar than those used for quality improvement at the local level.
With selective referral, a good measure will steer patients to better hospitals or physicians (or away from worse ones). As one basic litmus test, a measure based on prior performance should reliably identify providers likely to have superior performance now and in the future. At the same time, an ideal measure would not incentivize perverse behaviors (e.g., surgeons doing unnecessary procedures to meet a specific volume standard) or negatively affect other domains of quality (e.g., patient autonomy, access, and satisfaction).
Measures that work well for quality improvement may not be particularly useful for selective referral, and vice versa. For example, appropriate use of perioperative antibiotics in surgical patients is a good measure for quality improvement. This process of care is clinically meaningful, linked to lower risks of surgical site infections, and directly actionable. Conversely, antibiotic use would not be particularly useful for selective referral pur-
poses. It is unlikely patients would use this information to decide where to have surgery. More importantly, surgeons with high rates of appropriate antibiotic use may not necessarily do better with more important outcomes (e.g., mortality). Physician performance with one quality indicator is often poorly correlated with other indicators for the same or other clinical conditions (Palmer et al., 1996).
As a counterexample, the two main quality indicators for pancreatic cancer—hospital volume and operative mortality—are very informative in the context of selective referral. Patients would markedly improve their odds of surviving surgery by selecting hospitals highly ranked by either measure (Figure F-1). However, neither measure would be particularly useful for quality improvement purposes. Volume is not readily actionable; mortality rates are too unstable at the level of individual hospitals (due to small sample size problems) to identify top performers, identify best practices, or evaluate the effects of improvement activities.
Is Discrimination Important?
Many believe that a good performance measure must discriminate performance at the individual level. From the provider perspective in particular, a “fair” measure must reliably reflect the performance of individual hospitals or physicians. Unfortunately, as described earlier, small caseloads (and sometimes case-mix variation) conspire against this objective for most clinical conditions. Patients, however, should value information that improves their odds of good outcomes on average. Many measures meet this latter interest while failing on the former.
For example, Krumholz and colleagues used clinical data from the Cooperative Cardiovascular Project to assess the usefulness of Healthgrades’ hospital ratings for acute myocardial infarction (based primarily on risk-adjusted mortality rates from Medicare data) (Krumholz et al., 2002). Relative to 1-star (worst) hospitals, 5-star (best) hospitals had significantly lower mortality (16 percent vs. 22 percent, p<0.001) after risk adjustment with clinical data. They also discharged significantly more (appropriate) patients on aspirin, beta-blockers, and ACE inhibitors, all recognized quality indicators. However, the Healthgrades’ ratings poorly discriminated among any 2 individual hospitals. In only 3 percent of head-to-head comparisons did 5-star hospitals have statistically lower mortality rates than 1-star hospitals.
Thus, some performance measures which clearly identify groups of hospitals or providers with superior performance may be limited in their ability to discriminate individual hospitals from one another. There may be no simple solution to resolving the basic tension implied by performance measures that are unfair to providers yet informative for patients. However, it underscores the importance of being clear about both the primary
purpose (quality improvement or selective referral) and whose interests are receiving top priority (provider or patient).
MEASURES READY OR NEAR-READY FOR IMPLEMENTATION
As described earlier, an ever broadening array of performance measures is being developed and promoted by various scientific and advocacy groups. However, there may be a price for this comprehensiveness in performance measurement. As the list grows longer, energy and resources devoted to performance measurement become more diluted and distinctions between important and unimportant measures are blurred. Thus, we believe that a first order of business should be prioritizing measures.
Condition- or Procedure-Specific Measures
Table F-4 lists several measures for ambulatory and hospital-based care that should receive high priority, based on consideration of issues outlined earlier in this paper and input from various experts in the field. While none of these quality indicators is perfect, all have a solid evidence base linking them to clinically important patient outcomes. Better performance with these measures would have important public health benefits—either because they apply to large populations at risk (e.g., use of statins for high-risk patients) or because they imply significant risk reductions for individual patients (e.g., high-risk surgical procedures). As described earlier, some of these measures are better applied in quality improvement efforts; others are more useful for selective referral.
Any short list of performance measures should be expected to evolve over time. New quality indicators should be added as clinical researchers identify new high leverage processes of care for specific conditions. Existing measures may also be dropped as a byproduct of success in quality improvement initiatives. For example, aspirin use in patients with acute myocardial infarction will become less useful as a performance measure as hospitals near 100 percent compliance. Even if few measures became “obsolete,” rotating conditions and measures might be a useful approach to renewing interest in quality improvement initiatives while minimizing data collection burdens.
Broader Measures of Performance
In addition to condition- and procedure-specific performance measures, there is also interest in broader measures of quality for profiling health plans and organizations. At present, summary scores based on HEDIS measures may be the best tool for assessing quality with administrative data.
TABLE F-4 High Leverage Measures Ready or Near Ready for Implementation in Quality Improvement of Selective Referral Initiatives
|
|
Quality Improvement |
Selective Referral |
|
Ambulatory Care |
||
|
Summary quality measures (e.g., HEDIS, Rand QA Tools) |
X |
X |
|
Colorectal cancer screening |
X |
|
|
Reducing cardiovascular events and death |
||
|
Blood pressure control or use of appropriate number of medications to control blood pressure |
X |
|
|
Use of cholesterol-lowering medications (statins) |
X |
|
|
Long-acting asthma medications (e.g., inhaled steroids) in adults and children with asthma |
X |
|
|
Childhood immunizations (including influenza, pneumococcal, and varicella vaccination) |
|
|
|
Hospital-Based Care |
||
|
Intensivist-staffed ICUs |
|
X |
|
Acute myocardial infarction |
||
|
Time to thrombolysis or PCI |
X |
|
|
Appropriate use of aspirin, beta-blockers, and ACE inhibitors |
X |
|
|
Risk-adjusted mortality rates, CABG |
X |
X |
|
Procedure volume, pancreatic resection and esophagectomy |
|
X |
|
Perioperative beta-blockage during noncardiac surgery (high-risk patients) |
X |
|
These measures incorporate data from a wide range of clinical conditions and have the added advantage of familiarity. RAND’s QA Tools measurement system is similarly broad in clinical scope, but scoring is based instead on clinical-level data (McGlynn et al., 2003a). The use of clinical data allows for more clinically meaningful process measures, with the primary downside of higher data collection costs.
The VA’s NSQIP system provides broad measures of risk-adjusted morbidity and mortality at the hospital level and is marketed heavily to private-sector hospitals by the American College of Surgeons. To date, dissemination of NSQIP has been slowed by the relatively high cost of hospital participation. NSQIP does not currently collect process of care measures and its performance measures are not procedure-specific, limiting its usefulness as a platform for quality improvement. Both problems might be addressed in future versions. As with other national measurement efforts led by physician organizations (e.g., cardiac surgery and cardiology), NSQIP is based on confidential data reporting and performance feedback and thus not useful for public reporting and selective referral purposes.
A RESEARCH AGENDA FOR IMPROVING PERFORMANCE MEASUREMENT
Although some of the limitations of specific performance measures are inherent, many measures could be substantially improved with better data sources and analytic methods. More broadly, performance measurement could be improved by the development of measures for often overlooked domains of quality. Although others have outlined a more comprehensive research agenda for improving performance measurement (Leatherman et al., 2003; McGlynn et al., 2003b), we describe below a few obvious areas in which progress is needed.
Getting to Better Data
The usefulness of many performance measures is limited by the quality or availability of appropriate data sources. Billing or other administrative data are ubiquitous, relatively inexpensive to use, and adequately robust for many performance measures. However, they often lack sufficient clinical specificity to define relevant patient subgroups (i.e., the denominator of patients appropriate for a given process measure), to conduct adequate risk adjustment, and to detect and discourage physicians from gaming measures. Although data obtained from medical records can often meet these needs, clinical data for performance measurement are very expensive and not widely available.
Future research should address how to meet the minimum data quality needs for various performance measures in the most cost-efficient manner possible. As a start, researchers might identify those measures for which current administrative data sets are sufficient. As described earlier, risk adjustment may not be as important as commonly assumed, particularly for outcome measures applied to relatively homogenous populations. To identify such instances, researchers could use existing clinical registries to highlight procedures or conditions for which adjusted and unadjusted mortality rates are sufficiently correlated.
Where better data are needed, future research could also explore the merits of two alternative approaches. The first would be to improve the accuracy and detail of administrative data by adding a small number of “clinical” variables to the billing record. These could include either specific process of care variables, laboratory values, or information most essential for risk adjustment purposes. With the latter, for example, Hannan and colleagues noted that risk adjustment models derived from administrative data for CABG would approximate the reliability of those from clinical data with the addition of only three variables (ejection fraction, reoperation, and left main stenosis). Similarly, information about laboratory values and
medication prescriptions could facilitate construction of more clinically meaningful process measures (Hannan et al., 2003).
The second approach would be to reduce the costs of collecting clinical data. Although such costs may decline over time as medical records become electronic, this transition does not appear imminent at present at most U.S. hospitals. In the meantime, costs could be minimized by limiting data collection to only those elements necessary for process assessment and/or adequate risk adjustment. In some cases, these could be captured through extractable data fields in existing record systems. For example, blood pressure, which is routinely collected, could be recorded in an easily extractable manner. In many cases, sampling methods could be employed instead of full enumeration. Thus, rather than gathering process of care data on all patients, such information would be collected on the smallest subset of patients necessary to achieve adequate precision. For outcome measures, clinical data could be sampled for risk adjustment purposes or to monitor for gaming, while administrative data are used to assess the complete numerator and denominator.
Getting to Better Analytic Methods
No measure of process or outcomes is perfectly reliable—each contains some degree of measurement error. As described earlier, statistical “noise” is a large component of measurement error, which is compounded by small sample sizes when performance is assessed at the physician or even hospital level. However, process and outcome measures can also be unreliable because they are influenced by patient-related variables or other factors beyond the control of the hospital or physician whose performance is being assessed. To reduce problems with reliability, research aimed at advancing techniques in multilevel modeling and empirical Bayes’ methods may help filter out noise (Gatsonis et al., 1993; Hayward and Hofer, 2001; Hofer et al., 1999; McClellan and Staiger, 2000; Miller et al., 1993). Better methods for determining how much of observed variation in a performance measure derives from provider-level factors versus patient factors may also be useful for understanding and accounting for measure reliability (Greenfield et al., 2002; Hofer et al., 1999).
Combining information across time and across dimensions of quality may be another means of developing more reliable estimates of provider performance. For example, McClellan and Staiger demonstrated the value of supplementing conventional 30-day mortality rates with information on 7-day and 1-year mortality and cardiac-related readmission rates in assessing hospital-specific mortality rates for acute myocardial infarction (McClellan and Staiger, 2000). As seen in Figure F-3, this approach yielded considerably more stable estimates of hospital performance. More importantly, the new estimates of hospital
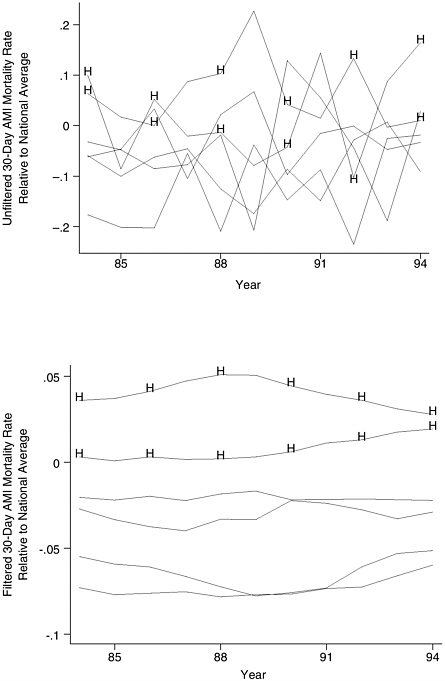
mortality were considerably more reliable in predicting subsequent hospital performance (Figure F-3). Future research could explore the effect of adding other structural variables (e.g., procedure volume for surgery) or process of care measures on the reliability of predicting future performance.
Broader Domains of Quality
For procedures, the large majority of performance measures currently reflects aspects of technical quality. Thus, they assess how well the procedure was performed, not whether it should have been performed in the first place. Prior research describing wide variation in the use of health services suggests that there may be greater variation in “decision quality” than in technical quality (Wennberg, 1996). Shared decision-making tools have been shown to reduce overuse of some procedures and may be an effective tool for improving decision quality in other areas (Sepucha et al., 2004; Wagner et al., 1995). Further research is needed to guide their broader implementation in clinical practice, to develop practical measures of decision quality, and to evaluate their usefulness as performances metrics.
In ambulatory care, performance measurement focuses primarily on individual components of care, not on how well these aspects of care are coordinated or their cumulative effects on patients’ well-being (Coleman and Berenson, 2004). Patient-centered measures may help address some of these questions. However, further research is needed to assess how well they reflect true quality of care (and not patient factors) and thus their value as performance measures.
REFERENCES
Asch SM, McGlynn EA, Hogan MM, Hayward RA, Shekelle PM, Rubenstein LM, Keesey JB, Adams JP, Kerr EA. 2004. Comparison of quality of care for patients in the Veterans Health Administration and patients in a national sample. Annals of Internal Medicine 141(12):938–945.
Bach PB, Cramer LD, Schrag D, Downey RJ, Gelfand SE, Begg CB. 2001. The influence of hospital volume on survival after resection for lung cancer. New England Journal of Medicine 345(3):181–188.
Begg CB, Riedel ER, Bach PB, Kattan MW, Schrag D, Warren JL, Scardino PT. 2002. Variations in morbidity after radical prostatectomy. New England Journal of Medicine 346(15):1138–1144.
Bird SM, Sir David C, Farewell VT, Harvey G, Tim H, Peter C. S. 2005. Performance indicators: Good, bad, and ugly. Journal of the Royal Statistical Society: Series A (Statistics in Society) 168(1):1–27.
Birkmeyer JD, Dimick JB, Birkmeyer NJO. 2004. Measuring the quality of surgical care: Structure, process, or outcomes? Journal of the American College of Surgeons 198(4):626–632.
Coleman EA, Berenson RA. 2004. Lost in transition: Challenges and opportunities for improving the quality of transitional care. Annals of Internal Medicine 141(7):533–536.
Dimick JBM, Welch HGM, Birkmeyer JDM. 2004. Surgical mortality as an indicator of hospital quality: The problem with small sample size. Journal of the American Medical Association 292(7):847–851.
Dudley RA, Johansen KL, Brand R, Rennie DJ, Milstein A. 2000. Selective referral to high-volume hospitals: Estimating potentially avoidable deaths. Journal of the American Medical Association 283(9):1159–1166.
Finlayson EV, Birkmeyer JD. 2003. Effects of hospital volume on life expectancy after selected cancer operations in older adults: A decision analysis. Journal of the American College of Surgeons 196(3):410–417.
Finlayson EV, Birkmeyer JD, Stukel TA, Siewers AE, Lucas FL, Wennberg DE. 2002. Adjusting surgical mortality rates for patient comorbidities: More harm than good? Surgery 132(5):787–794.
Fisher ES, Whaley FS, Krushat WM, Malenka DJ, Fleming C, Baron JA, Hsia DC. 1992. The accuracy of Medicare’s hospital claims data: Progress has been made, but problems remain. American Journal of Public Health 82(2):243–248.
Galvin R, Milstein A. 2002. Large employers’ new strategies in health care. New England Journal of Medicine 347(12):939–942.
Gatsonis C, Normand SL, Liu C, Morris C. 1993. Geographic variation of procedure utilization. Medical Care 31(May Supplement):YS54–YS59.
Greenfield S, Kaplan SH, Kahn R, Ninomiya J, Griffith JL. 2002. Profiling care provided by different groups of physicians: effects of patient case-mix (bias) and physician-level clustering on quality assessment results. Annals of Internal Medicine 136(2):111–121.
Halm EA, Lee C, Chassin MR. 2002. Is volume related to outcome in health care? A systematic review and methodologic critique of the literature. Annals of Internal Medicine 137(6):511–520.
Hannan EL, Kilburn H, Lindsey ML, Lewis R. 2003. Clinical versus administrative data bases for CABG surgery. Medical Care 30(10):892–907.
Hayward RA, Hofer TP. 2001. Estimating hospital deaths due to medical errors: Preventability is in the eye of the reviewer. Journal of the American Medical Association 286(4):415–420.
Hofer TP, Hayward RA, Greenfield S, Wagner EH, Kaplan SH, Manning WG. 1999. The unreliability of individual physician “report cards” for assessing the costs and quality of care of a chronic disease. Journal of the American Medical Association 281(22):2098–2105.
Iezzoni LI. 1997. The risks of risk adjustment. Journal of the American Medical Association 278(19):1600–1607.
Iezzoni LI, Foley SM, Daley J, Hughes J, Fisher ES, Heeren T. 1992. Comorbidities, complications, and coding bias. Does the number of diagnosis codes matter in predicting in-hospital mortality? Journal of the American Medical Association 267(16):2197–2203.
Kerr EA, Smith DM, Hogan MM, Hofer TP, Krein SL, Bermann M, Hayward RA. 2003. Building a better quality measure: Are some patients with ‘poor quality’ actually getting good care? Medical Care 41(10):1173–1182.
Khuri SF, Daley J, Henderson WG. 2002. The comparative assessment and improvement of quality of surgical care in the Department of Veterans Affairs. Archives of Surgery 137(1):20–27.
Kizer KW, Demakis JG, Feussner JR. 2000. Reinventing VA health care: Systematizing quality improvement and quality innovation. Medical Care 38(6 Suppl 1):7–16.
Krumholz HM, Rathore SS, Chen J, Wang Y, Radford MJ. 2002. Evaluation of a consumer-oriented Internet health care report card: The risk of quality ratings based on mortality data. Journal of the American Medical Association 287(10):1277–1287.
Landon BE, Normand S-LT, Blumenthal D, Daley J. 2003. Physician clinical performance assessment: Prospects and barriers. Journal of the American Medical Association 290(9):1183–1189.
Leatherman ST, Hibbard JH, McGlynn EA. 2003. A research agenda to advance quality measurement and improvement. Medical Care 41(January Supplement):I-80–I-86.
Lee TH, Meyer GS, Brennan TA. 2004. A middle ground on public accountability. New England Journal of Medicine 350(23):2409–2412.
McClellan MB, Staiger DO. 2000. Comparing the quality of health care providers. Frontiers in Health Policy Research 3:113–136.
McGlynn EA, Asch SM, Adams J, Keesey J, Hicks J, DeCristofaro A, Kerr EA. 2003a. The quality of health care delivered to adults in the United States. New England Journal of Medicine 348(26):2635–2645.
McGlynn EA, Cassel CK, Leatherman ST, DeCristofaro A, Smits HL. 2003b. Establishing national goals for quality improvement. Medical Care 41(1 Supplement):I-16–I-29.
Miller ME, Hui SL, Tierney WM, McDonald CJ. 1993. Estimating physician costliness: An empirical Bayes approach. Medical Care 31(May Supplement):YS16–YS28.
Palmer RH, Wright EA, Orav EJ, Hargraves JL, Louis TA. 1996. Consistency in performance among primary care practitioners. Medical Care 34(September Supplement):SS52–SS66.
Pronovost PJ, Angus DC, Dorman T, Robinson KA, Dremsizov TT, Young TL. 2002. Physician staffing patterns and clinical outcomes in critically ill patients: A systematic review. Journal of the American Medical Association 288(17):2151–2162.
Pronovost PJ, Needham D, Waters HP, Birkmeyer C, Calinawan J, Birkmeyer J, Dorman TM. 2004. Intensive care unit physician staffing: Financial modeling of the Leapfrog standard. Critical Care Medicine 32(6):1247–1253.
Rosenberg AL, Hofer TP, Strachan C, Watts CM, Hayward RA. 2003. Accepting critically ill transfer patients: adverse effect on a referral center’s outcome and benchmark measures. Annals of Internal Medicine 138(11):882–890.
Sepucha KR, Fowler FJ, Mulley AG. 2004. Policy support for patient-centered care: The need for measurable improvements in decision quality. Health Affairs Suppl Web Exclusive:VAR 54–62.
Shahian DM, Normand S-LT. 2003. The volume-outcome relationship: From Luft to Leapfrog. Annals of Thoracic Surgery 75(3):1048–1058v1.
Wagner EH, Barrett P, Barry MJ, Barlow W, Fowler FJ. 1995. The effect of a shared decisionmaking program on rates of surgery for benign prostatic hyperplasia. Medical Care 33(8):765–770.
Wennberg JE. 1996. Dartmouth Atlas of Health Care. Chicago, IL: American Hospital Publishing, Inc.


