
Appendix B
Patterns in the Ground Transportation of Research Animals in the United States
BACKGROUND
This appendix focuses on inventorying the locations of institutions that use animals for research and the locations of the vendors that breed research animals for research in order to visualize the movement of research animals in the United States.1 In addition, the appendix presents the results of a quantitative modeling effort directed towards locating additional supply points “optimally” and assessing the potential benefit of the additional supply points. All of the analyses in this appendix are focused on the transportation of research animals by truck from US breeding vendors to US research institutions; they do not consider transportation of research animals by other modes (air, sea, etc.) and transportation of research animals between research institutions or from abroad.
The next section discusses data-preparation efforts. The following two sections present a brief overview of the quantitative analysis and the empirical results of the analysis.
DATA PREPARATION
Data Sources
The three primary data sets used in this analysis are the National Institutes of Health (NIH) academic institution data from 2003, the US Department of Agriculture (USDA) species and facilities data from 2003, and data on research animal vendors. The first set, which is referred to as the NIH grants data, consists of 1020 research institutions (academic and nonacademic) in the United States that receive grant awards for research utilizing research animals. For each institution, the data include the location (city and state), the number of NIH grant awards that utilize animals in 2003, and the award amount received in 2003. This data set was used as a proxy for rodent (rats and mice) use in the United States. Unlike other species of research animals, rodent use is not reported to any federal agency, so there is no census of rodents used in biomedical research. However, it has been estimated that rodents comprise approximately 95% of the animals utilized in research (Trull and Rich, 1999). Therefore, the total dollar amount of the NIH grants awarded to each institution was used as a proxy for the relative magnitude of rodent use at that institution.
The second data set, which is referred to as the USDA data,2 contains information on 985 research institutions (academic and nonacademic), their locations, and the numbers of animals utilized in research or breeding programs, by species (cats, dogs, rabbits, guinea pigs, hamsters, pigs, sheep, other farm animals, and nonhuman primates). Those two sets of data include all warm-blooded vertebrates (with the exception of rats, mice, and birds) used in research in the United States, and those vertebrates (including rats, mice, and birds) utilized in research supported by NIH funding. The one subgroup of research animals not described in those data sets are rats, mice, and birds utilized at research institutions not supported by NIH funding. This would include most commercial research institutions, such as pharmaceutical and biotech companies. Rodent vendors have estimated that 45% of shipments are to for-profit customers, suggesting that a large portion of the facilities that utilize rodents are not represented in the data sets used for this model.
The third data set, which is referred to as the vendor data, includes the major vendors that supply research animals in the United States, the locations of production facilities, and the species they supply. Of the 45 vendors in this data set, four vendors supply cats, 16 supply dogs, 20 supply rodents (rats and mice); some vendors supply multiple species.
In addition to the three primary data sources listed above, the US Cities Geographic Information System (GIS) file provided by TransCAD® (Caliper, Inc.) was used in the analysis. The US Cities GIS file locates US cities on the basis of latitude and longitude.
Geocoding Procedure
Geocoding of research institution and vendor locations from the primary data sources was accomplished using TransCAD®. Specifically, data on the location of the institutions were matched with the city and state data fields in the US Cities GIS file to determine the geographic coordinates (latitude and longitude) of the institution or vendor locations. A TransCAD® macro was written to automate the process. Some 80% of the research institutions and all of the vendor locations were geocoded using the automated procedure. However, the US cities GIS file did not have city data fields corresponding to the remaining 20% of research institutions. For these, we used internet websites to manually determine geographic coordinates of the cities in which the research institutions were located.
Computation of Distances Between Utilization Points and Supply Locations
The geocoding of the locations of utilization points and supply locations was followed by an overlay procedure in TransCAD® in which the geocoded locations were overlaid on the TransCAD® highway file and mapped to the nearest highway network node. A TransCAD® shortest-path routine was then run to obtain distances between utilization points and supply locations.
QUANTITATIVE ANALYSIS
The objective of the quantitative analysis was to locate additional supply points optimally, with an assessment of the potential benefit of doing so. The fundamental motivation was to answer the following questions: If one additional breeding facility is being considered in the United States, where should it be to make the new total distance in the animal transportation system lowest? By how much is the new total transportation distance shorter than the former total distance? The questions could then be extended to more than one additional breeding facility. The facility-location model is thus a minimization model that considers various alternative location possibilities and determines the ones that provide the shortest transportation distance.
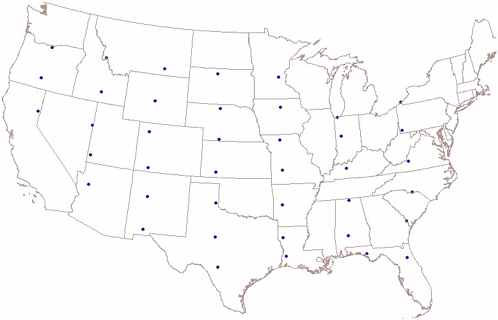
An important issue is that the solution space for identifying the best locations for new facilities is the entire United States. However, it is computationally infeasible to enumerate the objective function over all possible locations in the United States. Furthermore, for the scale of the transportation problem under study, there is no need to consider two closely spaced cities (such as Dallas and Fort Worth) as separate candidate locations. In the current analysis, the United States is divided into 40 grids, and the centroids of the grids are considered as the candidate solutions for the facility-location problem (see Figure B-1). The distances from all of the research centers to those potential facility locations are calculated with the procedure discussed above.
The minimization function in the facility-location problem is weighted to ensure that a new facility is located closer to high-utilization demand points. In the NIH grants file, the weighting was based on the total dollar amount of NIH grants. In the USDA file, the weighting for each species category was based on the total number of each species used at each utilization point.
A couple of points should be noted about the results of the quantitative modeling effort presented in the next section. First, because a spatial system that identifies 40 grids of the entire United States is used to identify candidate location sites, the city locations identified in the next section as optimal location points for additional facilities must not be taken literally. The spatial resolution adopted for the quantitative analysis implies that any location within 100-200 miles of the city locations identified in the next section would be appropriate and reasonable. Second, the locations of additional supply points are based solely on the criterion of reducing total transportation distance. Clearly, there are other factors that this model does not take into consideration, e.g., all stocks and strains of any given species are not maintained at each production facility and some vendors have established truck routes that determine which production facility will supply certain research institutions. Therefore, the locations suggested by the model in the next section should be considered in light of these complexities.
EMPIRICAL RESULTS
Three facility location models were estimated, one each for the NIH grants data set (rodents), the USDA cats data set, and the USDA dogs data set. For each of the three analyses, the optimal locations for one and two additional supply points were determined. In the analyses, the solutions for additional supply points were incremental and are not included here.
The results from the NIH grants data set (rodents) are provided in Figure B-2 and Table B-1. The current supply points are represented in the
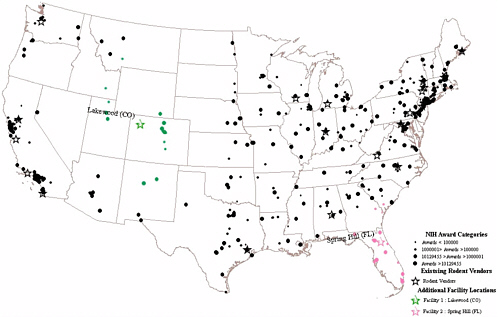
shape of stars in Figure B-2, and the current demand points (i.e., research institutions) are represented by dots, with the diameter of the dot indicating the total amount of funding received by the research institution in 2003. The “new” supply points are identified by a colored star and labeled. The figure indicates that the optimal location for one additional supply point would be Lakewood, CO, and for two additional supply points would be Lakewood, CO, and Spring Hill, FL. Table B-1 indicates the estimated reduction in total weighted travel distance in the research animal transportation system due to the addition of supply points. The reductions are substantial and show, as expected, the decreasing marginal returns with the number of additional supply points.
The corresponding results for the USDA cats data set are provided in Figure B-3 and Table B-2, and for the USDA dogs data set in Figure B-4 and Table B-3. In the figures, the diameters of the dots representing research institutions indicate the number of animals utilized at the research institution. As can be observed from Tables B-1 through B-3, the reductions in total weighted travel distance are substantial for each species.
TABLE B-1 Total Weighted-System Travel-Distance Reduction with Increase in Supply Points for NIH Grants Data Set (Rodents)
|
No. of Facilities |
Optimal Supply-Point Locations |
Total Weighted-System Travel Distance (miles) |
Incremental Percentage Change |
|
0 (base case) |
— |
13,651,385 |
— |
|
1 |
Lakewood, CO |
12,198,700 |
10.64 |
|
2 |
Lakewood, CO and Spring Hill, FL |
11,714,939 |
3.96 |
TABLE B-2 Total Weighted-System Travel-Distance Reduction with Increase in Supply Points for USDA Cats Data Set
|
No. of Facilities |
Optimal Supply-Point Locations |
Total Weighted-System Travel Distance (miles) |
Incremental Percentage Change |
|
0 (base case) |
— |
13,101,225 |
— |
|
1 |
Chico, CA |
9,108,974 |
30.47 |
|
2 |
Chico, CA and Spring Hill, FL |
6,915,744 |
24.08 |
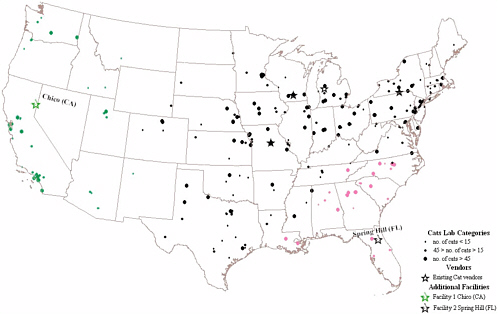
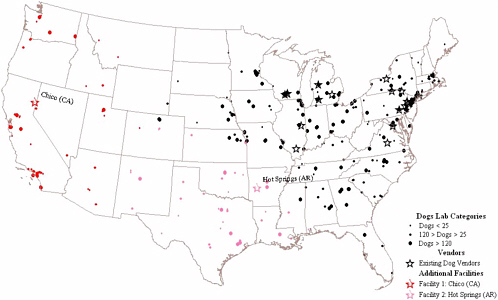
TABLE B-3 Total Weighted-System Travel-Distance Reduction with Increase in Supply Points for USDA Dogs Data Set
|
No. of Facilities |
Optimal Supply-Point Locations |
Total Weighted-System Travel Distance (miles) |
Incremental Percentage Change |
|
0 (base case) |
— |
25,387,410 |
— |
|
1 |
Chico, CA |
18,110,828 |
28.66 |
|
2 |
Chico, CA and Hot Springs, AR |
14,765,449 |
18.47 |
SUMMARY
This chapter has described the committee’s efforts to inventory and visualize the “utilization” points of research animals (the locations of institutions that use research animals) and the “supply” points of research animals (the locations of the vendors that breed research animals). Such an effort provides a qualitative sense of the patterns of transportation of research animals. In addition, the chapter presents the results of a quantitative modeling effort to locate additional supply points “optimally” and an assessment of the potential benefit of the additional supply points.
It is important to again emphasize that the locations for additional supply points developed from the quantitative analysis are based solely on the criterion of reducing total weighted travel distance in the research animal transportation system. Furthermore, because a grid system was used to identify candidate location sites and because of the scale of the research animal transportation system, any location within 100 to 200 miles of the locations identified in the analyses would be reasonable.


