
2
Global Drivers and Trajectories of Advanced Life Sciences Technologies
Advances in science and technology with biological dual-use potential are materializing worldwide at a very rapid pace. Over the next five to ten years, the United States, followed by the European Union and Japan, will likely remain the most powerful global players in the life sciences. Yet, many other nations and regions are developing new and strong scientific and technological infrastructures and capabilities, and some states are emerging as regional and global leaders in their respective fields of specialization. Brazil, China, India, and Russia are among those expected to become stronger economic, political, scientific, and technological global players in the future.
A multitude of complex and interacting economic, social, and political forces drive innovation in life sciences-related technologies and the rapid global dispersion of these technologies (e.g., the technologies described in Chapter 3). These forces, or drivers, include:
-
economic forces (i.e., labor costs,1 national investment in research and development, and shifting geographic trends in consumerism and purchasing power, as detailed in this chapter);
-
social forces (e.g., efforts by developing countries to utilize health and agricultural biotechnology and nanotechnology to improve the well-being of their populations, as well as efforts to make agricultural and other practices more environmentally “friendly”); and
-
political forces, such as the Canadian government’s commitment to devote at least five percent of its research and development investment
-
to a knowledge-based approach to develop assistance for less fortunate countries,2 the Mexican national agenda to become a regional leader in genomic medicine,3 Singapore’s plan to make biotechnology the “fourth pillar” of its economy (the other three being electronics, chemicals, and engineering),4 and the U.S. government’s current investment in biodefense.
These drivers operate globally but at varying levels of intensity, depending on national priorities and the strength of local and regional economies. This variability is particularly true of the social and political forces that drive this development. Moreover, the relative importance or strength of the different social, economic, and political drivers changes over time. Within the United States, for example, this country’s response to the anthrax mailings following the 9/11 terrorist attacks has emerged only recently as an economic driver. While biodefense spending is still tiny in comparison with the pharmaceutical market forces, it is currently contributing to the shaping of national priorities related to life sciences research. The U.S. focus on 9/11 and biodefense research has also resulted in new immigration and other policies that impact international collaborative scientific research and technological exchange and thus could have a broader impact on science and technology in this country (as discussed in Chapter 4).
In Mexico, a relatively recent national aspiration to become a regional leader in genomic medicine is driving a strongly supported effort to bolster the scientific and technological capacity to do so.5 In addition to the public health and social benefits expected of personalized health care, the Mexican government perceives the issue as one of national security and sovereignty. A Mexican-specific genomic medicine platform would minimize the country’s dependence on foreign technological aid in the future. Meanwhile, in Singapore, where similar efforts are focused on building a national genomic medicine platform, the value of genomic medicine lies in its economic potential. The country is investing billions of dollars in biotechnology, much of the money coming from the Ministry of Trade and Industry, rather than the Ministry of Health.6
Inseparable from the diverse economic, social, and political drivers described thus far, another driver—or “mega driver”—of the rapid growth and global dispersion of advanced technologies is globalization itself. In the National Intelligence Council’s most recent report on future global trends, globalization is referred to as a “mega-trend … a force so ubiquitous that it will substantially shape all the other major trends in the world of 2020.”7 Globalization encompasses the expanding international flow of:
-
capital and goods, as reflected by the growing number of multinational business collaborations and global firms in the life sciences industry, global trends in biotechnology-related patents, and the globalization of consumerism and purchasing power;
-
knowledge, as reflected by the changing higher education landscape, the intercontinental movement of students, researchers and technology experts, the growing number of scientific publications authored by researchers outside of the United States, and trends in biotechnology-related patents; and
-
people, again reflected by the changing nature of the intercontinental movement of students, researchers, and life science professionals.
The following discussion is based on these three broad categories of drivers, or mega drivers, rather than on whether a driver is classified as economic, social, or political. Accordingly, the first half of this chapter summarizes evidence and patterns that reflect the increasingly important roles of the global expansion of capital and goods, knowledge, and people in shaping the global technology landscape. In particular, we survey the pharmaceutical, biotechnology, nanobiotechnology, agricultural, and industrial sectors of the global life sciences industry (which reflect the expanding global flow in capital and goods, knowledge, and people); summarize global scientific productivity, in terms of publication and citations in international journals and other indicators and recent biotechnology patent activity (both of which reflect the expanding global flow in knowledge and people); and highlight foreign student enrollment in U.S. graduate science and technology programs (which reflects the expanding global flow of knowledge and people).
The second half of this chapter includes a snapshot of the rapidly evolving global landscape for the creation, adoption, and adaptation of the advanced technologies discussed herein. This section is not intended to be comprehensive, but to illustrate the extent to which advanced technologies are being developed and disseminated worldwide, well beyond the borders of the G88 (i.e., Canada, France, Germany, Italy, Japan, United Kingdom, United States, and the Russian Federation). Highlighted regions and countries were selected on the basis of recent known investments in life science research and applied technologies, obvious indications that the countries are expanding their science and technology foundations, and publicized country efforts to become regional centers of excellence in technologies of interest to this study.
THE GLOBAL MARKETPLACE
One of the most significant factors fueling the global dispersion of advancing technologies is the quest for profit and the desire to enter and succeed in the international marketplace. Over the next five to ten years, all sectors of the life sciences industry—most notably health care and agriculture but also food production, the industrial and environmental sector, and homeland defense and national security—are expected to continue to benefit from and thus drive the rapid growth of new biological knowledge and advanced technologies (Table 2-1). The predictions in Table 2-1 are not comprehensive but are illustrative of the wide range of future market-driven applications, or trends, and key technologies that will enable these applications. Of note, information technology stands out as being common to all sectors, trends, and goals. The dual role of information technology as an advanced technology, in and of itself, and as a driver of other advanced technologies is discussed later in this chapter.
Although North America, Europe, and Japan currently dominate the global marketplace, several other countries are poised to become regional or global leaders in the near future. Not only have new globalization strategies emerged over the past few decades, encouraging increased international collaboration and resulting in a greater number of firms operating in the global arena, but a growing number of new businesses are originating in countries outside North America, Western Europe, and Japan. The latter is evident by current trends in the number of biotech companies in Australia, Brazil, Israel, and South Korea, as detailed below. With regard to increased international collaboration, the number of technological cooperation agreements in biotechnology rapidly grew from near zero in 1970 to almost 700 in 1985-1989 (more recent data are not yet available).9 Technological cooperation agreements between firms in different countries, focusing on either production or research and development (sometimes both), provide the benefits of collaboration without the contentious issues associated with changes in long-term ownership. Although most of those agreements were between U.S. firms (34 percent), nearly as many U.S.-Japanese (10 percent) or U.S.-Western Europe (19 percent) agreements were formed during this same time period. Other agreements were between Western European and Japanese firms (3 percent), between Western European firms (24 percent), and between Japanese firms (5 percent).
International contracting among biotech and pharmaceutical firms has also increased in recent years.10 These contracts extend across national borders between firms for the production of components, supplies, and products, made possible by advances in transportation and communications technologies. Following its accession to the World Trade Organization (WTO), the national strengths possessed by India in process engineering
TABLE 2-1 Current and Near-Future Applications of Advancing Technologies
|
Sectors |
Trend |
Goal |
Key Enabling Technologies |
|
Pharmaceuticals |
Development of designer drugs (“personalized medicine”); genotype profiling |
Individual and genome-specific drugs |
Gene and protein chip (i.e., microarray), biomedical databases (i.e., information technology), computing |
|
Improved drug delivery |
Alternative routes for drug administration |
Nanotechnology, aerosol technology, microencapsulation, transdermal delivery technologies |
|
|
Medicine |
Improved diagnosis |
Automated genomic tests |
Databases, gene and protein chips |
|
Better treatments for infectious disease |
Provide cures for difficult-to-treat or untreatable infections |
Biomedical and genome databases, high-throughput screening of compound structural libraries, nanotechnology |
|
|
Gene therapy |
Identify and treat defective genes |
Databases, gene chip, high-performance computing |
|
|
Xenotransplantation |
Develop rejection-free tissues and organs for transplantation |
Databases, animal models, recombinant methods |
|
|
Agriculture |
Transgenic crops |
Development of disease, pest, and environmental insult-resistant crops; manufacture of biological products |
Genome sequencing methods, databases |
|
Biomaterials |
Artificial tissue and organs |
Develop tissue, stem cell, and other engineering methods |
Databases, transgenic crops/animals, nanotechnology |
|
Biopolymers |
New materials for biological and industrial applications |
Databases, computing, transgenic crops/animals, nanotechnology |
|
|
Biodefense |
Strengthening biodefense capabilities |
Improvement and production of vaccines and prophylactics, rapid diagnostics, pathogen detectors, and forensics |
Gene chips, databases, nanotechnology, detector hardware |
|
Computing |
Performance improvement |
Faster computing for intensive analysis and filtering; convergence of technologies |
Grid computing and supercomputers |
|
Expansion of biotech-specific applications |
Develop and strengthen biotech-specific software |
Advanced software and search algorithms |
|
|
SOURCE: Adapted from presentation by Terence Taylor, Cuernavaca workshop. |
|||
and information technology have made it a potentially very powerful partner for collaborative and outsourcing drug development and other biotechnology applications. So too is China, following its recent accession to the WTO. According to one account, over the last five years, more than 100 global companies have established research and development centers in India.11 An industry analysis by the business consulting firm Frost & Sullivan, estimated India’s pharmaceutical market to be $5.1 billion in 2004, ranking it 13th globally by value and 4th by volume.12
Industry, government, and science news reports point to recent activities throughout Asia, particularly China’s rapid entry into the global economy, as some of the strongest evidence of the global expansion of biotechnology and related businesses. According to a recent Intercontinental Marketing Services (IMS) Health report, pharmaceutical sales in China reportedly increased 28 percent to reach $9.5 billion annually. Although that figure is relatively small compared to the global pharmaceutical market of $400-450 billion, industry analysts predict that China’s large population size and flourishing economy will push the figure even higher in the future.13 Asia also boasts the emergence of several major stem cell research centers—in China, Singapore, South Korea, and Taiwan—promising not only exciting opportunities for expatriate students and scientists, but also future commercial success. At Taiwan’s Academia Sinica, most of the Ph.D.-level stem cell researchers are Taiwanese or Chinese scientists who have returned home from the United States, United Kingdom, or Australia.14 ES Cell International (Singapore), a regenerative medicine company, is banking on developing a method for transforming stem cells into insulin-producing cells for transplantation into patients with diabetes.
The Pharmaceutical Industry
Worth approximately $400-450 billion and with an annual growth of about nine percent, the pharmaceutical industry dominates the global life sciences landscape and plays a major driving role in technological development.15 (Compare this figure to those presented in Table 2-6 for the telecommunications industry, where the total telecommunications market revenue for services and equipment was estimated at U.S. $1,370 billion in 2003.) Although North America and the European Union occupy about 75 percent of the current global pharmaceutical market and enjoy annual growth rates of approximately 12 and 8 percent, respectively, the Asian, African, and Australian markets together are worth about $32 billion and enjoy an annual growth rate of 11 percent.16 According to a pharmaceutical industry overview by Frost & Sullivan, in the next 5 to 10 years
TABLE 2-2 Analysis of the Global Pharmaceutical Market
|
Region |
Annual Worth |
Market Share |
Annual Growth |
|
North America |
$204 billion |
51% |
12% |
|
Europe |
$102 billion |
25% |
8% |
|
Japan |
$47 billion |
12% |
1% |
|
Asia, Africa, Australia |
$32 billion |
8% |
11% |
|
Latin America |
$17 billion |
4% |
−10%a |
|
aThis figure reflects past trends. According to a Frost & Sullivan report, the Latin America market is expected to grow significantly in the next 5 to 10 years. SOURCE: Terence Taylor, Cuernavaca workshop, September 21, 2004. |
|||
the Asia-Pacific and Latin American markets should grow significantly and increase their presence in the global marketplace.17
The majority of the global market is targeted toward chronic diseases among the elderly (i.e., people over the age of 65). The best-selling pharmaceuticals (and their annual market value in parentheses18) are antiulcerants ($22 billion), cholesterol reducers ($22 billion), antidepressants ($27 billion), antirheumatics ($12 billion), calcium antagonists ($10 billion), antipsychotics ($10 billion), and oral antidiabetics ($8 billion).
The figures in Table 2-2 represent worldwide trends and include purchases in both developed and developing countries. The developing world market for these best-selling pharmaceuticals is expected to expand in the future, even as resource-poor countries continue to face serious public health problems associated with emerging infectious diseases. Over the next 20 years, the aging population in northwestern Europe is expected to increase by 50 to 60 percent.19 In the developing world, the same demographic is expected to increase 200 percent over the same time period.
Two likely future major pharmaceutical market trends are the use of genome-specific “designer drugs” (i.e., as part of “personalized” health care) and the use of new and improved modes of drug delivery. These trends will depend on and drive the development and global dissemination of a range of technologies, including gene and protein chip technologies, biomedical databases, computing, nanobiology, aerosol drug delivery applications, and other technologies.
Global Growth of the Biotechnology Industry
Biotechnology companies are enterprises that use a variety of tools and technologies—recombinant DNA, molecular biology and genomics,
live organisms, cells, or biological agents—to produce goods and services. In contrast to “large pharma,” the biotech industry is dominated by small to medium-sized companies. According to the Biotechnology Industry Organization (BIO), the principal U.S. trade organization for this sector, there are currently 1,473 U.S. biotech companies, of which 314 are publicly held. Corporate membership in BIO is currently over 1,000, compared to 502 in 1993. In contrast, the World Nuclear Association, a global industry organization promoting the peaceful use of nuclear energy, has about 125 members, mostly companies.
Canada ranks second in terms of the number of biotech companies and third, behind the United States and United Kingdom, in terms of generating biotech revenue, according to BIOTECanada. Although California and Massachusetts host the two largest biotechnology industries among all U.S. states and Canadian provinces, Quebec and Ontario follow with 158 and 137 companies in each province. The next largest biotech industries are in North Carolina (88), Maryland (84), British Columbia (78), and New Jersey (77).20
The number of European biotech companies grew from 720 to 1,570 between 1997 and 2001.21 EuropaBio, the principal European trade organization for bioindustry, currently represents about 1,500 small and medium-sized businesses involved in research and development, testing, manufacturing, and distribution of biotechnology products. According to the BioIndustry Association (BIA), the principal trade association for the U.K. biotech sector, the United Kingdom has about 550 biotech, or bioscience, companies, employing over 40,000 people. There are about 350 BIA members.
Growth in the biotechnology sector outside the United States, Canada, and the European Union is equally remarkable. For example:
-
the number of biotech companies in Brazil grew from 76 in 1993 to 354 in 200122;
-
the number of biotech companies in Israel increased from about 30 in 1990 to about 160 in 200023;
-
the number of publicly listed South Korean biotechnology firms grew from one in 2000 to 23 by 200224;
-
the Japan Bioindustry Association has about 300 corporate members, 100 public organization members, and 1,300 individual members (from universities)25;
-
AusBiotech, the industry body representing the Australian biotechnology sector, boasts nearly 2,400 individual members; and,
-
59 countries were represented at the BIO 2005 annual conference, which drew nearly 19,000 attendees to Philadelphia in June 2005.
According to the most recent BIO report on the industry, the total value of publicly traded biotech companies (U.S.) at market prices was $311 billion as of early April 2005.26 Total U.S. revenues for the biotech industry at large increased from $8 billion in 1994 to $46 billion in 2004 (Table 2-3); the number of U.S. biotechnology patents granted per year increased from 2,160 in 1989 to 7,763 in 2002; and the number of biotech drugs and vaccine approvals per year increased from two in 1982 to 37 in 2003.27 Currently, there are 370 biotech drug products and vaccines in clinical trials in the United States.28
The Fledgling Nanobiotechnology Industry
Nanotechnology—which includes, but is not limited to, biotechnological applications—is expected to become a $750 billion market by 2015.29 Nanotechnology has been defined in many ways, including the science involving matter that is smaller than 100 nanometers,30 anything dealing with “human-built structures measuring 100 nanometers or less,31 arranging molecules (atoms) as precisely as possible so as to perform a designated function,32 and doing with real molecules what computer graphics does with molecular models.33
For the purposes of this discussion, “nanotechnology involves the manipulation of molecules less than about 100 nanometers in size. (One nanometer is one-billionth of a meter; a hydrogen atom is about 0.1 nanometers wide.)”34 Semantics aside, an intriguing feature of nanotechnology is that it operates on the scale upon which biological systems build their structural components, like microtubules, microfilaments, and chromatin.35 In other words, biochemistry, genomics, and cell biology are nanoscale phenomena. Even more intriguing, a key property of these biological structural components is self-assembly. The most successful biological self-assembler is, of course, the DNA double helix. In their quest to emulate these biological phenomena, scientists have created the field of DNA nanotechnology, or nanobiotechnology,36 as well as the closely related field of DNA-based computation by algorithmic self-assembly.37
Although nanotechnology remains a fledgling field, according to a 2005 report published by NanoBiotech News, 61 nanotech-based drugs and drug delivery systems and 92 nano-based medical devices or diagnostics have already entered preclinical, clinical, or commercial development.38 For example, in January 2005 the Food and Drug Administration (FDA) approved the use of the nanoparticle-based Abraxane, a solvent-free form of the breast cancer drug Taxol (paclitaxel).39 The reformulated drug consists only of albumin-bound paclitaxel nanoparticles (i.e., made possible by American Bioscience’s proprietary nanoparticle albumin-bound nab™ technology) and is thus free of the toxic solvents that cause
TABLE 2-3 U.S. Biotech Industry Statistics, 1994-2004a
|
Year |
1994 |
1995 |
1996 |
1997 |
1998 |
1999 |
2000 |
2001 |
2002 |
2003 |
2004 |
|
Salesa |
7.7 |
9.3 |
10.8 |
13 |
14.5 |
16.1 |
19.3 |
21.4 |
24.3 |
28.4 |
33.3 |
|
Revenues |
11.2 |
12.7 |
14.6 |
17.4 |
20.2 |
22.3 |
26.7 |
29.6 |
29.6 |
39.2 |
46.0 |
|
R&D Expenses |
7.0 |
7.7 |
7.9 |
9.0 |
10.6 |
10.7 |
14.2 |
15.7 |
20.5 |
17.9 |
19.8 |
|
Net loss |
3.6 |
4.1 |
4.6 |
4.5 |
4.1 |
4.4 |
5.6 |
4.6 |
9.4 |
5.4 |
6.4 |
|
No. of public companies |
265 |
260 |
294 |
317 |
316 |
300 |
339 |
324 |
318 |
314 |
330 |
|
No. of companies |
1,311 |
1,308 |
1,287 |
1,274 |
1,311 |
1,273 |
1,379 |
1,457 |
1,466 |
1,473 |
1,444 |
|
Employees |
103,000 |
108,000 |
118,000 |
141,000 |
155,000 |
162,000 |
174,000 |
191,000 |
194,600 |
177,000 |
187,500 |
|
aAmounts are U.S. dollars in billions. SOURCES: Ernst & Young, LLP, annual biotechnology industry reports, 1993-2005. Financial data based primarily on fiscal-year financial statements of publicly traded companies. |
|||||||||||
certain side effects associated with Taxol. As another example, in February 2005, Angstrom Medica, Inc. (Woburn, MA), received FDA clearance for its nanoengineered synthetic bone material, NanOss™ Bone Void Filler, which can be used in the treatment of bone fractures or as an alternative to the use of donor bone and metallic medical implants.40
Outside the biomedical arena, nanobiotechnology advances are being used to improve cosmetic and sunscreen products, among others. For example, Microniser Pty Ltd (Victoria, Australia) has used nanobiotechnology to develop its proprietary nano-sized zinc oxide powders and other products. Zinc oxide, a common ingredient in many cosmetic products, normally has a white appearance. Microniser’s nano-sized zinc oxide (Nanosun™) is transparent.41
Many developing countries are making efforts to harness the potential of nanotechnology, and several have launched nanotechnology initiatives. The Indian government plans to invest $20 million over the next five years (2004-2009) in the country’s Nanomaterials Science and Technology Initiative42; researchers at the University of Delhi are commercializing two U.S.-patented nanoparticle drug delivery systems; scientists at Panacea Biotec, in New Delhi, are conducting novel drug delivery research using mucoadhesive nanoparticles; and Dabur Research Foundation, located in Ghaziabad, is participating in Phase-I clinical trials of nanoparticle delivery of the anticancer drug paclitaxel.43 In China, researchers have tested a nanotechnology bone scaffold (with the ability to repair damaged skeletal tissue caused by injury resulting from car accidents) in patients.44 The number of nanotechnology patent applications from China ranks third in the world behind the United States and Japan.45 It is estimated that China’s central and local governments will invest the equivalent of $600 million in nanotechnology and nanoscience between 2003 and 2007.46 Strikingly, scientists in China published more papers in these fields in international peer-reviewed journals than American scientists during 2004.47 In Brazil, the projected 2004-2007 budget for nanotechnology is the equivalent of $25 million; and three institutes, four networks, and about 300 scientists are working in the field. In South Africa, investigators and institutions active in the field of nanotechnology banded together to form the South African Nanotechnology Initiative (www.sani.org.za), with the goal of establishing a critical mass in nanotechnology research and development to improve industry-university links, increase nanotech R&D spending, develop projects that benefit South Africa, and generally strengthen South Africa’s position as a regional and global player in what is predicted to become the next great wave of technological innovation (i.e., nanotechnology). Thailand, the Philippines, Chile, Argentina, and Mexico are also pursuing nanotechnology initiatives.48
A 2005 study in PLoS Medicine identified the top 10 potential benefi-
cial applications of nanotechnology for developing countries, illustrating the wide range of social issues that, together with economic forces and political motivations, drive not just nanotechnology but all technological growth:49
-
energy storage, production, and conversion (e.g., novel hydrogen storage systems based on carbon nanotubes and other lightweight nanomaterials);
-
agricultural productivity enhancement (e.g., nanoporous zeolites for slow release and effcient dosage of fertilizers and of nutrients and drugs for livestock);
-
water treatment and remediation (e.g., nanomembranes for water purification, desalination, and detoxification);
-
disease diagnosis and screening (e.g., “lab-on-a-chip” nanoliter systems);
-
drug delivery systems (e.g., nanocapsules, liposomes, dendrimers, buckyballs, nanobiomagnets, and attapulgite clays for slow and sustained drug release systems);
-
food processing and storage (e.g., nanocomposites for plastic film coatings in food packaging);
-
air pollution and remediation (e.g., TiO2 nanoparticle-based photo-catalytic degradation of air pollutants in self-cleaning systems);
-
construction (e.g., nanomuscular structures to make asphalt and concrete more robust to water seepage);
-
health monitoring (e.g., nanotubes for glucose sensors and for in situ monitoring of homeostasis); and,
-
vector and pest detection and control (e.g., nanosensors for pest detection).
Developing countries recognize the potential of novel technologies. Nowhere is this more evident than with nanotechnology.
AGRICULTURAL BIOTECHNOLOGY50
The expansion of transgenic crops is expected to be one of the most important future agricultural trends associated with or resulting from advances in biotechnology. Potential benefits of transgenic agriculture include the development of more disease-resistant crops (which obviate the need for environmentally hazardous pesticides) to the production of better-tasting foods. Environmental and societal benefits notwithstanding, ultimately, as with the pharmaceutical industry, economics is the bottom line. Any technology that results in lower production costs and higher profit margins will likely progress more rapidly than other, lower-yield
ventures. About 45 percent of the world’s crops are lost to disease, insects, drought, and so forth, annually. In the United States alone, $20 billion worth of crops are lost annually (i.e., one-tenth of production), which represents a large margin that could potentially be affected by advances in transgenic technology. The situation per hectare is worse in other parts of the world. For example, while the United States produces about 6 tons of rice per hectare, Europe produces about 5 tons per hectare and Latin America 2.3 tons per hectare. With corn (maize), the United States produces 7 tons per hectare; Europe, 6 tons per hectare; Latin America, 2.1; and Africa, only 1.7.51
The recent rapid growth and global dispersion of commercialized genetically modified (GM) or transgenic crops, also known as biotech crops, suggests that efforts to improve and maximize agricultural productivity already serve as yet another powerful driver of advanced technologies. Transgenic food crops have already entered and flourished in the global marketplace. According to a report, issued in January 2005 by the International Service for the Acquisition of Agri-Biotech Applications (ISAAA), in 2004 there were 14 biotech “megacountries,” that is, countries that grow more than 50,000 hectares of biotech crops.52 These countries were, in order of hectarage, the United States (59 percent of the global total), Argentina (20 percent), Canada (6 percent), Brazil (6 percent), China (5 percent), Paraguay (2 percent), India (1 percent), South Africa (1 percent), Uruguay, Australia, Romania, Mexico, Spain, and the Philippines. To put these figures into perspective, the ISAAA report described the accumulated biotech acreage between 1996 and 2004 as equivalent to 40 percent of the land area of the United States or China and 15 times the total land area of the United Kingdom (Figures 2-1 and 2-2).
Although China ranks fifth in terms of commercialized GM crop hectarage, it is expected to become the world’s largest GM crop producer in the next 10 to 20 years. With one-quarter of the world’s population and only seven percent of the world’s arable land, China has made a strong commitment to using transgenic technology and has spent in the past three years the equivalent of $120 million on developing transgenic rice technology alone. Between 2001 and 2005, China’s investment in transgenic technology development was 400 percent greater than between 1996 and 2000.53
The global area of biotech crop plantings grew for the ninth consecutive year in 2004, at a rate of 20 percent (up from 15 percent growth in 2003), to 81.0 million hectares (equivalent to 200 million acres), compared to 67.7 million hectares (167 million acres) in 2003 and seven million acres in 1997, when biotech crops were first commercially grown (Figure 2-3).54 Also in 2004, biotech crops were grown by approximately 8.25 million farmers in 17 countries, compared to 7 million farmers in 18 countries in
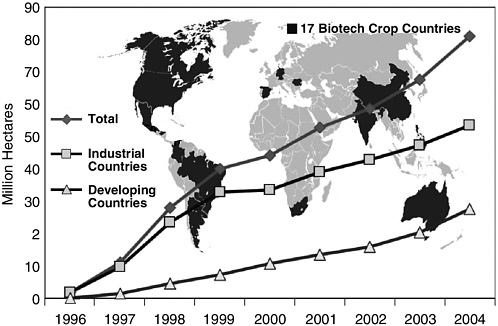
FIGURE 2-1 Global area of biotech crops in million hectares (1996-2004). Increase of 20 percent, 13.3 million hectares or 32.9 million acres between 2003 and 2004.
SOURCE: www.isaaa.org/kc/CBTNews/press_release/briefs32/figures/global_area.jpg [accessed January 4, 2006].
2003. Ninety percent of these farmers were in resource-poor countries. In fact, the absolute growth in biotech crop area between 2003 and 2004 was higher in developing countries (7.2 million hectares) than in industrialized countries (6.1 million) for the first time. Brazil and India are expected to become larger sectors of the production market in the near future (see Table 2-4).55 Other developing countries with small but growing shares of the market include Indonesia, Mexico, Uruguay, Colombia, Honduras, and the Philippines.56 By the end of the decade, an estimated 15 million farmers are predicted to be growing biotech crops on some 150 million hectares in up to 30 countries.
Based on data from Cropnosis, a crop protection market research firm, and provided by ISAAA, the global market value of biotech crops for 2004 was an estimated $4.7 billion and is expected to grow higher than $5 billion in 2005. Its cumulative global value for the nine-year period between 1996 (when biotech crops were first commercialized) and 2004 was $24 billion. The two most common genetically engineered crop traits are herbicide tolerance (72 percent of global biotech hectares in 2004) and insect resistance (15.6 percent of global biotech hectares in 2004).57 Major
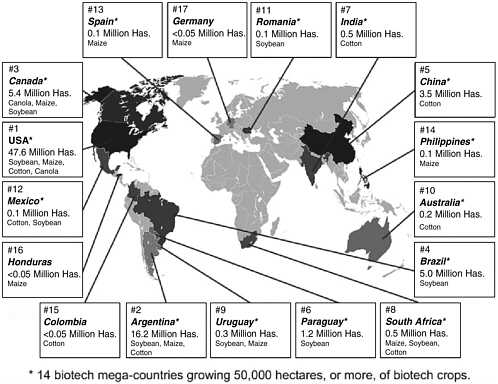
FIGURE 2-2 Biotech crop countries and mega-countries, 2004.
SOURCE: www.isaaa.org/kc/CBTNews/press_release/briefs32/figures/crop_countries.jpg [accessed January 4, 2006].
transgenic crops include soja (i.e., Glycien soja, wild soybean; 61 percent of global market), maize (23 percent), cotton (11 percent), and colza (i.e., canola oil, 5 percent). In 2004 the European Commission approved two biotech maize imports, signaling the end of the 1998 moratorium, and 17 biotech maize varieties for planting in the European Union.
Plant biotechnology is widely recognized throughout Asia as a key tactic for achieving food security and sustainable agriculture.58 In addition, making recombinant plants is an attractive approach for improving yield. Increases in food production between 1970 and 1995 (i.e., following improvements in agricultural production initiated by the Green Revolution), even as the population grew by one billion, were due largely to the cultivation of new high-yielding varieties of rice and wheat, which were developed by introducing genes that made the plants more responsive to fertilizers and less likely to fall over when fertilized or irrigated. Other factors that contributed to increased yields included expansion of irrigated
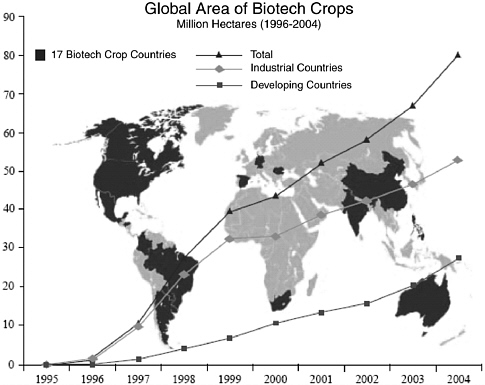
FIGURE 2-3 Global area of biotech crops, 1996-2004. Increase of 20 percent, 13.3 million hectares or 32.9 million acres between 2003 and 2004.
SOURCE: James, C. 2004. Global Status of Commercialized Biotech/GM Products: 2004. International Service for the Acquisition of Agri-Biotech Applications, Executive Summary. Available online at: www.isaaa.org/kc/CBTNews/press_release/briefs32/ESummary/Executive%20Summary%20(English).pdf [accessed January 4, 2006].
areas, increases in fertilizer and pesticide use, and greater availability of credit.59
Plants as Manufacturing Platforms
Transgenic crops are not the only agricultural application of advancing life sciences knowledge. Similar technological advances are being applied to “biopharming,” the production of vaccine antigens and other biologically active proteins by transgenic plants. Plant-based manufacturing platforms are considered potentially low-cost, highly efficient, alternatives to other production methods and may be especially suitable for use in developing countries.60 However, the future of biopharming is unclear. Academic researchers have been investigating the potential for
TABLE 2-4 Top Biotech Crop Countries and Mega-countries, 2004
|
Country |
Hectares (millions) |
Key Crops |
|
United States |
47.6 |
soybean maize cotton canola |
|
Argentina |
16.2 |
soybean maize cotton |
|
Canada |
5.4 |
canola maize soybean |
|
Brazil |
5.0 |
soybean |
|
China |
3.7 |
cotton |
|
Paraguay |
1.2 |
soybean |
|
India |
0.5 |
cotton |
|
S. Africa |
0.5 |
maize soybean cotton |
|
Uruguay |
0.3 |
soybean, maize |
|
Australia |
0.2 |
soybean |
|
Romania |
0.1 |
soybean |
|
Mexico |
0.1 |
cotton soybean |
|
Spain |
0.1 |
maize |
|
Philippines |
0.1 |
maize |
|
Colombia |
<0.05 |
cotton |
|
Honduras |
<0.05 |
maize |
|
Germany |
<0.05 |
maize |
|
SOURCE: www.isaaa.org/kc/CBTNews/press_release/briefs32/ESummary/Executive%20Summary%20(English).pdf; a mega-country is a country that grows 50,000 more hectares of biotech, or transgenic, crops |
||
plant-produced vaccines for over a decade but, despite the promise of the technology, have attracted little venture capital or captured the interest of conventional vaccine manufacturers. Similar efforts are underway with respect to the use of transgenic animals for production of therapeutic proteins. While having considerable potential, these efforts have been slowed by concerns about the potential for gene transfer from transgenic plants to wild type.
Nanotechnological Applications in Agriculture
As mentioned in the previous section, agricultural productivity enhancement has been identified as one of 10 future beneficial applications
of nanotechnology in the developing world. Nanotechnology could be used to improve agricultural productivity through the use of nanoporous materials for the slow release and efficient utilization of water and fertilizers for plants (and of nutrients and drugs for livestock), nanocapsules for herbicide delivery, nanosensors for soil quality and plant health monitoring, and nanomagnets for soil contaminant removal.
Industrial Biotechnology
Industrial biotechnology—the application of scientific and engineering principles to the processing of materials by biological agents—has been dubbed the “third wave” of biotechnology, after health and agricultural biotechnology.61 Chemicals, auto parts, plastics, textiles, and paper are just a few of the many products and industrial sectors that stand to benefit from biological processing, which is generally less expensive, environmentally safer, and more sustainable than petroleum- or chemistry-based manufacturing. Viewed simply from an economic perspective, biotechnology will supplant traditional production technologies as the costs of biotechnology development and production reagents (e.g., glucose) drop below the costs of traditional production reagents (e.g., petroleum). Biological processing can also yield better products. Back in the 1970s, for example, when laundry detergent manufacturers replaced phosphates with cell-derived enzymes, they created a product that produced less waste, cost less to package and transport, and removed stains better than other products then on the market.62
Today, cell-, enzyme-, and plant-based processing technologies are being incorporated into a wide range of manufacturing and energy conversion applications. For example, in 2001, Cargill Dow opened a biorefinery in Blair, Nebraska, for the conversion of corn sugar into a polylactide polymer that can be used to produce packaging materials, clothing, and bedding products.63 April 2004 marked the first commercial shipment of bioethanol—ethanol made from, in this case, wheat straw—by a Canadian biotech company, Iogen. Iogen expects to begin construction of a 50-million-gallon-a-year manufacturing plant in 2006.64
Currently, only about five percent of industrial chemicals are of biological origin (e.g., alcohols, amino acids, vitamins, pharmaceuticals). The figure is expected to increase to 10 percent or higher by 2010, depending on such factors as consumer acceptance, governmental policies and support, and the regulatory environment. Also by 2010, biologically-produced ethanol is expected to constitute as much as 6 percent of all transportation fuel used in Europe.65
Biodefense
U.S. biodefense spending66 has increased dramatically over the past few years. Combined Department of Health and Human Services (HHS) and Department of Homeland Security (DHS) biodefense preparedness spending has increased as follows:
-
FY 2001—$294 million (HHS budget),
-
FY 2002—$3 billion (HHS budget),
-
FY 2003—$4.4 billion (combined HHS and DHS budgets), and
-
FY 2004—$5.2 billion (combined HHS and DHS budgets).
The National Institutes of Health (NIH) biodefense research funding increased from $53 million in FY 2001 to nearly $1.7 billion in FY 2005 (and a requested $1.8 billion for FY 2006). The FY 2005 budget was used for basic research ($574 million), diagnostics ($149 million), healthcare facilities construction ($51 million), vaccines ($625 million), and antibiotics and antivirals ($259 million).67 According to data from CRISP, NIH’s grant database, the number of NIH grants referencing bacterial bioweapons agents (i.e., agents that cause tularemia, anthrax, plague, glanders, melioidosis, or brucellosis) increased 15-fold between 1996-2001 (33 grants) and 2001-January 2005 (497 grants).
As with other sectors of the life sciences industry, international collaboration and technology exchanges—as reflected by the growing number of co-owned and foreign-owned patents, in addition to the growing number of international subcontracting and technological cooperation agreements—are vital to the success of the U.S. biodefense industry. This is particularly true with respect to vaccine research and development.68 Vaccines are considered a key component of U.S. biodefense, yet there are few incentives for the pharmaceutical and biotechnology industries to develop new biodefense vaccines. The FDA has licensed vaccines to protect against only a handful of the nearly 50 biological threat agents identified by HHS (i.e., anthrax, cholera, plague, smallpox). Until recently, manufacturers had ceased producing all but one of these FDA-approved vaccines (i.e., anthrax). Recognizing the urgent need for new biodefense vaccines, the BioShield initiative—$5.6 billion in federal funding for the purchase of vaccines and other medical countermeasures over a period of 10 years—was launched in an effort to create incentives for the private sector to develop and produce new vaccines. However, although nationally funded biodefense-related research and development programs have achieved high visibility, the perceived need for biodefense products has thus far received little attention from well-established pharmaceutical companies. This is likely to remain the case as long as the government is
perceived to represent the sole market for such products or until significant new incentives are adopted.
In addition to a lack of incentives, scientific, technological, and regulatory advances make it difficult for all but the largest vaccine manufacturers to house the range of expertise and capabilities required to take a vaccine from concept to commercialization. Consequently, as with other sectors of the life sciences industry, smaller commercial vaccine developers have increasingly relied on outsourcing and technological cooperation agreements (e.g., between pharmaceutical companies and biotech startups). As of 2004, of the top six class A biological threat agents identified by the United States, vaccines for all but one (Botulinum toxin) are being developed in cooperation with international biotechnology companies, including firms in Austria, Belgium, Denmark, France, Japan, the Netherlands, and the United Kingdom.69
GLOBAL DISPERSION OF KNOWLEDGE
Articles in international peer-reviewed journals and citations of those articles are commonly used as one of a variety of metrics to assess a country’s scientific output, which, in turn, reflects a country’s ability to generate new knowledge and adapt and benefit from research conducted globally. Likewise, patents are commonly used as an indicator of a country’s technological capacity and output. This section summarizes recent trends with respect to these two major categories of indicators while demonstrating that scientific and technological knowledge in general—and life sciences knowledge and technology specifically—is spreading globally at a very rapid pace.
Global Scientific Productivity
In a recent analysis of the number of published research papers and reviews, and their citations, based on data provided by Thomson ISI, which indexes more than 8,000 scientific journals in 36 languages, Professor Sir David A. King, chief scientific officer of the United Kingdom and head of the Office of Science and Technology, London, compared scientific productivity across 31 countries.70 The selected countries comprised more than 98 percent of the world’s “highly” cited papers, which are defined as the one percent most frequently cited by field and year of publication. In terms of the number of publications, number of citations, and share of the top one percent of cited papers, the United States clearly leads. South Africa is the only African country on the list, and Iran is the only Islamic country represented.
With respect to the number of publications between 1997 and 2001, in terms of a percentage of the world’s total, the United States (34.86 percent) is followed by, in decreasing order, the United Kingdom (9.43), Japan (9.28), Germany (4.58), France (6.39), Canada (4.58), Italy (4.05), Russia (3.4), China (3.18), Spain (2.85), Australia (2.84), the Netherlands (2.55), India (2.13), Switzerland (1.84), South Korea (1.53), Belgium (1.32), Taiwan (1.25), Brazil (1.21), Poland (1.18), Denmark (1.02), Finland (0.96), Austria (0.93), Greece (0.62), South Africa (0.5), Singapore (0.42), Portugal (0.37), Ireland (0.35), Iran (0.13), and Luxembourg (0.01). See Figure 2-4 for a graphic representation of these numbers.
Compared to the number of publications between 1993 and 1997, there has been a notable decrease in the percentage of papers authored by U.S. scientists (37.47 in 1993-1997, compared to 34.86 in 1997-2001), compared to increases for many other countries (including the United Kingdom, Japan, Germany, France, and particularly China) over the same time periods. With respect to the number of citations and share of the top one percent most frequently cited papers, again the gap between the United States and other countries narrowed slightly. From 1993-1997, U.S.-authored papers comprised 52.3 percent of the world total and 65.6 percent of the top one percent of frequently cited papers. Those figures fell to 49.43 percent and 62.76 percent, respectively, in 1997-2001.
Since the United States is a relatively large nation in terms of its population and gross domestic product (GDP), it is instructive to also look at such data on a per capita basis. Citations are considered a measure of the impact of a nation’s publication output. In the graphical comparison of the “citation intensity” (citations per gross national product) and “wealth intensity” (GDP per person) in Figure 2-4, Israel, the Scandinavian countries, Switzerland, and the Netherlands are all above the norm (i.e., they have higher-than-average citation numbers: wealth indices). The United States, Japan, Taiwan, Ireland, and Luxembourg all fall below the norm.
Among the G8 nations and in terms of a national disciplinary “footprint” (i.e., a country’s impact on international science based on citation share), notable features include Russia’s relative weakness in the life sciences (compared to its relative strength in the physical sciences and engineering). The United States has the highest impact and the United Kingdom the second-largest footprint in the life sciences.
Importantly, as King notes, ranking countries by citation share may hide important recent trends, such as the very rapid growth that China is currently experiencing with respect to establishing a strong science and technology base and the initial steps that many other countries are taking toward strengthening their scientific and technological capabilities. Indeed, in a similar analysis that appeared recently in Science, the authors found that, although the gap in scientific output between the world’s rich-
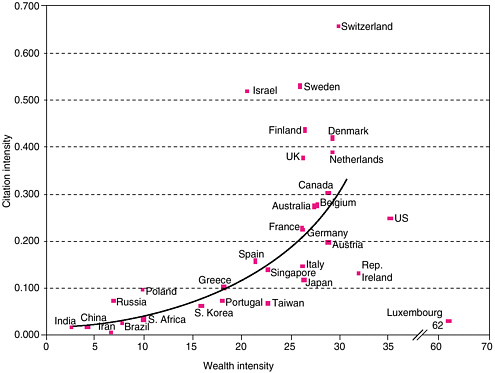
FIGURE 2-4 Comparing economic and scientific wealth. National science citation intensity, measured as the ratio of the citations to all papers to the national GDP, shown as the function of the national wealth intensity, or GDP per person, for the 31 nations in the comparator group. GDP and wealth intensity are given in thousands of U.S. dollars at 1995 purchasing-power parity. Source: Thomson ISI, OECD and the World Bank.
SOURCE: King, D.A. 2004. The scientific impact of nations. Nature 430(6997):311-316. Reprinted by permission from Macmillan Publishers Ltd: Nature 430(6997), copyright 2004.
est and poorest countries may be widening—the output from the world’s 63 poorest countries dropped by about a tenth to just 0.3 percent of all healthcare publications (in more than 4,000 journals) between 1992 and 2001—scientists from middle-income countries, such as China and Turkey, have increased their output by about 20 to 30 percent.71
As presented in Table 2-5, scientific productivity does not necessarily immediately or directly translate into commercial development or economic gain.72 Technological innovation and development involve a highly interactive and dynamic process with multiple influences (e.g., laws, health regulations, cultural norms, social rules, technical standards) and
TABLE 2-5 Comparisons of Private-Sector R&D Spending and the Output of Ph.D.s and Researchers
|
Country |
BERD |
BERD as % of GDP |
Ph.D.s |
Ph.D.s per capita |
Full-time researchers |
Full-time researchers per 1,000 employed |
|
Japan |
65,726 |
2.12 |
10,962 |
0.08 |
644,208 |
9.59 |
|
U.S. |
169,228 |
1.97 |
44,955 |
0.17 |
1,148,271 |
8.17 |
|
Germany |
31,013 |
1.66 |
24,940 |
0.30 |
238,944 |
5.93 |
|
France |
18,186 |
1.38 |
10,056 |
0.17 |
156,004 |
5.99 |
|
U.K. |
15,048 |
1.22 |
11,253 |
0.19 |
147,035 |
5.02 |
|
European Union |
95,733 |
1.19 |
6,323 |
0.18 |
784,066 |
5.6 |
|
Canada |
8,343 |
1.06 |
3,871 |
0.13 |
90,245 |
5.88 |
|
Russia |
6,577 |
0.72 |
— |
— |
— |
— |
|
Italy |
6,569 |
0.53 |
3,494 |
0.06 |
69,621 |
3.09 |
|
SOURCE: Adapted from Table 3 in King, D.A. 2004. The scientific impact of nations. Nature 430 (6997):311-316 Feature. |
||||||
institutions (e.g., private-sector firms, governments, research and educational institutions, financial institutions, international linkages) providing constraints and incentives.73 As such, King also analyzed indicators of business research and development activity among G8 nations. Japan took the lead, and the United Kingdom fell to fifth place, ranked according to BERD (business enterprise research and development, in millions of US$ at 1995 prices, adjusted for purchasing power) per GDP.
Global Growth in Biotech Patent Activity74
Patent data reflect the inventive performance of countries and regions and, along with other science and technology indicators, such as those above, can help paint a clearer picture of international advances in biotechnology. According to data provided by the Organisation for Economic Cooperation and Development (OECD), there has been a dramatic increase in patent activity worldwide over the past decade.75 For example, between 1985 and 2000, the total number of triadic patent families76 grew by 4.4 percent per year, from about 5,000 in 1985 to close to 44,000 in 2000. Most triadic patenting activity occurs in the United States (about 34 percent), Japan (about 27 percent), Germany (about 13 percent), France (about 5 percent), and the United Kingdom (about 4 percent). These five countries accounted for about 84 percent of triadic patent families in 2000. But several other countries—namely, Brazil, China, and India—showed remarkable growth in patent activity during the 1990s (although their share of the total triadic patent families is still very small, at about 0.1 to 0.2 percent for each country).
There has also been a recent increase in the number of patent rights sought by filing a single international application with a single patent office (in accordance with the Patent Cooperation Treaty, PCT). In 2001 there were an estimated 106,948 PCT applications, compared to only 24,126 in 1991. The United States and the European Union accounted for 74 percent of the applications in 2001, followed by Japan, which accounted for about 12.8 percent. Within the European Union, Germany accounted for the greatest amount of PCT patent application activity in 2001 (12.9 percent of global total), followed by the United Kingdom (5.3 percent), France (4.7 percent), the Netherlands (3.5 percent), Italy (2.8 percent), and Sweden (2.5 percent). Other countries comprising a notable share of PCT applications in 2001 included Korea (2.2 percent of global total), Canada (2.1 percent), Switzerland (1.9 percent), Australia (1.6 percent), Israel (1.2 percent), China (0.8 percent), and Russia (0.6 percent). The number of PCT applications originating from developing countries has increased rapidly, although they still account for only a very small proportion of the total number of applications. For example, the number of PCT applications originating
from China, India, and South Africa combined was on par with the number of applications from Australia.
By the late 1990s, an average of 14.5 percent of patents in any OECD country were owned or co-owned by foreign residents, compared to 10.7 percent in the early 1990s, indicating an increasingly global and internationally linked inventive performance. Smaller countries and large non-OECD member countries tend to have higher percentages of patents with foreign coinventors. For example, in 1999-2000, Luxembourg had the greatest share of EPO patent applications with foreign coinventors (56 percent), followed by Singapore and Russia (both 43 percent). The United States, Germany, Japan, and other countries with large numbers of patents tend to have a lower share of patents with foreign coinventors; the United States, Germany, and Japan ranked 28th, 29th, and 33rd, respectively, in terms of the percentage of EPO patent applications in 1999-2000 with at least one foreign coinventor.
The number of patent applications filed at the national patent office of Brazil (INPI) and the State Intellectual Property Office of the People’s Republic of China (SIPI) has increased rapidly over the past decade. In Brazil the total number of INPI applications filed in 2000 increased to 16,700, up from an estimated 7,000 in 1991. Most of those applications were filed by inventors from the United States (30.5 percent), European Union (34.8 percent), Brazil (17.8 percent), and Japan (5.7 percent). In China the total number of patent applications filed at SIPI increased from about 12,000 in 1985 to nearly 60,000 in 2000. Again, most of the patent activity in China is from foreign investors (Japan, 20.6 percent of total patent activity; European Union, 16.8 percent; United States, 14.9 percent; and Korea, 3.6 percent), although domestic applications (i.e., from Chinese inventors) have shown a dramatic 15 percent annual growth rate. By 2000, nearly 40 percent of all SIPI patent applications were domestic.
Although all technology fields have experienced patent growth over the past 10 years, biotechnology and information and computer technology (ICT) have grown most rapidly. For example, between 1991 and 2000, biotechnology and ICT patent applications to the EPO increased 10.9 percent and 9.8 percent, respectively, compared to 6.9 percent growth overall. The United States showed particularly rapid growth in biotechnology patent activity, with 9.6 percent of its EPO patents in the field of biotechnology, compared to only 4.2 percent of the European Union’s EPO patents and 3.5 percent for Japan.
The United States (45.1 percent), European Union (33.4 percent), and Japan (11.3 percent) have the greatest shares of biotechnology EPO patents. Within the European Union, Germany holds the most EPO biotechnology patents (12.4 percent), followed by the United Kingdom (5.8 percent), France (4.9 percent), Netherlands (3.0 percent), Denmark (1.7 percent), and
Belgium (1.4). Outside the United States, the European Union, and Japan, the countries holding the most biotechnology EPO patents are Canada (2.4 percent), Switzerland (1.4 percent), Australia (1.3 percent), Israel (1.1 percent), and Korea (0.9 percent).
Hungary, Norway, and New Zealand also have shown particularly rapid recent growth in terms of the percentage of their patents that are in biotechnology. Although Singapore, India, and Denmark each have a higher ratio of biotechnology EPO patents than either the United States, the European Union, or Japan (i.e., about one in eight patents issued to Singapore, India, and Denmark are in the biotechnology field), their overall contribution to the total number of biotechnology patents filed at the EPO is quite small.
Information Technology
The expanding global flow of capital, goods, technology, information, and people is made possible, in part, by advances in information technologies, including the Internet and communications. Future breakthroughs in materials science and nanotechnology are predicted by some to lead to the development of next-generation information and communications devices and tools with unforeseen capabilities, which, in turn, will continue to accelerate progress in information technologies and drive globalization.77 Of note, many poorer nations are successfully gaining access to newer technologies (e.g., mobile telecom services) rather than developing the infrastructure required for older technologies (e.g., telephone landlines).
Some salient statistics that reflect the global spread of advanced information technologies are presented here (see also Table 2-6):
-
According to a 2003 report by the U.S. Department of Commerce, the fastest-growing biotechnology-related technical occupation in the United States is R&D-focused computer specialist, which grew 21.8 percent annually between 2000 and 2002.78
-
All of the world’s major economies deploy high-end broadband communications connections. According to 2004 data compiled by the International Telecommunications Union, South Korea leads the world in terms of broadband79 penetration (24.9 percent total broadband penetration rate, including DSL, cable modems, and other), followed by Hong Kong (20.9 percent), the Netherlands (19.4 percent), Denmark (19.3 percent), Canada (17.6 percent), Switzerland (17.0 percent), Taiwan (16.3 percent), Belgium (16.9 percent), Iceland (15.5 percent), Sweden (15.1 percent), Norway (15.0 percent), Israel (14.3 percent), Japan (14.1 percent), Finland (12.3 percent), Singapore (11.6 percent), United States (11.4 percent), France (11.2 percent), the United Kingdom (10.3 percent), and Austria (10.1 percent).80
TABLE 2-6 Key Global Telecom Indicators for the World Telecommunications Service Sector
|
|
1991 |
1995 |
1999 |
2000 |
2001 |
2002 |
2003 |
|
Telecom market revenue (US$ Billions) |
|
||||||
|
Services |
403 |
596 |
854 |
920 |
968 |
1,020 |
1,070 |
|
Equipment |
120 |
183 |
269 |
290 |
264 |
275 |
300 |
|
Total |
523 |
779 |
1,123 |
1,210 |
1,232 |
1,295 |
1,370 |
|
Main telephone lines (millions) |
546 |
689 |
905 |
983 |
1,053 |
1,129 |
1,210 |
|
Cellular subscribers (millions) |
16 |
91 |
490 |
740 |
955 |
1,155 |
1,329 |
|
International telephone traffic minutes (billions) |
38 |
63 |
100 |
118 |
127 |
135 |
140 |
|
Personal computers (millions) |
130 |
235 |
435 |
500 |
555 |
615 |
650 |
|
Internet users (millions) |
4.4 |
40 |
277 |
399 |
502 |
580 |
665 |
|
SOURCE: International Telecommunications Union, available online at www.itu.int/ITU-D/ict/statistics/at_glance/KeyTelecom99.html. |
|||||||
-
Averaged across 182 countries and according to data compiled by the International Telecommunications Union, there were 10.13 personal computers (PCs) per 100 inhabitants in 2003. The top 20 countries on the list (also the only countries with more than 40 PCs per 100 inhabitants) are Switzerland (70.87 PCs per 100 inhabitants), the United States (65.98), Singapore (62.2), Sweden (62.13), Luxembourg (62.02), Australia (60.18), Denmark (57.68), South Korea (55.8), Norway (52.83), Canada (48.7), Germany (48.47), Taiwan (47.14), Netherlands (46.66), Iceland (45.14), Finland (44.17), Estonia (44.04), Hong Kong (42.2), Ireland (42.08), New Zealand (41.38), and United Kingdom (40.57).81 Averaged across 51 countries, there are only 1.44 PCs per 100 inhabitants in Africa, with the highest concentrations in Seychelles (15.53) and Mauritius (14.87), then dropping down to 9.93 in Namibia, 7.77 in Cape Verde and 7.23 in South Africa.
-
Averaged across 182 countries and according to data compiled by the International Telecommunications Union, 55.1 percent of all telephone subscribers worldwide use cell phones (i.e., they have cellular mobile subscriptions). Five of the six countries where more than 90 percent of all telephone subscribers use cell phone technologies are in Africa: D.R. Congo (99.0 percent), Congo (97.9 percent), Uganda (92.7 percent), Cameroon (90.7 percent), and Mauritania (90.2 percent). The sixth country is Cambodia, with 93.2 percent. By region, Africa has the greatest percentage of cell phone subscribers (67.5 percent), followed by Europe (58.9 percent), Oceania (57.2 percent), Asia (54.0 percent), and the Americas (50.3 percent). In the United States, 46.7 percent of all telephone subscriptions are for cell phones.82
-
In terms of absolute numbers, the top five countries with the largest number of cell phone subscribers are China (269 million in 2003, representing a dramatic increase from 23.8 million in 1998); the United States (158 million in 2003, up from 69.2 million in 1998); Japan (86.6 million in 2003, up from 47.3 million in 1998); Germany (64.8 million in 2003, up from 13.9 million in 1998), and Italy (55.9 million in 2003, up from 20.4 million in 1998).83
-
China Mobile is the largest cellular operator worldwide, with about 200 million subscribers as of December 2004.
Global Dispersion of People
While the previous sections addressed the global distribution of scientific and technological knowledge as represented by the use and development of advanced technologies in the life sciences industry and changing trends in relevant patents and publications, this section focuses on another vehicle for the global dispersion of knowledge: people. Global travel and migration of scientists, whether for a weekend conference, several years of study, or permanent relocation, is vital to scientific and technological progress—in both the basic research arena and the commercial development of tools and technologies into commercial applications. For example, the United States has maintained its overall leadership in science and engineering in part because it has been able to recruit the most talented people worldwide for positions in academe, industry, and government.84 The proportion of foreign-born U.S. scientists and engineers has grown rapidly over the past three decades. For example, in 1966, 23 percent of science and engineering doctorates were foreign born, compared to 39 percent in 2000; the percentage of science and engineering postdoctoral scholars in the United States who are considered temporary residents increased from 37 percent in 1982 to 59 percent in 2002; the percentage of doctoral-level employees in science and engineering occupations who are foreign born increased from 24 percent in 1990 to 38 percent in 2000; and more than one-third of all U.S. Nobel laureates are foreign born (Figure 2-5).85
Several emerging trends suggest that fewer of the most talented foreign born scientists and engineers are studying or working in the United States, either on a temporary or permanent basis. These trends include the growing two-way flow of scientific and advanced technology brain power among high-, middle-, and low-income countries; increasing global competition for the best science and engineering students and scholars; and new visa and immigration policies, brought about in the aftermath of 9/11. The following section details some of these trends among U.S. doctoral degree recipients.
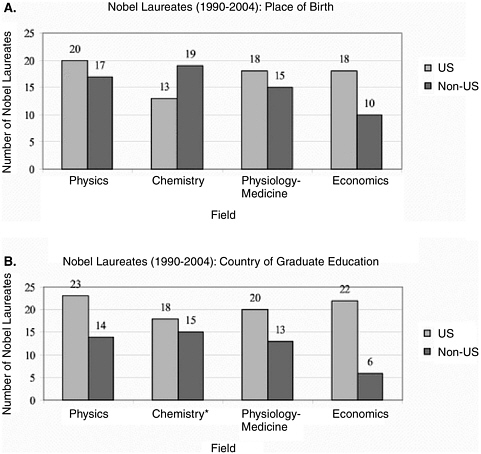
FIGURE 2-5 Exceptional contributions: U.S. Nobel laureates’ place of birth and country of graduate school education.
*Data from “Chronology of Nobel Prize Winners in Physics, Chemistry, and Physiology or Medicine.” Nobel e-museum—the official Website of the Nobel Foundation. Available online at www.nobel.se/index.html. Note that one laureate in chemistry had two Ph.Ds.
SOURCE: National Research Council. 2005. Policy Implications of International Graduate Students and Postdoctoral Scholars in the United States. Washington, DC:The National Academies Press: 55.
Trends in Higher Education
As a dominant world force in science and technology, the United States has long attracted and trained students in science and engineering from around the world. The international mobility of foreign recipients of U.S. doctoral degrees leads to a globally dispersed, highly-skilled labor
force. Even among the majority of foreign recipients of U.S. doctoral degrees who remain in the United States, continued communication and exchange with their countries of origin fosters and reinforces international ties. Not only do these links play an important role in developing the “bright side” of technology worldwide, they are vital to maintaining the strength of the international collaborations on which U.S. science and technology research and development depends. It is also clear that foreign students and scientists have added historically to the science and technology capacity of the United States and continue to do so today.
Yet foreign interest in U.S. graduate school education in science and technology seems to be waning. According to a recent Council of Graduate Schools survey, from 2003 to 2004, the number of foreign students applying to U.S. graduate programs in the life sciences fell by 24 percent. Applications from Chinese students fell 45 percent, those from Indian students by 28 percent, and those from Korean students by 14 percent. Overall enrollment by foreign students in U.S. graduate school programs fell by 6 percent over the same time period.86
The drop in foreign applications may be partly due to the greater restrictive environment that has emerged since 9/11, including a tightening of U.S. visa policies and the tracking of non-U.S. citizens who study or work in the United States for either short-term or extended stays.87 Importantly, however, it may also be due to the reality that, as other countries develop and strengthen their science and technology bases (including educational and training capacities), there is less reason to study in the United States. The fact that a similar pattern is being seen in the United Kingdom (one survey that reported a 50 percent decline from 2003 to 2004 in university enrollments by Chinese students) suggests that increasing domestic opportunities are creating a competitive global environment.88
The trend is particularly striking given the fact that, according to 2004 data from the National Science Foundation (NSF), non-citizens accounted for most of the growth in U.S. science and engineering doctorates from the late 1980s through 2001.89 During that time, the number of doctorates awarded to non-U.S. citizens rose from 5,100 (26 percent of total) to 9,600 (35 percent); it peaked in 1996, leveled off and declined until 1999, and then rose again. Between 1985 and 2001, a total of approximately 148,000 U.S. doctoral degrees in science and engineering were awarded to foreign students. Foreign students studying in U.S. institutions earn a larger proportion of degrees at the doctoral level than at any other degree level (the proportion varies, depending on the field of study).
Country-specific data from a 2001 NSF report indicate that the largest pool of foreign doctoral degree awardees in the United States in science and engineering fields originated from China (2,405 doctoral degrees awarded in 2001), followed by South Korea (862), India (808), Taiwan
(538), Canada (305), Turkey (304), Thailand (233), Germany (220), and Mexico (205).90,91 Based on more recent data from the 2004 NSF Survey of Earned Doctorates, which covers the period between 1985 and 2000, students from 11 major foreign countries/economies and three regional groupings together accounted for nearly 70 percent of all foreign recipients of U.S. science and engineering doctorates.92
The major Asian countries/economies sending doctoral students to the United States between 1985 and 2000 were China, Taiwan, India, and South Korea, in that order. Altogether, students from these countries earned more than 50 percent of science and engineering doctoral degrees awarded to foreign students (68,500 out of 138,000), four times more than students from Europe (16,000, most of whom were from Germany, Greece, the United Kingdom, Italy, and France). Chinese students earned, cumulatively, more than 26,500 science and engineering U.S. doctoral degrees, mainly in engineering and the biological and physical sciences. In 1985 only 138 science and engineering doctoral degrees were awarded to Chinese citizens. That number jumped to almost 3,000 by 1996 (see Box 2-1).
Over that same time period, students from Taiwan earned, cumulatively, far fewer degrees than students from China (about 15,500), again mostly in engineering and the biological and physical sciences. Interestingly, in 1985, students from Taiwan earned more U.S. science and engineering doctoral degrees than students from India and China combined (746). As Taiwanese universities increased their capacity to provide advanced science and engineering education in the 1990s, the number of students sent abroad declined. Although Indian students in U.S. institutions earn their doctoral degrees mainly in engineering and the biological and physical sciences, they also comprise the largest number of doctoral degrees awarded to any foreign group in computer and information sciences. U.S. doctorates awarded to South Koreans are mainly in engineering, physical sciences, psychology, and the social sciences. U.S. doctorates awarded to students from Western Europe are mainly in psychology, the social sciences, and engineering; degrees awarded to eastern European students are mainly in the physical sciences, engineering, and mathematics. Eighty-three percent of all doctoral degrees earned by Mexican students are in science and engineering, mainly engineering, psychology/social sciences, biological sciences, and agricultural sciences.
Stay Rates
According to a 1998 NSF report, the majority of foreign students who earned science and engineering doctorates from U.S. institutions between 1988 and 1996 planned to stay in the United States; nearly 40 percent had received firm offers of postdoctoral appointments or employment with
|
BOX 2-1 The Gathering Storm report provided the following numbers: “In 2004, China graduated over 600,000 engineers, India 350,000 and America about 70,000.” —Geoffrey Colvin, “America isn’t ready.” Fortune Magazine, July 25, 2005. Numbers of Indian Engineering Graduatesa The numbers for 1990 (the most recent available from the Indian government) indicate that some 4.9 percent of undergraduates were enrolled in engineering and technology degree programs,b yielding 29,000 graduates in 1990.c The current data (~2004) indicate that there are 6.7 million students enrolled in state universities and colleges; if the 1990 proportion still holds, that would yield about 300,000 students currently enrolled in engineering programs. According to India’s National Association of Software and Services Companies (NASSCOM), 341,649 students were enrolled in engineering undergraduate programs in 2004, and that same year 184,347 students graduated.d Numbers of Chinese Engineering Graduatese Data from the Ministry of Science and Technology (MOST) of the People’s Republic of China indicate that 1,877,500 undergraduate degrees 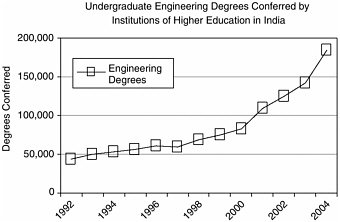 CHART SOURCE: NASSCOM. 2005. Knowledge Professionals. National Association of Software and Service Companies, India. |
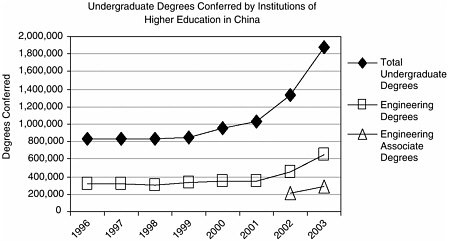 were conferred in 2003, of which 644,106 were in engineering (34.3 percent). Of the engineering degrees, 292,569 (45 percent) are three-year associate degrees.f A 2005 McKinsey Global Research Institute study lists China as having had 1.7 million college graduates in 2003, 33 percent of whom were in engineering, for a total of 550,000 engineering degrees.g
|
industry or elsewhere.93 According to 2004 report, between 1998 and 2001, 76 percent of foreign doctoral degree recipients in science and engineering fields with known plans intended to stay in the United States, and 54 percent accepted firm offers to do so.
Stay rates for foreign students are not static and are influenced by a variety of factors, including U.S. immigration policies, the number and quality of job opportunities in the home countries of the students, and political change. They also vary by place of origin. For example, in the 1990s both the number of science and engineering students from South Korea and Taiwan and the number who intended to stay in the United States after receipt of their doctoral degree dropped. Both countries have expanded and improved their advanced science and engineering programs and created research institutions that offer more attractive careers for their expatriate scientists and engineers. Between 1985 and 2000, only 26 percent of South Koreans and 31 percent of Taiwanese doctorate recipients reported accepting offers of employment to remain in the United States.
According to a 2003 article in The Economist, China’s Ministry of Personnel estimated that some 580,000 Chinese students had studied overseas since the late 1970s, with only about 160,000 returning.94 For example, in 2001, 70 percent of science and engineering doctoral degree recipients from China reported accepting firm offers for employment or postdoctoral research in the United States. But the trend may be changing, as greater numbers of expatriates return home every year. Although only about 9,000 Chinese returned home in 2000 after completing their doctoral studies in the United States, the number had doubled to 18,000 by 2002. Over the past decade, China has made major efforts to lure well-trained expatriates back home to work in academia or start-up companies. For example, in 1994 the Chinese Academy of Sciences launched the Hundred Scholars Project by offering returning young scientists lucrative salary and laboratory set-up packages.95
A SNAPSHOT OF THE GLOBAL TECHNOLOGY LANDSCAPE
The section below highlights, on a per-country basis, global advances in life sciences technology. This section is by no means intended to be comprehensive. Rather than an exhaustive analysis, a snapshot is provided of the current global technology landscape, the forces that drive it, and the features that may emerge with respect to the dual-use nature of advancing technologies. Many regions and countries, including the United States, the European Union, and Japan, have already been profiled quantitatively in the previous sections of this chapter. This section highlights and qualitatively profiles other regions and countries that may not
be considered global leaders currently but that nonetheless represent focal points for life science-related technological growth. They were selected on the basis of recent known investments in life sciences research and technology, indications that the countries are expanding their science and technology foundations (e.g., a recent series of papers in Nature Biotechnology highlighted six so-called innovating developing countries,96—developing countries that have demonstrated success in utilizing advanced technologies for the purposes of improving the well-being of their populations) and are making well-publicized national efforts to become regional centers of excellence.
East Asia and the Pacific97
The East Asia and Pacific region has made significant economic progress in recent years, with the proportion of the population living in extreme poverty falling from 29.6 percent in 1990 to 14.9 percent in 2001. The region leads the developing world in terms of high-technology exports, including not only pharmaceuticals but also scientific instruments, computers, and aerospace products. However, economic and technological progress in this region is highly uneven, with some countries, such as China, having accomplished much more than others. Indeed, as already indicated and as elaborated below, China is poised to become a future global leader in life-sciences-related technologies.
China
Although China’s scientific capacity quickly fell further behind that of the developed world during the Cultural Revolution, which began in 1966, extensive government reforms in the late 1970s and 1980s identified science as central to the country’s process of modernization and economic development.98 In its effort to “catch up” with the rest of the world, China has made dramatic progress in recent years. Indeed, in the most recent Global Trends report by the National Intelligence Council,99 the likely emergence of China, along with India, as new major global players is compared to the rise of Germany in the 19th century and the United States in the early 20th century. Several factors will fuel this rapid rise in economic and political power, including the active promotion of advanced technologies and the purchasing powers afforded by such large populations (China’s population is projected by the U.S. Census Bureau to reach 1.4 billion and India’s 1.3 billion by 2020). China is already the third-largest producer of manufactured goods, its share having risen from less than 5 percent in 1980 to about 12 percent today. It is expected to surpass Japan with respect to manufacturing share and exports in the next few years.
Competition from Chinese-manufactured products already restrains manufacturer prices worldwide.
China has made remarkable strides in agricultural biotechnology by accelerating its investments in this area and focusing on commodities that have been largely ignored by commercial interests in other nations.100 Employing more than 70,000 scientists, China has one of the most successful agricultural research systems in the developing world and is said to be experimenting with more than 120 functional genes among 50 different crop species.101 Between 1996 and 2000, China’s Office of Genetic Engineering Safety Administration approved more than 250 genetically modified (GM) plants, animals, and recombinant microorganisms for field trials, environmental releases, or commercial use. The Chinese government funds almost all plant biotechnology research and in 2001 announced plans to raise the biotechnology research budget by 400 percent over the next 5 years. This is in contrast to most of the industrialized world, where private companies carry out most agricultural biotechnology research.102
China’s most successful venture with GM crops has been with Bt (Bacillus thuringiensis) cotton;103 from only 730 sown hectares in 1997, by the year 2000, 700,000 hectares had been sown with Bt cotton by 2000. According to one report, Bt cotton is the world’s most widespread transgenic crop sown by small farmers, reducing the cost for farmers by U.S. $762 per hectare per season (i.e., largely due to reduced pesticide use).104 According to the ISAAA report referenced previously, Bt cotton is ranked third in terms of millions of hectares grown in 2004 by all farmers, small or large; the number one biotech crop is herbicide-tolerant soybean, followed by Bt maize.
To date, biotech crops worldwide are primarily used for non food-related purposes (e.g., for fiber, animal feed). This is true despite heavy investments in biotech food crop research. Two of four GM rice varieties, both insect resistant, are already in farm-level preproduction trials (i.e., the last step before commercialization).105
Notable achievements in China’s health biotechnology sector include the country’s participation in the Human Genome Project (China was the only developing country that participated); the 2002 sequencing by Chinese scientists of the rice genome;106 the approval for market of several Chinese-produced vaccines, diagnostics, and therapeutics (with more than 150 health biotechnology products in clinical trials); the 2003 announcement that a Chinese firm had obtained the world’s first drug license for a recombinant gene therapy; and China’s liberal environment and access to human embryos for biotechnology research.107 Additionally, Chinese-authored health biotech publications appearing in the Institute for Scientific Information (ISI)-tracked journals increased from less than 50 in 1991
to more than 300 in 2002.108 Similarly, there was a modest increase in the number of U.S. Patent and Trademark Office (USPTO) patents in health biotechnology over the same time period (from near zero in 1991 to between 10 and 15 in 2001 and 2002).109
Today, there are about 500 biotechnology firms throughout China, employing more than 50,000 people. These include well-funded state-owned enterprises and smaller but more innovative private companies, the latter often established by returned expatriates. The societal role of Chinese universities has changed extensively over the past few decades, with significant implications for biotechnology.110 Traditionally, higher education concentrated on teaching and training human resources. Now, with an increasing focus on research and industrialization, universities are becoming strong producers of biotechnology knowledge.111 Additionally, China’s large population base and market potential have attracted multinational and other foreign companies, several of which have established joint ventures with domestic companies.112
Although the large proportion of Chinese scientists who study abroad and remain to work may be limiting the growth of China’s domestic biotechnology sector (e.g., Chinese scientists comprise the largest segment of U.S. science and engineering doctorates awarded to foreign citizens), an increasing number of former expatriates are returning to China to form startups and otherwise engage in biotech research and development. Limited local collaboration is frequently cited as another obstacle to biotechnology growth in China. For example, although scientists from the Beijing Genomics Institute made great efforts to find cooperative partners during the SARS outbreak in China, they were unable to obtain virus samples for testing113 until after a Canadian group had already posted the entire genome sequence on the Internet. There are signs that this too is changing. For example, while only 13.6 percent of all articles published by Chinese scientists in the international peer-reviewed literature in 1991 included authors from more than one institution, the figure rose to 30 percent by 2002.114
Of note, in 2004, China’s President Hu Jintao reportedly mentioned brain and cognitive science as one of China’s next scientific research frontiers.115 Not only does this represent an important scientific policy change for China, it is of interest because of the greater dual-use potential that brain and cognitive science research is expected to pose in the future (Chapter 1).
On the nanotech front, as indicated above, the number of nanotechnology patent applications from China ranks third in the world behind the United States and Japan, and Chinese papers on nanoscience and nanotechnology in peer-reviewed international journals now out-number those from the United States. China is also experiencing one of
the fastest rates of increase of Internet and cell phone users in the world and is the leading market for broadband communication.116
Singapore
Recent biotechnological growth in Singapore promises to push the country to the forefront as a regional and global biotechnology hub. At least that is its vision: to create infrastructure and industry pipelines that will serve both basic research and the health delivery system. The primary driver is economics. As discussed previously, Singapore wishes to establish biotechnology as the “fourth pillar” of it economy. Strengthening its biotechnological capacity is expected to slow or stop the outsourcing of “high-tech” jobs to India and China.117
In the late 1990s, Eli Lilly and Company opened its only clinical pharmacology unit outside the United States, in Singapore, and is recruiting talent from around the globe.118 In 2001, the company entered into an agreement with the Singapore Economic Development Board to establish an R&D center in Singapore to focus on systems biology.119 Adding further to the international investment in biotechnology in Singapore, in January 2003, Novartis opened the Novartis Institute for Tropical Diseases in Singapore.120
In its efforts to become a global genomic hub with strong ties to the international community, the Singaporean government took a major step forward when it established Biopolis, which is already considered a world-class biomedical research and development hub. Comprising five different research institutes, Biopolis serves as a site for both public and corporate R&D (e.g., including Novartis). Remarkably, the facilities evolved from initial groundbreaking to official opening in a single year. In November 2004, Biopolis hosted the 5th Human Genome Organization (HUGO) Pacific Meeting and the 6th Asia-Pacific Conference on Human Genetics.121
In partnership with the Centers for Disease Control and Prevention (CDC), NIH, and FDA, the Singaporean government recently opened the Regional Emerging Diseases Intervention Center (REDI) to conduct research on new viruses and bioterrorist threats and to establish public health policies for emerging infectious diseases. REDI is already beginning to serve as a regional reference center for molecular diagnostics.122
South Korea
In 1994, the South Korean government announced intentions to make South Korea one of the world’s top seven biotechnology-producing countries by 2010. In 2002, South Korea won the bid to be the permanent host
of the International Vaccine Institute, claiming for itself an important platform in the global biotechnology arena.123 South Korea has demonstrated that it has the technological potential to transform itself rapidly into one of the world’s major economies.124 Known more for its strengths in consumer electronics, heavy industry, and information technology, its biotechnology sector has attracted worldwide attention in recent years when its scientists reported significant advances in the efficient production of patient-specific embryonic stem cell cultures, a critical step toward successful human therapeutic cloning.125
Between 2000 and 2007, the government will have invested over 5.2 trillion South Korean Won (about U.S. $4.4 billion) in the biotechnology field. Additionally, the government has initiated financing mechanisms for technology transfer from academia to the private sector, and has made progress in developing a legal framework to encourage the growth of Internet Protocol (IP)-dependent biotech enterprises. Currently, an estimated 450 to 600 Korean companies use biotechnology in their business. As mentioned previously, in 2000, there was only one publically listed South Korean biotech company; by 2002, the number had risen to 23. There are over 40 South Korean pharmaceutical firms with approximately 130 new drugs in phase I or II clinical trials.
Basic scientific productivity in South Korea has increased markedly over the past decade. The number of health biotechnology-related publications (in international, peer-reviewed journals) by South Korean researchers increased from less than 50 in 1991 to almost 350 in 2002. Of note, about one-third of these articles were co-authored by international collaborators. Moreover, the number of U.S. patents increased from practically zero in 1991 to between 20 and 40 per year from 1999 to 2002. The focus in the biotechnology sector is on medical treatments for chronic diseases. In addition to meeting domestic demand, biotechnology exports are expected to increase 10-fold over the next 10 years.126
Taiwan
Like South Korea, Taiwan has emerged from a less well-developed economic position in the 1960s to become a powerful technology player with a strong research infrastructure; it ranks 19th in the world in the Scientific Citation Index, up from 35th in 1986.127 Despite overall budget cuts, the government has been investing an extra 8 to 10 percent annually in R&D, and Taiwan’s leading research institution, Academia Sinica, which consists of 25 institutes and more than 800 researchers, has initiated recruitment campaigns and other efforts to keep Taiwanese students from emigrating and to attract foreign talent to its international graduate school. Academia Sinica also now houses a technology transfer office. Al-
though the academy failed to secure a single U.S. patent during its first 70 years of existence, since 1998 it has filed 80 applications, 10 of which have been approved.128
Although Taiwan’s major national technological strength is in the semiconductor and electronics industry, the Taiwanese government envisions a new economy with a strong biotechnology component. The future is unclear, however, as the biotech sector has yet to approach the success of the country’s electronics industry. Despite efforts to recruit high-level researchers, the shortage of talent and personnel, particularly postdoctoral researchers, has been cited as one of the key obstacles to realizing the biotech vision.129 Fewer Taiwanese students are going abroad, and many of those who do study abroad favor business over science and engineering, resulting in fewer expatriates to recruit; as opportunities increase in Beijing and Shanghai, Taiwan attracts fewer postdocs from mainland China, which in the past was a demographic that fueled growth of the electronics field. Rather than pursuing a research career, those who stay home to study science and engineering often take R&D jobs in one of Taiwan’s industrial science parks upon graduation.130
Eastern Europe and Central Asia131
This region in general is experiencing positive economic growth, leading to a reduction in poverty in some areas, but it is also still contending with serious health and social problems, such as the world’s fastest growing HIV/AIDS epidemic, an aging population, and a shrinking workforce. In terms of advanced technologies, notable regional trends include the widespread use of personal computers and the Internet. Between 1995 and 2002, PC availability in European and Central Asian developing countries grew about 22 percent per year. In 2002, the region experienced the highest average rate of PC access of all developing countries (73 per 1,000 people). The Czech Republic, Croatia, Estonia, and the Slovak Republic have the highest availability of PCs in the region. Likewise, Internet use has skyrocketed. The number of Internet users per 1,000 people increased 40-fold in 8 years, from 4 per 1,000 people in 1995 to 160 per 1,000 in 2003. The most rapid growth occurred in Estonia (444 Internet users per 1,000 people), Latvia (404 per 1,000), the Czech Republic (308 per 1,000), and the Slovak Republic (256 per 1,000).
In terms of the global flow of capital, after falling to $37.7 billion in 2001, private capital flows into the region increased by 80 percent to $67.1 billion in 2003, exceeding the flow of private capital into East Asia and the Pacific.132 Foreign direct investment, on the other hand, still lags significantly behind that provided to East Asia and Pacific. In 2003, foreign direct
investment into Europe and Central Asia was about $35.6 billion, compared to nearly $60 billion into East Asia and the Pacific. In 2003 the largest Europe and Central Asia recipients of foreign direct investment were Russia, Poland, Azerbaijan, and the Czech Republic.
Russia
Russia currently faces a severe demographic challenge due to low birth rates, high emigration rates, and a high death rate from emerging and re-emerging infectious diseases—including multidrug-resistant tuberculosis, hepatitis C, and HIV/AIDS)—all of which are expected to continue to contribute to a shrinking working-age population. These and other problems, including poor governance, border conflicts, poor funding for basic science, threaten the ability of this nation, with its longstanding scientific tradition, to participate as a global player in the life sciences.133 However, Russia’s energy resources—particularly its oil and gas exporting potential—give it a leverage that may, over time, boost its economic growth and scientific and technological capacity.
Already, according to some industry analysts, Russia is undergoing an unexpected economic recovery in some areas. In the life sciences industry, according to an Epsicom Business Intelligence industry, the Russian pharmaceutical market is growing at a rate of about nine percent per year.134 According to the U.S. Department of Commerce, the biologically-active food supplements market is one of the fastest-growing sectors of the Russian biotech industry, with estimates of its total market value ranging from U.S. $1.5 billion to $2 billion.135 The food additives market is growing faster than the pharmaceutical market presumably because compared to drugs, food supplements are relatively easy to develop, produce, and register. There are 2,000 registered biologically-active food additives in Russia and 556 local manufacturers of such products, mostly small companies.
Despite poor domestic funding for basic life sciences research (e.g., in 2001 the relative percentage of life sciences funding was less than 22 percent of all research funding, compared to 50 percent in the United States), Russia’s scientific community has benefited from international relationships and collaborations. For example, the State Research Center of Virology and Biotechnology Vector (SCR VB Vector), and other state laboratories play a leading role in Russia’s participation in international efforts to prevent and control the emergence and reemergence of infectious diseases, including smallpox. This particular center has also developed a wide range of diagnostic test kits, some of which are currently being produced by shareholder companies.
Latin America and the Caribbean136
The Latin American and Caribbean region has the highest per capita income and highest life expectancy at birth of all developing regions. However, the region as a whole still faces many significant health, education, and other social challenges. With respect to entering the life sciences industry marketplace, one notable challenge is the cumbersome procedure associated with starting a new business in an “informal” economy, in which businesses pay few taxes, workers generally lack health insurance, products are not subject to quality assurance, and businesses have difficulty accessing courts to resolve disputes. On average, Latin American and Caribbean economies require more days (71) to start a business than do economies in other developing regions (56 days is the global average). The time required to complete the procedures necessary to legally operate a business is considered a gauge of the ease of doing business in a country. The ease of doing business reflects expanding opportunities to become involved in life-sciences-related or other industrial sectors. Countries with the shortest time associated with starting a new business are Panama (19 days), Chile (27 days), Jamaica (31 days), Argentina (32 days), and Guatemala (39 days). Three countries in this region—Brazil, Cuba, and Mexico—are highlighted below. Each demonstrates unique potential to develop and strengthen its life-sciences-related technological capacity.
Brazil
Following China and India, the National Intelligence Council recently identified Brazil, along with Indonesia, Russia, and South Africa, as a “rising star” with respect to economic and political growth and power over the next couple of decades.137 Brazil has a vibrant democracy, a diversified economy, an entrepreneurial population, and solid democratic institutions. Already Brazil enjoys a critical mass of very well-trained scientists and strong public-sector support for research coupled with unparalleled biodiversity, offering the potential for the development of unique plant-based medicines and treatments.138
Brazil’s healthcare biotechnology success is exemplified by Sao Paulo-based Biobras’s development and patenting of a recombinant human insulin in the 1990s—one of only four companies worldwide to have done so at the time; the 2000 sequencing of the plant pathogen Xylella fastidiosa, which has encouraged other health-related genomics projects countrywide;139 the steadily increasing number of Brazilian-authored publications in international peer-reviewed journals; and, as mentioned previously, the rapid expansion of the private biotechnology sector, from 76 Brazilian firms in 1993 to 354 by 2001.140 Although the healthcare biotechnology
sector has not been as successful as it could be in terms of translating basic scientific knowledge into useful commercial products, given the generally excellent conditions for doing so, there are signs that this is changing.141 For example, in 2004 a bill to encourage private sector participation of university professors was under discussion by the Senate.142 In March 2005, the president of Brazil signed a biosafety law that will legalize human embryonic stem cell research and establish a clear process for the approval of genetically modified crops, facilitating research and commercialization in both stem cell and agricultural biotechnology.143
Brazil has also served as a model for how a well-functioning information system can enable large public initiatives, in this case antiretroviral therapy (ART) scale-up for patients with HIV/AIDS through expanding access to antiretroviral health care for people with HIV/AIVS to all in need.144 There was an awareness that, in a country the size of Brazil, the logistical demands of ART scale-up would require the ready availability and usability of valuable, accurate information pertaining to all aspects of drug delivery, from procurement to patient compliance. In response, two national computerized systems were created and deployed: SICLOM (Sistema de Controle Logistico de Medicamentos, or System of Logistical Control of ARV), to register and track the distribution of antiretrovirals;145 and SISCEL (Sistema de Controle de Exames Laboratoriais, or Systems for Control of Laboratory Exams), to track CD4 and viral load laboratory test results.146
Cuba
Health-related Cuban biotechnology products are exported to more than 50 countries.147 Its vaccine industry has generated attention from the international community. Cuba was one of the first countries to have developed a vaccine against the group B meningococcus, although its efficacy may be restricted to a limited number of strains. More recently, Cuban scientists played a leading role in developing the world’s first human vaccine with a synthetic carbohydrate antigen, for use in protecting against Haemophilus influenzae Type b (Hib) disease.148
Cuba has built international collaborations to promote innovation within its biotechnology sector, particularly health biotechnology. This has occurred despite limited financial resources and the U.S. trade embargo, which was imposed in 1966. For example, in July 2004, a joint venture between the Center for Molecular Immunology (Havana) and YMBiosciences (Canada) made an agreement with a U.S. firm in Carlsbad, CA, to undertake development and licensing of two Cuban anticancer therapeutics.149 More recently, in April 2005 it was announced that Cuban Defense Minister Raul Castro and Malaysian Deputy Prime Minister Najib
Razak had established a bilateral trade and cooperation agreement that will allow Cuban researchers to test experimental vaccines and drug products on the very ethnically-diverse Malaysian population.
Like many developing countries, Cuba suffers from a “brain drain,” because many of its current leaders in biotechnology have been influenced by studying abroad in the United States and Europe, and Cuban firms are involved in international collaborations with companies worldwide. The main driving force behind the growth of Cuba’s health biotechnology sector has been the desire to improve the health of its citizens, as evidenced by strong governmental support.150 Cubans have one of the longest life expectancies in the Americas (76.7 years), universal access to health care, and an integrated research/healthcare system enterprise that encourages the creation of innovative products.
Mexico
In 1999 a group of Mexican biomedical experts met to analyze the potential impact that genomic medicine could have in Mexico and designed a plan with three 5-year periods to establish and develop a genomic medicine platform—the first in Latin America and one that is expected to serve as a regional model for other countries. The plan has three components: (1) development of a new Institute of Genomic Medicine (Institute de Medicina Genomica);151 (2) an intramural program that will provide expertise, research, and technological capabilities; and (3) a strong extramural program that will foster domestic and international collaborations. Some early accomplishments include the identification of more than 100 candidates for the intramural faculty, most of whom are Mexicans working in Mexico or abroad, with expertise in genomics, bioinformatics, and medical research; sponsorship of dozens of lectures on topics related to genomic medicine, many of which are available on the Internet; and the establishment of several new graduate courses in genomic medicine.152
Given the country’s ethnically diverse population composition (i.e., more than 65 ethnic groups) and health demands (including both chronic and emerging infectious diseases), Mexican officials assert that a genome-based medicine in Mexico should be based on applications that have been developed specifically for the Mexican population—as opposed to importing products that have been developed for use in some other population. Advancing genomic technology and developing and owning a Mexican-specific genomic database is viewed as an important step, toward improving not only public health and economic development but also national security.153
Middle East and North Africa154
The Middle East and North African region has a well-developed natural resource infrastructure. Over 85 percent of its population has access to clean water, despite critical shortages of freshwater resources. The region has only 761 cubic meters of internal freshwater resources per person, compared to an average 6,441 cubic meters per person across developing regions worldwide. Sixty-four percent of its roads are paved. Yet the region has made little progress with respect to reducing the number of people living on less than U.S. $1 to $2 a day. Although energy production has increased substantially—low- and middle-income countries in the region produced 26 percent more energy in 2002 than in 1990—energy use per capita has been increasing at an even more rapid rate (by 36 percent over the same time period). The average annual increase in energy use has been the greatest of any developing region at 4.5 percent/year.
In terms of life sciences research and biotechnology development, the countries highlighted here were selected based on information recently published in the scientific literature.
Egypt
Egypt has emerged as a scientific leader among Arab states, particularly in agricultural biotechnology but also in the health biotechnology sector, as evidenced by its ability to rapidly respond to local health crises.155 For example, in response to an acute insulin shortage in 2002, an internationally partnered emergency plan led to local production of recombinant insulin, which had previously been largely (90 percent) imported at a cost of U.S. $35 million annually. Now, the country continues to rely on local manufacture of insulin for its estimated 3 million to 5 million diabetics who can be treated using the recombinant hormone.156 Similarly, Egypt has developed several diagnostic and therapeutic products for hepatitis C, rates of which are higher in Egypt than in neighboring countries and other countries with comparable socioeconomic conditions.157 Also in cooperation with U.S. partners, the Schistosomiasis Research Vaccine Development Project is developing two vaccine candidates for use against what has emerged as the leading parasitic disease in rural Egypt and the number one cause of death among men aged 22 to 44 years.158
Egypt’s government is actively promoting local health care biotechnology with the aim of reducing dependency on importation—for example, by channeling funds toward the building of multipurpose biotechnology pilot manufacturing plants (which are located in the Mubarak City for Scientific Research and Technology Applications, the National Research Centre (NRC), and El Monoufiya University) and by introducing
biotechnology educational programs into Egypt’s higher education system. The National Strategy for Genetic Engineering and Biotechnology, which was developed in the mid-1990s, includes both short- and long-term plans for the production and marketing of a range of vaccines and diagnostic and other products.159
Egypt’s health biotechnology sector still relies on the strength of its international linkages, however, in terms of education and training and the actual technology. The country currently exploits knowledge in the public domain more than it does novel contributions by its own research community, and most Egyptian biotechnology companies rely on international contacts rather than local academic research. This reliance on the international community has led to the creation of a global network of alliances among foreign experts and Egyptian scientists living both abroad and at home.160
Israel
Israel has seen significant growth in the life sciences and biotechnology development over the past two decades. Currently, almost 60 percent of Israeli-authored scientific publications are in the life sciences, including medicine and the agricultural sciences. As an example of the type of innovative, cutting-edge life sciences research emerging from Israel, in March 2005, scientists from the Institute of Catalysis Science and Technology (Technion, Israel) reported that they had developed a biological computer composed entirely of DNA molecules and enzymes.161 If borne out, this type of molecular computer could potentially be used in the future for any of a variety of practical applications, including the encryption of information.
According to the Israel National Biotechnology Committee, the number of biotech companies increased from only a handful in 1980 to about 160 by 2000, and the number of people employed in the industry rose ten-fold from about 400 in 1988 to some 4,000 in 2000.162 According to the Ministry of Industry and Trade, therapeutic pharmaceuticals comprise about 67 percent of Israeli biotechnology sales, agricultural and veterinary products about 23 percent (not only genetically engineered hybrid seeds but also poultry and farm animal vaccines, etc.), and diagnostics another 4 percent.163
The Office of the Chief Scientist provides $400 million in grant money annually to life sciences companies and has created a network of 24 technology “incubators” for promoting technology transfer from academic institutions to industry. The U.S.-Israel Science and Technology Foundation—a bilateral joint venture between the Israeli and U.S. governments,
is promoting entrepreneurship in Israel through distance training of Israeli companies (e.g., through the Larta Institute, Los Angeles, CA).
Libya164
Although Libyans enjoy the highest per capita income in Africa, their 12 years of isolation while the country was under an international sanctions regime effectively halted their scientific and technological progress. The last sanctions were lifted in 2004. The newly constructed $100 million Center for Infectious Disease Control in Africa (Tripoli) is one of several recent developments with the aim of making Libya a regional, and eventually a global, center for scientific and technical collaboration. Other initiatives include an exchange program between Italian and Libyan disease researchers, and there are plans to build an on-site factory for generic drug production (for HIV/AIDS, malaria, and tuberculosis). However, a recent highly politicized trial of western healthcare workers on charges that they had allegedly promoted the dissemination of HIV may have dampened current enthusiasm for collaborations with Libya.
Saudi Arabia
In December 2004, Abdul Latif Jameel Company, Ltd.165 (Jeddah, Saudi Arabia) announced that it would be making a $1 million annual donation to the Arab Science and Technology Foundation (ASTF) to launch and support a new research fund that will provide merit-based support for research projects in nanotechnology, biotechnology, pharmaceuticals, and science. Modeled after the U.S. National Science Foundation, scientists from the 22 Arab nations will be eligible to compete for the grant money. Although this is a drop in the bucket compared to what U.S. and other foundations, even small ones, provide, it represents the first pan-Arab science fund.166
South Asia
South Asia has experienced rapid economic growth over the past 15 years, averaging 5.3 percent annually. Since 1990, India has reduced its poverty rate by 5 to 10 percent and, indeed, is forecast by some to become the world’s fastest-growing economy in the future (see below). The region has also experienced tremendous growth in modern information and communications technologies. Bangalore, India—the “Silicon Valley” of India—has emerged as a global hot spot for the information technologies industry, with nearly 1,200 companies, including more than 100 multinational companies, operating there. The first company to enter Bangalore,
for offshore development, was Texas Instruments in 1984. India’s biotechnology achievements are discussed below.
India
Although India currently lags behind China with respect to most economic measures, it is expected to sustain high levels of economic growth and could eventually overtake China as the fastest-growing economy in the world (not because its economic growth rate will match those previously achieved by China over the past decade, but because China’s ability to sustain its current rapid growth rate is at risk). Like China, India’s rise to economic prominence will have a regional impact, including throughout Southeast and Central Asia and in Iran and other Middle East countries, with whom India will likely pursue strategic partnerships in many sectors, including the life sciences and its associated industries.
India’s strength has been in bulk and generic manufacturing and low-cost processing, but there are signs that this may be changing.167 In the basic research arena, the new Science Advisory Council to the Prime Minister has recommended a National Science and Engineering Research Foundation. Modeled after the U.S. National Science Foundation, the new foundation is widely viewed as being an important step toward strengthening the country’s scientific establishment.168
According to a 2003 Ernst & Young report,169 over 328 companies and 241 institutions in India use some form of biotechnology in agricultural, medical, or environmental applications. There are 96 Indian biotechnology companies, giving India the third-largest biotech sector in the Asian region (behind Australia, with 228 enterprises, and China/Hong Kong, with 136).170 This includes both small and medium-sized enterprises, most of which focus on biopharmaceuticals.
As a result of its emphasis on manufacturing processes rather than on developing novel products, India has developed a strong generic and bulk pharmaceutical manufacturing base and considerable expertise in manufacturing and process innovations. For example, one of the country’s more notable biotechnology successes was the development and production of a recombinant hepatitis B vaccine. Although Shanvac-B, as it was named, was not a novel product, its development relied on novel expression technology, lessened the dependence on imports, and provided vaccine at a very low price: $0.50 per dose. It is now supplied to the United Nations Children’s Fund (UNICEF). Currently, India is the third-largest producer and prime exporter of generic drugs in the world.
Using their processing strength to their advantage, Indian entrepreneurs and local companies have cultivated a diverse network of global relationships, which they are using to diversify and expand into the glo-
bal marketplace. For example, Shantha Biotechnics has forged a joint venture with East West Laboratories (San Diego, CA) to develop novel therapeutic monoclonal antibodies for the treatment of various types of cancer.171
In the agricultural arena, India has actively promoted the development and use of genetically modified crops nationwide and throughout Asia. In 2002, the Indian government held a conference in New Delhi, at which 18 Asian countries formed an alliance to deal with issues surrounding the introduction of GMOs.172 According to a 2002 report in Nature Biotechnology, the participating countries planned to help each other build scientific capacity to assess the environmental and food safety of GMOs, establish appropriate administrative and legal frameworks, and provide training and other facilities for strengthening the infrastructure for handling GMOs.
As another example of its regional or, in this case, global service with respect to science and technology generally, New Delhi is the site of one of two headquarters for the International Center for Genetic Engineering and Biotechnology (ICGEB; the other office is in Trieste, Italy). The ICGEB was founded in 1983 as a mechanism for involving developing countries in biotechnology. It is an intergovernmental organization with 69 signature states, 52 member states, and a 35-center network. As summarized in the Cuernavaca workshop report173 and as detailed on the ICGEB website174 the center performs several functions, including its current agreement with the United Nations Secretariat to draft a code of conduct for scientists.175 The operational group tasked with drafting the code of conduct is composed of members of the ICGEB and the National Academies of Sciences of China, Cuba, Italy, Nigeria, and the United States. The draft code of conduct was presented to the Secretary-General of the United Nations in April 2005, and in August 2005, it was transmitted as a working document to the BWC.176
Along with Brazil, India is one of several developing countries that has launched a major nanotechnology initiative. The country’s Department of Science and Technology will invest U.S. $20 million over the next five years for its Nanomaterials Science and Technology Initiative.
Sub-Saharan Africa
The recent increased access to cell phone service across sub-Saharan Africa, as previously discussed, reflects a positive development in terms of establishing the infrastructure necessary for a modern economy. Yet sub-Saharan Africa has the largest proportion of people living on less than U.S. $1 a day, and even though the regional economy is expected to improve over the next 10 years or so, with an average per capita growth of
1.6 percent, the number of poor is expected to continue to rise as well (from 313 million in 2001 to 340 million by 2015). A few countries, such as Uganda and Ghana, have sustained remarkable progress in terms of poverty reduction, despite the many social, economic, and political challenges facing the region.
Below, South Africa’s recent success in biotechnology is highlighted.
South Africa
Despite its many social and health challenges—including HIV/AIDS, poverty, and crime—South Africa’s economy is expected to grow by about 4 to 5 percent per year over the next 10 years, propelling the country even further ahead than it already is in relation to its sub-Saharan neighbors. By focusing on arms, textiles, and mining, South Africa has developed a strong scientific and technological base over the past several decades, even while remaining relatively isolated from the international community while under the apartheid regime.177 South Africa’s industrial success in these areas led to a confidence that has fostered more recent huge strides in agricultural and health biotechnology.
In terms of health biotechnology, the government has established initiatives to encourage international partnerships in the life sciences industry; biotech start-ups, like Shimoda Biotech (with a focus on cyclodextrin drug delivery) and Bioclones (with a focus on monoclonal antibody technology testing for use in diagnostics and immunohistology), are emerging from universities and preexisting generic product companies; diagnostic testing and clinical trials are expanding; and recent controversy over HIV/AIDS national policy has raised awareness about recombinant vaccine trials.
In addition to developing its own national biotech sector, South Africa is hoping to use regional initiatives—such as the New Partnership for African Development—to export its products to other sub-Saharan countries and to use its biotechnological strength to address HIV/AIDS and other regional public health problems. The University of Cape Town and University of Stellenbosch are currently evaluating six different potential novel HIV/AIDS vaccine candidates; in 2002, two Phase I trials were launched, making South Africa the first country with multiple HIV vaccine trials and the first country to have executed a trial on a preventative vaccine against the HIV-1 C subtype.178
Elsewhere in Africa, in January 2005 a group of African scientists, engineers, and educators announced plans for an African Institute for Science and Technology, with the aim of strengthening sub-Saharan Africa’s tertiary education and research. Currently, the region has only about 83 scientists or engineers per million residents, which is one-sixth of the ratio
for all developing countries. Modeled on the Indian Institutes of Technology, the first institute is expected to open in Tanzania in 2007 and will offer undergraduate and graduate degrees in science, engineering, economics, and management. The aim is to attract as many African Ph.D.s working abroad as possible.179
SUMMARY
Although providing no more than a high level survey of current trends in the globalization of advanced technologies in the life sciences, the data provided in this chapter do provide evidence that both basic and cutting-edge life sciences technologies are highly dispersed worldwide, and will continue to become more so in the near-term future. The drivers for this are several and vary by nation and region. Developing countries recognize the potential of novel technologies to boost their economies, promote their development, and enhance their regional standing. Turner T. Isoun, Nigeria’s minister of science and technology, has observed that “developing countries will not catch up with developed countries by investing in existing technologies alone. [In order] to compete successfully in global science today, a portion of the science and technology budget of every country must focus on cutting-edge science and technologies.”180 This statement, echoing the aspirations of many lesser developed countries, has important implications for the future dispersion of knowledge in the global life sciences community. The trends are profound and well rooted.
ENDNOTES
|
1 |
For most of the core reagents for DNA synthesis, there are no longer any significant U.S. suppliers. As a result, DNS synthesis technology is being “off-shored” to countries with lower labor costs at least as fast as the technology is being developed. This trend can only be expected to escalate in the coming years. |
|
2 |
|
|
3 |
Jimenez-Sanchez, G. 2003. Developing a platform for genomic medicine in Mexico. Science 300(5617):295-296. |
|
4 |
www.biomed-singapore.com/bms/sg/en_uk/index/newsroom/speeches/2000/minister_for_trade.html. |
|
5 |
Institute of Medicine/National Research Council. 2005. An International Perspective on Advancing Technologies and Strategies for Managing Dual-Use Risks. Washington, DC: The National Academies Press. |
|
6 |
For more detailed discussion of the national genomic medicine initiative in Mexico and Singapore’s genomic medicine and other biotechnology initiatives, see Institute of Medicine/National Research Council. 2005. An International Per- |
|
|
spective on Advancing Technologies and Strategies for Managing Dual-Use Risks. Washington, DC: The National Academies Press. |
|
7 |
National Intelligence Council. 2004. Mapping the Global Future, Report of the National Intelligence Council’s 2020 Project. Available online at www.cia.gov/nic/nic_globaltrend2020.htm#contents [accessed April 26, 2006]. |
|
8 |
It should be noted that article X of the Biological and Toxin Weapons Convention (BWC), and Article XI of the Chemical Weapons Convention (CWC), mandate peaceful cooperation among nations in biology and chemistry. |
|
9 |
Hoyt, K. and S.G. Brooks. 2003/2004. A double-edged sword. International Security 28(Winter):123-148. |
|
10 |
Dicken, P. 1998. Global Shift: Transforming the World Economy, Third Edition. New York: The Guilford Press. |
|
11 |
Mashelkar, R.A. 2005. India’s R&D: reaching for the top. Science 307(5714):1415-1417. |
|
12 |
See www.inpharm.com/External/InpH/1,2580,1-3-0-0-inp_intelligence_art-0-307722,00.html [accessed May 9, 2005]. |
|
13 |
See www.ims-global.com/insight/news_story/0503/news_story_050330.htm [accessed May 9, 2005]. |
|
14 |
Normile, D. and C.C. Mann. 2005. Asia jockeys for stem cell lead. Science 307(5710): 660-664. |
|
15 |
Although $400 billion was quoted at the Cuernavaca workshop by Terrence Taylor, a Frost & Sullivan analysis puts the figure at $447.5 billion for 2004. See www.frost.com/prod/servlet/vp-further-info.pag?mode=open&sid=2850225 [accessed May 5, 2005]. |
|
16 |
From Terence Taylor’s presentation at the Cuernavaca workshop, September 21, 2004. National Research Council/Institute of Medicine. 2005. An International Perspective on Advancing Technologies and Strategies for Managing Dual-Use Risks. Washington, DC: The National Academies Press; Table 3-2, pg. 38. |
|
17 |
See www.frost.com/prod/serv/vp-further-info.pag?mode=open&sid=2850225 [accessed May 9, 2005]. |
|
18 |
Supra, note 16. |
|
19 |
Kinsella, K. and V.A. Velkoff. 2001. An Aging World: 2001. U.S. Census Bureau, Series P95/01-1. Washington, DC: Government Printing Office. |
|
20 |
See www.bio.org/speeches/pubs/er/statistics.asp [accessed May 6, 2005]. |
|
21 |
Berg, C. et al. 2002. The evolution of biotech. Nature Reviews 1(11):845-846. Although these figures may not seem remarkable at first glance, they are impressive in light of the fact that this time period covered the dot-com crash. |
|
22 |
Ferrer, M. et al. 2004. The scientific muscle of Brazil’s health biotechnology. Nature Biotechnology 22(Suppl.):DC8-DC12. |
|
23 |
See www.larta.org/lavox/articlelinks/2004/040510_usisrael.asp [accessed May 9, 2005]. |
|
24 |
Wong, J. et al. 2004. South Korean biotechnology—a rising industrial and scientific powerhouse. Nature Biotechnology 22(Suppl.):DC42-DC47. |
|
25 |
See www.jba.or.jp/eng/jba_e/index.html [accessed May 9, 2005]. |
|
26 |
Biotechnology Industry Facts, 2005, http://www.bio.org/speeches/pubs/er/statistics.asp. |
|
27 |
Biotechnology Industry Organization (BIO), 2005. Guide to Biotechnology. Available online at www.bio.org/speeches/pubs/er/ [accessed May 5, 2005]. |
|
28 |
Ibid. |
|
29 |
Cutiss, E.T. 2005. Nanotechnology—Market Opportunities, Market Forecasts, and Market Strategies, 2004 to 2009. Research Report # WG8270, electronics.ca publications, January. Available online at www.electronics.ca/reports/nanotechnology/opportunities.html [accessed January 3, 2006]. |
|
30 |
Blumenstyk, G. 2004. Big bucks for tiny technology. The Chronicle of Higher Education 51(3):A26. Available at chronicle.com/free/v51/i03/03a02601.htm [accessed January 4, 2006]. |
|
31 |
Monastersky, R. 2004. The dark side of small. The Chronicle of Higher Education 51(3):A12. Available online at chronicle.com/free/v51/i03/03a01201.htm [accessed January 4, 2006]. |
|
32 |
As defined by N. Seeman at the Cuernavaca Workshop; Institute of Medicine/National Research Council, 2005. An International Perspective on Advancing Technologies and Strategies for Managing Dual-Use Risks. Washington, DC: The National Academies Press; 50. |
|
33 |
Ibid. |
|
34 |
DiJusto, P. 2004. Nanosize me: nebulous naming-nano knack not needed. Scientific American (December). |
|
35 |
Seeman, N.C. and A.M. Belcher. 2002. Emulating biology: building nano-structures from the bottom up. Proceedings of the National Academy of Sciences 99(Suppl. 2):6451-6455. |
|
36 |
Seeman, N.C. 1999. DNA engineering and its application to nanotechnology. Trends in Biotechnology 17(11):437-443; Fortina, P. et al. 2005. Nanobiotechnology: the promise and reality of new approaches to molecular recognition. Trends in Biotechnology 23(4):168-173. |
|
37 |
Nanobiotechnology is an emerging area of scientific and technological opportunity. Nanobiotechnology applies the tools and processes of nano/microfabrication to build devices for studying biosystems. Researchers also learn from biology how to create better micro-nanoscale devices. www.nbtc.cornell.edu/. |
|
38 |
2005 Nanomedicine, Device & Diagnostic Report, available online at www.nhionline.net/products/nddr.htm. |
|
39 |
www.corporate-ir.net/ireye/ir_site.zhtml?ticker=APPX&script=410&layout=6&item_id=660605 [accessed May 9, 2005]. |
|
40 |
www.angstromedica.com/images/NanOss%20Clearance.htm [accessed May 9, 2005]. |
|
41 |
www.micronisers.com [accessed May 9, 2005]. |
|
42 |
newdelhi.usembassy.gov/wwwhpr0812a.html [accessed June 23, 2005]. |
|
43 |
Bapsy P.P. et al. 2004. DO/NDR/02 a novel polymeric nanoparticle paclitaxel: Results of a phase I dose escalation study. Journal of Clinical Oncology 22(14S): 2026; Salamanca-Buentello, F. et al. 2005. Nanotechnology and the developing world. PloS Medicine 2(5):383-386. |
|
44 |
Court, E. et al. 2005. Will Prince Charles et al. diminish the opportunities of developing countries in nanotechnology? Available online at www.nanotechweb.org/articles/society/3/1/1 [accessed February 21, 2005]. |
|
45 |
Salamanca-Buentello, F. et al. 2005. Nanotechnology and the developing world. PloS Medicine 2(5):383-386. |
|
46 |
Hassan, M.H.A. 2005. Small things and big changes in the developing world. Science 309(5731):65-66. |
|
47 |
Ibid. |
|
48 |
Salamanca-Buentello, F. et al. 2005. Nanotechnology and the developing world. PloS Medicine 2(5):383-386. |
|
49 |
Ibid. |
|
50 |
It should be noted that with the application of any new technology to the consumer market there is often controversy. This is no less so for “genetically modified” foods. It is beyond the scope of this report to provide an in depth treatment of the debate over the safety and ethical use of GM crops and commodities. For an overview of this issue, please see, Department of Energy, 2005. Genetically Modified Foods and Organisms, on the Human Genome Project Information Website, www.ornl.gov/sci/techresources/Human_Genome/elsi/gmfood.shtml [accessed January 4, 2006]. |
|
51 |
These production differences are likely due to geographic differences in sunlight, temperature, nutrients, and water. |
|
52 |
Global Status of Commercialized Biotech/GM Crops: 2004. Available online at www.isaaa.org/ [accessed February 21, 2005]. |
|
53 |
Information on China presented by Luis Herrera-Estrella to committee at Cuernavaca; Institute of Medicine/National Research Council. 2005. An International Perspective on Advancing Technologies and Strategies for Managing Dual-Use Risks. Washington, DC: The National Academies Press; 21. |
|
54 |
Global Status of Commercialized Biotech/GM Crops: 2004. Available online at www.isaaa.org/ [accessed February 21, 2005]. |
|
55 |
Based on presentation by Luis Herrera-Estrella to committee at Cuernavaca; Institute of Medicine/National Research Council. 2005. An International Perspective on Advancing Technologies and Strategies for Managing Dual-Use Risks. Washington, DC: The National Academies Press; 21. |
|
56 |
Ibid. |
|
57 |
Global Status of Commercialized Biotech/GM Crops: 2004. Available online at www.isaaa.org/ [accessed February 21, 2005]. |
|
58 |
Asian Development Bank. 2001. Agricultural biotechnology, poverty reduction, and food security. Manila, Philippines: Asian Development Bank. Available online at www.adb.org/Documents/Books/Agri_Biotech/default.asp [accessed February 9, 2005]. |
|
59 |
Asian Development Bank. 2001. Agricultural biotechnology, poverty reduction, and food security. Manila, Philippines: Asian Development Bank. Available online at www.adb.org/Documents/Books/Agri_Biotech/default.asp [accessed February 9, 2005]. |
|
60 |
Arntzen, C.J. and M.A. Gomez-Lim. 2005. BioPharming: plant-derived vaccines to overcome current constraints in global immunization. Institute of Medicine/National Research Council. 2005. An International Perspective on Advancing Technologies and Strategies for Managing Dual-Use Risks. Washington, DC: The National Academies Press; 19. |
|
61 |
Vinas, T. 2004. Making waves. IndustryWeek.com (August). Available online at www.bio.org/ind/pubs/IndustryWeek_81704.pdf [accessed January 4, 2006]. |
|
62 |
International Association of Soaps, Detergents, and Maintenance Products, 2002: Poster; An Overview of the major European and international developments, the key association activities, and the main technological innovations of the industry. See www.aise-net.org/PDF/ar_2002_poster.pdf. |
|
63 |
|
|
64 |
See www.iogen.ca/. |
|
65 |
|
|
66 |
It should be noted that these figures are most likely underestimates of the total expenditures in “biodefense” in the United States since what constitutes biodefense spending has never been consistently defined either within or across government departments and agencies. |
|
67 |
Schuler A. 2004. Billions for biodefense: federal agency biodefense funding, FY2001-FY2005. Biosecurity and Bioterrorism: Biodefense Strategy, Practice, and Science 2(2):86-96. A more recent article is: Schuler A. 2005. Billions for biodefense: federal agency biodefense budgeting, FY2005-FY2006. Biosecurity and Bioterrorism: Biodefense Strategy, Practice, and Science 3(2):94-101; Enserink, M. and J. Kaiser. 2005. Has biodefense gone overboard? Science 307(5714):1396-1398. |
|
68 |
Hoyt, K. and S.G. Brooks. 2003/2004. A double-edged sword. International Security 28(Winter):123-148. |
|
69 |
Ibid. |
|
70 |
King, D.A. 2004. The scientific impact of nations. Nature 430(6997):311-316 Feature. |
|
71 |
Paraje G., R. Sadana, and G. Karam. 2005. Public health. Increasing international gaps in health-related publications. Science 308(5724):959-960. |
|
72 |
OECD, Eurostat. 1997. The Measurement of Scientific and Technological Activities: Proposed Guidelines for Collecting and Interpreting Technological Innovation Data. Paris: OSLO Manual. |
|
73 |
This sub-section is text that has been adapted from Thorsteinsdottir, H. et al. 2004. Introduction: promoting global health through biotechnology. Nature Biotechnology 22(Suppl.):DC3-DC9. |
|
74 |
All of the data presented in this section is from the OECD 2004 Compendium of Patent Statistics Report. Available at www.oecd.org/dataoecd/60/24/8208325.pdf [ accessed January 4, 2006]. |
|
75 |
OECD Compendium of Patent Statistics 2004. Available at www.oecd.org/dataoecd/60/24/8208325.pdf [accessed January 4, 2006]. |
|
76 |
Triadic patent families are sets of patents registered at the world’s three largest patent offices: the European Patent Office, EPO, the Japanese Patent Office, JPO, and the U.S. Patent and Trademarks Office, USPTO. |
|
77 |
Anton, P.S. et al. 2001. The Global Technology Revolution: bio/nano/materials trends and their synergies with information technology by 2015. RAND Corporation. Available online at www.rand.org/pubs/monograph_reports/2005/MR1307.pdf [accessed January 4, 2006]. |
|
78 |
A Survey of the Use of Biotechnology in U.S. Industry, 2003. Available online at www.technology.gov/reports/Biotechnology/CD120a_0310.pdf [accessed January 4, 2006]. |
|
79 |
The word “broadband” is a generic term. It refers to the wide bandwidth characteristics of a transmission medium and its ability to carry numerous voice, video or data signals simultaneously. The medium could be coaxial cable, fiber-optic cable, UTP Media Twist or a wireless system. See www.unt.edu/telecom/Services/broadband.htm [accessed January 4, 2006]. |
|
80 |
See www.itu.int/ITU-D/ict/statistics/at_glance/top20_broad_2004.html [accessed June 15, 2005]. |
|
81 |
See www.itu.int/ITU-D/ict/statistics/at_glance/Internet03.pdf [accessed June 15, 2005]. |
|
82 |
See www.itu.int/ITU-D/ict/statistics/at_glance/cellular03.pdf [accessed June 15, 2005]. |
|
83 |
Ibid. |
|
84 |
National Research Council. 2005. Policy Implications of International Graduate Students and Postdoctoral Scholars in the United States. Washington, DC: The National Academies Press. |
|
85 |
Ibid. |
|
86 |
Kernodle, K. 2005. Combating Continued Drops in Foreign Student Enrollment—U.S. Driven to Increase Appeal of Colleges and Universities. Frances Kernodle Associates. Available online at www.fkassociates.com/Combating%20Continued%20Drops%20in%20Foreign%20Student%20Enrollment.html [accessed January 6, 2006]. |
|
87 |
National Research Council. 2004. Biotechnology Research in an Age of Terrorism. Washington, DC: The National Academies Press; this may be changing, since the United States announced, in February, 2005, that it had changed its visa rules to make it easier for foreign scientists and students working on “sensitive technologies” to reenter the United States after overseas trips (e.g., to attend conferences or visit their home countries). |
|
88 |
See www.universitiesuk.ac.uk/international/intlstrategy.pdf [accessed May 10, 2005]. |
|
89 |
Science and Engineering Indicators—2004. Available online at www.nsf.gov/statistics/seind04/ [accessed January 4, 2006]. |
|
90 |
National Science Foundation, Division of Science Resources Statistics, Science and Engineering Doctorate Awards: 2001, NSF 03-300, Susan T. Hill, Project Officer (Arlington, VA 2002). |
|
91 |
See www.nsf.gov/statistics/nsf03300/pdf/secta.pdf: 53 [accessed January, 2006]. |
|
92 |
See www.nsf.gov/statistics/seind04/c2/c2s4.htm [accessed January 6, 2006]. |
|
93 |
From National Science Foundation, Division of Science Resources Studies. 1998. Statistical Profiles of Foreign Doctoral Recipients in Science and Engineering: Plans to Stay in the United States. NSF 99-304, Author, Jean M. Johnson (Arlington, VA). |
|
94 |
Cited in Zhenzhen, L. et al. 2004. Health biotechnology in China—reawakening a giant. Nature Biotechnology 22(Suppl.):DC13-DC18. |
|
95 |
Breithaupt, H. 2003. China’s leap forward in biotechnology. EMBO Reports 4:111-113. |
|
96 |
Morel, Carolos M. et al. 2005. Health Innovation Networks to Help Developing Countries Address Neglected Diseases. Science 309(5733):401-404. This term |
|
|
was first proposed by Charles Gardner of the Rockefeller Foundation, based on the 2003 Zuckerman Lecture delivered at the UK Royal Society by R.A. Mashelkar. |
|
97 |
Data in the overview of this section is from World Bank data www.worldbank.org/data/databytopic/eap_wdi.pdf |
|
98 |
Zhenshen, L. et al. 2004. Health biotechnology in China—reawakening of a giant. Nature Biotechnology 22(Suppl.):DC13-DC18. |
|
99 |
National Intelligence Council. 2004. Mapping the Global Future, Report of the National Intelligence Council’s 2020 Project. Available online at www.cia.gov/nic/nic_globaltrend2020.htm#contents [accessed April 26, 2006]. |
|
100 |
Huang, J. et al. 2002. Plant biotechnology in China. Science 295(5555):674-677. |
|
101 |
Ibid. |
|
102 |
Huang, J. et al. 2002. Plant biotechnology in China. Science 295(5555):674-677. |
|
103 |
BT plants carry the gene for an insecticidical toxin produced by the bacteria Bacillus thuringiensis, reducing the need for chemical insecticides. |
|
104 |
Ibid. |
|
105 |
Huang, J. et al. 2005. Insect-resistant GM rice in farmers’ fields: assessing productivity and health effects in China. Science 308(5722):688-690. |
|
106 |
Yu, J. et al. 2002. A draft sequence of the rice genome (Oryza sativa L. ssp. indica). Science 296(5655):79-92. |
|
107 |
Chien, K. and L. Chien. 2004. The new Silk Road. Nature 428(6979):208-209. |
|
108 |
This figure refers only to health biotech papers, not all Chinese–authored scientific papers in international peer-reviewed journals, nor does it include papers published in local journals not covered by ISI. |
|
109 |
This figure does not reflect trends in non-U.S. patents and does not cover all health biotech patents. |
|
110 |
Zhenshen, L. et al. 2004. Health biotechnology in China—reawakening of a giant. Nature Biotechnology 22(Suppl.):DC13-DC18. |
|
111 |
Ibid. |
|
112 |
Ibid. |
|
113 |
The Beijing Genomics Institute was unable to obtain SARS samples from Guandong, despite efforts, due to safety regulations banning the transfer of viruses. |
|
114 |
Ibid. |
|
115 |
Harding, A. 2005. The politics of Science. The Scientist 19(2):37-40. |
|
116 |
National Intelligence Council. 2004. Mapping the Global Future, Report of the National Intelligence Council’s 2020 Project. Available online at www.cia.gov/nic/NIC_globaltrend2020_s3.html [accessed January 4, 2006]. |
|
117 |
Based on materials presented to Committee by Tan Boon Ooi. See Institute of Medicine/National Research Council. 2005. An International Perspective on Advancing Technologies and Strategies for Managing Dual-Use Risks. Washington DC: The National Academies Press. |
|
118 |
See www.med.nus.edu.sg/lilly/ [accessed October 21, 2004]. |
|
119 |
See www.lsb.lilly.com.sg/ [accessed October 21, 2004]. |
|
120 |
See www.nitd.novartis.com [accessed October 21, 2004]. |
|
121 |
Institute of Medicine/National Research Council. 2005. An International Perspective on Advancing Technologies and Strategies for Managing Dual-Use Risks. Washington, DC: The National Academies Press. |
|
122 |
Ibid. |
|
123 |
Wong, J. et al. 2004. South Korean biotechnology—a rising industrial and scientific powerhouse. Nature Biotechnology 22(Suppl.):DC42-47. |
|
124 |
Ibid. |
|
125 |
Hwang, W.S. et al. 2004. Evidence of a pluripotent human embryonic stem cell line derived from a cloned blastocyst. Science 303(5664):1669-1674; Hwang, W.S. et al. 2005. Patient-specific embryonic stem cells derived from human SCNT blastocysts. Science 308(5729):1777-1783. |
|
126 |
Wong, J. et al. 2004. South Korean biotechnology—a rising industrial and scientific powerhouse. Nature Biotechnology 22(Suppl.):DC42-47. |
|
127 |
Swinbanks, D. and D. Cyranoski. 2000. Taiwan backs experience in quest for biotech success. Nature 407(6802):417-426. |
|
128 |
The latest USPTO patent statistics for 2003 reveal that Taiwan’s 6,676 patents place it fourth in the world behind the U.S., which posted 98,598 patents, Japan (37,250) and Germany (12,140). See investintaiwan.nat.gov.tw/en/news/200406/2004062501.html [accessed January 4, 2006]. |
|
129 |
Ibid.; and Cyranoski, D. 2003. Biotech vision Taiwan. Nature 421(6923):672-673. |
|
130 |
Taiwan aims to become sci-tech island. Nature 394(6693),1998:603. Available at www.nature.com/cgi-taf/DynaPage.taf?file=/nature/journal/v394/n6693/full/394603a0_fs.html&content_filetype=pdf [accessed January 4, 2006]. |
|
131 |
Data in the overview of this section is from World Bank www.worldbank.org/data/databytopic/eca_wdi.pdf. |
|
132 |
Private capital flows refer to investments by the private sector into a sector of a country’s economy. Foreign direct investments are investments made to acquire a lasting interest by a resident entity in one economy in an enterprise resident in another economy. See www.nscb.gov.ph/fiis/default.asp. |
|
133 |
National Intelligence Council. 2004. Mapping the Global Future, Report of the National Intelligence Council’s 2020 Project. December. Available online at www.cia.gov/nic/NIC_globaltrend2020.html#contents [accessed May 3, 2005]. |
|
134 |
See www.inpharm.com/External/InpH/1,2580,1-3-0-0inp_intelligence_art-0-305987,00.html [accessed May 9, 2005]. |
|
135 |
See The Biologically Active Food Supplement Market in Russia. Available online at www.bisnis.doc.gov/bisnis/bisdoc/0401food.htm [accessed May 10, 2005]. |
|
136 |
Unless otherwise indicated, data in the overview of this section is from the World Bank www.worldbank.org/data/databytopic/lac_wdi.pdf. |
|
137 |
National Intelligence Council. 2004. Mapping the Global Future, Report of the National Intelligence Council’s 2020 Project. Available online at www.cia.gov/nic/nic_globaltrend2020.htm#contents [accessed April 26, 2006]. |
|
138 |
Ferrer, M. et al. 2004. The scientific muscle of Brazil’s health biotechnology. Nature Biotechnology 22(Suppl.):DC8-DC12. |
|
139 |
Simpson, A.J. et al. 2000. The genome sequence of the plant pathogen Xylella fastidiosa. Nature 406(6792):151. |
|
140 |
Ferrer, M. et al. 2004. The scientific muscle of Brazil’s health biotechnology. Nature Biotechnology 22(Suppl.):DC8-DC12. |
|
141 |
Ibid. |
|
142 |
See www.adunicamp.org.br/noticias/universidade/leideinova%E7%E3o.pdf [accessed February 7, 2005]. |
|
143 |
See www.ctnbio.gov.br/index.php?action=/content/view&cod_objeto=1296 [accessed May 10, 2005]. |
|
144 |
For more details, see the description in Institute of Medicine. 2005. Scaling Up Treatment for the Global AIDS Pandemic. Washington, DC: The National Academies Press; 156-157. |
|
145 |
Viols, V. et al. 2000. Promoting the rational use of antiretrovirals through a computer aided system for the logistical control of AIDS medications in Brazil. Presentation at the 13th International AIDS Conference in Durban, South Africa. |
|
146 |
Lima R.M., and Veloso, V. 2000. SICLOM: Fistruicao informatizada de medicamentos para HIV/AIDS. Acao Anti-AIDS 43:6-7. |
|
147 |
Thorsteinsdottir, H. et al. 2004. Cuba—innovation through synergy. Nature Biotechnology 22(Suppl.):DC19-DC24. |
|
148 |
Verez-Bencomo,V. et al. 2004. A synthetic conjugate polysaccharide vaccine against Haemophilus influenzae type b. Science 305(5683):522-525. |
|
149 |
See www.ymbiosciences.com/presspop.cfm?newsID=3024 [accessed February 7, 2005]. |
|
150 |
Thorsteinsdottir, H. et al. 2004. Cuba—innovation through synergy. Nature Biotechnology 22(Suppl.):DC19-DC24. |
|
151 |
See www.inmegen.org.mx. |
|
152 |
Jimenez-Sanchez, G. 2003. Developing a platform for genomic medicine in Mexico. Science 300(5617):295-296. |
|
153 |
National Research Council/Institute of Medicine. 2005. An International Perspective on Advancing Technologies and Strategies for Managing Dual-Use Risks. Washington, DC: The National Academies Press. |
|
154 |
Information in the overview of this section is from World Bank www.worldbank.org/data/databytopic/mna_wdi.pdf. |
|
155 |
Abdelgafar, B. et al. 2004. The emergence of Egyptian biotechnology from generics. Nature Biotechnology 22(Suppl.):DC25-DC30. |
|
156 |
Ibid. |
|
157 |
See www.who.int/csr/disease/hepatitis/whocdscsrlyo2003/en/index4.html [accessed May 9, 2005]. |
|
158 |
Ibid. |
|
159 |
Ibid. |
|
160 |
Ibid. |
|
161 |
Soreni, M. et al. 2005. Parallel biomolecular computation on surfaces with advanced finite automata. Journal of the American Chemical Society 127(11):3935-3943. |
|
162 |
See www.larta.org/lavox/articlelinks/2004/040510_usisrael.asp [accessed May 9, 2005]. |
|
163 |
Ibid. |
|
164 |
The information for this section is from Bohannon, J. 2005. From pariah to science powerhouse? Science 308(5719):182-184. |
|
165 |
The ALJ business was founded by the late Sheikh Abdul Latif Jameel in 1945. In 1955 he was granted the sole distributorship for Toyota vehicles in Saudi Arabia which the ALJ Group has maintained ever since. On March 8, 2005 Abdul |
|
|
Latif Jameel Company Limited commemorated 50 years of successful and fruitful partnership with the Toyota Motor Corporation. www.alj.com/about03.html. |
|
166 |
See www.astf.net/site/news/news_dtls.asp?news_id=1015&ogzid=0 [accessed May 10, 2005]. |
|
167 |
Kumar, N.K. 2004. Indian biotechnology—rapidly evolving and industry led. Nature Biotechnology 22(Suppl.):DC31-DC36. |
|
168 |
Bagla, P. 2005. Prime minister backs NSF-like funding body. Science 307(5715):1544. |
|
169 |
Cited in Kumar, N.K. 2003. Biotech Consortium India Ltd. Directory of Biotechnology Industries & Institutions in India. New Delhi: BCIL. |
|
170 |
Again, as cited in the Kumar paper: Ernst & Young. 2004. On the threshold. The Asia Pacific Perspective Global Biotechnology Report. SF. |
|
171 |
See www.shanthabiotech.com/shantha-west.asp [accessed February 9, 2005]. |
|
172 |
Jayaramam, K.S. 2002. India promotes GMOs in Asia. Nature Biotechnology 20(7):641-642. |
|
173 |
Institute of Medicine/National Research Council. 2005. An International Perspective on Advancing Technologies and Strategies for Managing Dual-Use Risks. Washington, DC: The National Academies Press. |
|
174 |
|
|
175 |
Institute of Medicine/National Research Council. 2005. An International Perspective on Advancing Technologies and Strategies for Managing Dual-Use Risks. Washington, DC: The National Academies Press. |
|
176 |
Ibid., 98. |
|
177 |
Motari, M. et al. 2004. South Africa—blazing a trail for African biotechnology. Nature Biotechnology 22(Suppl.):DC37-DC41. |
|
178 |
Ibid. |
|
179 |
Normile, D. 2005. Fundraising begins for network of four African institutes. Science 307(5709):499. |
|
180 |
Cited in Hassan, M.H.A. 2005. Small Things and Big Changes in the Developing World. Science 309(5731):65-66. |


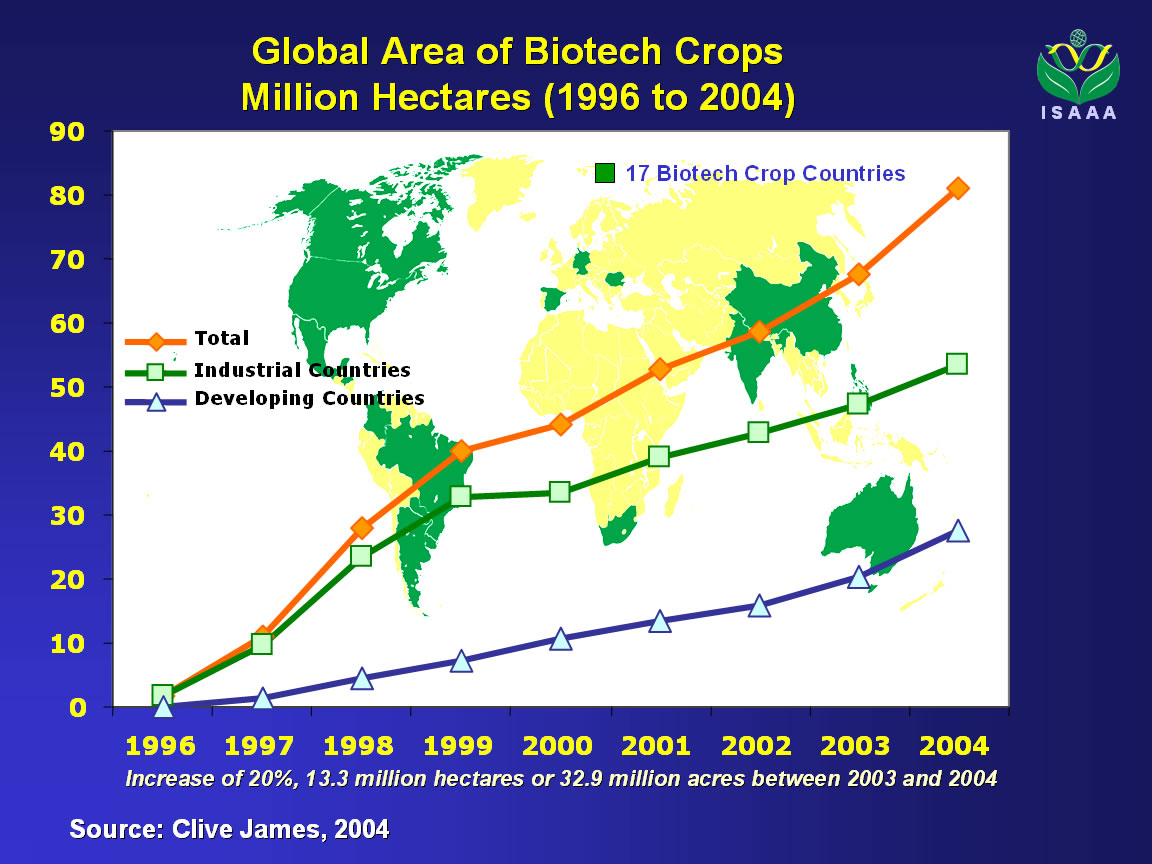
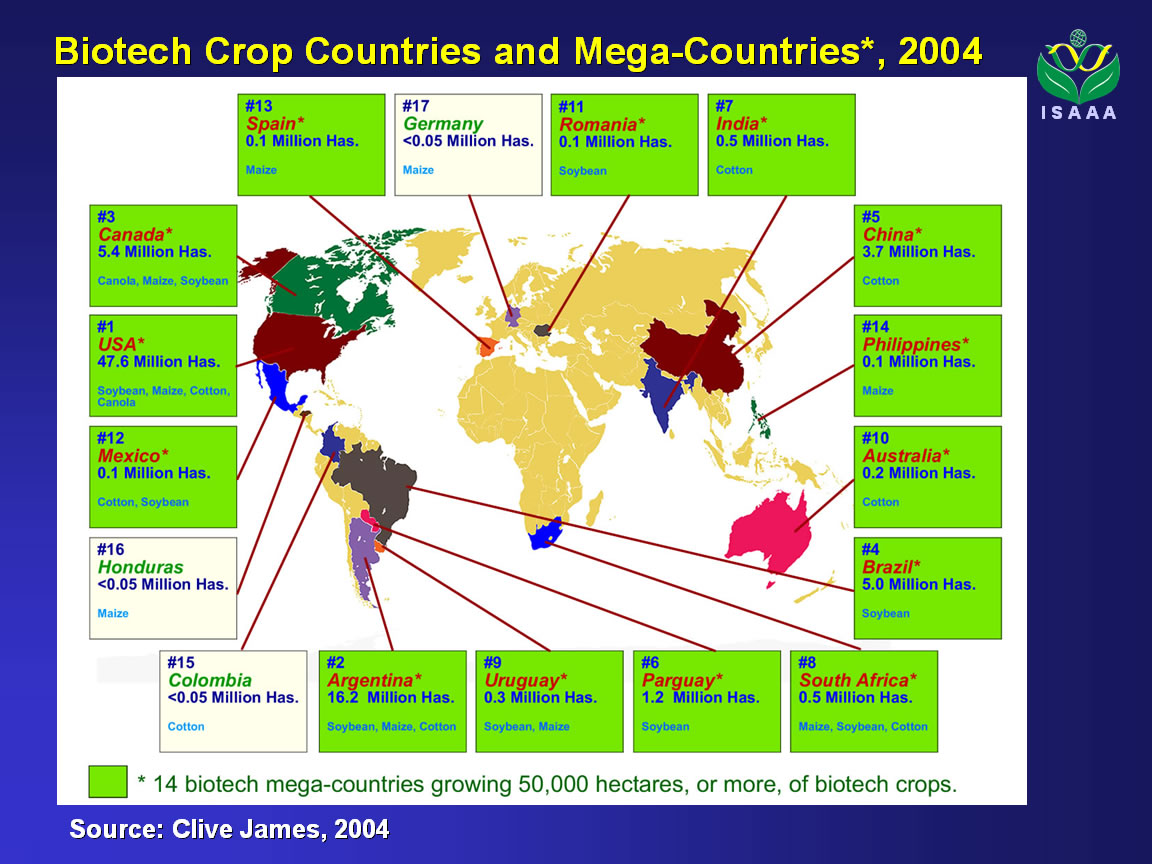