
8
Effects on the Endocrine System
The endocrine system, apart from reproductive aspects, was not considered in detail in recent major reviews of the health effects of fluoride (PHS 1991; NRC 1993; Locker 1999; McDonagh et al. 2000a; WHO 2002; ATSDR 2003). Both the Public Health Service (PHS 1991) and the World Health Organization (WHO 2002) mentioned secondary hyperparathyroidism in connection with discussions of skeletal fluorosis, but neither report examined endocrine effects any further. The Agency for Toxic Substances and Disease Registry (ATSDR 2003) discussed four papers on thyroid effects and two papers on parathyroid effects and concluded that “there are some data to suggest that fluoride does adversely affect some endocrine glands.” McDonagh et al. (2000a) reviewed a number of human studies of fluoride effects, including three that dealt with goiter and one that dealt with age at menarche. The following section reviews material on the effects of fluoride on the endocrine system—in particular, the thyroid (both follicular cells and parafollicular cells), parathyroid, and pineal glands. Each of these sections has its own discussion section. Detailed information about study designs, exposure conditions, and results is provided in Appendix E.
THYROID FOLLICULAR CELLS
The follicular cells of the thyroid gland produce the classic thyroid hormones thyroxine (T4) and triiodothyronine (T3); these hormones modulate a variety of physiological processes, including but not limited to normal growth and development (Larsen et al. 2002; Larsen and Davies 2002; Goodman 2003). Between 4% and 5% of the U.S. population may be af-
fected by deranged thyroid function (Goodman 2003), making it among the most prevalent of endocrine diseases (Larsen et al. 2002). The prevalence of subclinical thyroid dysfunction in various populations is 1.3-17.5% for subclinical hypothyroidism and 0.6-16% for subclinical hyperthyroidism; the reported rates depend on age, sex, iodine intake, sensitivity of measurements, and definition used (Biondi et al. 2002). Normal thyroid function requires sufficient intake of iodine (at least 100 micrograms/day [µg/d]), and areas of endemic iodine deficiency are associated with disorders such as endemic goiter and cretinism (Larsen et al. 2002; Larsen and Davies 2002; Goodman 2003). Iodine intake in the United States (where iodine is added to table salt) is decreasing (CDC 2002d; Larsen et al. 2002), and an estimated 12% of the population has low concentrations of urinary iodine (Larsen et al. 2002).
The principal regulator of thyroid function is the pituitary hormone thyroid-stimulating hormone (TSH), which in turn is controlled by positive input from the hypothalamic hormone thyrotropin-releasing hormone (TRH) and by negative input from T4 and T3. TSH binds to G-protein-coupled receptors in the surface membranes of thyroid follicular cells (Goodman 2003), which leads to increases in both the cyclic adenosine monophosphate (cAMP) and diacylglycerol/inositol trisphosphate second messenger pathways (Goodman 2003). T3, rather than T4, probably is responsible for the feedback response for TSH production (Schneider et al. 2001). Some T3, the active form of thyroid hormone, is secreted directly by the thyroid along with T4, but most T3 is produced from T4 by one of two deiodinases (Types I and II1) in the peripheral tissue (Schneider et al. 2001; Larsen et al. 2002; Goodman 2003). T3 enters the nucleus of the target cells and binds to specific receptors, which activate specific genes.
Background
An effect of fluoride exposure on the thyroid was first reported approximately 150 years ago (Maumené 1854, 1866; as cited in various reports). In 1923, the director of the Idaho Public Health Service, in a letter to the Surgeon General, reported enlarged thyroids in many children between the ages of 12 and 15 using city water in the village of Oakley, Idaho (Almond 1923); in addition, the children using city water had severe enamel deficiencies in their permanent teeth. The dental problems were eventually attributed to the presence in the city water of 6 mg/L fluoride, and children born after a change in water supply (to water with <0.5 mg/L fluoride) were not
so affected (McKay 1933); however, there seems to have been no further report on thyroid conditions in the village.
More recently, Demole (1970) argued that a specific toxicity of fluoride for the thyroid gland does not exist, because (1) fluoride does not accumulate in the thyroid; (2) fluoride does not affect the uptake of iodine by thyroid tissue; (3) pathologic changes in the thyroid show no increased frequency in regions where water is fluoridated (naturally or artificially); (4) administration of fluoride does not interfere with the prophylactic action of iodine on endemic goiter; and (5) the beneficial effect of iodine in threshold dosage to experimental animals is not inhibited by administration of fluoride, even in excessive amounts. Bürgi et al. (1984) also stated that fluoride does not potentiate the consequences of iodine deficiency in populations with a borderline or low iodine intake and that published data fail to support the hypothesis that fluoride has adverse effects on the thyroid (at doses recommended for caries prevention). McLaren (1976), however, pointed out the complexity of the system, the difficulties in making adequate comparisons of the various studies of fluoride and the thyroid, and evidence for fluoride accumulation in the thyroid and morphological and functional changes (e.g., changes in activity of adenylyl cyclase), suggesting that analytical methods could have limited the definitiveness of the data to date. His review suggested that physiological or functional changes might occur at fluoride intakes of 5 mg/day.
Although fluoride does not accumulate significantly in most soft tissue (as compared to bones and teeth), several older studies found that fluoride concentrations in thyroid tissue generally exceed those in most other tissue except kidney (e.g., Chang et al. 1934; Hein et al. 1954, 1956); more recent information with improved analytic methods for fluoride was not located. Several studies have reported no effect of fluoride treatment on thyroid weight or morphology (Gedalia et al. 1960; Stolc and Podoba 1960; Saka et al. 1965; Bobek et al. 1976; Hara 1980), while others have reported such morphological changes as mild atrophy of the follicular epithelium (Ogilvie 1953), distended endoplasmic reticulum in follicular cells (Sundström 1971), and “morphological changes suggesting hormonal hypofunction” (Jonderko et al. 1983).
Fluoride was once thought to compete with iodide for transport into the thyroid, but several studies have demonstrated that this does not occur (Harris and Hayes 1955; Levi and Silberstein 1955; Anbar et al. 1959; Saka et al. 1965). The iodide transporter accepts other negatively charged ions besides iodide (e.g., perchlorate), but they are about the same size as iodide (Anbar et al. 1959); fluoride ion is considerably smaller and does not appear to displace iodide in the transporter.
Animal Studies
A number of studies have examined the effects of fluoride on thyroid function in experimental animals or livestock (for details, see Appendix E, Tables E-1, E-2, and E-3). Of these, the most informative are those that have considered both the fluoride and iodine intakes.
Guan et al. (1988) found that a fluoride intake of 10 mg/L in drinking water had little apparent effect on Wistar rats with sufficient iodine intake, but a fluoride intake of 30 mg/L in drinking water resulted in significant decreases in thyroid function (decreases in T4, T3, thyroid peroxidase, and 3H-leucine), as well as a decrease in thyroid weight and effects on thyroid morphology (Table E-2). In iodine-deficient rats, fluoride intake of 10 mg/L in drinking water produced abnormalities in thyroid function beyond that attributable to low iodine, including decreased thyroid peroxidase, and low T4 without compensatory transformation of T4 to T3.
Zhao et al. (1998), using male Kunmin mice, found that both iodine-deficient and iodine-excess conditions produced goiters, but, under iodine-deficient conditions, the goiter incidence at 100 days increased with increased intake of fluoride. At 100 days, the high-fluoride groups had elevated serum T4 at all concentrations of iodine intake and elevated T3 in iodine-deficient animals. High fluoride intake significantly inhibited the radioiodine uptake in the low- and normal-iodine groups.
Stolc and Podoba (1960) found a decrease in protein-bound iodine in blood in fluoride-treated female rats (3-4 mg/kg/day) fed a low-iodine diet but not in corresponding rats fed a larger amount of iodine. Both groups (low- and high-iodine) of fluoride-treated rats showed a reduced rate of biogenesis of T3 and T4 after administration of 131I compared with controls (Stolc and Podoba 1960).
Bobek et al. (1976) found decreases in plasma T4 and T3 as well as a decrease in free T4 index and an increase in T3-resin uptake in male rats given 0.1 or 1 mg of fluoride per day (0.4-0.6 or 4-6 mg/kg/day) in drinking water for 60 days.2 The authors suggested the possibility of decreased binding capabilities and altered thyroid hormone transport in blood.
Decreases in T4 and T3 concentrations have been reported in dairy cows at estimated fluoride doses up to 0.7 mg/kg/day with possible iodine deficiency (Hillman et al. 1979; Table E-3). Reduced T3 (Swarup et al. 1998) and reduced T3, T4, and protein-bound iodine (Cinar and Selcuk 2005) have also been reported in cows diagnosed with chronic fluorosis in India and Turkey, respectively.
|
2 |
The decrease in T3 in the group receiving 0.1 mg/day was not statistically significant (Table E-1). Note that ATSDR (2003) stated that an intermediate-duration minimal risk level (MRL) derived from this study of thyroid effects in rats would have been lower (more protective) than the chronic-duration MRL derived from a human study of bone effects (0.05 mg/kg/day). |
Hara (1980) found elevated T3 and T4 at the lowest dose (approximately 0.1 mg/kg/day), decreased T3 and normal T4 at intermediate doses (3-4 mg/kg/day), and decreased TSH and growth hormone (indicating possible effects on pituitary function) at the highest doses (10-20 mg/kg/day). This was the only animal study of fluoride effects on thyroid function to measure TSH concentrations; however, full details (e.g., iodine intake) are not available in English.
Other studies have shown no effect of fluoride on the end points examined (Gedalia et al. 1960; Siebenhüner et al. 1984; Clay and Suttie 1987; Choubisa 1999; Table E-1). Choubisa (1999) looked only for clinical evidence of goiter in domestic animals (cattle and buffaloes) showing signs of enamel or skeletal fluorosis; no hormone parameters (e.g., T4, T3, TSH) were measured. Gedalia et al. (1960) also did not measure T4, T3, or TSH; radioiodine uptake, protein-bound iodine, and total blood iodine were all normal in rats receiving fluoride doses up to approximately 1 milligram per kilogram of body weight per day (mg/kg/day). Clay and Suttie (1987) reported no significant differences from control values for T4 concentration and T3 uptake in heifers fed up to 1.4 mg/kg/day; iodine intake is not stated but probably was adequate, and TSH was not measured.
Siebenhüner et al. (1984) carried out a special experiment involving iodine depletion of the thyroid before 6 days of fluoride treatment. No effects were seen on the parameters measured, including T3 and T4 concentrations; however, TSH was not measured. In addition, propylthiouracil (PTU), the agent used to deplete the thyroid of iodine, also has an inhibitory effect on deiodinases (Larsen et al. 2002; Larsen and Davies 2002); Siebenhüner et al. (1984) did not mention this second action of PTU and its relevance to the interpretation of the experimental results, and there was no control group without the PTU treatment.
Human Studies
Several authors have reported an association between endemic goiter and fluoride exposure or enamel fluorosis in human populations in India (Wilson 1941; Siddiqui 1960; Desai et al. 1993), Nepal (Day and Powell-Jackson 1972), England (Wilson 1941; Murray et al. 1948), South Africa (Steyn 1948; Steyn et al. 1955; Jooste et al. 1999), and Kenya (Obel 1982). Although endemic goiter is now generally attributed to iodine deficiency (Murray et al. 1948; Obel 1982; Larsen et al. 2002; Belchetz and Hammond 2003), some of the goitrogenic areas associated with fluoride exposure were not considered to be iodine deficient (Steyn 1948; Steyn et al. 1955; Obel 1982; Jooste et al. 1999). Obel (1982) indicated that many cases of fluorosis in Kenya occur concurrently with goiter. Several authors raise the possibility that the goitrous effect, if not due to fluoride, is due to some other substance
in the water (e.g., calcium or water hardness) that was associated with the fluoride concentration (Murray et al. 1948; Day and Powell-Jackson 1972) or that enhanced the effect of fluoride (Steyn 1948; Steyn et al. 1955). Dietary selenium deficiencies (e.g., endemic in parts of China and Africa or due to protein-restricted diets) can also affect normal thyroid function3 (Larsen et al. 2002); no information on dietary selenium is available in any of the fluoride studies. Appendix E summarizes a number of studies of the effects of fluoride on thyroid function in humans (see Table E-4).
Three studies illustrated the range of results that have been reported: (1) Gedalia and Brand (1963) found an association between endemic goiter in Israeli girls and iodine concentrations in water but found no association with fluoride concentrations (<0.1-0.9 mg/L). (2) Siddiqui (1960) found goiters only in persons aged 14-17 years; the goiters, which became less visible or invisible after puberty, were associated with mean fluorine content of the water (5.4-10.7 mg/L) and were inversely associated with mean iodine content of the water. (3) Desai et al. (1993) found a positive correlation (P < 0.001) between prevalence of goiter (9.5-37.5%) and enamel fluorosis (6.0-59.0%), but no correlation between prevalence of goiter and water iodine concentration (P > 0.05).
Day and Powell Jackson (1972) surveyed 13 villages in Nepal where the water supply was uniformly low in iodine (≤1 µg/L; see Figure 8-1). Here the goiter prevalence (5-69%, all age groups) was directly associated with the fluoride concentration (<0.1 to 0.36 mg/L; P < 0.01) or with hardness, calcium concentration, or magnesium concentration of the water (all P < 0.01). Goiter prevalence of at least 20% was associated with all fluoride concentrations ≥ 0.19 mg/L, suggesting that fluoride might influence the prevalence of goiter in an area where goiter is endemic because of low iodine intake. The possibility of a nutritional component (undernutrition or protein deficiency) to the development of goiter was also suggested.
Jooste et al. (1999) examined children (ages 6, 12, and 15) who had spent their entire lives in one of six towns in South Africa where iodine concentrations in drinking water were considered adequate (median urinary iodine concentration exceeding 201 µg/L [1.58 µmol/L]; see Appendix E, Tables E-4 and E-5; Figure 8-2). For towns with low (0.3-0.5 mg/L) or near “optimal” (0.9-1.1 mg/L) fluoride concentrations in water, no relationship between fluoride and prevalence of mild goiter was found (5-18%); for the other two towns (1.7 and 2.6 mg/L fluoride), however, goiter prevalences were 28% and 29%, respectively, and most children had severe enamel mottling. These two towns (and one low-fluoride town) had very low proportions (0-2.2%) of children with iodine deficiency, defined as urinary
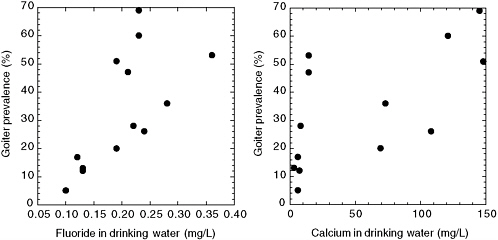
FIGURE 8-1 Goiter prevalence versus fluoride (left) and calcium (right) concentration in drinking water for 13 villages in Nepal with very low iodine concentrations. SOURCE: Day and Powell-Jackson 1972.
iodine concentrations <100 µg/L (<0.79 µmol/L). The town with the lowest prevalence of goiter also had the lowest prevalence of undernutrition; the two towns with the highest prevalence of goiter (and highest fluoride concentrations) did not differ greatly from the remaining three towns with
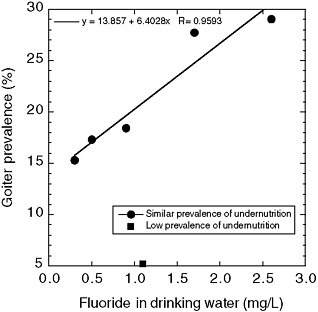
FIGURE 8-2 Goiter prevalence versus drinking water fluoride concentrations in six South African towns with adequate iodine concentrations. One town had a significantly lower prevalence of undernutrition than the other five towns and is not included in the line fitting. SOURCE: Jooste et al. 1999.
respect to prevalence of undernutrition. The authors suggested that fluoride or an associated goitrogen might be responsible for the goiters seen in the two towns with the highest fluoride concentrations but that some other factor(s) was involved in development of goiter in the other towns.
Several studies have compared various aspects of thyroid status in populations with different fluoride intakes (for details, see Appendix E, Table E-4). Leone et al. (1964) and Baum et al. (1981) reported no significant differences in thyroid status between populations with low (0.09-0.2 mg/L) and high (3-3.5 mg/L) fluoride concentrations in the drinking water. Leone et al. (1964) looked only at protein-bound iodine and physical examination of the thyroid in adults; Baum et al. (1981) measured a number of parameters in teenagers, including T4, T3, and TSH. Neither study reported iodine status of the groups. Baum et al. (1981) showed but did not explain a decrease in thyroglobulin in girls in the high-fluoride group.
Bachinskii et al. (1985) examined 47 healthy persons, 43 persons with hyperthyroidism, and 33 persons with hypothyroidism. Prolonged consumption of “high-fluoride” drinking water (2.3 mg/L, as opposed to “normal” concentrations of 1 mg/L) by healthy persons was associated with statistically significant changes in TSH concentrations (increased), T3 concentrations (decreased), and uptake of radioiodine (increased), although the mean values for TSH and T3 were still within normal ranges (see Appendix E, Table E-6). The mean value of TSH for the healthy group (4.3 ± 0.6 milliunits/L; Table E-6) is high enough that one expects a few individuals to have been above the normal range (typically 0.5-5 milliunits/L; Larsen et al. 2002). These results were interpreted as indicating disruption of iodine metabolism, stress in the pituitary-thyroid system, and increased risk of developing thyroidopathy (Bachinskii et al. 1985).
Lin et al. (1991) examined 769 children (7-14 years old) for mental retardation in three areas of China, including an area with “high” fluoride (0.88 mg/L) and low iodine, an area with “normal” fluoride (0.34 mg/L) and low iodine, and an area where iodine supplementation was routine (fluoride concentration not stated). Ten to twelve children in each area received detailed examinations, including measuring thyroid 131I uptake and thyroid hormone concentrations. Children in the first area had higher TSH, slightly higher 131I uptake, and lower mean IQ than children in the second area. Children in the first area also had reduced T3 and elevated reverse T3, compared with children in the second area. The authors suggested that high fluoride might exacerbate the effects of iodine deficiency. In addition, the authors reported a difference in T3/rT3 (T3/reverse-T3) ratios between high- and low-fluoride areas and suggested that excess fluoride ion affects normal deiodination.
A recent study by Susheela et al. (2005) compared thyroid hormone status (free T4, free T3, and TSH) of 90 children with enamel fluorosis
(drinking water fluoride ranging from 1.1 to 14.3 mg/L) and 21 children without enamel fluorosis (0.14-0.81 mg/L fluoride in drinking water) in areas where iodine supplementation was considered adequate.4 Forty-nine children (54.4%) in the sample group had “well-defined hormonal derangements”; findings were borderline in the remaining 41 children. The types of hormonal derangements included elevated TSH and normal T4 and T3 (subclinical hypothyroidism); low T3 and normal T4 and TSH (“low T3 syndrome”); elevated T3 and TSH and normal T4 (possible T3 toxicosis); elevated TSH, low T4, and normal T3 (usually indicative of primary hypothyroidism and iodine deficiency); and low T3, high TSH, and normal T4. All but the first category are considered to be associated with or potentially caused by abnormal activity of deiodinases. The authors concluded that fluoride in excess may be inducing diseases that have usually been attributed to iodine deficiency and that iodine supplementation may not be adequate when excess fluoride is being consumed.
Thyroid hormone disturbances were also noted in the control children, and urine and fluoride concentrations in the control children reflect higher fluoride intake than can be accounted for by the drinking water alone (Susheela et al. 2005). Thus, the authors recommend that end points such as hormone concentrations should be examined with respect to serum or urinary fluoride concentrations, not just drinking water fluoride concentrations. In addition, they note that all hormone endpoints (T3, T4, and TSH) should be examined, lest some of the abnormalities be missed.
Mikhailets et al. (1996) detected thyroid abnormalities (moderate reduction of iodine uptake, low T3, normal T4, and increased TSH) in 165 aluminum workers with signs of chronic fluorosis and an estimated average fluoride intake of 10 mg/working day. A tendency toward increased TSH was observed with increased exposure time and with more severe fluorosis. Workers with more than 10 years of service had a significant decrease in T3 concentration in comparison to controls. The frequency of individuals with low concentrations of T3 (corresponding to hypothyroidism) was 65% among workers with more than 10 years of service and 54% among workers with Stage 2 fluorosis. The highest frequency of occurrence of low T3 (76%) was observed in people with chronic fluoride intoxication including liver damage (moderate cytolysis), suggesting a disorder in peripheral conversion of T4 to T3 (deiodination). The possibility of indirect effects of fluorine on enzymatic deiodination was also suggested.
Tokar′ et al. (1989) and Balabolkin et al. (1995) have also reported
thyroid effects in fluoride- or fluorine-exposed workers; full details of these studies are not available in English. Balabolkin et al. (1995) found that 51% of the workers examined had subclinical hypothyroidism with reduced T3.
No changes in thyroid function were detected in two studies of osteoporosis patients treated with NaF for 6 months or several years (Eichner et al. 1981; Hasling et al. 1987; for details, see Appendix E, Table E-7). These study populations are not necessarily representative of the general population, especially with respect to age and the fact that they usually receive calcium supplements. In an earlier clinical study to examine the reported effects of fluoride on individuals with hyperthyroidism, Galletti and Joyet (1958) found that, in 6 of 15 patients, both basal metabolic rate and protein-bound iodine fell to normal concentrations, and the symptoms of hyperthyroidism were relieved after fluoride treatment. Fluoride was considered clinically ineffective in the other 9 patients, although improvement in basal metabolic rate or protein-bound iodine was observed in some of them. In the 6 patients for whom fluoride was effective, tachycardia and tremor disappeared within 4-8 weeks, and weight loss was stopped. The greatest clinical improvement was observed in women between 40 and 60 years old with a moderate degree of thyrotoxicosis; young patients with the classic symptoms of Graves’ disease did not respond to fluoride therapy. Radioiodine uptake tests were performed on 10 of the patients, 7 of whom showed an inhibitory effect on initial 131I uptake by the thyroid.
Discussion (Effects on Thyroid Function)
In studies of animals with dietary iodine sufficiency, effects on thyroid function were seen at fluoride doses of 3-6 mg/kg/day (Stolc and Podoba 1960; Bobek et al. 1976; Guan et al. 1988; Zhao et al. 1998); in one study, effects were seen at doses as low as 0.4-0.6 mg/kg/day (Bobek et al. 1976). In low-iodine situations, more severe effects on thyroid function were seen at these doses (Stolc and Podoba 1960; Guan et al. 1988; Zhao et al. 1998). Effects on thyroid function in low-iodine situations have also been noted at fluoride doses as low as 0.06 mg/kg/day (Zhao et al. 1998), ≤0.7 mg/kg/day (Hillman et al. 1979), and 1 mg/kg/day (Guan et al. 1988). Studies showing no effect of fluoride on thyroid function did not measure actual hormone concentrations (Gedalia et al. 1960; Choubisa 1999), did not report iodine intakes (Gedalia et al. 1960; Clay and Suttie 1987; Choubisa 1999), used fluoride doses (<1.5 mg/kg/day) below those (3-6 mg/kg/day) associated with effects in other studies (Gedalia et al. 1960; Clay and Suttie 1987), or did not discuss a possibly complicating factor of the experimental procedure used (Siebenhüner et al. 1984). Only one animal study (Hara 1980) measured TSH concentrations, although that is considered a “precise and
specific barometer” of thyroid status in most situations (Larsen et al. 2002). Full details of Hara’s report are not available in English.
Goiter prevalence of at least 20% has been reported in humans exposed to water fluoride concentrations ≥ 0.2 mg/L (low-iodine situation; Day and Powell-Jackson 1972) or 1.5-3 mg/L (undernutrition, but adequate iodine; Jooste et al. 1999); however, other causes of goiter have not been ruled out. Bachinskii et al. (1985) showed increased TSH concentrations and reduced T3 concentrations in a population with a fluoride concentration of 2.3 mg/L in their drinking water (in comparison to a group with 1.0 mg/L), and Lin et al. (1991) showed similar results for a population with 0.88 mg/L fluoride in the drinking water (in comparison to a group with 0.34 mg/L); another study showed no effect at 3 mg/L (Baum et al. 1981). Among children considered to have adequate iodine supplementation, Susheela et al. (2005) found derangements of thyroid hormones in 54% of children with enamel fluorosis (1.1-14.3 mg/L fluoride in drinking water), and in 45-50% of “control” children without enamel fluorosis but with elevated serum fluoride concentrations. Mikhailets et al. (1996) observed an increase in TSH in workers with increased exposure time and with more severe fluorosis; low T3 was found in 65% of workers with more than 10 years of service and in 54% of workers with Stage 2 fluorosis. Several studies do not include measurements of T4, T3, or TSH (Siddiqui 1960; Gedalia and Brand 1963; Leone et al. 1964; Day and Powell-Jackson 1972; Teotia et al. 1978; Desai et al. 1993; Jooste et al. 1999).
Nutritional information (especially the adequacy of iodine and selenium intake) is lacking for many (iodine) or all (selenium) of the available studies on humans. As with the animal studies, high fluoride intake appears to exacerbate the effects of low iodine concentrations (Day and Powell-Jackson 1972; Lin et al. 1991). Uncertainty about total fluoride exposures based on water fluoride concentrations, variability in exposures within population groups, and variability in response among individuals generally have not been addressed. Although no thyroid effects were reported in studies using controlled doses of fluoride for osteoporosis therapy, the study populations are not necessarily representative of the general population with respect to age, calcium intake, and the presence of metabolic bone disease.
Thus, several lines of information indicate an effect of fluoride exposure on thyroid function. However, because of the complexity of interpretation of various parameters of thyroid function (Larsen et al. 2002), the possibility of peripheral effects on thyroid function instead of or in addition to direct effects on the thyroid, the absence of TSH measurements in most of the animal studies, the difficulties of exposure estimation in human studies, and the lack of information in most studies on nutritional factors (iodine, selenium) that are known to affect thyroid function, it is difficult to predict
exactly what effects on thyroid function are likely at what concentration of fluoride exposure and under what circumstances.
Suggested mechanisms of action for the results reported to date include decreased production of thyroid hormone, effects on thyroid hormone transport in blood, and effects on peripheral conversion of T4 to T3 or on normal deiodination processes, but details remain uncertain. Both peripheral conversion of T4 to T3 and normal deiodination (deactivation) processes require the deiodinases (Types I and II for converting T4 to T3 and Types I and III for deactivation; Schneider et al. 2001; Larsen et al. 2002; Goodman 2003). Several sets of reported results are consistent with an inhibiting effect of fluoride on deiodinase activity; these effects include decreased plasma T3 with normal or elevated T4 and TSH and normal T3 with elevated T4 (Bachinskii et al. 1985; Guan et al. 1988; Lin et al. 1991; Balabolkin et al. 1995; Michael et al. 1996; Mikhailets et al. 1996; Susheela et al. 2005). The antihyperthyroid effect that Galletti and Joyet (1958) observed in some patients is also consistent with an inhibition of deiodinase activity in those individuals.
The available studies have generally dealt with mean values of various parameters for the study groups, rather than with indications of the clinical significance, such as the fraction of individuals with a value (e.g., TSH concentration) outside the normal range or with clinical thyroid disease. For example, in the two populations of asymptomatic individuals compared by Bachinskii et al. (1985), the elevated mean TSH value in the higher-fluoride group is still within the normal range, but the number of individuals in that group with TSH values above the normal range is not given.
In the absence of specific information in the reports, it cannot be assumed that all individuals with elevated TSH or altered thyroid hormone concentrations were asymptomatic, although many might have been. For asymptomatic individuals, the significance of elevated TSH or altered thyroid hormone concentrations is not clear. Belchetz and Hammond (2003) point out that the population-derived reference standards (e.g., for T4 and TSH) reflect the mean plus or minus two standard deviations, meaning that 5% of normal people have results outside a given range. At the same time, healthy individuals might regulate plasma T4 within a “personal band” that could be much more narrow than the reference range; this brings up the question of whether a disorder shifting hormone values outside the personal band but within the population reference range requires treatment (Davies and Larsen 2002; Belchetz and Hammond 2003). For example, early hypothyroidism can present with symptoms and raised TSH but with T4 concentrations still within the reference range (Larsen et al. 2002; Belchetz and Hammond 2003).
Subclinical hypothyroidism is considered a strong risk factor for later
development of overt hypothyroidism (Weetman 1997; Helfand 2004). Biondi et al. (2002) associate subclinical thyroid dysfunction (either hypoor hyperthyroidism) with changes in cardiac function and corresponding increased risks of heart disease. Subclinical hyperthyroidism can cause bone demineralization, especially in postmenopausal women, while subclinical hypothyroidism is associated with increased cholesterol concentrations, increased incidence of depression, diminished response to standard psychiatric treatment, cognitive dysfunction, and, in pregnant women, decreased IQ of their offspring (Gold et al. 1981; Brucker-Davis et al. 2001). Klein et al. (2001) report an inverse correlation between severity of maternal hypothyroidism (subclinical or asymptomatic) and the IQ of the offspring (see also Chapter 7).
A number of authors have reported delayed eruption of teeth, enamel defects, or both, in cases of congenital or juvenile hypothyroidism (Hinrichs 1966; Silverman 1971; Biggerstaff and Rose 1979; Noren and Alm 1983; Loevy et al. 1987; Bhat and Nelson 1989; Mg’ang’a and Chindia 1990; Pirinen 1995; Larsen and Davies 2002; Hirayama et al. 2003; Ionescu et al. 2004). No information was located on enamel defects or effects on eruption of teeth in children with either mild or subclinical hypothyroidism. The possibility that either dental fluorosis (Chapter 4) or the delayed tooth eruption noted with high fluoride intake (Chapter 4; see also Short 1944) may be attributable at least in part to an effect of fluoride on thyroid function has not been studied.
THYROID PARAFOLLICULAR CELLS
The parafollicular cells (C cells) of the thyroid produce a 32-amino acid peptide hormone called calcitonin (Bringhurst et al. 2002; Goodman 2003). Calcitonin acts to lower blood calcium and phosphate concentrations, primarily or exclusively by inhibiting osteoclastic (bone resorption) activity. Calcitonin does not play a major role in calcium homeostasis in humans, and its primary importance seems to be to protect against excessive bone resorption (Bringhurst et al. 2002; Goodman 2003). At high concentrations, calcitonin can also increase urinary excretion of calcium and phosphate, but these effects in humans are small and not physiologically important for lowering blood calcium (Goodman 2003). Parafollicular cells express the same G-protein-coupled, calcium-sensing receptors in their surface membranes as do the chief cells of the parathyroid glands, receptors that respond directly to ionized calcium in blood; however, the secretory response of the parafollicular cells is opposite that of the parathyroid chief cells (Bringhurst et al. 2002; Goodman 2003).
Animal Studies
Very few animal studies have examined the effects of fluoride exposure on parafollicular cells or calcitonin secretion (see Appendix E, Table E-8). Sundström (1971) found no evidence for short-term release of calcitonin in response to fluoride treatment in rats, in line with the view that NaF administration to rats by lavage resulted in hyperparathyroidism, secondary to the calcitonin-like (blood calcium-lowering) action of fluoride on bone tissue. Rantanen et al. (1972) reported that fluoride exposure had a retarding effect on cortical bone remodeling in female pigs and that an intact thyroid gland was necessary for this effect. Replacing thyroid hormone (but not calcitonin) in thyroidectomized pigs eliminated the retarding effect of fluoride, suggesting that the effect involved the formation, release, or enhanced action of calcitonin.
Human Studies
Teotia et al. (1978) found elevated calcitonin concentrations in seven patients with skeletal fluorosis in a high-fluoride area and in one of two patients who had moved to low-fluoride areas and showed improvement in various parameters (see Appendix E, Tables E-9 and E-10). Elevated calcitonin was found in all patients with an estimated fluoride intake of at least 9 mg/day and in one patient with an estimated current fluoride intake of 3.8 mg/day and a previous (until 2 years before) intake of 30 mg/day. Four of the individuals also had elevated parathyroid hormone (PTH), and radiographs of two suggested secondary hyperparathyroidism. Plasma calcium in the fluorosis patients was generally in the normal range, but urinary calcium concentrations were lower than those of controls; dietary calcium intakes were considered to be adequate. Vitamin D deficiency was not found.
In a review of skeletal fluorosis, Krishnamachari (1986) mentioned, but did not elaborate on, “significant alterations” in the “parathyroid-thyrocalcitonin axis,” also stating that the sequence of the hormonal changes was not clear and that the changes did not occur to the same degree in all patients, possibly reflecting the adequacy of calcium intake. Elevated calcitonin was found in some but not all cases of skeletal fluorosis in a series of epidemiologic studies reviewed by Teotia et al. (1998).
Tokar′ et al. (1989) reported elevated concentrations of calcitonin in the blood of workers employed in fluorine production, indicating stimulation of thyroid gland parafollicular cells. Huang et al. (2002) reported significantly elevated concentrations of serum PTH and calcitonin in 50 male fluoride workers and concluded that an excess of fluoride might affect secretion of both calcium-adjusting hormones.
Discussion (Effects on Parafollicular Cell Function)
Calcitonin concentrations do not seem to have been routinely measured in cases of skeletal fluorosis, but elevated calcitonin does seem to be present when looked for. The effect has been noted at fluoride intakes as low as 3.8 mg/day in humans (approximately 0.06 mg/kg/day) and was found routinely at intakes of at least 9 mg/day (approximately 0.15 mg/kg/day). No animal studies have reported calcitonin concentrations after fluoride exposure. Teotia et al. (1978) proposed several possible mechanisms (direct and indirect) of fluoride action with respect to effects on calcitonin and PTH secretion, but currently the significance of the elevated calcitonin concentrations associated with skeletal fluorosis is not clear.5
PARATHYROID GLANDS
In humans, four small parathyroid glands are normally situated on the posterior surface of the thyroid. These glands produce PTH, a simple 84-peptide hormone, which is the principal regulator of extracellular calcium (Bringhurst et al. 2002; Goodman 2003).6 The primary effect of PTH is to increase the calcium concentration and decrease the phosphate concentration in blood (Bringhurst et al. 2002; Goodman 2003). The major mechanisms by which this effect occurs include the mobilization of calcium phosphate from the bone matrix, primarily from increased osteoclastic activity; in the kidney, increased reabsorption of calcium, decreased reabsorption of phosphate, and increased activation of vitamin D; and increased intestinal absorption of calcium (Bringhurst et al. 2002; Goodman 2003). PTH is also important for skeletal homeostasis (bone remodeling). Regulation of PTH secretion is inversely related to the concentration of ionized calcium (Bringhurst et al. 2002; Goodman 2003).
Healthy individuals secrete PTH throughout the day (1-3 pulses per hour); blood concentrations of PTH also exhibit a diurnal pattern, with peak values after midnight and minimum values in late morning (el-Hajj
Fuleihan et al. 1997; Goodman 2003). Circadian patterns of PTH concentrations differ in men and women (Calvo et al. 1991) and between healthy and osteoporotic postmenopausal women (Eastell et al. 1992; Fraser et al. 1998). The diurnal fluctuations might be important for urinary calcium conservation (el-Hajj Fuleihan et al. 1997) and might be involved in anabolic responses of bone to PTH (Goodman 2003). Alterations in PTH rhythms might contribute to or be associated with osteoporosis (el-Hajj Fuleihan et al. 1997; Fraser et al. 1998).
In Vitro Studies
Fluoride ion has been shown to be a potent inhibitor of PTH secretion in bovine and human parathyroid cells in vitro (Chen et al. 1988; Shoback and McGhee 1988; Sugimoto et al. 1990; Ridefelt et al. 1992); PTH inhibition was observed at concentrations ranging from 0.5 to 20 mM (9.5-380 mg/L) with maximum effect at or above 5 mM (95 mg/L). This action by fluoride either requires or is potentiated by Al3+, consistent with a mechanism of G-protein stimulation. Fluoride (or aluminum fluoride), via the G proteins, suppresses cAMP accumulation, increases cytosolic Ca2+ (probably by stimulating a calcium channel), increases inositol phosphate accumulation, and also might directly inhibit the PTH secretory process (Chen et al. 1988; Shoback and McGhee 1988; Sugimoto et al. 1990; Ridefelt et al. 1992). No single mechanism is clearly responsible for inhibiting PTH secretion, suggesting that several mechanisms might be involved in its regulation.
Animal Studies
A number of animal studies of the effects of fluoride on parathyroid function are summarized below (for more details, see Appendix E, Table E-11). Administration of NaF as a lavage was found to elicit hyperparathyroidism in rats (Yates et al. 1964, as cited by Sundström 1971); the hyperparathyroidism was thought to be secondary to a direct, calcitonin-like, action of fluoride on bone tissue (Rich and Feist 1970, as cited by Sundström 1971). Levy et al. (1970) demonstrated increased resistance (suppressed sensitivity) of alveolar bone to PTH (in pharmacologic doses) in marmosets fed fluoride in drinking water (50 mg/L) for 5 months. More recently, increased serum inorganic fluoride due to use of the anesthetic isoflurane was associated with decreased ionized calcium and increased PTH and osteocalcin in cynomolgus monkeys (Hotchkiss et al. 1998).
A fivefold increase in blood PTH was seen as early as 1 week in lambs given drinking water with fluoride at 90 mg/L (Faccini and Care 1965); by 1 month, ultrastructural changes considered to be indicative of increased activity were observed in the parathyroid glands. The overactivity of the
parathyroid might be a response to a “more stable mineral system, i.e. fluoroapatite” that is “resistant to the normal processes of resorption,” thus requiring an increase in PTH activity to maintain normal serum calcium concentrations (Faccini 1969).
Chavassieux et al. (1991) reported a significant decrease in serum calcium and phosphorus and increases in serum PTH in sheep fed 1 or 5 mg of NaF per kg per day for 45 days, without calcium supplementation. Because of wide variation, the increased serum PTH is not considered statistically significant, but mean serum PTH in both groups at 45 days was at least twice as high as at the beginning of the experiment. This study and those of Faccini and Care (1965) and Hotchkiss et al. (1998) suggest a hypocalcemic response to the fluoride, followed by increased PTH secretion in response to the hypocalcemia.
Two longer-term animal studies with “high” concentrations of calcium and vitamin D intake have reported no effect of fluoride exposure on calcium homeostasis or parathyroid function (Andersen et al. 1986; Turner et al. 1997). However, two other studies with low-calcium situations found an altered parathyroid response. In one of these studies, Li and Ren (1997) reported that rats fed fluoride (100 mg/L in drinking water) for 2 months along with a low-calcium diet exhibited osteomalacia, osteoporosis, accelerated bone turnover, increased serum alkaline phosphatase, increased osteocalcin,7 and increased PTH. Fluoride-treated animals with adequate dietary calcium showed only slightly increased osteoblastic activity after 2 months but elevated serum alkaline phosphatase activity and increased average width of trabecular bone after 1 year.
In an earlier study, Rosenquist et al. (1983) fed drinking water containing fluoride at 50 mg/L to male Wistar rats from the age of 5 weeks until age 51 weeks; half the animals were given a calcium-deficient diet for the last 16 weeks. Control animals were fed drinking water containing fluoride at <0.5 mg/L. At 35 weeks, average serum immunoreactive PTH was reduced, but not significantly, in the fluoride-treated rats. At 51 weeks, calcium-deficient rats without fluoride showed elevated PTH (the normal response), whereas calcium-deficient rats with fluoride showed very slightly less PTH than calcium-sufficient, fluoride-treated rats. All groups had normal serum calcium concentrations. The authors concluded that fluoride in the amount used does not increase parathyroid activity and that fluoride supplementation “seems to prevent the profound changes in parathyroid activity that result from calcium deficiency” (Rosenquist et al. 1983). However, a better interpretation of the data is that the normal increase in PTH in response to a dietary calcium deficiency did not occur in the fluoride-treated animals
(although some morphological changes occurred), suggesting that normal parathyroid function was inhibited. These animals were adults when the calcium deficiency was imposed, and the effect of fluoride treatment on animals with a preexisting calcium deficiency was not examined. Substantially wider standard deviations were observed for all fluoride-treated and calcium-deficient groups than in the controls (no fluoride, calcium sufficiency), suggesting variable responses in the animals.
Dunipace et al. (1995, 1998) examined the effects of fluoride (up to 50 mg/L in drinking water) on male Sprague-Dawley rats with a normal diet (Dunipace et al. 1995) or with either a calcium-deficient diet or a diet deficient in protein, energy, or total nutrients (Dunipace et al. 1998). Fluoride reportedly had no effect on various clinical parameters monitored in normal, calcium-deficient, or malnourished animals; however, the papers showed results only for combinations of fluoride treatment groups, and calcium-related parameters such as PTH and calcitonin concentrations were not measured. The combination of general malnutrition and calcium deficiency was not examined.
Verma and Guna Sherlin (2002b) reported hypocalcemia in female rats and their offspring when the mothers were treated with NaF (40 mg/kg/day) during gestation and lactation. PTH was not measured.
Tiwari et al. (2004) reported decreased serum calcium, increased serum alkaline phosphatase, increased concentrations of vitamin D metabolites (both 25(OH)D3 and 1,25(OH)2D3), and lower whole body bone mineral density (suggestive of deficient mineralization) in rats born to mothers given a calcium-deficient diet and high fluoride (50 mg/L in drinking water) from day 11 of gestation; after weaning the pups were given the same low-calcium, high-fluoride regimen. Although the authors did not measure PTH or examine bone histomorphometry, they did demonstrate specific changes in gene transcription in the duodenal mucosa, including decreased transcription of the genes for the vitamin D receptor and calbindin D 9 k (a vitamin-D regulated protein that enhances calcium uptake) and altered (decreased at 9 weeks) transcription of the gene for the calcium-sensing receptor (which senses changes in extracellular calcium concentrations and regulates serum calcium concentrations by influencing PTH secretion). Excess fluoride continued to produce alterations in gene expression even when calcium was restored to the diet. The changes in gene expression are thought to result in decreased absorption of calcium from the gut.
Human Studies (Clinical, Occupational, or Population)
Clinical, occupational, and population studies of the effects of fluoride on human parathyroid function are summarized below (for more detail, see Appendix E, Table E-12). In one study with healthy subjects, a single oral
dose of 27 mg of fluoride was followed by decreases in serum calcium and phosphorus and an increase in serum immunoreactive PTH (Larsen et al. 1978), suggesting a rise in PTH in response to the decrease in serum calcium. The fall in serum calcium was attributed to increased mineralization of bone in response to the fluoride dose. Oral doses of fluoride at 27 mg/day for 3 weeks in healthy adults produced a significant increase in serum osteocalcin at the end of the 3-week period but not in total or ionized calcium, alkaline phosphatase, PTH, and several other parameters (Dandona et al. 1988). The mean PTH concentration at 3 weeks was elevated slightly over the initial (pretreatment) values, and the standard deviation was considerably larger, suggesting that a few individuals might have had significant increases. In a follow-up letter, Gill et al. (1989) suggested that the age of the subjects and the sensitivity of the PTH assay might influence the findings.
Stamp et al. (1988, 1990) reported increased concentrations of biologically active PTH in osteoporosis patients receiving both calcium and sodium fluoride during short- and long-term treatments. In the short-term (8-day) study, two groups of patients were identified with respect to stability of serum calcium and phosphorus concentrations (Stamp et al. 1988). In the group with more stable serum calcium, NaF inhibited intestinal calcium and phosphorus absorption and reduced calcium balance; this inhibition is not explainable by the formation of calcium-fluoride complexes and might be due to inhibition by fluoride of some step(s) in active transport (Stamp et al. 1988).
In patients treated for 15 ± 10 months, the treated group as a whole had statistically significant elevation of biologically active PTH and serum alkaline phosphatase (Stamp et al. 1990). In those patients (32% of the treated group) in whom biologically active PTH was above the upper limit of normal, serum alkaline phosphatase was not elevated above control concentrations; elevated PTH also was associated with relative hypophosphatemia and relative hypercalciuria. Thus, in some individuals, fluoride stimulated the synthesis or release of serum alkaline phosphatase, and PTH concentrations were in the normal range; in others, serum alkaline phosphatase was not increased, indicating failure of the osteoblastic response, and PTH concentrations were above the normal range.
Duursma et al. (1987) also found that individuals varied in their responses to fluoride treatment for osteoporosis. Those individuals who had a femoral neck fracture during the treatment period (6 of 91 patients) also appeared to have lower serum alkaline phosphatase concentrations and higher serum PTH concentrations than other patients.
In a comparison of 25 fluoride-treated osteoporosis patients with calcium supplementation and 38 controls with no fluoride treatment (but in most cases calcium supplementation), Jackson et al. (1994) reported no significant difference in mean calcium concentrations between groups,
although 2 of 25 individuals were outside the normal range (versus 0 of 38 controls). A significant elevation in mean alkaline phosphatase concentration was observed in the treated group, with 8 of 25 individuals outside the normal range (versus 0 of 38 controls); for those 8 individuals, the significant elevation was largely due to an increased concentration of bone isoenzymes. For the 24 patients for whom baseline (pretreatment) information was available, mean calcium concentrations were significantly lower and alkaline phosphatase was significantly higher. PTH was not measured in these patients, and individuals with a history of thyroid, parathyroid, or gastrointestinal problems were not included in the study. The authors stated that “none of the mean differences between groups were considered to be clinically significant,” but whether some individuals had clinically significant situations was not addressed.
Dure-Smith et al. (1996) reported that fluoride-treated osteoporosis patients who showed a rapid increase in spinal bone density also showed a general state of calcium deficiency and secondary hyperparathyroidism; similarly treated patients with a decrease or slow increase in spinal bone density were much less likely to be calcium deficient. The degree of calcium deficiency appeared to be related to the previous fluoride-dependent increase in spinal bone density, indicating that an osteogenic response to fluoride can increase the skeletal requirement for calcium, even in patients with a high calcium intake. Reasons for the differences in response to fluoride treatment (rapid increase versus decrease or slow increase in spinal bone density) were not identified.
Osteoporosis patients treated either with slow-release NaF or with a placebo (both with concurrent calcium supplementation) showed decreases in immunoreactive PTH from initial pretreatment values, presumably due to the calcium supplementation (Zerwekh et al. 1997b). PTH values in the fluoride-treated group stayed slightly (but not significantly) higher than those in the placebo group.
Li et al. (1995) described a population study in China that examined adults in regions with various fluoride concentrations in the drinking water and either “normal” or “inadequate” nutrition in terms of protein and calcium intake; people in the sample were “healthy” rather than randomly selected. A significant decrease in blood calcium concentration was associated with an increase in fluoride exposure in the populations with inadequate nutrition but was not detected in subjects with normal nutrition. Elevated alkaline phosphatase activity with increased fluoride exposure was observed in all populations, with higher values in subjects with inadequate nutrition. PTH concentrations were not measured. For calcium, alkaline phosphatase, and several other blood parameters, all values were stated to be within the normal range regardless of fluoride exposure and nutritional condition, but it is not clear whether “all values” refers to mean or individual values.
Jackson et al. (1997) examined adult volunteers in the United States who had lived at least 30 years in communities with natural fluoride concentrations in drinking water of 0.2, 1.0, or 4.0 mg/L. Mean values for plasma calcium, phosphate, and alkaline phosphatase for all groups were within the normal ranges, although there were statistically significant differences among groups for calcium and phosphate concentrations. On the basis of plasma fluoride concentrations, the group in the 0.2-mg/L community was thought to have higher fluoride intake than expected solely from their drinking water. Calcium intakes and general nutritional status were not discussed, and PTH concentrations were not measured.
Human Studies (Endemic Skeletal Fluorosis)
Six papers (five from India and one from South Africa) describe parathyroid function in cases of endemic skeletal fluorosis (see Appendix E, Table E-13). An additional paper describes a U.S. patient with renal insufficiency, systemic fluorosis attributed to the renal insufficiency (and resulting polydipsia), and serum immunoreactive PTH more than three times the normal value (Juncos and Donadio 1972). The patient’s fluoride intake at the time of the study was about 20 mg/day, or 0.34 mg/kg/day. Johnson et al. (1979) refer to that patient and 5 others with renal disease in whom fluoride (approximately 1.7-3 mg/L in drinking water) “may have been the cause of detectable clinical and roentgenographic effects.” They state that plasma PTH concentrations were elevated in all 6, albeit the concentrations were considered “relatively low” for the severity of the bone disease. Two other U.S. patients with skeletal fluorosis but no renal disease did not have elevated PTH concentrations (Felsenfeld and Roberts 1991; Whyte et al. 2005).
Singh et al. (1966) found significantly higher serum alkaline phosphatase values in individuals with fluorosis but no significant differences between patients and controls in serum calcium or inorganic phosphate. They did not measure PTH.
Teotia and Teotia (1973) reported that 5 of 20 patients with skeletal fluorosis had clear evidence of secondary hyperparathyroidism. The estimated mean fluoride intake was ≥25 mg/day; dietary calcium and vitamin D were considered adequate. Laboratory results showed increased plasma alkaline phosphatase, increased phosphate clearance, decreased tubular reabsorption of phosphate, increased urinary fluoride, and decreased urinary calcium. Plasma calcium and phosphate were normal in four of the patients. Elevated serum immunoreactive parathyroid hormone was observed in all five, especially in the person with elevated plasma calcium and decreased plasma phosphate. This person, who was thought to have been developing tertiary hyperparathyroidism, was later found to have a parathyroid
adenoma. Radiological findings in all five people were consistent with hyperparathyroidism.
Teotia et al. (1978) reported increased PTH concentrations in four of seven patients with endemic skeletal fluorosis (including the patient with the lowest fluoride intake); increased alkaline phosphatase was seen in at least three, and increased calcitonin was seen in all seven (Figure 8-3; Table E-10). Radiographs of two persons were consistent with secondary hyperparathyroidism. Dietary intakes of fluoride were estimated to range from 8.7 to 52 mg/day. Plasma calcium concentrations in the fluorosis patients were generally in the normal range, but urinary calcium concentrations were lower than those of controls; dietary calcium intakes were considered to be adequate. Vitamin D deficiency was not found. The finding that not everyone had elevated PTH is consistent with other observations of variability in individual responses.
Srivastava et al. (1989) described four siblings in India with skeletal fluorosis, normal total and ionized calcium concentrations, and normal vitamin D concentrations. The mother of the four had subnormal total and ionized calcium and subnormal vitamin D. All five individuals had significantly elevated PTH, elevated osteocalcin, and elevated alkaline phosphatase (Figure 8-4). Fluoride intakes were estimated to be between 16 and 49
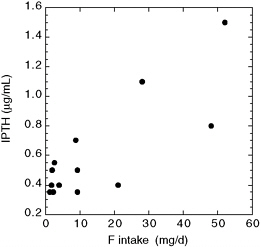
FIGURE 8-3 Plasma immunoreactive parathyroid hormone (IPTH) versus fluoride intake for nine skeletal fluorosis patients (two of whom had moved to a low-fluoride area) and five controls (data from Teotia et al. 1978; see Appendix E, Tables E-10 and E-13). Note that two of the control patients shown with IPTH values of 0.35 µg/mL were actually reported as “< 0.35” µg/mL. The four IPTH values of 0.7 µg/mL or greater were considered elevated above the values found in healthy controls.
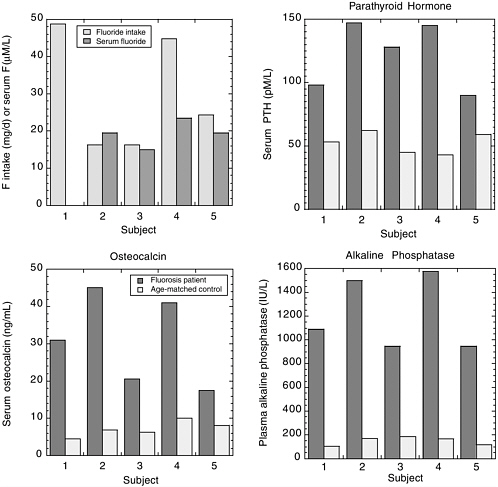
FIGURE 8-4 Fluoride intake and serum fluoride (upper left) in four Indian siblings (subjects 2-5) and their mother (subject 1). Serum PTH and osteocalcin and plasma alkaline phosphatase are shown for the same subjects and for normal age-matched Indian controls. SOURCE: Srivastava et al. 1989.
mg/day, primarily from a water source containing fluoride at 16.2 mg/L. The findings of elevated PTH in the presence of low or normal total and ionized calcium concentrations suggest secondary hyperparathyroidism in these individuals.
Pettifor et al. (1989) described a study of 260 children between 6 and 16 years old in an area of South Africa with endemic skeletal fluorosis (water fluoride concentrations of 8-12 mg/L). Hypocalcemia was present in 23% of these children and in six of nine children presenting with skel-
etal symptoms who were studied individually. In comparable areas with low fluoride concentrations, the prevalence of hypocalcemia was only 2% to13%. Bone fluoride was elevated about 10-fold in the seven children measured. The children exhibited a reduced phosphaturic response during a PTH-stimulation test, suggestive of pseudohypoparathyroidism Type II; the response was directly related to the presence of hypocalcemia and could be corrected by correcting the hypocalcemia. Biopsies of iliac crest bone gave a picture of severe hyperosteoidosis associated with secondary hyperparathyroidism and a mineralization defect. The authors suggested that fluoride ingestion might increase calcium requirements and exacerbate the prevalence of hypocalcemia. The usual result of low calcium intake is classical rickets and generalized osteopenia; in this case, the combination of low calcium and high fluoride resulted in a different presentation at a later age. The degree of hypocalcemia appears to play a major role in determining the severity of osteomalacia present in endemic skeletal fluorosis and influences the renal response to hyperparathyroidism (in terms of variable serum phosphate values). The authors also pointed out the “striking male predominance” of skeletal fluorosis in their study and cited similar findings in previous studies.
Gupta et al. (2001) described a one-time study of children aged 6-12 in four regions of India with different fluoride intakes (for details, see Appendix E, Table E-14). Mean serum calcium concentrations were within the normal range for all groups. The serum PTH in all groups was correlated with the fluoride intake (Figure 8-5) and with the severity of clinical and skeletal fluorosis. The authors concluded that the increased serum PTH was related to high fluoride ingestion and could be responsible for maintaining serum calcium concentrations as well as playing a role in the toxic manifestations of fluorosis. Calcium intake is not stated in the paper, but the primary author has indicated that calcium intake in the study areas was normal (S. K. Gupta, Satellite Hospital, Banipark, Jaipur, personal communication, December 11, 2003).
In a review of skeletal fluorosis, Krishnamachari (1986) indicated that the nature (osteosclerotic, osteomalacic, osteoporotic) and severity of the fluorosis depend on factors such as age, sex, dietary calcium intake, dose and duration of fluoride intake, and renal efficiency in fluoride handling. In some cases, secondary hyperparathyroidism is observed with associated characteristic bone changes. He also noted the preponderance of males among fluorosis patients and discussed a possible protective effect of estrogens. In his review, Krishnamachari (1986) described a twofold model for the body’s handling of fluoride.
-
In the presence of adequate calcium, absorbed fluoride is deposited in the bone as calcium fluorapatite. Bone density increases, urinary fluoride
-
increases, but urinary calcium and phosphorus are not altered. Osteosclerosis and calcification of many tendons and ligaments occur. Serum alkaline phosphatase activity is elevated, but no specific changes occur in other constituents of serum. There are minimal hormonal changes and only mild secondary hyperparathyroidism. If the situation progresses, there will be osteophytosis (bony outgrowths), neurological complications,8 and late crippling, producing an osteosclerotic form of fluorosis that primarily affects adults.
-
In the presence of inadequate calcium, fluoride directly or indirectly stimulates the parathyroid glands, causing secondary hyperparathyroidism leading to bone loss. Bone density is variably increased, with areas of sclerosis or porosis; there is evidence (radiological and densitometrical) of bone loss. There is renal conservation of calcium in spite of hyperparathyroidism, with no significant changes in serum biochemistry; urinary hydroxyproline excretion is significantly increased. In these conditions, an osteoporotic type of skeletal fluorosis occurs at a younger age, and growing children develop deformities due to bone softening.
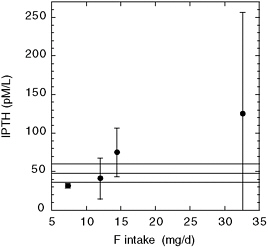
FIGURE 8-5 Parathyroid hormone (IPTH) versus fluoride intake for children in four villages with different mean fluoride intakes (Gupta et al. 2001; also see Appendix E, Tables E-13 and E-14). Vertical lines indicate standard deviations on the means. Horizontal lines indicate normal range of IPTH (48.1 ± 11.9 pM/L) for this method of measurement.
Teotia et al. (1998) compared a number of epidemiologic studies of skeletal fluorosis from 1963 to 1997, including 45,725 children consuming water with fluoride at 1.5-25 mg/L. They observed that the combination of fluoride exposure and calcium deficiency led to more severe effects of fluoride, metabolic bone diseases, and bone deformities, resulting from excess fluoride, low calcium, high PTH, and high 1,25-dihydroxy vitamin D3. Fluoride exposure in the presence of calcium sufficiency led to an osteosclerotic form of fluorosis, with minimal secondary hyperparathyroidism. For comparable fluoride intake, metabolic bone disease occurs in 90% of children with calcium deficiency versus 25% of children with adequate calcium intake. The authors concluded that the toxic effects of fluoride occur at a lower fluoride intake (>2.5 mg/day) when there is a calcium deficiency and that fluoride appears to exaggerate the metabolic effects of calcium deficiency on bone.
Discussion (Parathyroid Function)
Of the animal studies that actually measured PTH, two studies have shown no effect of fluoride on PTH concentrations in blood (Liu and Baylink 1977; Andersen et al. 1986); animals in these studies were supplied with adequate or high dietary calcium. An additional three studies reported no effect of fluoride on serum or plasma calcium concentrations but did not measure PTH concentrations (Rosenquist and Boquist 1973; Dunipace et al. 1995, 1998). Rosenquist and Boquist (1973) gave no information on dietary calcium. One experiment by Dunipace et al. (1998) specifically used low dietary calcium for some treatment groups. Turner et al. (1997) found decreased serum calcium and elevated (but not significantly so) PTH in fluoride-treated animals with high dietary calcium. Both Verma and Guna Sherlin (2002b) and Tiwari et al. (2004) reported hypocalcemia due to combined calcium deficiency and fluoride exposure, but PTH was not measured. Tiwari et al. (2004) described changes in gene expression that would result in reduced calcium absorption from the gut. Elevated PTH concentrations were reported for fluoride-treated animals in three papers, including one with no information on dietary calcium (Faccini and Care 1965), one with normal dietary calcium and decreased serum calcium (Chavassieux et al. 1991), and one with low dietary calcium (Li and Ren 1997). In one other study, the normal response to a calcium deficiency (elevated PTH) did not occur in fluoride-exposed animals (Rosenquist et al. 1983).
Human studies show elevated PTH concentrations in at least some individuals at doses of 0.4-0.6 mg/kg/day (Teotia and Teotia 1973; Larsen et al. 1978; Duursma et al. 1987; Dandona et al. 1988; Stamp et al. 1988, 1990; Srivastava et al. 1989; Dure-Smith et al. 1996; Gupta et al. 2001) and in some cases at doses as low as 0.15 mg/kg/day (Teotia et al. 1978)
and 0.34 mg/kg/day (Juncos and Donadio 1972). Li et al. (1995) found a significant decrease in mean plasma calcium concentrations with increased fluoride exposure in populations of apparently healthy adults with inadequate nutrition, but PTH was not measured. Jackson et al. (1994) found calcium concentrations outside the normal range in 2 of 25 persons treated with fluoride for osteoporosis, but the mean value for the group was within the normal range; these persons also received calcium supplementation. Calcium concentrations in 24 patients decreased from pretreatment concentrations; however, PTH concentrations were not measured. Jackson et al. (1997) also found no significant effect of fluoride on blood calcium concentrations in people who lived in communities with different fluoride concentrations but presumably had adequate nutrition; PTH concentrations were not measured.
The indirect action of fluoride on parathyroid function is relatively straightforward: fluoride induces a net increase in bone formation (Chavassieux et al. 1991) and also decreases calcium absorption from the gastrointestinal tract (beyond the degree expected by formation of calcium-fluoride complexes; Krishnamachari 1986; Stamp et al. 1988; Ekambaram and Paul 2001); both of these effects lead to an increase in the body’s calcium requirement (Pettifor et al. 1989; Ekambaram and Paul 2001). If dietary calcium is inadequate to support the increased requirement, the response is an increase in PTH (secondary hyperparathyroidism). PTH acts to increase resorption of bone, but the effect is uneven; low-fluoride bone is resorbed first (Faccini 1969). As bone fluoride increases, the “solubility” of the bone, or the ease with which it is resorbed, is decreased (because of the greater stability of fluorapatite), giving an apparent resistance to the effects of PTH (Faccini 1969; Levy et al. 1970; Messer et al. 1973a,b). The indirect action of fluoride to cause an increased calcium requirement is consistent with reports of reduced milk production (due to inadequate mobilization of calcium from bone) in livestock with excessive fluoride consumption and of more severe fluorosis in lactating animals (due to the higher calcium utilization during lactation) (e.g., Eckerlin et al. 1986a,b; Jubb et al. 1993). The work of Tiwari et al. (2004) provides an initial description of a mechanism by which fluoride exposure in the presence of a calcium deficiency further increases the dietary requirement for calcium, namely by altering the expression of genes necessary for calcium absorption from the gastrointestinal tract.
Some studies also indicate direct effects of fluoride on the parathyroid gland. Elevated PTH in the presence of normal serum calcium might indicate a stimulatory effect of fluoride (Gill et al. 1989; Srivastava et al. 1989). The absence of the normal elevation of PTH in response to calcium deficiency suggests an inhibitory effect (Rosenquist et al. 1983), as do several in vitro studies (Chen et al. 1988; Shoback and McGhee 1988; Sugimoto et al. 1990; Ridefelt et al. 1992). The possibility also exists that a direct effect on either
the parathyroid or the thyroid parafollicular cells leads to a compensatory response from the other, but this has not been examined.
Several studies have reported different responses among individuals or variability in group responses (Teotia and Teotia 1973; Teotia et al. 1978; Krishnamachari 1986; Duursma et al. 1987; Dandona et al. 1988; Stamp et al. 1988; 1990; Jackson et al. 1994; Dure-Smith et al. 1996; Gupta et al. 2001); the reasons for these differences are not clear but might include genetic differences in addition to variability in nutritional factors. The effects also might vary with age, sex, and the duration (as well as degree) of hypocalcemia.
Any cause of hypocalcemia or vitamin D deficiency can lead to secondary hyperparathyroidism (elevated PTH) in an attempt by the body to maintain calcium homeostasis (Ahmad and Hammond 2004).9 Fluoride clearly has the effect of decreasing serum calcium and increasing the calcium requirement in some or many exposed persons. In those studies which have measured it, PTH is elevated in some persons in response to fluoride exposure, indicating secondary hyperparathyroidism. No information has been reported in those studies on the clinical effects, if any, in those persons. In general, secondary hyperparathyroidism in response to calcium deficiency may contribute to a number of diseases, including osteoporosis, hypertension, arteriosclerosis, degenerative neurological diseases, diabetes mellitus, some forms of muscular dystrophy, and colorectal carcinoma (Fujita and Palmieri 2000). McCarty and Thomas (2003) suggest that down-regulation of PTH (by calcium and/or vitamin D supplementation) could assist in control of weight and prevention of diabetes.
Calcium deficiency induced or exacerbated by fluoride exposure may contribute to other adverse health effects. For example, Goyer (1995) indicates that low dietary calcium increases the concentration of lead in critical organs and the consequent toxicity. A recent increase in the number of cases of nutritional rickets in the United States appears to reflect calcium-deficient diets rather than vitamin D deficiencies (DeLucia et al. 2003). These cases occur in children whose diet lacks dairy products;10 circulating PTH concentrations are elevated, as are alkaline phosphatase concentrations. The authors “emphasize that nutritional calcium deficiency may occur in North American infants and is not limited to the setting of developing countries” and state that “factors that affect calcium absorption may be important in determining a susceptibility to the development of rickets.”
|
9 |
Renal failure is the most common cause of secondary hyperparathyroidism (Ahmad and Hammond 2004). |
|
10 |
A diet low in dairy products will have not only a lower calcium content but probably also a higher fluoride content, due to greater use of beverages such as juices that have been manufactured with fluoridated municipal water (see Chapter 2); absorption and retention of fluoride will be higher because of the calcium deficiency. |
PINEAL GLAND
The pineal gland is a small organ (150 mg in humans) located near the center of the brain. One of the major components of the mammalian circadian system, it lies in the upper margins of the thalamus in the dorsal aspects of the third ventricle and has both physical and neuronal connections with the brain. Although the pineal gland lies outside the blood-brain barrier, it has access to the cerebrospinal fluid. The pineal gland’s major neuronal connections with the brain are the sympathetic nerve fibers coming from the superior cervical ganglion; the activity of these sympathetic nerves controls synthesis and release of the pineal hormone melatonin (Cone et al. 2002).11 Other substances (primarily peptides) are also secreted from the pineal gland and have been reported to have various physiological effects, including antigonadotropic, metabolic, and antitumor activity (Anisimov 2003).
Most melatonin production occurs during darkness (Reiter 1998; Salti et al. 2000; Cone et al. 2002; Murcia García et al. 2002). Peak serum concentrations of melatonin occur during childhood in humans, with decreasing concentrations during adolescence before stabilization at the low concentration characteristic of adults (García-Patterson et al. 1996; Murcia García et al. 2002); further decreases in melatonin occur at menopause in women and at a corresponding age in men (Reiter 1998).
Melatonin affects target tissues, such as the hypophyseal pars tuberalis, that have a high density of melatonin receptors. The primary effect seems to be temporally specific activation of cAMP-sensitive gene expression in the pars tuberalis by the sensitization of adenylyl cyclase, thus synchronizing the suprachiasmatic nucleus of the hypothalamus and clock-controlled genes in peripheral tissue (Stehle et al. 2003). In humans, changes in melatonin are associated with the status of the reproductive system—onset of puberty, stage of puberty, menstrual cyclicity, menopause (Reiter 1998; Salti et al. 2000)—but the functional relationships are not fully understood. The elevated melatonin concentrations characteristic of prepubertal age suggest an inhibitory effect on pubertal development (Aleandri et al. 1997; Salti et al. 2000); sexual maturation begins when serum melatonin starts to decrease (Aleandri et al. 1997; Reiter 1998). Melatonin also seems to be involved with anxiety reactions; for example, the beneficial effects of fluoxetine (Prozac) in mice during an anxiety test are not found if the pineal gland has been removed (Uz et al. 2004).
Melatonin and pineal peptides have been associated with a number of other physiological effects, including regulation of circadian rhythms and
sleep (Arendt 2003; Cajochen et al. 2003); regulation of reproductive physiology in seasonal breeders (Aleandri et al. 1997; Reiter 1998; Stehle et al. 2003); effects on calcium and phosphorus metabolism, parathyroid activity, bone growth, and development of postmenopausal osteoporosis (Chen et al. 1990, 1991; Sandyk et al. 1992; Shoumura et al. 1992; el-Hajj Fuleihan et al. 1997; Roth et al. 1999; Cardinali et al. 2003; Goodman 2003); oncostatic or anticarcinogenic effects (Cohen et al. 1978; García-Patterson et al. 1996; Panzer 1997; Anisimov 2003); antioxidant actions (Srinivasan 2002; Reiter et al. 2003b); and effects on the central nervous system, psychiatric disease, and sudden infant death syndrome (García-Patterson et al. 1996; Reiter 1998; Delagrange et al. 2003). Panzer (1997) suggested that the simultaneous decrease in melatonin concentrations and the exponential increase in bone growth during puberty could be a factor in the typical age distribution of osteosarcoma.
Pineal Gland Calcification
The pineal gland is a calcifying tissue; in humans, calcified concretions can be found at any age, although the likelihood increases with age (Vígh et al. 1998; Akano and Bickler 2003) and may be associated with menopause (Sandyk et al. 1992). The occurrence of pineal calcifications varies among different populations and nations (Vígh et al. 1998), possibly in association with the degree of industrialization (Akano and Bickler 2003), rates of breast cancer (Cohen et al. 1978), and high circannual light intensity near the equator (Vígh et al. 1998). Osteoporosis might be associated with fewer concretions (Vígh et al. 1998).
Melatonin secretion is well correlated with the amount of uncalcified pineal tissue (Kunz et al. 1999) but not with the size of pineal calcification (Vígh et al. 1998; Kunz et al. 1999). An increase in calcification of the pineal gland in humans probably represents a decrease in the number of functioning pinealocytes and a corresponding decrease in the individual’s ability to produce melatonin (Kunz et al. 1999). The degree of calcification, relative to the size of an individual’s pineal gland, has been suggested as a marker of the individual’s decreased capability to produce melatonin (Kunz et al. 1999).
As with other calcifying tissues, the pineal gland can accumulate fluoride (Luke 1997, 2001). Fluoride has been shown to be present in the pineal glands of older people (14-875 mg of fluoride per kg of gland in persons aged 72-100 years), with the fluoride concentrations being positively related to the calcium concentrations in the pineal gland, but not to the bone fluoride, suggesting that pineal fluoride is not necessarily a function of cumulative fluoride exposure of the individual (Luke 1997, 2001). Fluoride has not been measured in the pineal glands of children or young adults, nor
has there been any investigation of the relationship between pineal fluoride concentrations and either recent or cumulative fluoride intakes.
In Vitro Studies
Few studies have examined the effects of fluoride on pineal function. NaF (2.5-20 mM, or fluoride at 47.5-380 mg/L) produces markedly increased adenylyl cyclase activity (up to four times control activity) of rat pineal homogenates in vitro (Weiss 1969a,b), as it does in other tissues (Weiss 1969a); ATPase activity in the homogenates was inhibited by up to 50% (Weiss 1969a). Potassium fluoride (7-10 mM, or fluoride at 133-190 mg/L) has been used experimentally to increase adenylyl cyclase activity in rat pineal glands in vitro (Zatz 1977, 1979).
Animal Studies
Details of the effect of fluoride on pineal function are presented in Appendix E, Table E-15. Luke (1997) examined melatonin production as a function of age and time of day in Mongolian gerbils (Meriones unguiculatus). On an absolute basis, melatonin production by the low-fluoride group was constant at ages 7-28 weeks, with no difference between males and females. Relative to body weight, melatonin output declined progressively with age until adulthood (by 11.5 weeks in females and 16 weeks in males). In contrast, prepubescent gerbils fed the high-fluoride diet had significantly lower pineal melatonin production than prepubescent gerbils fed the low-fluoride diet. Relative to body weight, the normal higher rate of melatonin production in sexually immature gerbils did not occur.
Sexual maturation in females occurred earlier in the high-fluoride animals (Luke 1997); males had increases in melatonin production relative to body weight between 11.5 and 16 weeks (when a decrease normally would occur), and testicular weight at 16 weeks (but not at 9 or 28 weeks) was significantly lower in high-fluoride than in low-fluoride animals. The circadian rhythm of melatonin production was altered in the high-fluoride animals at 11.5 weeks but not at 16 weeks. In high-fluoride females at 11.5 weeks, the nocturnal peak (relative to body weight) occurred earlier than in the low-fluoride animals; also, the peak value was lower (but not significantly lower) in the high-fluoride animals. In males, a substantial reduction (P < 0.00001) in the nocturnal peak (relative to body weight) was observed in the high-fluoride animals.
Human Studies
Although no studies are available that specifically address the effect of fluoride exposure on pineal function or melatonin production in humans, two studies have examined the age of onset of menstruation (age of menarche) in girls in fluoridated areas (Schlesinger et al. 1956; Farkas et al. 1983; for details, see Appendix E, Table E-15);12 the earlier study was discussed by Luke (1997) as part of the basis for her research. No comparable information on sexual maturation in boys is available.
In girls examined approximately 10 years after the onset of fluoridation (1.2 mg/L, in 1945) in Newburgh, New York, the average age13 at menarche was 12 years, versus 12 years 5 months among girls in unfluoridated Kingston (Schlesinger et al. 1956).14 The authors stated that this difference was not statistically significant. Note that those girls who reached menarche during the time period of the study had not been exposed to fluoride over their entire lives, and some had been exposed perhaps for only a few years before menarche (they would have been 8-9 years old at the time fluoridation was started). Those girls in Newburgh who had been exposed to fluoridated water since birth (or before birth) had not yet reached menarche by the time of the study.
A later study in Hungary (Farkas et al. 1983) reported no difference in the menarcheal age of girls in a town with “optimal” fluoride concentration (1.09 mg/L in Kunszentmárton, median menarcheal age 12.779 years) and a similar control town (0.17 mg/L in Kiskunmajsa; median menarcheal
age 12.79 years). This study shows postmenarcheal girls present at younger ages in the higher fluoride town than in the low-fluoride town, although the reported median ages were the same (Farkas et al. 1983).
Discussion (Pineal Function)
Whether fluoride exposure causes decreased nocturnal melatonin production or altered circadian rhythm of melatonin production in humans has not been investigated. As described above, fluoride is likely to cause decreased melatonin production and to have other effects on normal pineal function, which in turn could contribute to a variety of effects in humans. Actual effects in any individual depend on age, sex, and probably other factors, although at present the mechanisms are not fully understood.
OTHER ENDOCRINE ORGANS
The effects of fluoride exposure have been examined for several other endocrine organs, including the adrenals, the pancreas, and the pituitary (for details, see Appendix E, Tables E-16 and E-17). Effects observed in animals include changes in organ weight, morphological changes in tissues, increased mitotic activity, decreased concentrations of pituitary hormones, depressed glucose utilization, elevated serum glucose, and elevated insulin-like growth factor-1 (IGF-1). Effects reported in humans include “endocrine disturbances,” impaired glucose tolerance, and elevated concentrations of pituitary hormones. Studies of the effects of fluoride on glucose metabolism and in diabetic animals are discussed below; information on other effects is extremely limited.
Animal Studies (Diabetic Animals)
Two studies have examined the effects of fluoride exposure in diabetic rats. In the first study, Dunipace et al. (1996) compared male Zucker fatty diabetic rats and Zucker age-matched controls given drinking water with fluoride at 5, 15, or 50 mg/L.15 For the physiological, biochemical, and genetic variables that were monitored, no “measurable adverse effects” were noted. Statistically significant differences with respect to fluoride intake (as opposed to differences between normal and diabetic animals) were observed only for diabetic rats with fluoride at 50 mg/L. No endocrinological parameters (e.g., PTH) were measured. Dunipace et al. (1996) reported that fluoride intake, excretion, and balance were generally similar in this study and
in a previous study with Sprague-Dawley rats but that there were “strain-specific differences in fluoride sensitivity”; these differences were not defined or explained. The Zucker fatty diabetic rat is considered to be an animal model for human Type II (noninsulin-dependent) diabetes mellitus, although the diabetic rats in this study did not experience renal insufficiency, and the study was terminated before an age that might be more comparable to ages associated with late-onset diabetes and diabetic complications in humans. The authors concluded that the diabetic rats “were not at increased risk of fluorosis,” even though femoral fluoride concentrations (2,700-9,500 µg/g in ash for diabetic rats given fluoride at 15 or 50 mg/L versus 2,500-3,600 in normal rats given fluoride at 50 mg/L) were in the range associated with fluorosis in humans and exceeded concentrations of bone fluoride associated with decreased bone strength in rabbits (6,500-8,000 ppm in ash; Turner et al. 1997); no basis for their conclusion was given.
In the second study, Boros et al. (1998) compared the effects of fluoride at 10 mg/L in drinking water for 3 weeks on young female rats (Charles River, Wistar), either normal (nondiabetic) or with streptozotocin-induced, untreated diabetes. An additional group of normal rats was given an amount of fluoride in drinking water corresponding to the fluoride intake by the diabetic rats (up to about 3 mg/day per rat). Both feed and water consumption increased significantly in the diabetic rats (with and without fluoridated water); water consumption was significantly higher in the diabetic rats on fluoridated water than in those on nonfluoridated water. Fasting blood glucose concentrations were increased significantly in both diabetic groups, but more so in the group on fluoridated water. Fluoride treatment of non-diabetic animals did not cause any significant alteration in blood glucose concentrations. Plasma fluoride was higher, and bone fluoride was lower, in diabetic than in nondiabetic animals given the same amount of fluoride, indicating lower deposition of fluoride into bone and lower renal clearance of fluoride in the diabetic animals. The increased kidney weight found in diabetic animals on nonfluoridated water was not seen in the fluoride-treated diabetic animals. Additional biochemical and hormonal parameters were not measured.
In contrast to the Zucker fatty diabetic rats in the study by Dunipace et al. (1996), the streptozotocin-induced diabetic rats in this study (Boros et al., 1998) provide an animal model considered representative of Type I (insulin-dependent) diabetes mellitus in humans. In these rats, the general severity of the diabetes (blood glucose concentrations, kidney function, weight loss) was worse in animals given fluoride at 10 mg/L in their drinking water. In both types of diabetic rats, fluoride intake was very high because of the several-fold increase in water consumption, and corresponding plasma, soft tissue, and bone fluoride concentrations were elevated accordingly. Thus, any health effects related to plasma or bone fluoride
concentrations, for example, would be expected to occur in animals or humans with uncontrolled (or inadequately controlled) diabetes at lower fluoride concentrations in drinking water than for nondiabetics, because of the elevated water intakes. In addition, the results reported by Boros et al. (1998) suggested that, for some situations (e.g., diabetes in which kidney function is compromised), the severity of the diabetes could be increased with increasing fluoride exposure.
Animal Studies (Normal Animals)
Turner et al. (1997) reported a 17% increase in serum glucose in female rabbits given fluoride in drinking water at 100 mg/L for 6 months. IGF-1 was also significantly increased (40%) in these rabbits, but other regulators of serum glucose, such as insulin, were not measured. The authors suggested that IGF-1 concentrations might have changed in response to changes in serum glucose concentrations. Dunipace et al. (1995, 1998) found no significant differences with chronic fluoride treatment in mean blood glucose concentrations in rats; specific data by treatment group were not reported, and parameters such as insulin and IGF-1 were not measured.
Suketa et al. (1985) and Grucka-Mamczar et al. (2005) have reported increases in blood glucose concentrations following intraperitoneal injections of NaF; Suketa et al. (1985) attributed these increases to fluoride stimulation of adrenal function. Rigalli et al. (1990, 1992, 1995), in experiments with rats, reported decreases in insulin, increases in plasma glucose, and disturbance of glucose tolerance associated with increased plasma fluoride concentrations. The effect of high plasma fluoride (0.1-0.3 mg/L) appeared to be transient, and the decreased response to a glucose challenge occurred only when fluoride was administered before (as opposed to together with or immediately after) the glucose administration (Rigalli et al. 1990). In chronic exposures, effects on glucose metabolism occurred when plasma fluoride concentrations exceeded 0.1 mg/L (5 µmol/L) (Rigalli et al. 1992, 1995). The in vivo effect appeared to be one of inhibition of insulin secretion rather than one of insulin-receptor interaction (Rigalli et al. 1990). Insulin secretion (both basal and glucose-stimulated) by isolated islets of Langerhans in vitro was also inhibited as a function of fluoride concentrations (Rigalli et al. 1990, 1995). Rigalli et al. (1990) pointed out that recommended plasma fluoride concentrations for treatment of osteoporosis are similar to those shown to affect insulin secretion.
Human Studies
Jackson et al. (1994) reported no differences in mean fasting blood glucose concentrations between osteoporosis patients treated with fluoride and
untreated controls, although 3 of 25 treated individuals had values outside the normal range (versus 1 of 38 controls). No significant differences were found between groups of older adults with different fluoride concentrations in drinking water in studies in China (Li et al. 1995; subjects described as “healthy” adults) and the United States (Jackson et al. 1997), and all mean values were within normal ranges.16 Glucose tolerance tests were not conducted in these studies.
Trivedi et al. (1993) reported impaired glucose tolerance in 40% of young adults with endemic fluorosis, with fasting serum glucose concentrations related to serum fluoride concentrations; the impaired glucose tolerance was reversed after 6 months of drinking water with “acceptable” fluoride concentrations (<1 mg/L). It is not clear whether individuals with elevated serum fluoride and impaired glucose tolerance had the highest fluoride intakes of the group with endemic fluorosis or a greater susceptibility than the others to the effects of fluoride. For all 25 endemic fluorosis patients examined, a significant positive correlation between serum fluoride and fasting serum immunoreactive insulin (IRI) was observed, along with a significant negative correlation between serum fluoride and fasting glucose/ insulin ratio (Trivedi et al. 1993).
The finding of increased IRI contrasts with findings of decreased insulin in humans after exposure to fluoride (Rigalli et al. 1990; de la Sota et al. 1997) and inhibition of insulin secretion by rats, both in vivo and in vitro (Rigalli et al. 1990, 1995). However, the assay for IRI used by Trivedi et al. (1993) could not distinguish between insulin and proinsulin, and the authors suggested that the observed increases in both IRI and serum glucose indicate either biologically inactive insulin—perhaps elevated proinsulin—or insulin resistance. Inhibition of one of the prohormone convertases (the enzymes that convert proinsulin to insulin) would result in both elevated proinsulin secretion and increased blood glucose concentrations and would be consistent with the decreased insulin secretion reported by Rigalli et al. (1990, 1995) and de la Sota et al. (1997). Although Turner et al. (1997) suggested fluoride inhibition of insulin-receptor activity as a mechanism for increased blood glucose concentrations, Rigalli et al. (1990) found no difference in response to exogenous insulin in fluoride-treated versus control rats, consistent with no interference of fluoride with the insulin-receptor interaction.
Discussion (Other Endocrine Function)
More than one mechanism for diabetes or impaired glucose tolerance exists in humans, and a variety of responses to fluoride are in keeping with
variability among strains of experimental animals and among the human population. The conclusion from the available studies is that sufficient fluoride exposure appears to bring about increases in blood glucose or impaired glucose tolerance in some individuals and to increase the severity of some types of diabetes. In general, impaired glucose metabolism appears to be associated with serum or plasma fluoride concentrations of about 0.1 mg/L or greater in both animals and humans (Rigalli et al. 1990, 1995; Trivedi et al. 1993; de al Sota et al. 1997). In addition, diabetic individuals will often have higher than normal water intake, and consequently, will have higher than normal fluoride intake for a given concentration of fluoride in drinking water. An estimated 16-20 million people in the United States have diabetes mellitus (Brownlee et al. 2002; Buse et al. 2002; American Diabetes Association 2004; Chapter 2); therefore, any role of fluoride exposure in the development of impaired glucose metabolism or diabetes is potentially significant.
SUMMARY
The major endocrine effects of fluoride exposures reported in humans include elevated TSH with altered concentrations of T3 and T4, increased calcitonin activity, increased PTH activity, secondary hyperparathyroidism, impaired glucose tolerance, and possible effects on timing of sexual maturity; similar effects have been reported in experimental animals. These effects are summarized in Tables 8-1 and 8-2, together with the approximate intakes or physiological fluoride concentrations that have been typically associated with them thus far. Table 8-2 shows that several of the effects are associated with average or typical fluoride intakes of 0.05-0.1 mg/kg/day (0.03 with iodine deficiency), others with intakes of 0.15 mg/kg/day or higher. A comparison with Chapter 2 (Tables 2-13, 2-14, and 2-15) will show that the 0.03-0.1 mg/kg/day range will be reached by persons with average exposures at fluoride concentrations of 1-4 mg/L in drinking water, especially the children. The highest intakes (>0.1 mg/kg/d) will be reached by some individuals with high water intakes at 1 mg/L and by many or most individuals with high water intakes at 4 mg/L, as well as by young children with average exposures at 2 or 4 mg/L.
Most of the studies cited in this chapter were designed to ascertain whether certain effects occurred (or in cases of skeletal fluorosis, to see what endocrine disturbances might be associated), not to determine the lowest exposures at which they do occur or could occur. Estimates of exposure listed in these tables and in Appendix E are, in most cases, estimates of average values for groups based on assumptions about body weight and water intake. Thus, individual responses could occur at lower or higher exposures than those listed. Although the comparisons are incomplete, similar effects
TABLE 8-1 Summary of Major Observed Endocrine Effects of Fluoride in Experimental Animals, with Typical Associated Intakes and Physiological Fluoride Concentrations
|
End Point |
Fluoride Intake, mg/kg/day |
Fluoride in Serum or Plasma, mg/L |
Fluoride in Urine, mg/L |
Fluoride in Bone, ppm in ash |
Key References |
|
Altered thyroid function (altered T4 and T3 concentrations) |
3-6 (lower with iodine deficiency) |
NAa |
≥6 (possibly ≥2-3) |
≥2,400 |
Stolc and Podoba 1960; Bobek et al. 1976; Hillman et al. 1979; Guan et al. 1988; Zhao et al. 1998; Cinar and Selcuk 2005 |
|
Altered calcitonin activity |
2 |
NA |
NA |
3,200-3,500b |
Rantanen et al. 1972 |
|
Altered melatonin production; altered timing of sexual maturity |
3.7 |
NA |
NA |
2,800 |
Luke 1997 |
|
Inhibited parathyroid function |
5.4 |
NA |
NA |
NA |
Rosenquist et al. 1983 |
|
Increased serum glucose; increased severity of diabetes |
7-10.5 |
NA |
>1,000 |
Rigalli et al. 1990, 1992, 1995; Turner et al. 1997; Boros et al. 1998 |
|
|
Increased parathyroid hormone concentrations, secondary hyperparathyroidism |
9-10 |
≥0.2c |
NA |
2,700-3,200 |
Faccini and Care 1965; Chavassieux et al. 1991 |
|
aNot available. bppm. cSerum. dPlasma. |
|||||
are seen in humans at much lower fluoride intakes (or lower water fluoride concentrations) than in rats or mice, but at similar fluoride concentrations in blood and urine. This is in keeping with the different pharmacokinetic behavior of fluoride in rodents and in humans (Chapter 3) and with the variability in intake, especially for humans.
TABLE 8-2 Summary of Major Observed Endocrine Effects of Fluoride in Humans, with Typical Associated Intakes and Physiological Fluoride Concentrations
|
End Point |
Fluoride Intake, mg/kg/daya |
Fluoride in Serum or Plasma, mg/L |
Fluoride in Urine, mg/L |
Key References |
|
Altered thyroid function (altered T4 and/or T3 concentrations) |
0.05-0.1 (0.03 with iodine deficiency) |
≥0.25a |
2.4 |
Bachinskii et al. 1985; Lin et al. 1991; Yang et al. 1994; Michael et al. 1996; Susheela et al. 2005 |
|
Elevated TSH concentrations |
0.05-0.1 (0.03 with iodine deficiency) |
≥0.25a |
≥2 |
Bachinskii et al. 1985; Lin et al. 1991; Yang et al. 1994; Susheela et al. 2005 |
|
Elevated calcitonin concentrations |
0.06-0.87 |
0.11-0.26b |
2.2-18.5 mg/day |
Teotia et al. 1978 |
|
Goiter prevalence ≥ 20% |
0.07-0.13 (≥ 0.01 with iodine deficiency) |
NAc |
NA |
Day and Powell-Jackson 1972; Desai et al. 1993; Jooste et al. 1999 |
|
Impaired glucose tolerance in some individuals |
0.07-0.4 |
2-8 |
Rigalli et al. 1990, 1995; Trivedi et al. 1993; de la Sota 1997 |
|
|
Increased parathyroid hormone concentrations, secondary hyperparathyroidism, in some individuals |
0.15-0.87 |
0.14-0.45b |
3-18.5 mg/day |
Juncos and Donadio 1972; Teotia and Teotia 1973; Larsen et al. 1978; Teotia et al. 1978; Duursma et al. 1987; Dandona et al. 1988; Stamp et al. 1988, 1990; Pettifor et al. 1989; Srivastava et al. 1989; Dure-Smith et al. 1996; Gupta et al. 2001 |
|
aSerum. bPlasma. cNot available. |
||||
Thyroid Function
Fluoride exposure in humans is associated with elevated TSH concentrations, increased goiter prevalence, and altered T4 and T3 concentrations; similar effects on T4 and T3 are reported in experimental animals, but TSH has not been measured in most studies. In animals, effects on thyroid function have been reported at fluoride doses of 3-6 mg/kg/day (some effects at
0.4-0.6 mg/kg/day) when iodine intake was adequate (Table 8-1); effects on thyroid function were more severe or occurred at lower doses when iodine intake was inadequate. In humans, effects on thyroid function were associated with fluoride exposures of 0.05-0.13 mg/kg/day when iodine intake was adequate and 0.01-0.03 mg/kg/day when iodine intake was inadequate (Table 8-2).
Several sets of results are consistent with inhibition of deiodinase activity, but other mechanisms of action are also possible, and more than one might be operative in a given situation. In many cases, mean hormone concentrations for groups are within normal limits, but individuals may have clinically important situations. In particular, the inverse correlation between asymptomatic hypothyroidism in pregnant mothers and the IQ of the offspring (Klein et al. 2001) is a cause for concern. The recent decline in iodine intake in the United States (CDC 2002d; Larsen et al. 2002) could contribute to increased toxicity of fluoride for some individuals.
Thyroid Parafollicular Cell Function
Only one study has reported calcitonin concentrations in fluoride-exposed individuals. This study found elevated calcitonin in all patients with fluoride exposures above about 0.15 mg/kg/day and in one patient with a current intake of approximately 0.06 mg/kg/day (Table 8-2); these exposures corresponded to plasma fluoride concentrations of 0.11-0.26 mg/L. Results attributed to altered calcitonin activity have also been found in experimental animals at a fluoride exposure of 2 mg/kg/day (Table 8-1). It is not clear whether elevated calcitonin is a direct or indirect result of fluoride exposure, nor is it clear what the clinical significance of elevated calcitonin concentrations might be in individuals.
Parathyroid Function
In humans, depending on the calcium intake, elevated concentrations of PTH are routinely found at fluoride exposures of 0.4-0.6 mg/kg/day and at exposures as low as 0.15 mg/kg/day in some individuals (Table 8-2). Similar effects and exposures have been found in a variety of human studies; these studies indicate that elevated PTH and secondary hyperparathyroidism occur at fluoride intakes higher than those associated with other endocrine effects. In the single study that measured both calcitonin and PTH, all individuals with elevated PTH also had elevated calcitonin, and several individuals had elevated calcitonin without elevated PTH (Teotia et al. 1978). Elevated concentrations of PTH and secondary hyperparathyroidism have also been reported at fluoride intakes of 9-10 mg/kg/day (and as low as 0.45-2.3 mg/kg/day in one study) in experimental animals (Table 8-1). One
animal study found what appears to be inhibition of the normal parathyroid response to calcium deficiency at a fluoride intake of 5.4 mg/kg/day.
As with calcitonin, it is not clear whether altered parathyroid function is a direct or indirect result of fluoride exposure. An indirect effect of fluoride by causing an increased requirement for calcium is probable, but direct effects could occur as well. Also, although most individuals with skeletal fluorosis appear to have elevated PTH, it is not clear whether parathyroid function is affected before development of skeletal fluorosis or at lower concentrations of fluoride exposure than those associated with skeletal fluorosis. Recent U.S. reports of nutritional (calcium-deficiency) rickets associated with elevated PTH (DeLucia et al. 2003) suggest the possibility that fluoride exposure, together with increasingly calcium-deficient diets, could have an adverse impact on the health of some individuals.
Pineal Function
The single animal study of pineal function indicates that fluoride exposure results in altered melatonin production and altered timing of sexual maturity (Table 8-1). Whether fluoride affects pineal function in humans remains to be demonstrated. The two studies of menarcheal age in humans show the possibility of earlier menarche in some individuals exposed to fluoride, but no definitive statement can be made. Recent information on the role of the pineal organ in humans suggests that any agent that affects pineal function could affect human health in a variety of ways, including effects on sexual maturation, calcium metabolism, parathyroid function, postmenopausal osteoporosis, cancer, and psychiatric disease.
Glucose Metabolism
Increased serum glucose and increased severity of existing diabetes have been reported in animal studies at fluoride intakes of 7-10.5 mg/kg/day (Table 8-1). Impaired glucose tolerance in humans has been reported in separate studies at fluoride intakes of 0.07-0.4 mg/kg/day, corresponding to serum fluoride concentrations above about 0.1 mg/L. The primary mechanism appears to involve inhibition of insulin production.
General Considerations
The available studies of the effects of fluoride exposure on endocrine function have several limitations. In particular, many studies did not measure actual hormone concentrations, several studies did not report nutritional status (e.g., iodine or calcium intake), and, for thyroid function, other possible goitrogenic factors have not been ruled out. Most studies have too
few exposure groups, with, for example, the “high”-fluoride group in one study having lower concentrations of fluoride in drinking water than the “normal”-fluoride group in another study. In general, the human exposures are not well characterized. Nevertheless, there is consistency among the available studies in the types of effects seen in humans and animals and in the concentrations or fluoride exposures associated with the effects in humans.
For all the endocrine effects reported to occur from fluoride exposure, the variability in exposure and response among populations (or strains of an experimental animal) or within a human population requires further attention. For example, correlations between the fluoride intake or the presence or degree of fluorosis and the presence (or prevalence) or severity of other effects generally have not been examined on an individual basis, which could permit identification of individual differences in susceptibility or response. Several reports have identified subgroups within an exposed population or group, in terms of the response observed, even when group means are not statistically different.
Variability in response to fluoride exposures could be due to differences in genetic background, age, sex, nutrient intake (e.g., calcium, iodine, selenium), general dietary status, or other factors. Intake of nutrients such as calcium and iodine often is not reported in studies of fluoride effects. The effects of fluoride on thyroid function, for instance, might depend on whether iodine intake is low, adequate, or high, or whether dietary selenium is adequate. Dietary calcium affects the absorption of fluoride (Chapter 3); in addition, fluoride causes an increase in the dietary requirements for calcium, and insufficient calcium intake increases fluoride toxicity. Available information now indicates a role for aluminum in the interaction of fluoride on the second messenger system; thus, differences in aluminum exposure might explain some of the differences in response to fluoride exposures among individuals and populations.
The clinical significance of fluoride-related endocrine effects requires further attention. For example, most studies have not mentioned the clinical significance for individuals of hormone values out of the normal range, and some studies have been limited to consideration of “healthy” individuals. As discussed in the various sections of this chapter, recent work on borderline hormonal imbalances and endocrine-disrupting chemicals indicates that significant adverse health effects, or an increased risk for development of clearly adverse health outcomes, could be associated with seemingly mild imbalances or perturbations in hormone concentrations (Brucker-Davis et al. 2001). In addition, the different endocrine organs do not function entirely separately: thyroid effects (especially elevated TSH) may be associated with parathyroid effects (Stoffer et al. 1982; Paloyan Walker et al. 1997), and glucose metabolism may be affected by thyroid or parathyroid status
(e.g., McCarty and Thomas 2003; Procopio and Borretta 2003; Cettour-Rose et al. 2005). Adverse effects in individuals might occur when hormone concentrations are still in the normal ranges for a population but are low or high for that individual (Brucker-Davis et al. 2001; Belchetz and Hammond 2003). Some investigators suggest that endocrine-disrupting chemicals could be associated with nonmonotonic dose-response curves (e.g., U-shaped or inverted-U-shaped curves resulting from the superimposition of multiple dose-response curves) and that a threshold for effects cannot be assumed (Bigsby et al. 1999; Brucker-Davis et al. 2001).
In summary, evidence of several types indicates that fluoride affects normal endocrine function or response; the effects of the fluoride-induced changes vary in degree and kind in different individuals. Fluoride is therefore an endocrine disruptor in the broad sense of altering normal endocrine function or response, although probably not in the sense of mimicking a normal hormone. The mechanisms of action remain to be worked out and appear to include both direct and indirect mechanisms, for example, direct stimulation or inhibition of hormone secretion by interference with second messenger function, indirect stimulation or inhibition of hormone secretion by effects on things such as calcium balance, and inhibition of peripheral enzymes that are necessary for activation of the normal hormone.
RECOMMENDATIONS
-
Further effort is necessary to characterize the direct and indirect mechanisms of fluoride’s action on the endocrine system and the factors that determine the response, if any, in a given individual. Such studies would address the following:
-
the in vivo effects of fluoride on second messenger function
-
the in vivo effects of fluoride on various enzymes
-
the integration of the endocrine system (both internally and with other systems such as the neurological system)
-
identification of those factors, endogenous (e.g., age, sex, genetic factors, or preexisting disease) or exogenous (e.g., dietary calcium or iodine concentrations, malnutrition), associated with increased likelihood of effects of fluoride exposures in individuals
-
consideration of the impact of multiple contaminants (e.g., fluoride and perchlorate) that affect the same endocrine system or mechanism
-
examination of effects at several time points in the same individuals to identify any transient, reversible, or adaptive responses to fluoride exposure.
-
-
Better characterization of exposure to fluoride is needed in epidemiology studies investigating potential endocrine effects of fluoride. Important exposure aspects of such studies would include the following:
-
collecting data on general dietary status and dietary factors that could influence the response, such as calcium, iodine, selenium, and aluminum intakes
-
characterizing and grouping individuals by estimated (total) exposure, rather than by source of exposure, location of residence, fluoride concentration in drinking water, or other surrogates
-
reporting intakes or exposures with and without normalization for body weight (e.g., mg/day and mg/kg/day), to reduce some of the uncertainty associated with comparisons of separate studies
-
addressing uncertainties associated with exposure and response, including uncertainties in measurements of fluoride concentrations in bodily fluids and tissues and uncertainties in responses (e.g., hormone concentrations)
-
reporting data in terms of individual correlations between intake and effect, differences in subgroups, and differences in percentages of individuals showing an effect and not just differences in group or population means.
-
examining a range of exposures, with normal or control groups having very low fluoride exposures (below those associated with 1 mg/L in drinking water for humans).
-
The effects of fluoride on various aspects of endocrine function should be examined further, particularly with respect to a possible role in the development of several diseases or mental states in the United States. Major areas for investigation include the following:
-
thyroid disease (especially in light of decreasing iodine intake by the U.S. population);
-
nutritional (calcium deficiency) rickets;
-
calcium metabolism (including measurements of both calcitonin and PTH);
-
pineal function (including, but not limited to, melatonin production); and
-
development of glucose intolerance and diabetes.
-


