
2
Measures of Exposure to Fluoride in the United States
The major sources of internal exposure of individuals to fluorides are the diet (food, water, beverages) and fluoride-containing dental products (toothpaste, fluoride supplements). Internal exposure to fluorides also can occur from inhalation (cigarette smoke, industrial emissions), dermal absorption (from chemicals or pharmaceuticals), ingestion or parenteral administration of fluoride-containing drugs, and ingestion of fluoride-containing soil. Information on the pharmacokinetics of fluoride are provided in Chapter 3.
The National Research Council’s (NRC’s) 1993 review of the health effects of ingested fluoride reported estimates of average daily fluoride intake from the diet of 0.04-0.07 milligrams per kilogram (mg/kg) of body weight for young children in an area with fluoridated water (fluoride concentration in drinking water, 0.7-1.2 mg per liter [L]; NRC 1993). Dietary intake of fluoride by adults in an area with fluoridated water was variously estimated to be between 1.2 and 2.2 mg/day (0.02-0.03 mg/kg for a 70-kg adult). The fluoride intake from toothpaste or mouth rinse by children with good control of swallowing, assuming twice-a-day use, was estimated to equal the intake from food, water, and beverages. The review acknowledged that “substantially” higher intakes of fluoride from consumption of fluoridated water would result for individuals such as outdoor laborers in warm climates or people with high-urine-output disorders, but these intakes were not quantified. Similarly, children and others with poor control of swallowing could have intakes of fluoride from dental products that exceed the dietary intakes, but these intakes also were not quantified. Other factors cited as affecting individual fluoride intakes include changes in the guidelines for
fluoride supplementation and use of bottled water or home water purification systems rather than fluoridated municipal water. The NRC (1993) recommended further research to “determine and compare the intake of fluoride from all sources, including fluoride-containing dental products, in fluoridated and nonfluoridated communities.”
This chapter provides a review of the available information on fluoride exposures in the United States, including sources of fluoride exposure, intakes from various fluoride sources, and factors that could affect individual exposures to fluorides. Population subgroups with especially high exposures are discussed. The major emphasis of this chapter is on chronic exposure rather than acute exposure. The use of biomarkers as alternative approaches to estimation of actual individual exposures is also discussed.
In practice, most fluorine added to drinking water is in the form of fluosilicic acid (fluorosilicic acid, H2SiF6) or the sodium salt (sodium fluosilicate, Na2SiF6), collectively referred to as fluorosilicates (CDC 1993); for some smaller water systems, fluoride is added as sodium fluoride (NaF). Fluoride in toothpaste and other dental products is usually present as sodium fluoride (NaF), stannous fluoride (SnF2), or disodium monofluorophosphate (Na2PO3F). Fluorine-containing pesticides and pharmaceuticals also contribute to total fluorine exposures and are considered separately. Fluoride in food and drinking water usually is considered in terms of total fluorine content, assumed to be present entirely as fluoride ion (F−). Information on exposures to fluorosilicates and aluminofluorides is also included.
SOURCES OF FLUORIDE EXPOSURE
Drinking Water
General Population
The major dietary source of fluoride for most people in the United States is fluoridated municipal (community) drinking water, including water consumed directly, food and beverages prepared at home or in restaurants from municipal drinking water, and commercial beverages and processed foods originating from fluoridated municipalities. On a mean per capita basis, community (public or municipal) water constitutes 75% of the total water ingested in the United States; bottled water constitutes 13%, and other sources (e.g., wells and cisterns) constitute 10% (EPA 2000a). Municipal water sources that are not considered “fluoridated” could contain low concentrations of naturally occurring fluoride, as could bottled water and private wells, depending on the sources.
An estimated 162 million people in the United States (65.8% of the population served by public water systems) received “optimally fluori-
dated”1 water in 2000 (CDC 2002a). This represents an increase from 144 million (62.1%) in 1992. The total number of people served by public water systems in the United States is estimated to be 246 million; an estimated 35 million people obtain water from other sources such as private wells (CDC 2002a,b). The U.S. Environmental Protection Agency (EPA) limits the fluoride that can be present in public drinking-water supplies to 4 mg/L (maximum contaminant level, or MCL) to protect against crippling skeletal fluorosis, with a secondary maximum contaminant level (SMCL) of 2 mg/L to protect against objectionable enamel fluorosis (40CFR 141.62(b)[2001], 40CFR 143.3[2001]).
Of the 144 million people with fluoridated public water supplies in 1992, approximately 10 million (7%) received naturally fluoridated water, the rest had artificially fluoridated water (CDC 2002c). Of the population with artificially fluoridated water in 1992, more than two-thirds had a water fluoride concentration of 1.0 mg/L, with almost one-quarter having lower concentrations and about 5% having concentrations up to 1.2 mg/L (CDC 1993; see Appendix B).
Of the approximately 10 million people with naturally fluoridated public water supplies in 1992, approximately 67% had fluoride concentrations ≤ 1.2 mg/L (CDC 1993; see Appendix B). Approximately 14% had fluoride concentrations between 1.3 and 1.9 mg/L and another 14% had between 2.0 and 3.9 mg/L; 2% (just over 200,000 persons) had natural fluoride concentrations equal to or exceeding 4.0 mg/L.2 Water supplies that exceeded 4.0 mg/L ranged as high as 11.2 mg/L in Colorado, 12.0 mg/L in Oklahoma, 13.0 mg/L in New Mexico, and 15.9 mg/L in Idaho (see Appendix B, Table B-3).3 States with the largest populations receiving water supplies with fluoride at ≥ 4.0 mg/L included Virginia (18,726 persons, up to 6.3 mg/L), Oklahoma (18,895 persons, up to 12.0 mg/L), Texas (36,863 persons, up to 8.8 mg/L), and South Carolina (105,618 persons, up to 5.9 mg/L).
Little information is available on the fluoride content of private water sources, but the variability can reasonably be expected to be high and to
|
1 |
The term optimally fluoridated water means a fluoride level of 0.7-1.2 mg/L; water fluoride levels are based on the average maximum daily air temperature of the area (see Appendix B). |
|
2 |
More recently (2000), CDC has estimated that 850,000 people are served by public water supplies containing fluoride in excess of 2 mg/L; of these, 152,000 people receive water containing fluoride in excess of 4 mg/L (unpublished data from CDC as reported in EPA 2003a). Based on analytical data from 16 states, EPA (2003a) estimates that 1.5-3.3 million people nationally are served by public water supplies with fluoride concentrations exceeding 2 mg/L; of these 118,000-301,000 people receive water with fluoride concentrations greater than 4 mg/L. |
|
3 |
High-fluoride municipal waters are generally found in regions that have high fluoride concentrations in the groundwater or in surface waters. ATSDR (2003) has reviewed fluoride concentrations in environmental media, including groundwater and surface water. Fleischer (1962) and Fleischer et al. (1974) reported fluoride concentrations in groundwater by county for the coterminous United States. |
depend on the region of the country. Fluoride measured in well water in one study in Iowa ranged from 0.06 to 7.22 mg/L (mean, 0.45 mg/L); home-filtered well water contained 0.02-1.00 mg/L (mean, 0.32 mg/L; Van Winkle et al. 1995). Hudak (1999) determined median fluoride concentrations for 237 of 254 Texas counties (values were not determined for counties with fewer than five observations). Of the 237 counties, 84 have median groundwater fluoride concentrations exceeding 1 mg/L; of these, 25 counties exceed 2 mg/L and five exceed 4 mg/L. Residents in these areas (or similar areas in other states) who use groundwater from private wells are likely to exceed current guidelines for fluoride intake.
Duperon et al. (1995) pointed out that fluoride concentrations reported by local water suppliers can be substantially different from concentrations measured in water samples obtained in homes. Use of home water filtration or purification systems can reduce the fluoride concentration in community water by 13% to 99%, depending on the type of system (Duperon et al. 1995; Van Winkle et al. 1995; Jobson et al. 2000). Distillation or reverse osmosis can remove nearly all the fluoride. The extent of use of home water filtration or purification systems nationally is not known but obviously would affect the fluoride intake for people using such systems. Van Winkle et al. (1995) reported that 11% of their study population (in Iowa) used some type of home filtration either for well water or for public water.
Fluoride concentrations in bottled water4 are regulated by law to a maximum of 1.4-2.4 mg/L if no fluoride is added and a maximum of 0.8-1.7 mg/L if fluoride is added (the applicable value within the range depends on the annual average of maximum daily air temperatures at the location of retail sale; 21CFR 165.110[2003]). Maximum fluoride concentrations for imported bottled water are 1.4 mg/L if no fluoride is added and 0.8 mg/L if fluoride is added (21CFR 165.110[2003]). Fluoride concentrations are required on labels in the United States only if fluoride is added. Fluoride concentrations listed on labels or in chemical analyses available on the Internet for various brands range from 0 to 3.6 mg/L (Bartels et al. 2000; Johnson and DeBiase 2003; Bottled Water Web 2004); of those without added fluoride, most are below 0.6 mg/L. Most brands appear to list fluoride content only if they are specifically advertising the fact that their water is fluoridated; fluoride concentrations of these brands range from 0.5 to 0.8 mg/L (for “nursery” or “infant” water) up to 1.0 mg/L. Several reports indicate
that fluoride concentrations obtained from the manufacturer or stated on labels for bottled waters might not be accurate (Weinberger 1991; Toumba et al. 1994; Bartels et al. 2000; Lalumandier and Ayers 2000; Johnson and DeBiase 2003; Zohouri et al. 2003).
Measured fluoride concentrations in bottled water sold in the United States have varied from 0 to 1.36 mg/L (Nowak and Nowak 1989; Chan et al. 1990; Stannard et al. 1990; Van Winkle et al. 1995; Bartels et al. 2000; Lalumandier and Ayers 2000; Johnson and DeBiase 2003). Van Winkle et al. (1995) reported a mean of 0.18 mg/L for 78 commercial bottled waters in Iowa. Johnson and DeBiase (2003) more recently reported values ranging from 0 to 1.2 mg/L for 65 bottled waters purchased in West Virginia, with 57 brands having values below 0.6 mg/L. Measured fluoride concentrations in bottled waters in other countries have similar ranges: 0.05-4.8 mg/L in Canada (Weinberger 1991), 0.10-0.80 mg/L in the United Kingdom (Toumba et al. 1994), and 0.01-0.37 mg/L more recently in the United Kingdom (Zohouri et al. 2003).5 Bartels et al. (2000) found significant variation in fluoride concentrations among samples of the same brand with different bottling dates purchased in the same city. In general, distilled and purified (reverse osmosis) waters contain very low concentrations of fluoride; drinking water (often from a municipal tap) and spring water vary with their source, as do mineral waters, which can be very low or very high in fluoride. Most spring water sold in the United States probably has a low fluoride content (<0.3 mg/L). Typical fluoride concentrations in various types of drinking water in the United States are summarized in Table 2-1.
Average per capita ingestion of community or municipal water is estimated to be 927 mL/day (EPA 2000a; see Appendix B6). The estimated 90th percentile of the per capita ingestion of community water from that survey is 2.016 L/day. Estimated intakes by those actually consuming community water (excluding people with zero ingestion of community water) are higher, with a mean of 1.0 L/day and a 90th percentile of 2.069 L/day (EPA 2000a). Thus, if national estimates of water intake (see Appendix B)
|
5 |
The European Commission has set a maximum limit of 5.0 mg/L for fluoride in natural mineral waters, effective January 1, 2008 (EC 2003). In addition, natural mineral waters with a fluoride concentration exceeding 1.5 mg/L must be labeled with the words “contains more than 1.5 mg/L of fluoride: not suitable for regular consumption by infants and children under 7 years of age,” and for all natural mineral waters, the actual fluoride content is to be listed on the label. England has essentially the same requirements (TSO 2004), applicable to all bottled waters (natural mineral waters, spring water, and bottled drinking water). |
|
6 |
As described more fully in Appendix B, the values from EPA (2000a) are from a short-term survey of more than 15,000 individuals in the United States. Although these values are considered reasonable indicators both of typical water consumption and of the likely range of water consumption on a long-term basis, they should not be used by themselves to predict the number of individuals or percentage of the population that consumes a given amount of water on a long-term basis. |
TABLE 2-1 Typical Fluoride Concentrations of Major Types of Drinking Water in the United States
|
Source |
Range, mg/La |
|
Municipal water (fluoridated) |
0.7-1.2 |
|
Municipal water (naturally fluoridated) |
0.7-4.0+ |
|
Municipal water (nonfluoridated) |
<0.7 |
|
Well water |
0-7+ |
|
Bottled water from municipal source |
0-1.2 |
|
Spring water |
0-1.4 (usually <0.3) |
|
Bottled “infant” or “nursery” water |
0.5-0.8 |
|
Bottled water with added fluorideb |
0.8-1.0 |
|
Distilled or purified water |
<0.15 |
|
aSee text for relevant references. bOther than “infant” or “nursery” water. |
|
are assumed to be valid for the part of the population with fluoridated water supplies, the intake of fluoride for a person with average consumption of community water (1 L/day) in a fluoridated area ranges from 0.7 to 1.2 mg/day, depending on the area. A person with consumption of community water equivalent to the 90th percentile in that survey (2.069 L/day) would have a fluoride intake between 1.4 and 2.5 mg/day, from community water alone. Table 2-2 provides examples of fluoride intake by typical and high consumers of municipal water by age group.
The estimates of water consumption described in Appendix B are in keeping with recently published “adequate intake” values for total water consumption (including drinking water, all beverages, and moisture in food; IOM 2004; see Appendix B, Table B-10). Note that these estimates are national values; the range of values for optimal fluoridation was intended to account for expected regional differences in water consumption due to regional temperature differences (see Appendix B). A separate study based on the same data used by EPA (2000a) found no strong or consistent association between water intake and month or season (Heller et al. 1999). Another recent study of American children aged 1-10 years also found no significant relationship between water consumption and mean temperature in modern conditions (perhaps due to artificial temperature regulation) and suggested that the temperature-related guidelines for fluoride concentrations in drinking water be reevaluated (Sohn et al. 2001).
Actual intakes of fluoride from drinking water by individuals depend on their individual water intakes, the source or sources of that water, and the use of home water purification or filtration systems. As described earlier, fluoride concentrations in community water might vary from their reported concentrations; fluoride content of bottled water also varies considerably with brand or source, with packaging date for a given brand, and from
TABLE 2-2 Examples of Fluoride Intake from Consumption of Community (Municipal) Water by People Living in Fluoridated Areasa
|
|
Typical Consumersb |
High Consumersc |
||||||
|
|
Water Consumption |
Fluoride Intaked |
Water Consumption |
Fluoride Intaked |
||||
|
|
mL/day |
mL/kg/day |
mg/day |
mg/kg/day |
mL/day |
mL/kg/day |
mg/day |
mg/kg/day |
|
U.S. population (total) |
1,000 |
17 |
0.7-1.2 |
0.012-0.020 |
2,100 |
33 |
1.5-2.5 |
0.023-0.040 |
|
All infants (<1 year)e |
500 |
60 |
0.35-0.6 |
0.042-0.072 |
950 |
120 |
0.67-1.1 |
0.084-0.14 |
|
Children 1-2 years |
350 |
26 |
0.25-0.42 |
0.018-0.031 |
700 |
53 |
0.49-0.84 |
0.037-0.064 |
|
Children 3-5 years |
450 |
23 |
0.32-0.54 |
0.016-0.028 |
940 |
45 |
0.66-1.1 |
0.032-0.054 |
|
Children 6-12 years |
500 |
16 |
0.35-0.6 |
0.011-0.019 |
1,000 |
33 |
0.7-1.2 |
0.023-0.040 |
|
Youths 13-19 years |
800 |
12 |
0.56-0.96 |
0.0084-0.014 |
1,700 |
26 |
1.2-2.0 |
0.018-0.031 |
|
Adults 20-49 years |
1,100 |
16 |
0.77-1.3 |
0.011-0.019 |
2,200 |
32 |
1.5-2.6 |
0.022-0.038 |
|
Adults 50+ years |
1,200 |
17 |
0.84-1.4 |
0.012-0.020 |
2,300 |
32 |
1.6-2.8 |
0.022-0.038 |
|
Females 13-49 yearsf |
980 |
15 |
0.69-1.2 |
0.011-0.018 |
2,050 |
32 |
1.4-2.5 |
0.022-0.038 |
|
aBased on consumption data described in Appendix B for people actually consuming community (municipal) water. bBased on a typical consumption rate of community (municipal) water for the age group. cBased on a reasonably high (but not upper bound) consumption rate of community (municipal) water for the age group; some individual exposures could be higher. dBased on fluoride concentrations of 0.7-1.2 mg/L. eIncludes any infant, nursing or nonnursing, who consumes at least some community water; these infants may be fed primarily breast milk, ready-to-feed formula (to which no water is normally added), or formula prepared from concentrate (which requires addition of water). fWomen of childbearing age. |
||||||||
information (if any) given on the labels or provided by the manufacturer. Private water sources (e.g., wells and cisterns) probably are even more variable in fluoride content, with some regions of the country being especially high and others very low. A number of authors have pointed out the difficulty doctors and dentists face in ascertaining individual fluoride intakes, just from drinking water (from all sources), for the purpose of prescribing appropriate fluoride supplementation (Nowak and Nowak 1989; Chan et al. 1990; Stannard et al. 1990; Levy and Shavlick 1991; Weinberger 1991; Dillenberg et al. 1992; Jones and Berg 1992; Levy and Muchow 1992; Toumba et al. 1994; Duperon et al. 1995; Van Winkle et al. 1995; Heller et al. 1999; Bartels et al. 2000; Lalumandier and Ayers 2000; Johnson and DeBiase 2003; Zohouri et al. 2003).
High Intake Population Subgroups
EPA, in its report to Congress on sensitive subpopulations (EPA 2000b), defines sensitive subpopulations in terms of either their response (more severe response or a response to a lower dose) or their exposure (greater exposure than the general population). Hence, it is appropriate to consider those population subgroups whose water intake is likely to be substantially above the national average for the corresponding sex and age group. These subgroups include people with high activity levels (e.g., athletes, workers with physically demanding duties, military personnel); people living in very hot or dry climates, especially outdoor workers; pregnant or lactating women; and people with health conditions that affect water intake. Such health conditions include diabetes mellitus, especially if untreated or poorly controlled; disorders of water and sodium metabolism, such as diabetes insipidus; renal problems resulting in reduced clearance of fluoride; and short-term conditions requiring rapid rehydration, such as gastrointestinal upsets or food poisoning (EPA 2000a). (While the population sample described in Appendix B [Water Ingestion and Fluoride Intakes] included some of these individuals, the study did not attempt to estimate means or distributions of intake for these specific subgroups.)
As shown in Appendix B (Tables B-4 to B-9), some members of the U.S. population could have intakes from community water sources of as much as 4.5-5 L/day (as high as 80 mL/kg/day for adults). Some infants have intakes of community water exceeding 200 mL/kg/day. Heller et al. (1999), using the same data set as EPA (2000a), reported that 21 of 14,640 people (of all ages) had water intakes over 6 standard deviations from the mean (greater than 249 mL/kg/day). Whyte et al. (2005) describe an adult woman who consistently consumed 1-2 gallons (3.8-7.6 L) of fluid per day (instant tea made with well water); no specific reason for her high fluid consumption is given.
Fluid requirements of athletes, workers, and military personnel depend on the nature and intensity of the activity, the duration of the activity, and the ambient temperature and humidity. Total sweat losses for athletes in various sports can range from 200 to 300 mL/hour to 2,000 mL/hour or more (Convertino et al. 1996; Horswill 1998; Cox et al. 2002; Coyle 2004). Most recommendations on fluid consumption for athletes are concerned with matching fluid replacement to fluid losses during the training session or competition to minimize the detrimental effects of dehydration on athletic performance (Convertino et al. 1996; Horswill 1998; Coris et al. 2004; Coyle 2004). Depending on the nature of the sport or training session, the ease of providing fluid, and the comfort of the athlete with respect to content of the gastrointestinal tract, fluid intake during exercise is often only a fraction (e.g., one-half) of the volume lost, and losses of 2% of body weight or more might occur during an exercise session in spite of fluid consumption during the session (Convertino et al. 1996; Cox et al. 2002; Coris et al. 2004; Coyle 2004).
Total daily fluid consumption by athletes generally is not reported; for many athletes, it is probably on the order of 5% of body weight (50 mL/ kg/day) or more to compensate for urinary and respiratory losses as well as sweat losses. For example, Crossman (2003) described a professionally prepared diet plan for a major league baseball player that includes 26 cups (6.2 L) of water or sports drink on a workout day and 19 cups (4.5 L) on an off-day; this is in addition to 9-11 cups (2.1-2.6 L) of milk, fruit juice, and sports drink with meals and scheduled snacks (total fluid intake of 6.8-8.8 L/day, or 52-67 mL/kg/day for a 132-kg player7). While some players and teams probably use bottled or distilled water, most (especially at the amateur and interscholastic levels) probably use local tap water; also, sports drinks might be prepared (commercially or by individuals) with tap water.
The U.S. Army’s policy on fluid replacement for warm-weather training calls for 0.5-1 quart/hour (0.47-0.95 L/hour), depending on the temperature, humidity, and type of work (Kolka et al. 2003; USASMA 2003). In addition, fluid intake is not to exceed 1.5 quarts/hour (1.4 liter/hour) or 12 quarts/day (11.4 L/day). The Army’s planning factor for individual tap water consumption ranges from 1.5 gallons/day (5.7 L/day) for temperate conditions to 3.0 gallons/day (11.4 L/day) for hot conditions (U.S. Army 1983). Hourly intake can range from 0.21 to 0.65 L depending on the temperature (McNall and Schlegel 1968), and daily intake among physically active individuals can range from 6 to 11 L (U.S. Army 1983, cited by EPA 1997). Nonmilitary outdoor workers in hot or dry climates probably would have similar needs.
|
7 |
The player’s weight was obtained from the 2003 roster of the Cleveland Indians baseball team (http://cleveland.indians.mlb.com). |
Water intakes for pregnant and lactating women are listed separately in Appendix B (Tables B-4 to B-9). Total water intake for pregnant women does not differ greatly from that for all adult females (Table B-9), while total water consumption by lactating women is generally higher. For the highest consumers among lactating women, consumption rates approximate those for athletes and workers (50-70 mL/kg/day).
Diabetes mellitus and diabetes insipidus are both characterized by high water intakes and urine volumes, among other things (Beers and Berkow 1999; Eisenbarth et al. 2002; Robinson and Verbalis 2002; Belchetz and Hammond 2003). People with untreated or poorly controlled diabetes mellitus would be expected to have substantially higher fluid intakes than nondiabetic members of the population. The American Diabetes Association (2004) estimates that 18.2 million people in the United States (6.3% of the population) have diabetes mellitus and that 5.2 million of these are not aware they have the disease. Other estimates range from 16 to 20 million people in the United States, with up to 50% undiagnosed (Brownlee et al. 2002; Buse et al. 2002).
Diabetes insipidus, or polyuria, is defined as passage of large volumes of urine, in excess of about 2 L/m2/day (approximately 150 mL/kg/day at birth, 110 mL/kg/day at 2 years, and 40 mL/kg/day in older children and adults) (Baylis and Cheetham 1998; Cheetham and Baylis 2002). Diabetes insipidus includes several types of disease distinguished by cause, including both familial and acquired disorders (Baylis and Cheetham 1998; Cheetham and Baylis 2002; Robinson and Verbalis 2002). Water is considered a therapeutic agent for diabetes insipidus (Beers and Berkow 1999; Robinson and Verbalis 2002); in addition, some kinds of diabetes insipidus can be treated by addressing an underlying cause or by administering vasopressin (antidiuretic hormone) or other agents to reduce polyuria to a tolerable level. The Diabetes Insipidus Foundation (2004) estimates the number of diabetes insipidus patients in the United States at between 40,000 and 80,000.
Someone initially presenting with central or vasopressin-sensitive diabetes insipidus might ingest “enormous” quantities of fluid and may produce 3-30 L of very dilute urine per day (Beers and Berkow 1999) or up to 400 mL/kg/day (Baylis and Cheetham 1998). Most patients with central diabetes insipidus have urine volumes of 6-12 L/day (Robinson and Verbalis 2002). Patients with primary polydipsia might ingest and excrete up to 6 L of fluid per day (Beers and Berkow 1999). Pivonello et al. (1998) listed water intakes of 5.5-8.6 L/day for six adults with diabetes insipidus who did not take vasopressin and 1.4-2.5 L/day for 12 adults who used a vasopressin analogue. An estimated 20% to 40% of patients on lithium therapy have a urine volume > 2.5 L/day, and up to 12% have frank nephrogenic diabetes insipidus characterized by a urine volume > 3 L/day (Mukhopadhyay et al. 2001).
Five papers described enamel fluorosis in association with diabetes insipidus or polydipsia (Table 2-3). Two of the papers described cases of enamel fluorosis in the United States resulting from fluoride concentrations of 1, 1.7, or 2.6 mg/L in drinking water (Juncos and Donadio 1972; Greenberg et al. 1974). The two individuals drinking water with fluoride at 1.7 and 2.6 mg/L also had roentgenographic bone changes consistent with “systemic fluorosis”8 (Juncos and Donadio 1972). These patients and four other renal patients in the U.S. “in whom fluoride may have been the cause of detectable clinical and roentgenographic effects” were also reported by Johnson et al. (1979); most of the patients had urine volumes exceeding 3 L/day and drinking water with fluoride concentrations around 1.7-3 mg/L.
Moderate and severe enamel fluorosis have been reported in diabetes insipidus patients in other countries with drinking water containing fluoride at 0.5 mg/L (Klein 1975) or 1 mg/L (Seow and Thomsett 1994), and severe enamel fluorosis with skeletal fluorosis has been reported with fluoride at 3.4 mg/L (Mehta et al. 1998). Greenberg et al. (1974) recommended that children with any disorder that gives rise to polydipsia and polyuria9 be supplied a portion of their water from a nonfluoridated source.
Table 2-4 provides examples of fluoride intake by members of several population subgroups characterized by above-average water consumption (athletes and workers, patients with diabetes mellitus or diabetes insipidus). It should be recognized that, for some groups of people with high water intakes (e.g., those with a disease condition or those playing indoor sports such as basketball or hockey), there probably will be little correlation of water intake with outdoor temperature—such individuals in northern states would consume approximately the same amounts of water as their counterparts in southern states. However, fluoridation still varies from state to state (Appendix B), so that some individuals could consume up to 1.7 times as much as others for the same water intake (1.2 versus 0.7 mg/L).
Background Food
Measured fluoride in samples of human breast milk is very low. Dabeka et al. (1986) found detectable concentrations in only 92 of 210 samples (44%) obtained in Canada, with fluoride ranging from <0.004 to 0.097 mg/L. The mean concentration in milk from mothers in fluoridated
|
8 |
These two individuals also had impaired renal function, which could have increased their retention of fluoride (see Chapter 3). |
|
9 |
Greenberg et al. (1974) listed “central diabetes insipidus, psychogenic water ingestion, renal medullary disease, including hypercalemic nephropathy, hypokalemic nephropathy and anatomic and vascular disturbances and those diseases causing solute diuresis” as disorders associated with “excessive” consumption of water and therefore the possibility of “fluoride toxicity in a community with acceptable fluoride concentration.” |
TABLE 2-3 Case Reports of Fluorosis in Association with Diabetes Insipidus or Polydipsia
|
Study Subjects |
Exposure Conditions |
Comments |
Reference |
|
(a) 18-year-old boy, 57.4 kg (b) 17-year-old girl, 45.65 kg (United States) |
(a) “high” intake of well water containing fluoride at 2.6 mg/L since early childhood; current intake, 7.6 L/day (0.34 mg/kg/day) (b) “high” intake of water containing fluoride at 1.7 mg/L since infancy; current intake, 4 L/day (0.15 mg/kg/day) |
Enamel fluorosis and roentgenographic bone changes consistent with “systemic fluorosis,” attributed to the combination of renal insufficiency and polydipsia (the latter resulting from the renal disease); reported by the Mayo Clinic |
Juncos and Donadio 1972 |
|
2 boys (ages 10 and 11) with familial nephrogenic diabetes insipidus (United States) |
Fluoridated communities in the U.S. (1 mg/L); one child since birth, one since age 4; fluid intake ranged from 2.6 to 6 times normal daily intake for age (approximately 1.25-3 L/day at time of study) |
Enamel fluorosis; fluoride concentrations in deciduous teeth (enamel layer 50-100 µm from surface) 3-6 times those in controls (normal boys aged 10-14 residing in an area with fluoride at 1 mg/L) |
Greenberg et al. 1974 |
|
Mother and four children with familial pituitary diabetes insipidus (Israel) |
Water had “lower than accepted” fluoride content (0.5 mg/L); water consumption by mother and two teenage daughters (none used vasopressin) was 10-15 L/day each; two younger children treated for diabetes insipidus from ages 3 and 5 |
Enamel fluorosis in all four children: severe in the older two who were not treated for diabetes insipidus, milder in the two younger children who were treated for diabetes insipidus. Mother also had diabetes insipidus and fluorosis; she had grown up in Kurdistan with an unknown water fluoride content |
Klein 1975 |
|
Six cases of familial pituitary diabetes insipidus (Australia) |
Children had average water intake of 8-10 L/day; two of the children lived in fluoridated areas (1 mg/L) |
Moderate (one child) or severe (one child) enamel fluorosis in the two children who lived in fluoridated areas |
Seow and Thomsett 1994 |
|
Two brothers with pituitary diabetes insipidus (ages 17 and 7) (India) |
Well water with fluoride at 3.4 mg/L |
Severe enamel fluorosis, skeletal deformities, and radiological evidence of skeletal fluorosis |
Mehta et al. 1998 |
TABLE 2-4 Examples of Fluoride Intake from Drinking Water by Members of Selected Population Subgroups Living in Fluoridated Areasa
|
|
Typical Consumersb |
High Consumersc |
||||||
|
|
Water Consumption |
Fluoride Intaked |
Water Consumption |
Fluoride Intaked |
||||
|
Population Subgroup (Weight) |
mL/day |
mL/kg/day |
mg/day |
mg/kg/day |
mL/day |
mL/kg/day |
mg/day |
mg/kg/day |
|
Athletes, workers, military (50 kg) |
2,500 |
50 |
1.8-3.0 |
0.035-0.06 |
3,500 |
70 |
2.5-4.2 |
0.049-0.084 |
|
Athletes, workers, military (70 kg) |
3,500 |
50 |
2.5-4.2 |
0.035-0.06 |
4,900 |
70 |
3.4-5.9 |
0.049-0.084 |
|
Athletes, workers, military (100 kg) |
5,000 |
50 |
3.5-6.0 |
0.035-0.06 |
7,000 |
70 |
4.9-8.4 |
0.049-0.084 |
|
Athletes and workers (120 kg) |
6,000 |
50 |
4.2-7.2 |
0.035-0.06 |
8,400 |
70 |
5.9-10 |
0.049-0.084 |
|
DM patients (20 kg) |
1,000 |
50 |
0.7-1.2 |
0.035-0.06 |
2,000 |
100 |
1.4-2.4 |
0.07-0.12 |
|
DM patients (70 kg) |
3,500 |
50 |
2.5-4.2 |
0.035-0.06 |
4,900 |
70 |
3.4-5.9 |
0.049-0.084 |
|
NDI patients (20 kg) |
1,000 |
50 |
0.7-1.2 |
0.035-0.06 |
3,000 |
150 |
2.1-3.6 |
0.11-0.18 |
|
NDI patients (70 kg) |
3,500 |
50 |
2.5-4.2 |
0.035-0.06 |
10,500 |
150 |
7.4-13 |
0.11-0.18 |
|
aAssumes all drinking water is from fluoridated community (municipal) sources. bBased on a typical consumption rate for the population subgroup. cBased on a reasonably high (but not upper bound) consumption rate for the population subgroup; some individual exposures could be higher. dBased on fluoride concentrations of 0.7-1.2 mg/L. ABBREVIATIONS: DM, diabetes mellitus; NDI, nephrogenic diabetes insipidus. |
||||||||
communities (1 mg/L in the water) was 0.0098 mg/L; in nonfluoridated communities, the mean was 0.0044 mg/L). Fluoride concentrations were correlated with the presence of fluoride in the mother’s drinking water. Spak et al. (1983) reported mean fluoride concentrations in colostrum of 0.0053 mg/L (0.28 µM/L) in an area in Sweden with fluoride at 0.2 mg/L in drinking water and 0.0068 mg/L (0.36 µM/L) in an area with fluoride at 1.0 mg/L in the drinking water; in the fluoridated area, the mean fluoride concentration in mature milk was 0.007 mg/L (0.37 µM/L). No statistically significant difference in milk fluoride concentration between the two areas was found.
Hossny et al. (2003) reported fluoride concentrations in breast milk of 60 mothers in Cairo, Egypt, ranging from 0.002 to 0.01 mg/L [0.1-0.6 µM/L; median, 0.0032 mg/L (0.17 µM/L); mean, 0.0046 mg/L (0.24 µM/L)]. Cairo is considered nonfluoridated, with a reported water fluoride concentration of 0.3 mg/L (Hossny et al. 2003). Opinya et al. (1991) found higher fluoride concentrations in mothers’ milk (mean, 0.033 mg/L; range, 0.011-0.073 mg/L), but her study population was made up of mothers in Kenya with an average daily fluoride intake of 22.1 mg. However, even at very high fluoride intakes by mothers, breast milk still contains very low concentrations of fluoride compared with other dietary fluoride sources. No significant correlation was established between the fluoride in milk and the intake of fluoride in the Kenyan study (Opinya et al. 1991).
Cows’ milk likewise contains very low fluoride concentrations, compared with other dietary sources such as drinking water. Dairy milk samples measured in Houston contained fluoride at 0.007 to 0.068 mg/L (average, 0.03 mg/L) (Liu et al. 1995). Milk samples in 11 Canadian cities contained 0.007-0.086 mg/L (average, 0.041 mg/L) (Dabeka and McKenzie 1987). A sample of soy milk contained much more fluoride than a sample of dairy milk, with a measured concentration of 0.491 mg/L (Liu et al. 1995).
Infant formulas vary in fluoride content, depending on the type of formula and the water with which it is prepared. Dabeka and McKenzie (1987) reported mean fluoride concentrations in ready-to-use formulas of 0.23 mg/L for formulas manufactured in the United States and 0.90 mg/L for formulas manufactured in Canada. Van Winkle et al. (1995) analyzed 64 infant formulas, 47 milk-based and 17 soy-based. For milk-based formulas, mean fluoride concentrations were 0.17 mg/L for ready-to-feed, 0.12 mg/L for liquid concentrates reconstituted with distilled water, and 0.14 mg/L for powdered concentrates reconstituted with distilled water. Mean fluoride concentrations for soy-based formulas were 0.30, 0.24, and 0.24 mg/L for ready-to-feed, liquid concentrates, and powdered concentrates, respectively (the latter two were reconstituted with distilled water). Obviously, the fluoride concentration in home-prepared formula depends on the fluoride concentrations in both the formula concentrate and the home
drinking water. Fomon et al. (2000) have recommended using low-fluoride water to dilute infant formulas.
Heilman et al. (1997) found 0.01 to 8.38 µg of fluoride per g of prepared infant foods. The highest concentrations were found in chicken (1.05-8.38 µg/g); other meats varied from 0.01 µg/g (veal) to 0.66 µg/g (turkey). Other foods—fruits, desserts, vegetables, mixed foods, and cereals—ranged from 0.01 to 0.63 µg/g. The fluoride concentrations in most foods are attributable primarily to the water used in processing (Heilman et al. 1997); fluoride in chicken is due to processing methods (mechanical deboning) that leave skin and residual bone particles in the meat (Heilman et al. 1997; Fein and Cerklewski 2001). An infant consuming 2 oz (about 60 g) of chicken daily at 8 µg of fluoride per g would have an intake of about 0.48 mg (Heilman et al. 1997).
Tea can contain considerable amounts of fluoride, depending on the type of tea and its source. Tea plants take up fluoride from soil along with aluminum (Shu et al. 2003; Wong et al. 2003). Leaf tea, including black tea and green tea, is made from the buds and young leaves of the tea plant, the black tea with a fermentation process, and the green tea without. Oolong tea is intermediate between black and green tea. Brick tea, considered a low-quality tea, is made from old (mature) leaves and sometimes branches and fruits of the tea plant (Shu et al. 2003; Wong et al. 2003). Fluoride accumulates mostly in the leaves of the tea plant, especially the mature or fallen leaves. Measured fluoride concentrations in tea leaves range from 170 to 878 mg/kg in different types of tea, with brick tea generally having 2-4 times as much fluoride as leaf tea (Wong et al. 2003). Commercial tea brands in Sichuan Province of China ranged from 49 to 105 mg/kg dry weight for green teas and 590 to 708 mg/kg dry weight for brick teas (Shu et al. 2003). Infusions of Chinese leaf tea (15 kinds) made with distilled water have been shown to have fluoride at 0.6-1.9 mg/L (Wong et al. 2003). Brick teas, which are not common in the United States, contain 4.8-7.3 mg/L; consumption of brick teas has been associated with fluorosis in some countries (Wong et al. 2003).
Chan and Koh (1996) measured fluoride contents of 0.34-3.71 mg/L (mean, 1.50 mg/L) in caffeinated tea infusions (made with distilled, deionized water), 1.01-5.20 mg/L (mean, 3.19 mg/L) in decaffeinated tea infusions, and 0.02-0.15 mg/L (mean, 0.05 mg/L) in herbal tea infusions, based on 44 brands of tea available in the United States (Houston area). Whyte et al. (2005) reported fluoride concentrations of 1.0-6.5 mg/L in commercial teas (caffeinated and decaffeinated) obtained in St. Louis (prepared with distilled water according to label directions). Warren et al. (1996) found fluoride contents of 0.10-0.58 mg/L in various kinds and brands of coffee sold in the United States (Houston area), with a slightly lower mean for decaffeinated (0.14 mg/L) than for caffeinated (0.17 mg/L) coffee. Instant
coffee had a mean fluoride content of 0.30 mg/L (all coffees tested were prepared with deionized distilled water). Fluoride concentrations of 0.03 mg/L (fruit tea) to 3.35 mg/L (black tea) were reported for iced-tea products sold in Germany primarily by international companies (Behrendt et al. 2002).
In practice, fluoride content in tea or coffee as consumed will be higher if the beverage is made with fluoridated water; however, for the present purposes, the contribution from water for beverages prepared at home is included in the estimated intakes from drinking water, discussed earlier. Those estimates did not include commercially available beverages such as fruit juices (not including water used to reconstitute frozen juices), juice-flavored drinks, iced-tea beverages, carbonated soft drinks, and alcoholic beverages. Kiritsy et al. (1996) reported fluoride concentrations in juices and juice-flavored drinks of 0.02-2.8 mg/L (mean, 0.56 mg/L) for 532 different drinks (including five teas) purchased in Iowa City (although many drinks represented national or international distribution); frozen-concentrated beverages were reconstituted with distilled water before analysis. White grape juices had the highest mean fluoride concentration (1.45 mg/L); upper limits on most kinds of juices exceeded 1.50 mg/L. Stannard et al. (1991) previously reported fluoride concentrations from 0.15 to 6.80 mg/L in a variety of juices originating from a number of locations in the United States. The variability in fluoride concentrations is due primarily to variability in fluoride concentrations in the water used in manufacturing the product (Kiritsy et al. 1996). The high fluoride content of grape juices (and grapes, raisins, and wines), even when little or no manufacturing water is involved, is thought to be due to a pesticide (cryolite) used in grape growing (Stannard et al. 1991; Kiritsy et al. 1996; Burgstahler and Robinson 1997).
Heilman et al. (1999) found fluoride concentrations from 0.02 to 1.28 mg/L (mean, 0.72 mg/L) in 332 carbonated beverages from 17 production sites, all purchased in Iowa. In general, these concentrations reflect that of the water used in manufacturing. Estimated mean intakes from the analyzed beverages were 0.36 mg/day for 2- to 3-year-old children and 0.60 mg/day for 7- to 10-year-olds (Heilman et al. 1999). Pang et al. (1992) estimated mean daily fluoride intakes from beverages (excluding milk and water) for children of 0.36, 0.54, and 0.60 mg, for ages 2-3, 4-6, and 7-10, respectively; daily total fluid intake ranged from 970 to 1,240 mL, and daily beverage consumption ranged from 585 to 756 mL.
Burgstahler and Robinson (1997) reported fluoride contents of 0.23-2.80 mg/L in California wines, with 7 of 19 samples testing above 1 mg/L; the fluoride in wine and in California grapes (0.83-5.20 mg/kg; mean, 2.71 mg/kg) was attributed to the use of cryolite (Na3AlF6) as a pesticide in the vineyards. Martínez et al. (1998) reported fluoride concentrations from 0.03 to 0.68 mg/L in wines from the Canary Islands; most fluoride concentrations in the wines were in the range of 0.10-0.35 mg/L. A maximum legal thresh-
old of 1 mg/L for the fluoride concentration in wine has been established by the Office International de la Vigne et du Vin (OIV 1990; cited by Martínez et al. 1998). Warnakulasuriya et al. (2002) reported mean fluoride concentrations of 0.08-0.71 mg/L in beers available in Great Britain; one Irish beer contained fluoride at 1.12 mg/L. Examples of fluoride intakes that could be expected in heavy drinkers (8-12 drinks per day) are given in Table 2-5.
R.D. Jackson et al. (2002) reported mean fluoride contents from 0.12 µg/g (fruits) to 0.49 µg/g (grain products) in a variety of noncooked, nonreconstituted foods (excluding foods prepared with water). Fluoride contents in commercial beverages (excluding reconstituted and fountain beverages) averaged 0.55 µg/g; those in milk and milk products averaged 0.31 µg/g. In the same study, fluoride contents in water, reconstituted beverages, and cooked vegetables and grain products (cereals, pastas, soups) differed significantly between two towns in Indiana, one with a water fluoride content of 0.2 mg/L and one with an optimally fluoridated water supply (1.0 mg/L). Bottled fruit drinks, water, and carbonated beverages purchased in the two towns did not differ significantly. The mean daily fluoride ingestion for children 3-5 years old from food and beverages (including those prepared with community water) was estimated to be 0.454 mg in the low-fluoride town and 0.536 mg in the fluoridated town.
Dabeka and McKenzie (1995) reported mean fluoride contents in various food categories in Winnipeg, ranging up to 2.1 µg/g for fish, 0.61 µg/g for soup, and 1.15 µg/g for beverages; the highest single items were cooked veal (1.2 µg/g), canned fish (4.6 µg/g), shellfish (3.4 µg/g), cooked wheat cereal (1.0 µg/g), and tea (5.0 µg/g). Estimated dietary intakes (including fluoridated tap water) varied from 0.35 mg/day for children aged 1-4 to 3.0 mg/day for 40- to 64-year-old males. Over all ages and both sexes, the esti-
TABLE 2-5 Examples of Fluoride Intakes by Heavy Drinkers from Alcoholic Beverages Alone
|
|
Fluoride Concentration, mg/L |
Fluoride Intake, mg/day |
|
|
Beverage |
8 drinks per day |
12 drinks per day |
|
|
Beer (12-oz. cans or bottles) |
0.5 1.0 |
1.4 2.8 |
2.1 4.3 |
|
Wine (5-oz. glasses) |
0.3 1.0 |
0.35 1.2 |
0.53 1.8 |
|
Mixed drinks (1.5 oz. liquor + 6.5 oz. mixer and ice) |
0.7a 1.0a |
1.1 1.5 |
1.6 2.3 |
|
aIn carbonated soda and ice. |
|||
mated average dietary intake of fluoride was 1.76 mg/day; the food category contributing most to the estimated intake was beverages (80%).
Rojas-Sanchez et al. (1999) estimated fluoride intakes for children (aged 16-40 months) in three communities in Indiana, including a low-fluoride community, a “halo” community (not fluoridated, but in the distribution area of a fluoridated community), and a fluoridated community. For fluoride in food, the mean intakes were 0.116-0.146 mg/day, with no significant difference between communities. Intake from beverages was estimated to be 0.103, 0.257, and 0.396 mg/day for the low-, halo, and high-fluoride communities; differences between the towns were statistically significant.
Apart from drinking water (direct and indirect consumption, as described earlier), the most important foods in terms of potential contribution to individual fluoride exposures are infant formula, commercial beverages such as juice and soft drinks, grapes and grape products, teas, and processed chicken (Table 2-6). Grapes and grape products, teas, and processed chicken can be high in fluoride apart from any contribution from preparation or process water. Commercial beverages and infant formulas, however, greatly depend on the fluoride content of the water used in their preparation or manufacture (apart from water used in their in-home preparation); due to widespread distribution, such items could have similar fluoride concentrations in most communities, on average.
TABLE 2-6 Summary of Typical Fluoride Concentrations of Selected Food and Beverages in the United States
|
Source |
Range, mg/L |
Range, mg/kg |
|
Human breast milk |
|
|
|
Fluoridated area (1 mg/L) |
0.007-0.01 |
— |
|
Nonfluoridated area |
0.004 |
— |
|
Cow’s milk |
≤0.07 |
— |
|
Soy milk |
0.5 |
— |
|
Milk-based infant formulaa |
≤0.2 |
— |
|
Soy-based infant formulaa |
0.2-0.3 |
— |
|
Infant food—chicken |
— |
1-8 |
|
Infant food—other |
— |
0.01-0.7 |
|
Teaa |
0.3-5 |
— |
|
Herbal teaa |
0.02-0.15 |
— |
|
Coffeea |
0.1-0.6 |
— |
|
Grape juicea |
≤3 |
— |
|
Other juices and juice drinksa |
≤1.5 |
— |
|
Grapes |
— |
0.8-5 |
|
Carbonated beverages |
0.02-1.3 |
— |
|
Wine |
0.2-3 |
— |
|
Beer |
0.08-1 |
— |
|
aNot including contribution from local tap water. |
||
Because of the wide variability in fluoride content in items such as tea, commercial beverages and juices, infant formula, and processed chicken, and the possibility of a substantial contribution to an individual’s total fluoride intake, a number of authors have suggested that such fluoride sources be considered in evaluating an individual’s need for fluoride supplementation (Clovis and Hargreaves 1988; Stannard et al. 1991; Chan and Koh 1996; Kiritsy et al. 1996; Warren et al. 1996; Heilman et al. 1997, 1999; Levy and Guha-Chowdhury 1999), especially for individuals who regularly consume large amounts of a single product (Stannard et al. 1991; Kiritsy et al. 1996). Several authors also point out the difficulty in evaluating individual fluoride intake, given the wide variability of fluoride content among similar items (depending on point of origin, etc.), the wide distribution of many products, and the lack of label or package information about fluoride content for most products (Stannard et al. 1991; Chan and Koh 1996; Behrendt et al. 2002).
Dental Products and Supplements
Fluoridated dental products include dentifrices (toothpastes, powders, liquids, and other preparations for cleaning teeth) for home use and various gels and other topical applications for use in dental offices. More than 90% of children ages 2-16 years surveyed in 1983 or 1986 used fluoride toothpaste (Wagener et al. 1992). Of these children, as many as 15% to 20% in some age groups also used fluoride supplements or mouth rinses (Wagener et al. 1992). Using the same 1986 survey data, Nourjah et al. (1994) reported that most children younger than 2 years of age used fluoride dentifrices.
Most toothpaste sold in the United States contains fluoride (Newbrun 1992), usually 1,000-1,100 parts per million (ppm) (0.1-0.11%).10 The amount of fluoride actually swallowed by an individual depends on the amount of toothpaste used, the swallowing control of the person (especially for young children), and the frequency of toothpaste use. Ophaug et al. (1980, 1985) estimated the intake of fluoride by small children (2-4 years) to be 0.125-0.3 mg per brushing; a 2-year-old child brushing twice daily would ingest nearly as much fluoride from the toothpaste as from food and fluoridated drinking water combined (Ophaug et al. 1985). Levy and Zarei-M (1991) reported estimates of 0.12-0.38 mg of fluoride ingested per brushing. Burt (1992) and Newbrun (1992) reported estimates of 0.27
mg/day for a preschool child brushing twice daily with standard-strength (1,000 ppm) toothpaste.
Levy (1993, 1994) and Levy et al. (1995a) reviewed a number of studies of the amount of toothpaste people of various ages ingest. Amounts of toothpaste used per brushing range from 0.2 to 5 g, with means around 0.4-2 g, depending on the age of the person. The estimated mean percentage of toothpaste ingested ranges from 3% in adults to 65% in 2-year-olds. Children who did not rinse after toothbrushing ingested 75% more toothpaste than those who rinsed. Perhaps 20% of children have fluoride intakes from toothpaste several times greater than the mean values, and some children probably get more than the recommended amount of fluoride from toothpaste alone, apart from food and beverages (Levy 1993, 1994). Mean intakes of toothpaste by adults were measured at 0.04 g per brushing (0.04 mg of fluoride per brushing for toothpaste with 0.1% fluoride), with the 90th percentile at 0.12 g of toothpaste (0.12 mg of fluoride) per brushing (Barnhart et al. 1974).
Lewis and Limeback (1996) estimated the daily intake of fluoride from dentifrice (products for home use) to be 0.02-0.06, 0.008-0.02, 0.0025, and 0.001 mg/kg, for ages 7 months to 4 years, 5-11 years, 12-19 years, and 20+ years, respectively. Rojas-Sanchez et al. (1999) estimated fluoride intake from dentifrice at between 0.42 and 0.58 mg/day in children aged 16-40 months in three communities in Indiana. Children tend to use more toothpaste when provided special “children’s” toothpaste than when given adult toothpaste (Levy et al. 1992; Adair et al. 1997), and many children do not rinse or spit after brushing (Naccache et al. 1992; Adair et al. 1997).
Estimates of typical fluoride ingestion from toothpaste are given by age group in Table 2-7; these estimates are for typical rather than high or upper-bound intakes, and many individuals could have substantially higher intakes. A number of papers have suggested approaches to decreasing children’s intake of fluoride from toothpaste, including decreasing the fluoride content in
TABLE 2-7 Estimated Typical Fluoride Intakes from Toothpastea
|
Age Group, years |
Fluoride Intake, mg/day |
Age Group, years |
Fluoride Intake, mg/day |
|
Infants < 0.5b |
0 |
Youth 13-19 |
0.2 |
|
Infants 0.5-1 |
0.1 |
Adults 20-49 |
0.1 |
|
Children 1-2 |
0.15 |
Adults 50+ |
0.1 |
|
Children 3-5 |
0.25 |
Females 13-49c |
0.1 |
|
Children 6-12 |
0.3 |
|
|
|
aBased on information reviewed by Levy et al. (1995a). Estimates assume two brushings per day with fluoride toothpaste (0.1% fluoride) and moderate rinsing. bAssumes no brushing before 6 months of age. cWomen of childbearing age. |
|||
children’s toothpaste, discouraging the use of fluoride toothpaste by children less than 2 years old, avoiding flavored children’s toothpastes, encouraging the use of very small amounts of toothpaste, encouraging rinsing and expectorating (rather than swallowing) after brushing, and recommending careful parental supervision (e.g., Szpunar and Burt 1990; Levy and Zarei-M 1991; Simard et al. 1991; Burt 1992; Levy et al. 1992, 1993, 1997, 2000; Naccache et al. 1992; Newbrun 1992; Levy 1993, 1994; Bentley et al. 1999; Rojas-Sanchez et al. 1999; Warren and Levy 1999; Fomon et al. 2000).
Topical applications of fluoride in a professional setting can lead to ingestion of 1.3-31.2 mg (Levy and Zarei-M 1991). Substantial ingestion of fluoride also has been demonstrated from the use of fluoride mouth rinse and self-applied topical fluoride gel (Levy and Zarei-M 1991). Heath et al. (2001) reported that 0.3-6.1 mg of fluoride (5-29% of total applied) was ingested by young adults who used gels containing 0.62-62.5 mg of fluoride.
Levy et al. (2003a) found that two-thirds of children had at least one fluoride treatment by age 6 and that children with dental caries were more likely to have had such a treatment. Their explanation is that professional application of topical fluoride is used mostly for children with moderate to high risk for caries. In contrast, Eklund et al. (2000), in a survey of insurance claims for more than 15,000 Michigan children treated by 1,556 different dentists, found no association between the frequency of use of topical fluoride (professionally applied) and restorative care. Although these were largely low-risk children, for whom routine use of professionally applied fluoride is not recommended, two-thirds received topical fluoride at nearly every office visit. The authors recommended that the effectiveness of professionally applied topical fluoride products in modern clinical practice be evaluated.
Exposures from topical fluorides during professional treatment are unlikely to be significant contributors to chronic fluoride exposures because they are used only a few times per year. However, they could be important with respect to short-term or peak exposures.
Heath et al. (2001) found that retention of fluoride ion in saliva after the use of dentifrice (toothpaste, mouthrinse, or gel) was proportional to the quantity used, at least for young adults. They were concerned with maximizing the retention in saliva to maximize the topical benefit of the fluoride. Sjögren and Melin (2001) were also concerned about enhancing the retention of fluoride in saliva and recommend minimal rinsing after toothbrushing. However, fluoride in saliva eventually will be ingested, so enhancing the retention of fluoride in saliva after dentifrice use also enhances the ingestion of fluoride from the dentifrice.
Fluoride supplements (NaF tablets, drops, lozenges, and rinses) are intended for prescriptions for children in low-fluoride areas; dosages generally range from 0.25 to 1.0 mg of fluoride/day (Levy 1994; Warren and Levy
1999). Appropriate dosages should be based on age, risk factors (e.g., high risk for caries), and ingestion of fluoride from other sources (Dillenberg et al. 1992; Jones and Berg 1992; Levy and Muchow 1992; Levy 1994; Warren and Levy 1999). Although compliance is often considered to be a problem, inappropriate use of fluoride supplements has also been identified as a risk factor for enamel fluorosis (Dillenberg et al. 1992; Levy and Muchow 1992; Levy 1994; Pendrys and Morse 1995; Warren and Levy 1999).
The dietary fluoride supplement schedule in the United States, as revised in 1994 by the American Dental Association, now calls for no supplements for children less than 6 months old and none for any child whose water contains at least 0.6 mg/L (Record et al. 2000; ADA 2005; Table 2-8). Further changes in recommendations for fluoride supplements have been suggested (Fomon and Ekstrand 1999; Newbrun 1999; Fomon et al. 2000), including dosages based on individual body weight rather than age (Adair 1999) and the use of lozenges to be sucked rather than tablets to be swallowed (Newbrun 1999), although others disagree (Moss 1999). The Canadian recommendations for fluoride supplementation include an algorithm for determining the appropriateness for a given child and then a schedule of doses; no supplementation is recommended for children whose water contains at least 0.3 mg/L or who are less than 6 months old (Limeback et al. 1998; Limeback 1999b).
Fluoride in Air
Fluoride (either as hydrogen fluoride, particulate fluorides, or fluorine gas) is released to the atmosphere by natural sources such as volcanoes11 and by a number of anthropogenic sources. In North America, anthropogenic sources of airborne fluoride include coal combustion by electrical utilities and other entities, aluminum production plants, phosphate fertilizer plants, chemical production facilities, steel mills, magnesium plants, and manufacturers of brick and structural clay (reviewed by ATSDR 2003). Estimated airborne releases of hydrogen fluoride in the United States in 2001 were 67.4 million pounds (30.6 million kg; TRI 2003), of which at least 80% was attributed to electrical utilities (ATSDR 2003). Airborne releases of fluorine gas totaled about 9,000 pounds or 4,100 kg (TRI 2003). Anthropogenic hydrogen fluoride emissions in Canada in the mid-1990s were estimated at 5,400 metric tons (5.4 million kg or 11.9 million pounds), of which 75% was attributed to primary aluminum producers (CEPA 1996).
TABLE 2-8 Dietary Fluoride Supplement Schedule of 1994
|
|
Fluoride Concentration in Drinking Water, mg/L |
||
|
Age |
< 0.3 |
0.3-0.6 |
> 0.6 |
|
Birth to 6 months |
None |
None |
None |
|
6 months to 3 years |
0.25 mg/day |
None |
None |
|
3-6 years |
0.50 mg/day |
0.25 mg/day |
None |
|
6-16 years |
1.0 mg/day |
0.50 mg/day |
None |
|
SOURCE: ADA 2005. Reprinted with permission; copyright 2005, American Dental Association. |
|||
Measured fluoride concentrations in air in the United States and Canada typically range from 0.01 to 1.65 µg/m3, with most of it (75%) present as hydrogen fluoride (CEPA 1996). The highest concentrations (>1 µg/m3) correspond to urban locations or areas in the vicinity of industrial operations. Historically, concentrations ranging from 2.5 to 14,000 µg/m3 have been reported near industrial operations in various countries (reviewed by EPA 1988). Ernst et al. (1986) reported an average concentration of airborne fluoride of about 600 µg/m3 during the 1981 growing season in a rural inhabited area (Cornwall Island) on the U.S.-Canadian border directly downwind from an aluminum smelter. Hydrogen fluoride is listed as a hazardous air pollutant in the Clean Air Act Amendments of 1990 (reviewed by ATSDR 2003), and as such, its emissions are subject to control based on “maximum achievable control technology” emission standards. Such standards are already in effect for fluoride emissions from primary and secondary aluminum production, phosphoric acid manufacture and phosphate fertilizer production, and hydrogen fluoride production (ATSDR 2003).
For most individuals in the United States, exposure to airborne fluoride is expected to be low compared with ingested fluoride (EPA 1988); exceptions include people in heavily industrialized areas or having occupational exposure. Assuming inhalation rates of 10 m3/day for children and 20 m3/day for adults, fluoride exposures from inhalation in rural areas (<0.2 µg/m3 fluoride) would be less than 2 µg/day (0.0001-0.0002 mg/kg/day) for a child and 4 µg/day (0.00006 mg/kg/day) for an adult. In urban areas (<2 µg/m3), fluoride exposures would be less than 20 µg/day (0.0001-0.002 mg/kg/day) for a child and 40 µg/day (0.0006 mg/kg/day) for an adult. Lewis and Limeback (1996) used an estimate of 0.01 µg/kg/day (0.00001 mg/kg/day) for inhaled fluoride for Canadians; this would equal 0.1 µg/day for a 10-kg child or 0.7 µg/day for a 70-kg adult.
Occupational exposure at the Occupational Safety and Health Administration (OSHA) exposure limit of 2.5 mg/m3 would result in a fluoride intake of 16.8 mg/day for an 8-hour working day (0.24 mg/kg/day for a
70-kg person) (ATSDR 2003). Heavy cigarette smoking could contribute as much as 0.8 mg of fluoride per day to an individual (0.01 mg/kg/day for a 70-kg person) (EPA 1988).
Fluoride in Soil
Fluoride in soil could be a source of inadvertent ingestion exposure, primarily for children. Typical fluoride concentrations in soil in the United States range from very low (<10 ppm) to as high as 3% to 7% in areas with high concentrations of fluorine-containing minerals (reviewed by ATSDR 2003). Mean or typical concentrations in the United States are on the order of 300-430 ppm. Soil fluoride content may be higher in some areas due to use of fluoride-containing phosphate fertilizers or to deposition of airborne fluoride released from industrial operations.
Estimated values for inadvertent soil ingestion by children (excluding those with pica) are 100 mg/day (mean) and 400 mg/day (upper bound) (EPA 1997); the estimated mean value for soil ingestion by adults is 50 mg/ day (EPA (1997). For a typical fluoride concentration in soil of 400 ppm, therefore, estimated intakes of fluoride by children would be 0.04 (mean) to 0.16 mg/day (upper bound) and by adults, 0.02 mg/day. For a 20-kg child, the mass-normalized intake would be 0.002-0.008 mg/kg/day; for a 70-kg adult, the corresponding value would be 0.0003 mg/kg/day. Erdal and Buchanan (2005) estimated intakes of 0.0025 and 0.01 mg/kg/day for children (3-5 years), for mean and reasonable maximum exposures, respectively, based on a fluoride concentration in soil of 430 ppm. In their estimates, fluoride intake from soil was 5-9 times lower than that from fluoridated drinking water.
For children with pica (a condition characterized by consumption of nonfood items such as dirt or clay), an estimated value for soil ingestion is 10 g/day (EPA 1997). For a 20-kg child with pica, the fluoride intake from soil containing fluoride at 400 ppm would be 4 mg/day or 0.2 mg/kg/day. Although pica in general is not uncommon among children, the prevalence is not known (EPA 1997). Pica behavior specifically with respect to soil or dirt appears to be relatively rare but is known to occur (EPA 1997); however, fluoride intake from soil for a child with pica could be a significant contributor to total fluoride intake. For most children and for adults, fluoride intake from soil probably would be important only in situations in which the soil fluoride content is high, whether naturally or due to industrial pollution.
Pesticides
Cryolite and sulfuryl fluoride are the two pesticides that are regulated for their contribution to the residue of inorganic fluoride in foods. For food
use pesticides, EPA establishes a tolerance for each commodity to which a pesticide is allowed to be applied. Tolerance is the maximum amount of pesticide allowed to be present in or on foods. In the environment, cryolite breaks down to fluoride, which is the basis for the safety evaluation of cryolite and synthetic cryolite pesticides (EPA 1996a). Fluoride ions are also degradation products of sulfuryl fluoride (EPA 1992). Thus, the recent evaluation of the dietary risk of sulfuryl fluoride use on food takes into account the additional exposure to fluoride from cryolite (EPA 2004). Sulfuryl fluoride is also regulated as a compound with its own toxicologic characteristics.
Cryolite, sodium hexafluoroaluminate (Na3AlF6), is a broad spectrum insecticide that has been registered for use in the United States since 1957. Currently, it is used on many food (tree fruits, berries, and vegetables) and feed crops, and on nonfood ornamental plants (EPA 1996a). The respective fluoride ion concentrations from a 200 ppm aqueous synthetic cryolite (97.3% pure) at pH 5, 7, and 9 are estimated at 16.8, 40.0, and 47.0 ppm (approximately 15.5%, 37%, and 43% of the total available fluorine) (EPA 1996a). A list of tolerances for the insecticidal fluorine compounds cryolite and synthetic cryolite is published in the Code of Federal Regulations (40 CFR § 180.145(a, b, c) [2004]). Current tolerances for all commodities are at 7 ppm.
Sulfuryl fluoride (SO2F2), is a structural fumigant registered for use in the United States since 1959 for the control of insects and vertebrate pests. As of January 2004, EPA published a list of tolerances for sulfuryl fluoride use as a post-harvest fumigant for grains, field corn, nuts, and dried fruits (69 Fed. Reg. 3240 [2004]; 40 CFR 180.575(a) [2004]). The calculated exposure threshold at the drinking-water MCL of 4 mg/L was used as the basis for assessing the human health risk associated with these decisions (EPA 2004).
Concerns were raised that foods stored in the freezer during sulfuryl fluoride residential fumigation might retain significant amounts of fluoride residue. Scheffrahn et al. (1989) reported that unsealed freezer foods contained fluoride at as high as 89.7 ppm (flour, at 6,803 mg-hour/L rate of sulfuryl fluoride application) while no fluoride residue was detected (0.8 ppm limit of detection) in foods that were sealed with polyethylene film. A later study reported fluoride residue above 1 ppm in food with higher fat contents (e.g., 5.643 ppm in margarine) or that was improperly sealed (e.g., 7.66 ppm in a reclosed peanut butter PETE [polyethylene terephthalate] jar) (Scheffrahn et al. 1992).
Dietary exposure for a food item is calculated as the product of its consumption multiplied by the concentration of the residue of concern. The total daily dietary exposure for an individual is the sum of exposure from all food items consumed in a day. A chronic dietary exposure assessment of
fluoride was recently conducted for supporting the establishment of tolerances for the post-harvest use of sulfuryl fluoride. EPA (2004) used the Dietary Exposure Evaluation Model (DEEM-FCID), a computation program, to estimate the inorganic fluoride exposure from cryolite, sulfuryl fluoride, and the background concentration of fluoride in foods. DEEM-FCID (Exponent, Inc) uses the food consumption data from the 1994-1996 and 1998 Continuing Survey of Food Intakes by Individuals (CSFII) conducted by the U.S. Department of Agriculture (USDA). The 1994-1996 database consists of food intake diaries of more than 15,000 individuals nationwide on two nonconsecutive days. A total of 4,253 children from birth to 9 years of age are included in the survey. To ensure that the eating pattern of young children is adequately represented in the database, an additional survey was conducted in 1998 of 5,559 children 0-9 years of age. The latter survey was designed to be compatible with the CSFII 1994-1996 data so that the two sets of data can be pooled to increase the sample size for children. The Food Commodity Intake Database (FCID) is jointly developed by EPA and USDA for the purpose of estimating dietary exposure from pesticide residues in foods. It is a translated version of the CSFII data that expresses the intake of consumed foods in terms of food commodities (e.g., translating apple pie into its ingredients, such as apples, flour, sugar, etc.) (EPA 2000c).
All foods and food forms (e.g., grapes—fresh, cooked, juice, canned, raisins, wine) with existing tolerances for cryolite and sulfuryl fluoride were included in the recent EPA fluoride dietary exposure analysis (EPA 2004). For the analysis of fluoride exposure from cryolite, residue data taken from monitoring surveys, field studies, and at tolerance were adjusted to reflect changes in concentration during food processing (e.g., mixing in milling, dehydration, and food preparation). For the fluoride exposure from post-harvest treatment with sulfuryl fluoride, the measured residues are used without further adjustment except for applying drawdown factors in grain mixing (EPA 2004). In estimating fluoride exposure from both cryolite- and sulfuryl fluoride-treated foods, residue concentrations were adjusted for the percentage of crop treated with these pesticides based on the information from market share and agricultural statistics on pesticide use.
Fluoride exposures from a total of 543 forms of foods (e.g., plant-based, bovine, poultry, egg, tea) containing fluoride were also estimated as the background food exposure. Residue data were taken from surveys and residue trials (EPA 2004). No adjustments were made to account for residue concentration through processing or dehydration. Theoretically, the exposure from some processed foods (e.g., dried fruits) could potentially be higher than if their residue concentrations were assumed to be the same as in the fresh commodities (e.g., higher exposure from higher residue in dried fruits than assuming same residue concentration for both dried and fresh fruits.) However, these considerations are apparently offset by the
use of higher residue concentrations for many commodities (e.g., using the highest values from a range of survey data, the highest value as surrogate for when data are not available, assuming residue in dried fruits and tree nuts at one-half the limit of quantification when residue is not detected) such that the overall dietary exposure was considered overestimated (EPA 2004). The dietary fluoride exposure thus estimated ranged from 0.0003 to 0.0031 mg/kg/day from cryolite, 0.0003 to 0.0013 mg/kg/day from sulfuryl fluoride, and 0.005 to 0.0175 mg/kg/day from background concentration in foods (EPA 2004). Fine-tuning the dietary exposure analysis using the comprehensive National Fluoride Database recently published by USDA (2004) for many foods also indicates that the total background food exposure would not be significantly different from the analysis by EPA, except for the fluoride intake from tea. A closer examination of the residue profile used by EPA (2004) for background food exposure analysis reveals that 5 ppm, presumably a high-end fluoride concentration in brewed tea, was entered in the residue profile that called for fluoride concentration in powdered or dried tea. According to the USDA survey database (2004), the highest detected fluoride residue in instant tea powder is 898.72 ppm. The corrected exposure estimate is presented in the section “Total Exposure to Fluoride” later in this chapter.
Fluorinated Organic Chemicals
Many pharmaceuticals, consumer products, and pesticides contain organic fluorine (e.g., −CF3, −SCF3, −OCF3). Unlike chlorine, bromine, and iodine, organic fluorine is not as easily displaced from the alkyl carbon and is much more lipophilic than the hydrogen substitutes (Daniels and Jorgensen 1977; PHS 1991). The lipophilic nature of the trifluoromethyl group contribute to the enhanced biological activity of some pharmaceutical chemicals.
The toxicity of fluorinated organic chemicals usually is related to their molecular characteristics rather than to the fluoride ions metabolically displaced. Fluorinated organic chemicals go through various degrees of bio-transformation before elimination. The metabolic transformation is minimal for some chemicals. For example, the urinary excretion of ciprofloxacin (fluoroquinolone antibacterial agent) consists mainly of the unchanged parent compound or its fluorine-containing metabolites (desethylene-, sulfo-, oxo-, and N-formyl ciprofloxacin) (Bergan 1989). Nevertheless, Pradhan et al. (1995) reported an increased serum fluoride concentration from 4 µM (0.076 ppm) to 11 µM (0.21 ppm) in 19 children from India (8 months to 13 years old) within 12 hours after the initial oral dose of ciprofloxacin at 15-25 mg/kg. The presumed steady state (day 7 of repeated dosing) 24-hour urinary fluoride concentration was 15.5% higher than the predosing
concentration (59 µM versus 51 µM; or, 1.12 ppm versus 0.97 ppm). Another example of limited contribution to serum fluoride concentration from pharmaceuticals was reported for flecainide, an antiarrhythmic drug. The peak serum fluoride concentration ranged from 0.0248 to 0.0517 ppm (1.3 to 2.7 µM) in six healthy subjects (26-54 years old, three males, and three females) 4.5 hours after receiving a single oral dose of 100 mg of flecainide acetate (Rimoli et al. 1991). One to two weeks before the study, the subjects were given a poor fluoride diet, used toothpaste without fluoride, and had low fluoride (0.08 mg/L) in their drinking water.
Other fluoride-containing organic chemicals go through more extensive metabolism that results in greater increased bioavailability of fluoride ion. Elevated serum fluoride concentrations from fluorinated anesthetics have been extensively studied because of the potential nephrotoxicity of methoxyflurane in association with elevated serum fluoride concentrations beyond a presumed toxicity benchmark of 50 µM (Cousins and Mazze 1973; Mazze et al. 1977). A collection of data on peak serum fluoride ion concentrations from exposures to halothane, enflurane, isoflurane, and sevoflurane is given in Appendix B. These data serve to illustrate a wide range of peak concentrations associated with various use conditions (e.g., length of use, minimum alveolar concentration per hour), biological variations (e.g., age, gender, obesity, smoking), and chemical-specific characteristics (e.g., biotransformation pattern and rates). It is not clear how these episodically elevated serum fluoride ion concentrations contribute to potential adverse effects of long-term sustained exposure to inorganic fluoride from other media, such as drinking water, foods, and dental-care products.
Elevated free fluoride ion (< 2% of administered dose) also was detected in the plasma and urine of some patients after intravenous administration of fluorouracil (Hull et al. 1988). Nevertheless, the major forms of urinary excretion were still the unchanged parent compound and its fluorine-containing metabolites (dihydrofluorouracil, α-fluoro-β-ureidopropanoic acid, α-fluoro-β-alanine). The extent of dermal absorption of topical fluorouracil cream varies with skin condition, product formulation, and the conditions of use. Levy et al. (2001a) reported less than 3% systemic fluorouracil absorption in patients treated with 0.5% or 5% cream for actinic keratosis.
A group of widely used consumer products is the fluorinated telomers and polytetrafluoroethylene, or Teflon. EPA is in the process of evaluating the environmental exposure to low concentrations of perfluorooctanoic acid (PFOA) and its principal salts that are used in manufacturing fluoropolymers or as their breakdown products (EPA 2003b). PFOA is persistent in the environment. It is readily absorbed through oral and inhalation exposure and is eliminated in urine and feces without apparent biotransformation (EPA 2003b; Kudo and Kawashima 2003). Unchanged plasma and urine fluoride concentrations in rats that received intraperitoneal injections of
PFOA also indicated a lack of defluorination (Vanden Heuvel et al. 1991). (See Chapter 3 for more discussion of PFOA.)
Aluminofluorides, Beryllofluorides, and Fluorosilicates
Aluminofluorides and Beryllofluorides
Complexes of aluminum and fluoride (aluminofluorides, most often AlF3 or AlF4−) or beryllium and fluoride (beryllofluorides, usually as BeF3−) occur when the two elements are present in the same environment (Strunecka and Patocka 2002). Fluoroaluminate complexes are the most common forms in which fluoride can enter the environment. Eight percent of the earth’s crust is composed of aluminum; it is the most abundant metal and the third most abundant element on earth (Liptrot 1974). The most common form for the inorganic salt of aluminum and fluoride is cryolite (Na3AlF6). In fact, of the more than 60 metals on the periodic chart, Al3+ binds fluoride most strongly (Martin 1988). With the increasing prevalence of acid rain, metal ions such as aluminum become more soluble and enter our day-to-day environment; the opportunity for bioactive forms of AlF to exist has increased in the past 100 years. Human exposure to aluminofluorides can occur when a person ingests both a fluoride source (e.g., fluoride in drinking water) and an aluminum source; sources of human exposure to aluminum include drinking water, tea, food residues, infant formula, aluminum-containing antacids or medications, deodorants, cosmetics, and glassware (ATSDR 1999; Strunecka and Patocka 2002; Li 2003; Shu et al. 2003; Wong et al. 2003). Aluminum in drinking water comes both from the alum used as a flocculant or coagulant in water treatment and from leaching of aluminum into natural water by acid rain (ATSDR 1999; Li 2003). Exposure specifically to aluminofluoride complexes is not the issue so much as the fact that humans are routinely exposed to both elements. Human exposure to beryllium occurs primarily in occupational settings, in the vicinity of industrial operations that process or use beryllium, and near sites of beryllium disposal (ATSDR 2002).
Aluminofluoride and beryllofluoride complexes appear to act as analogues of phosphate groups—for example, the terminal phosphate of guanidine triphosphate (GTP) or adenosine triphosphate (ATP) (Chabre 1990; Antonny and Chabre 1992; Caverzasio et al. 1998; Façanha and Okorokova-Façanha 2002; Strunecka and Patocka 2002; Li 2003). Thus, aluminofluorides might influence the activity of a variety of phosphatases, phosphorylases, and kinases, as well as the G proteins involved in biological signaling systems, by inappropriately stimulating or inhibiting normal function of the protein (Yatani and Brown 1991; Caverzasio et al. 1998; Façanha and Okorokova-Façanha 2002; Strunecka and Patocka 2002; Li
2003). Aluminofluoride complexes have been reported to increase the concentrations of second messenger molecules (e.g., free cytosolic Ca2+, inositol 1,4,5-trisphosphate, and cyclic AMP) for many bodily systems (Sternweis and Gilman 1982; Strunecka et al. 2002; Li 2003). The increased toxicity of beryllium in the presence of fluoride and vice versa was noted as early as 1949 (Stokinger et al. 1949). For further discussion of aluminofluorides, see Chapters 5 and 7.
Further research should include characterization of both the exposure conditions and the physiological conditions (for fluoride and for aluminum or beryllium) under which aluminofluoride and beryllofluoride complexes can be expected to occur in humans as well as the biological effects that could result.
Fluorosilicates
Most fluoride in drinking water is added in the form of fluosilicic acid (fluorosilicic acid, H2SiF6) or the sodium salt (sodium fluosilicate, Na2SiF6), collectively referred to as fluorosilicates (CDC 1993). Of approximately 10,000 fluoridated water systems included in the CDC’s 1992 fluoridation census, 75% of them (accounting for 90% of the people served) used fluorosilicates. This widespread use of silicofluorides has raised concerns on at least two levels. First, some authors have reported an association between the use of silicofluorides in community water and elevated blood concentrations of lead in children (Masters and Coplan 1999; Masters et al. 2000); this association is attributed to increased uptake of lead (from whatever source) due to incompletely dissociated silicofluorides remaining in the drinking water (Masters and Coplan 1999; Masters et al. 2000) or to increased leaching of lead into drinking water in systems that use chloramines (instead of chlorine as a disinfectant) and silicofluorides (Allegood 2005; Clabby 2005; Maas et al. 2005).12,13 Macek et al. (2006) have also compared blood lead concentrations in children by method of water fluoridation; they stated that their analysis did not support an association between blood lead concentrations and silicofluorides, but also could not refute it,
|
12 |
In common practice, chloramines are produced with an excess of ammonia, which appears to react with silicofluorides to produce an ammonium-fluorosilicate intermediate which facilitates lead dissolution from plumbing components (Maas et al. 2005). |
|
13 |
Another possible explanation for increased blood lead concentrations which has not been examined is the effect of fluoride intake on calcium metabolism; a review by Goyer (1995) indicates that higher blood and tissue concentrations of lead occur when the diet is low in calcium. Increased fluoride exposure appears to increase the dietary requirement for calcium (see Chapter 8); in addition, the substitution of tap-water based beverages (e.g., soft drinks or reconstituted juices) for dairy products would result in both increased fluoride intake and decreased calcium intake. |
especially for children living in older housing. Second, essentially no studies have compared the toxicity of silicofluorides with that of sodium fluoride, based on the assumption that the silicofluorides will have dissociated to free fluoride before consumption (see also Chapter 7).
Use of more sophisticated analytical techniques such as nuclear magnetic resonance has failed to detect any silicon- and fluorine-containing species other than hexafluorosilicate ion (SiF62−) (Urbansky 2002; Morris 2004). In drinking water at approximately neutral pH and typical fluoride concentrations, all the silicofluoride appears to be dissociated entirely to silicic acid [Si(OH)4], fluoride ion, and HF (Urbansky 2002; Morris 2004); any intermediate species either exist at extremely low concentrations or are highly transient. SiF62− would be present only under conditions of low pH (pH < 5; Urbansky 2002; Morris 2004) and high fluoride concentration (above 16 mg/L according to Urbansky [2002]; at least 1 g/L to reach detectable levels of SiF62−, according to Morris [2004]). Urbansky (2002) also stated that the silica contribution from the fluoridating agent is usually trivial compared with native silica in the water; therefore, addition of any fluoridating agent (or the presence of natural fluoride) could result in the presence of SiF62− in any water if other conditions (low pH and high total fluoride concentration) are met. Both Urbansky (2002) and Morris (2004) indicate that other substances in the water, especially metal cations, might form complexes with fluoride, which, depending on pH and other factors, could influence the amount of fluoride actually present as free fluoride ion. For example, P.J. Jackson et al. (2002) have calculated that at pH 7, in the presence of aluminum, 97.46% of a total fluoride concentration of 1 mg/L is present as fluoride ion, but at pH 6, only 21.35% of the total fluoride is present as fluoride ion, the rest being present in various aluminum fluoride species (primarily AlF2+ and AlF3). Calculations were not reported for pH < 6.
Further research should include analysis of the concentrations of fluoride and various fluoride species or complexes present in tap water, using a range of water samples (e.g., of different hardness and mineral content). In addition, given the expected presence of fluoride ion (from any fluoridation source) and silica (native to the water) in any fluoridated tap water, it would be useful to examine what happens when that tap water is used to make acidic beverages or products (commercially or in homes), especially fruit juice from concentrate, tea, and soft drinks. Although neither Urbansky (2002) nor Morris (2004) discusses such beverages, both indicate that at pH < 5, SiF62− would be present, so it seems reasonable to expect that some SiF62− would be present in acidic beverages but not in the tap water used to prepare the beverages. Consumption rates of these beverages are high for many people, and therefore the possibility of biological effects of SiF62−, as opposed to free fluoride ion, should be examined.
RECENT ESTIMATES OF TOTAL FLUORIDE EXPOSURE
A number of authors have reviewed fluoride intake from water, food and beverages, and dental products, especially for children (NRC 1993; Levy 1994; Levy et al. 1995a,b,c; Lewis and Limeback 1996; Levy et al. 2001b). Heller et al. (1999, 2000) estimated that a typical infant less than 1 year old who drinks fluoridated water containing fluoride at 1 mg/L would ingest approximately 0.08 mg/kg/day from water alone. Shulman et al. (1995) also calculated fluoride intake from water, obtaining an estimate of 0.08 mg/kg/day for infants (7-9 months of age), with a linearly declining intake with age to 0.034 mg/kg/day for ages 12.5-13 years.
Levy et al. (1995b,c; 2001b) have estimated the intake of fluoride by infants and children at various ages based on questionnaires completed by the parents in a longitudinal study. For water from all sources (direct, mixed with formula, etc.), the intake of fluoride by infants (Levy et al. 1995b) ranged from 0 (all ages examined) to as high as 1.73 mg/day (9 months old). Infants fed formula prepared from powdered or liquid concentrate had fluoride intakes just from water in the formula of up to 1.57 mg/day. The sample included 124 infants at 6 weeks old and 77 by 9 months old. Thirty-two percent of the infants at 6 weeks and 23% at age 3 months reportedly had no water consumption (being fed either breast milk or ready-to-feed formula without added water). Mean fluoride intakes for the various age groups ranged from 0.29 to 0.38 mg/day; however, these values include the children who consumed no water, and so are not necessarily applicable for other populations. For the same children, mean fluoride intakes from water, fluoride supplement (if used), and dentifrice (if used) ranged from 0.32 to 0.38 mg/day (Levy et al. 1995c); the maximum fluoride intakes ranged from 1.24 (6 weeks old) to 1.73 mg/day (9 months old). Ten percent of the infants at 3 months old exceeded an intake of 1.06 mg/day.
For a larger group of children (about 12,000 at 3 months and 500 by 36 months of age; Levy et al. 2001b), mean fluoride intakes from water, supplements, and dentifrice combined ranged from 0.360 mg/day (12 months old) to 0.634 mg/day (36 months old). The 90th percentiles ranged from 0.775 mg/day (16 months old) to 1.180 mg/day (32 months old). Maximum intakes ranged from 1.894 mg/day (16 months old) to 7.904 mg/day (9 months old) and were attributable only to water (consumption of well water with 5-6 mg/L fluoride; about 1% of the children had water sources containing more than 2 mg/L fluoride). For ages 1.5-9 months, approximately 40% of the infants exceeded a mass-normalized intake level for fluoride of 0.07 mg/kg/day; for ages 12-36 months, about 10-17% exceeded that level (Levy et al. 2001b).
Levy et al. (2003b) reported substantial variation in total fluoride intake among children aged 36-72 months, with some individual intakes greatly
exceeding the means. The mean intake per unit of body weight declined with age from 0.05 to 0.06 mg/kg/day at 36 months to 0.03-0.04 mg/kg/day at 72 months; 90th percentile values declined from about 0.10 mg/kg/day to about 0.06 mg/kg/day (Levy et al. 2003b). Singer et al. (1985) reported mean estimated total fluoride intakes of 1.85 mg/day for 15- to 19-year-old males (based on a market-basket survey and a diet of 2,800 calories per day) in a fluoridated area (>0.7 mg/L) and 0.86 mg/day in nonfluoridated areas (<0.3 mg/L). Beverages and drinking water contributed approximately 75% of the total fluoride intake.
Lewis and Limeback (1996) estimated total daily fluoride intakes of 0.014-0.093 mg/kg for formula-fed infants and 0.0005-0.0026 mg/kg for breast-fed infants (up to 6 months). For children aged 7 months to 4 years, the estimated daily intakes from food, water, and household products (primarily dentifrice) were 0.087-0.160 mg/kg in fluoridated areas and 0.045-0.096 mg/kg in nonfluoridated areas. Daily intakes for other age groups were 0.049-0.079, 0.033-0.045, and 0.047-0.058 mg/kg for ages 5-11, 12-19, and 20+ in fluoridated areas, and 0.026-0.044, 0.017-0.021, and 0.032-0.036 mg/kg for the same age groups in nonfluoridated areas.
Rojas-Sanchez et al. (1999) estimated mean total daily fluoride intakes from foods, beverages, and dentifrice by 16- to 40-month-old children to be 0.767 mg (0.056 mg/kg) in a nonfluoridated community and 0.965 mg (0.070-0.073 mg/kg) in both a fluoridated community and a “halo” community. The higher mean dentifrice intake in the halo community than in the fluoridated community compensated for the lower dietary intake of fluoride in the halo community. Between 45% and 57% of children in the communities with higher daily fluoride intake exceeded the “upper estimated threshold limit” of 0.07 mg/kg, even without including any fluoride intake from supplements, mouth rinses, or gels in the study.
Erdal and Buchanan (2005), using a risk assessment approach based on EPA practices, estimated the cumulative (all sources combined) daily fluoride intake by infants (<1-year-old) in fluoridated areas to be 0.11 and 0.20 mg/kg for “central tendency” and “reasonable maximum exposure” conditions, respectively. For infants in nonfluoridated areas, the corresponding intakes were 0.08 and 0.11 mg/kg. For children aged 3-5, the estimated intakes were 0.06 and 0.23 mg/kg in fluoridated areas and 0.06 and 0.21 in nonfluoridated areas.
TOTAL EXPOSURE TO FLUORIDE
A systematic estimation of fluoride exposure from pesticides, background food, air, toothpaste, fluoride supplement, and drinking water is presented in this section. The estimated typical or average chronic exposures to inorganic fluoride from nonwater sources are presented in Table 2-9.
TABLE 2-9 Total Estimated Chronic Inorganic Fluoride Exposure from Nonwater Sources
|
|
Average Inorganic Fluoride Exposure, mg/kg/day |
|
|||||
|
Population Subgroups |
Sulfuryl Fluoridea |
Cryolitea |
Background Fooda |
Toothpasteb |
Aira |
Total Nonwater |
Supplementc |
|
All infants (<1 year) |
0.0005 |
0.0009 |
0.0096 |
0 |
0.0019 |
0.0129 |
0.0357 |
|
Nursing |
0.0003 |
0.0004 |
0.0046 |
0 |
0.0019 |
0.0078d |
0.0357 |
|
Nonnursing |
0.0006 |
0.0012 |
0.0114 |
0 |
0.0019 |
0.0151 |
0.0357 |
|
Children 1-2 years |
0.0013 |
0.0031 |
0.0210 |
0.0115 |
0.0020 |
0.0389 |
0.0192 |
|
Children 3-5 years |
0.0012 |
0.0020 |
0.0181 |
0.0114 |
0.0012 |
0.0339 |
0.0227 |
|
Children 6-12 years |
0.0007 |
0.0008 |
0.0123 |
0.0075 |
0.0007 |
0.0219 |
0.0250 |
|
Youth 13-19 years |
0.0004 |
0.0003 |
0.0097 |
0.0033 |
0.0007 |
0.0144 |
0.0167 |
|
Adults 20-49 years |
0.0003 |
0.0004 |
0.0114 |
0.0014 |
0.0006 |
0.0141 |
0 |
|
Adults 50+ years |
0.0003 |
0.0005 |
0.0102 |
0.0014 |
0.0006 |
0.0130 |
0 |
|
Females 13-49 yearse |
0.0003 |
0.0005 |
0.0107 |
0.0016 |
0.0006 |
0.0137 |
0 |
|
aBased on the exposure assessment by EPA (2004). Background food exposures are corrected for the contribution from powdered or dried tea at 987.72 ppm instead of 5 ppm used in EPA analysis. bBased on Levy et al. (1995a), assuming two brushings per day with fluoride toothpaste (0.1% F) and moderate rinsing. The estimated exposures are: 0 mg/day for infants; 0.15 mg/day for 1-2 years; 0.25 mg/day for 3-5 years; 0.3 mg/day for 6-12 years; 0.2 mg/day for 13-19 years; 0.1 mg/day for all adults and females 13-49 years. The calculated exposure in mg/kg/day is based on the body weights from EPA (2004). For most age groups, these doses are lower than the purported maximum of 0.3 mg/day used for all age groups by EPA (2004). cBased on ADA (2005) schedule (Table 2-8) and body weights from EPA (2004). Note that the age groups here do not correspond exactly to those listed by ADA (2005). The estimated exposures are: 0.25 mg/day for infant and 1-2 years; 0.5 mg/day for 3-5 years, and 1 mg/day for 6-12 years and 13-19 years. dIncludes the estimated 0.0006 mg/kg/day from breast milk. Using the higher estimated breast-milk exposure from a fluoridated area (approximately 0.0014 mg/kg/day) results in 0.0086 mg/kg/day for total nonwater exposure. eWomen of childbearing age. |
|||||||
The exposures from pesticides (sulfuryl fluoride and cryolite), background food, and air are from a recent exposure assessment by EPA (2004). The background food exposure is corrected for the contribution from powdered or dried tea by using the appropriate residue concentration of 897.72 ppm
for instant tea powder instead of the 5 ppm for brewed tea used in the EPA (2004) analysis. It should be noted that the exposure from foods treated with sulfuryl fluoride is not applicable before its registration for post-harvest fumigation in 2004. The exposure from toothpaste is based on Levy et al. (1995a; see Table 2-7). The use of fluoride-containing toothpaste is assumed not to occur during the first year of life. Fluoride supplements are considered separately in Table 2-9 and are not included in the “total nonwater” column. Children 1-2 years old have the highest exposures from all nonwater source components. The two highest nonwater exposure groups are children 1-2 and 3-5 years old, at 0.0389 and 0.0339 mg/kg/day, respectively (Table 2-9). These doses are approximately 2.5-3 times those of adult exposures.
The estimated exposures from drinking water are presented in Table 2-10, using the DEEM-FCID model (version 2.03, Exponent Inc.). The water consumption data are based on the FCID translated from the CSFII 1994-1996 and 1998 surveys and represent an update to the information presented in Appendix B. The food forms for water coded as “direct, tap”; “direct, source nonspecified”; “indirect, tap”; and “indirect, source nonspecified” are assumed to be from local tap water sources. The sum of these four categories constitutes 66-77% of the total daily water intake. The remaining 23-34% is designated as nontap, which includes four food forms coded as “direct, bottled”; “direct, others”; “indirect, bottled”; and
TABLE 2-10 Estimated Chronic (Average) Inorganic Fluoride Exposure (mg/kg/day) from Drinking Water (All Sources)a
|
|
Fluoride Concentrations in Tap Water (fixed nontap water at 0.5 mg/L) |
||||
|
Population Subgroups |
0 mg/L |
0.5 mg/L |
1.0 mg/L |
2.0 mg/L |
4.0 mg/L |
|
All infants (<1 year) |
0.0120 |
0.0345 |
0.0576 |
0.1040 |
0.1958 |
|
Nursing |
0.0050 |
0.0130 |
0.0210 |
0.0370 |
0.0700 |
|
Nonnursing |
0.0140 |
0.0430 |
0.0714 |
0.1290 |
0.2430 |
|
Children 1-2 years |
0.0039 |
0.0157 |
0.0274 |
0.0510 |
0.0982 |
|
Children 3-5 years |
0.0036 |
0.0146 |
0.0257 |
0.0480 |
0.0920 |
|
Children 6-12 years |
0.0024 |
0.0101 |
0.0178 |
0.0330 |
0.0639 |
|
Youth 13-19 years |
0.0018 |
0.0076 |
0.0134 |
0.0250 |
0.0484 |
|
Adults 20-49 years |
0.0024 |
0.0098 |
0.0173 |
0.0320 |
0.0620 |
|
Adults 50+ years |
0.0023 |
0.0104 |
0.0184 |
0.0340 |
0.0664 |
|
Females 13-49 yearsb |
0.0025 |
0.0098 |
0.0171 |
0.0320 |
0.0609 |
|
aEstimated from DEEM-FCID model (version 2.03, Exponent Inc.). The water consumption data are based on diaries from the CSFII 1994-1996 and 1998 surveys that are transformed into food forms by the Food Commodity Intake Database (FCID). The food forms coded as “direct, tap”; “direct, source nonspecified”; “indirect, tap”; and “indirect, source nonspecified” are assumed to be from tap water sources. bWomen of childbearing age. |
|||||
“indirect, others”. Fluoride exposures from drinking water (Table 2-10) are estimated for different concentrations of fluoride in the local tap water (0, 0.5, 1.0, 2.0, or 4.0 mg/L), while assuming a fixed 0.5 mg/L for all nontap sources (e.g., bottled water). The assumption for nontap water concentration is based on the most recent 6-year national public water system compliance monitoring from a 16-state cross section that represents approximately 41,000 public water systems, showing average fluoride concentrations of 0.482 mg/L in groundwater and 0.506 mg/L in surface water (EPA 2003a). The reported best estimates for exceeding 1.2, 2, and 4 mg/L in surface-water source systems are 9.37%, 1.11%, and 0.0491%, respectively; for groundwater source systems, the respective estimates are 8.54%, 3.05%, and 0.55%. Table 2-10 shows that nonnursing infants have the highest exposure from drinking water. The estimated daily drinking-water exposures at tap-water concentrations of 1, 2, and 4 mg/L are 0.0714, 0.129, and 0.243 mg/kg, respectively. These values are approximately 2.6 times those for children 1-2 and 3-5 years old and 4 times the exposure of adults.
The estimated total fluoride exposures aggregated from all sources are presented in Table 2-11. These values represent the sum of exposures from Table 2-9 and 2-10, assuming fluoride supplements might be given to infants and children up to 19 years old in low-fluoride tap-water scenarios (0 and 0.5 mg/L). Table 2-11 shows that, when tap water contains fluoride, nonnursing infants have the highest total exposure. They are 0.087, 0.144, and 0.258 mg/kg/day in tap water at 1, 2, and 4 mg/L, respectively. At 4 mg/L, the total exposure for nonnursing infants is approximately twice the exposure for children 1-2 and 3-5 years old and 3.4 times the exposure for adults.
The relative source contributions to the total exposure in Table 2-11 for scenarios with 1, 2, and 4 mg/L in tap water are illustrated in Figures 2-1, 2-2, and 2-3, respectively. Numerical values for the 1-, 2-, and 4-mg/L scenarios are given later in the summary tables (Tables 2-13, 2-14, and 2-15). Under the assumptions for estimating the exposure, the contribution from pesticides plus fluoride in the air is within 4% to 10% for all population subgroups at 1 mg/L in tap water, 3-7% at 2 mg/L in tap water, and 1-5% at 4 mg/L in tap water. The contributions from the remaining sources also vary with different tap-water concentrations. For nonnursing infants, who represent the highest total exposure group even without any exposure from toothpaste, the contribution from drinking water is 83% for 1 mg/L in tap water (Figure 2-1). As the tap-water concentration increases to 2 and 4 mg/L, the relative drinking-water contribution increases to 90% and 94%, respectively (Figures 2-2 and 2-3). The proportion of the contribution from all sources also varies in children 1-2 and 3-5 years old. At 1 mg/L, the drinking-water contribution is approximately 42%, while the contributions from toothpaste and background food are sizable, approximately 18% and
TABLE 2-11 Total Estimated (Average) Chronic Inorganic Fluoride Exposure (mg/kg/day) from All Sources, Assuming Nontap Water at a Fixed Concentrationa
|
|
Concentration in Tap Water (fixed nontap water at 0.5 mg/L) |
||||||
|
Population Subgroups |
With Fluoride Supplement |
Without Fluoride Supplement |
|||||
|
0 mg/L |
0.5 mg/L |
0 mg/L |
0.5 mg/L |
1 mg/L |
2 mg/L |
4 mg/L |
|
|
All infants (<1 year) |
0.061 |
0.083 |
0.025 |
0.047 |
0.070 |
0.117 |
0.209 |
|
Nursingb |
0.049 |
0.057 |
0.013 |
0.021 |
0.030 |
0.046 |
0.079 |
|
Nonnursing |
0.065 |
0.094 |
0.029 |
0.058 |
0.087 |
0.144 |
0.258 |
|
Children 1-2 years |
0.062 |
0.074 |
0.043 |
0.055 |
0.066 |
0.090 |
0.137 |
|
Children 3-5 years |
0.060 |
0.071 |
0.038 |
0.049 |
0.060 |
0.082 |
0.126 |
|
Children 6-12 years |
0.049 |
0.057 |
0.024 |
0.032 |
0.040 |
0.055 |
0.086 |
|
Youth 13-19 years |
0.033 |
0.039 |
0.016 |
0.022 |
0.028 |
0.039 |
0.063 |
|
Adults 20-49 years |
0.017 |
0.024 |
0.017 |
0.024 |
0.031 |
0.046 |
0.076 |
|
Adults 50+ years |
0.015 |
0.023 |
0.015 |
0.023 |
0.031 |
0.047 |
0.079 |
|
Females 13-49 yearsc |
0.016 |
0.024 |
0.016 |
0.024 |
0.031 |
0.046 |
0.075 |
|
aThe estimated exposures from fluoride supplements and total nonwater sources (including pesticides, background food, air, and toothpaste) are from Table 2-9. The estimated exposures from drinking water are from Table 2-10. For nonfluoridated areas (tap water at 0 and 0.5 mg/L), the total exposures are calculated both with and without fluoride supplements. bThe higher total nonwater exposure of 0.0086 mg/kg/day that includes breast milk from a fluoridated area (footnote in Table 2-9) is used to calculate the exposure estimates for the “without supplement” groups that are exposed to fluoride in water at 1, 2, and 4 mg/L. cWomen of childbearing age. |
|||||||
31%, respectively (Figure 2-1). At 2 mg/L, the drinking-water contribution is raised to approximately 57%, while the contributions from toothpaste and background food are reduced to 13% and 23%, respectively (Figure 2-2). At 4 mg/L, the relative contribution of drinking water continues to increase to approximately 72%, while the contribution from toothpaste and background food are further reduced to approximately 9% and 15%, respectively (Figure 2-3). As age increases toward adulthood (20+ years), the contribution from toothpaste is reduced to approximately 5% at 1 mg/ L, 3-4% at 2 mg/L, and 2% at 4 mg/L. Correspondingly, the contribution from drinking water increases to approximately 57% at 1 mg/L, 70% at 2 mg/L, and 82% at 4 mg/L.
Data presented in Tables 2-9 to 2-11 are estimates of typical exposures, while the actual exposure for an individual could be lower or higher. There are inherent uncertainties in estimating chronic exposure based on the 2-day CSFII surveys. The DEEM-FCID model assumes that the average
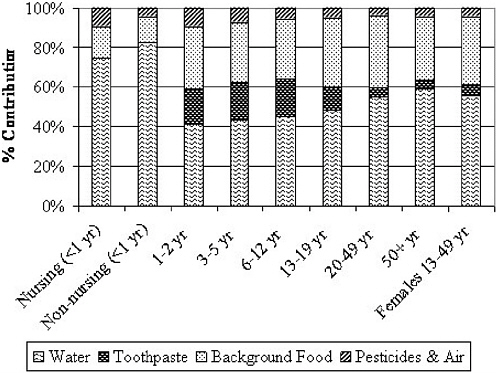
FIGURE 2-1 Source contribution to total inorganic fluoride exposure, including fluoride at 1 mg/L in tap water. The estimated chronic inorganic fluoride exposures from the various routes are presented in Tables 2-9 and 2-10. No fluoride supplement is included for any population subgroup. The total exposures as presented in Table 2-11 for the population subgroups are: 0.030 mg/kg/day (nursing infants), 0.087 mg/kg/day (non-nursing infants), 0.066 mg/kg/day (1-2 years old), 0.060 mg/kg/day (3-5 years old), 0.040 mg/kg/day (6-12 years old), 0.028 mg/kg/day (13-19 years old), and 0.031 mg/kg/day for adults (20 to 50+ years old) and women of childbearing age (13-49 years old).
intake from the cross-sectional survey represents the longitudinal average for a given population. Thus, the chronic exposures of those who have persistently high intake rates, especially for food items that contain high concentrations of fluoride (e.g., tea), are likely to be underestimated. For example, at an average fluoride concentration of 3.3 mg/L for brewed tea and 0.86 mg/L for iced tea (USDA 2004), the tea component in the background food presented in Table 2-9 represents an average daily consumption of one-half cup of brewed tea or 2 cups of iced tea. A habitual tea drinker, especially for brewed tea, can be expected to significantly exceed these con-
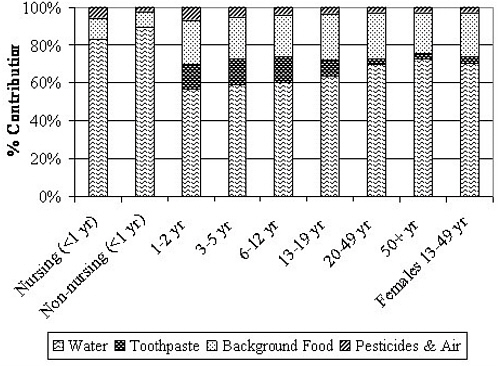
FIGURE 2-2 Source contribution to total inorganic fluoride exposure, including fluoride at 2 mg/L fluoride in tap water. The estimated chronic inorganic fluoride exposures from the various routes are presented in Tables 2-9 and 2-10. No fluoride supplement is included for any population subgroup. The total exposures as presented in Table 2-11 for the population subgroups are: 0.046 mg/kg/day (nursing infants), 0.144 mg/kg/day (non-nursing infants), 0.090 mg/kg/day (1-2 years old), 0.082 mg/kg/day (3-5 years old), 0.055 mg/kg/day (6-12 years old), 0.039 mg/kg/day (13-19 years old), and 0.046-0.047 mg/kg/day for adults (20-50+ years old) and women of childbearing age (13-49 years old).
sumption rates. Other groups of people who are expected to have exposures higher than those calculated here include infants given fluoride toothpaste before age 1, anyone who uses toothpaste more than twice per day or who swallows excessive amounts of toothpaste, children inappropriately given fluoride supplements in a fluoridated area, children in an area with high fluoride concentrations in soil, and children with pica who consume large amounts of soil.
The exposure estimates presented in this chapter for non-drinking-water routes are based on the potential profile of fluoride residue concentrations
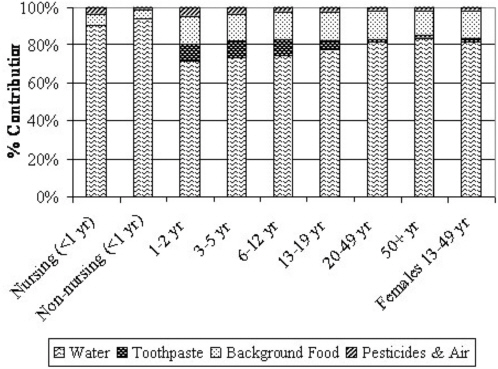
FIGURE 2-3 Source contribution to total inorganic fluoride exposure, including fluoride at 4 mg/L in tap water. The estimated chronic inorganic fluoride exposures from the various routes are presented in Tables 2-9 and 2-10. No fluoride supplement is included for any population subgroup. The total exposures as presented in Table 2-11 for the population subgroups are: 0.079 mg/kg/day (nursing infants), 0.258 mg/kg/day (nonnursing infants), 0.137 mg/kg/day (1-2 years old), 0.126 mg/kg/day (3-5 years old), 0.086 mg/kg/day (6-12 years old), 0.063 mg/kg/day (13-19 years old), 0.075-0.079 mg/kg/day for adults (20-50+ years old) and women of childbearing age (13-49 years old).
in the current exposure media. They likely do not reflect the concentration of past exposure scenarios, particularly for routes that show changes in time (e.g., pesticide use practices). Any new and significant source of fluoride exposure, such as commodities approved for sulfuryl fluoride fumigation application beyond April 2005, is expected to alter the percentage of drinking water contribution as presented in this chapter.
Different assumptions for the drinking-water concentration alone also can result in slightly different estimates. For example, values in Table 2-11 are derived from assuming that the nontap water has a fixed fluoride concentration of 0.5 mg/L, while tap-water concentration varies up to 4 mg/L. Table 2-12 provides alternative calculations of total exposure by assuming
TABLE 2-12 Total Estimated (Average) Chronic Inorganic Fluoride Exposure (mg/kg/day) from All Sources, Assuming the Same Specified Fluoride Concentration for Both Tap and Nontap Watersa
|
|
Concentration in All Water |
|||||
|
|
1 mg/L |
2 mg/L |
4 mg/L |
1 mg/L |
2 mg/L |
4 mg/L |
|
Population Subgroups |
Modeled water intakeb |
EPA default water intakec |
||||
|
All infants (<1 year) |
0.082 |
0.151 |
0.289 |
0.113 |
0.213 |
0.413 |
|
Nursing |
0.034 |
0.060 |
0.111 |
0.109 |
0.209 |
0.409 |
|
Nonnursing |
0.100 |
0.186 |
0.357 |
0.115 |
0.215 |
0.415 |
|
Children 1-2 years |
0.070 |
0.102 |
0.164 |
0.139 |
0.239 |
0.439 |
|
Children 3-5 years |
0.063 |
0.093 |
0.151 |
NA |
NA |
NA |
|
Children 6-12 years |
0.042 |
0.062 |
0.103 |
NA |
NA |
NA |
|
Youth 13-19 years |
0.030 |
0.045 |
0.075 |
NA |
NA |
NA |
|
Adults 20-49 years |
0.034 |
0.053 |
0.093 |
0.043 |
0.071 |
0.128 |
|
Adults 50+ years |
0.034 |
0.054 |
0.096 |
0.042 |
0.070 |
0.127 |
|
Females 13-49 yearsd |
0.033 |
0.053 |
0.092 |
0.042 |
0.071 |
0.128 |
|
aThe estimated exposures from nonwater sources (including pesticides, background food, air, and toothpaste) are from Table 2-9. No fluoride supplement is included in the total fluoride exposure estimates. bThe component of drinking-water exposure is estimated from DEEM-FCID. cThe EPA default daily water intake rate is 1 L for a 10-kg child and 2 L for a 70-kg adult. NA: not applicable based on EPA’s default body weight. dWomen of childbearing age. |
||||||
that all sources of drinking water (both tap and nontap water) contain the same specified fluoride concentration. Within this assumption, the drinking-water component can be estimated from either the DEEM-FCID model or the default drinking-water intake rate currently used by EPA for establishing the MCL (1 L/day for a 10-kg child and 2 L/day for a 70-kg adult).
Some uncertainties exist regarding the extent the FCID database may include all processed waters (e.g., soft drinks and soups). Thus, the exposure using EPA’s defaults as presented in Table 2-12 can serve as a bounding estimate from the water contribution. The difference in the total fluoride exposure calculated from the two water intake methods (i.e., EPA defaults versus FCID modeled) varies with different population subgroups shown in Table 2-12. In general, as the drinking-water contribution to the total exposure becomes more prominent at higher drinking-water concentration, the differences in total exposure approach the differences in drinking-water intake rates of the two methods. Using EPA’s default adult water intake rate of 28.6 mL/kg/day (based on 2 L/day for a 70 kg adult) results in approximately 32-39% higher total exposure than the model estimates. This approximates the 38-45% lower model estimate of total water intake rate
(i.e., 19.7 mL/kg/day for 20-49 year olds, 20.7 mL/kg/day for 50+ year olds). Using EPA’s default water intake rate for a child results in approximately 16% higher total exposure than the model estimates for nonnursing infants at 4 mg/L drinking water. This reflects closely the difference in the total water intake between the default 100 mL/kg/day (based on 1 L/day for a 10 kg child) and the DEEM-FCID estimate of 85.5 mL/kg/day for this population group. Similarly, for nursing infants, the 3.7-fold higher total exposure at 4 mg/L from using the EPA’s default of 100 mL/kg/day also reflects their significantly lower model estimate of total water intake (i.e., 25.6 mL/kg/day). Two additional simple conceptual observations can be made to relate data presented in Table 2-12 to those in Tables 2-9 and 2-11. By using a fixed rate of water intake for infants and children 1-2 years old, the difference in their total exposure is due to the contribution from all nonwater sources as presented in Table 2-9. The difference between model estimates presented in Table 2-11 (last 3 columns) by varying concentrations for tap water alone (with fixed nontap water at 0.5 mg/L) and estimates using one fluoride concentration for both tap and nontap waters in Table 2-12 (first 3 columns) reflects the contribution from the nontap-water component.
The fluoride exposure estimates presented thus far, regardless of the various assumptions (e.g., the same versus different fluoride concentrations in tap and nontap water) and different water intake rates (e.g., EPA default versus estimates from FCID database of the CSFII surveys), do not include those who have sustained high water intake rates as noted previously (athletes, workers, and individuals with diabetes mellitus or nephrogenic diabetes insipidus (see Table 2-4). The high-end exposures for these high-water-consumption population subgroups are included in the summaries below.
SUMMARY OF EXPOSURE ASSESSMENT
The estimated aggregated total fluoride exposures from pesticides, background food, air, toothpaste, and drinking water are summarized for drinking water fluoride concentrations of 1 mg/L (Table 2-13), 2 mg/L (Table 2-14), and 4 mg/L (Table 2-15). Two sets of exposures are presented using different approaches to estimate the exposure from drinking water. One is estimated by modeling water intakes based on FCID data and assuming a fixed nontap water concentration of 0.5 mg/L. The other is estimated using EPA default drinking-water intake rates (i.e., 1 L/day for a 10 kg child, 2 L/day for a 70 kg adult) and assuming the same concentration for tap and nontap waters. Both sets of estimates include the same fluoride exposure from nonwater sources. The total exposure from the latter approach is higher than the model estimates due to the higher default drinking water intake rates and the assumption that nontap waters contain the same concentration of fluoride residue as the tap water.
TABLE 2-13 Contributions to Total Fluoride Chronic Exposure at 1 mg/L in Drinking Water
|
|
Total Exposure, mg/kg/day |
% Contribution to Total Exposure |
|||
|
Population Subgroups |
Pesticides and Air |
Background Food |
Toothpaste |
Drinking Water |
|
|
Modeled average water consumer (Tap water at 1 mg/L, nontap water at 0.5 mg/L; Table 2-11) |
|||||
|
All infants (<1 year) |
0.070 |
4.7 |
13.6 |
0 |
81.7 |
|
Nursing |
0.030 |
8.9 |
15.6 |
0 |
70.8 |
|
Nonnursing |
0.087 |
4.3 |
13.2 |
0 |
82.5 |
|
Children 1-2 years |
0.066 |
9.7 |
31.7 |
17.4 |
41.3 |
|
Children 3-5 years |
0.060 |
7.4 |
30.4 |
19.1 |
43.1 |
|
Children 6-12 years |
0.040 |
5.4 |
30.9 |
18.9 |
44.8 |
|
Youth 13-19 years |
0.028 |
4.9 |
34.8 |
12.0 |
48.3 |
|
Adults 20-49 years |
0.031 |
4.0 |
36.3 |
4.6 |
55.1 |
|
Adults 50+ years |
0.031 |
4.4 |
32.4 |
4.6 |
58.7 |
|
Females 13-49 yearsa |
0.031 |
4.4 |
34.7 |
5.3 |
55.6 |
|
EPA default water intake, all water at 1 mg/L (1 L/day for 10-kg child; 2 L/day for 70-kg adult; Table 2-12) |
|||||
|
All infants (<1 year) |
0.113 |
2.9 |
8.5 |
0 |
88.6 |
|
Nursing |
0.109 |
2.4 |
4.3 |
0 |
92.0 |
|
Nonnursing |
0.115 |
3.2 |
9.9 |
0 |
86.9 |
|
Children 1-2 years |
0.139 |
4.6 |
15.1 |
8.3 |
72.0 |
|
Adults 20-49 years |
0.043 |
3.0 |
26.7 |
3.3 |
67.0 |
|
High end of high water intake individuals all water at 1 mg/L (based on intake rates in Table 2-4) |
|||||
|
Athletes and workers |
0.084 |
1.5 |
13.5 |
1.7 |
83.3 |
|
DM patients (3-5 years) |
0.134 |
3.3 |
13.5 |
8.5 |
74.7 |
|
DM patients (adults) |
0.084 |
1.5 |
13.5 |
1.7 |
83.3 |
|
NDI patients (3-5 years) |
0.184 |
2.4 |
9.9 |
6.2 |
81.6 |
|
NDI patients (adults) |
0.164 |
0.8 |
6.9 |
0.9 |
91.4 |
|
aWomen of childbearing age. ABBREVIATIONS: DM, diabetes mellitus; NDI, nephrogenic diabetes insipidus. |
|||||
Although each of these exposure estimates have areas of uncertainty, the average total daily fluoride exposure is expected to fall between them. For the modeling estimates, there are inherent uncertainties in modeling long-term intake rates based on the cross-sectional CSFII dietary survey data. Thus, the exposure from any dietary component, water or other foods, could be underestimated for individuals who have habitually higher intake rates (e.g., water, tea). Specific to the water component, there are also uncertainties regarding the extent the FCID database may include all processed waters (e.g., soft drinks and soups). On the other hand, the EPA
TABLE 2-14 Contributions to Total Fluoride Chronic Exposure at 2 mg/L in Drinking Water
|
|
|
% Contribution to Total Exposure |
|||
|
Population Subgroups |
Total Exposure, mg/kg/day |
Pesticides and Air |
Background Food |
Toothpaste |
Drinking Water |
|
Modeled average water consumer (Tap water at 2 mg/L, nontap water at 0.5 mg/L; Table 2-11) |
|||||
|
All infants (<1 year) |
0.117 |
2.8 |
8.2 |
0 |
89.0 |
|
Nursing |
0.046 |
5.8 |
10.1 |
0 |
81.0 |
|
Nonnursing |
0.144 |
2.6 |
7.9 |
0 |
89.5 |
|
Children 1-2 years |
0.090 |
7.1 |
23.3 |
12.8 |
56.7 |
|
Children 3-5 years |
0.082 |
5.4 |
22.1 |
13.9 |
58.6 |
|
Children 6-12 years |
0.055 |
3.9 |
22.4 |
13.7 |
60.1 |
|
Youth 13-19 years |
0.039 |
3.5 |
24.5 |
8.5 |
63.5 |
|
Adults 20-49 years |
0.046 |
2.8 |
24.7 |
3.1 |
69.4 |
|
Adults 50+ years |
0.047 |
2.9 |
21.7 |
3.0 |
72.4 |
|
Females 13-49 yearsa |
0.046 |
3.0 |
23.4 |
3.6 |
70.1 |
|
EPA default water intake, all water at 1 mg/L (2 L/day for 10-kg child; 2 L/day for 70-kg adult; Table 2-12) |
|||||
|
All infants (<1 year) |
0.213 |
1.6 |
4.5 |
0 |
93.9 |
|
Nursing |
0.209 |
1.3 |
2.2 |
0 |
95.8 |
|
Nonnursing |
0.215 |
1.7 |
5.3 |
0 |
93.0 |
|
Children 1-2 years |
0.239 |
2.7 |
8.8 |
4.8 |
83.7 |
|
Adults 20-49 years |
0.071 |
1.8 |
16.0 |
2.0 |
80.2 |
|
High end of high water intake individuals all water at 2 mg/L (based on intake rates in Table 2-4) |
|||||
|
Athletes and workers |
0.154 |
0.8 |
7.4 |
0.9 |
90.9 |
|
DM patients (3-5 years) |
0.234 |
1.9 |
7.7 |
4.9 |
85.5 |
|
DM patients (adults) |
0.154 |
0.8 |
7.4 |
0.9 |
90.9 |
|
NDI patients (3-5 years) |
0.334 |
1.3 |
5.4 |
3.4 |
89.9 |
|
NDI patients (adults) |
0.314 |
0.4 |
3.6 |
0.5 |
95.5 |
|
aWomen of childbearing age. ABBREVIATIONS: DM, diabetes mellitus; NDI, nephrogenic diabetes insipidus. |
|||||
default water intake rate is likely higher than the average rate for certain population subgroups (e.g., nursing infants).
The estimates presented in Tables 2-13, 2-14, and 2-15 show that on a per body weight basis, the exposures are generally higher for young children than for the adults. By assuming that the nontap water concentration is fixed at 0.5 mg/L, nonnursing infants have the highest model-estimated average total daily fluoride exposure: 0.087, 0.144, and 0.258 mg/kg/day when tap-water concentrations of fluoride are 1, 2, and 4 mg/L, respectively (Table 2-11,
TABLE 2-15 Contributions to Total Fluoride Chronic Exposure at 4 mg/L in Drinking Water
|
|
|
% Contribution to Total Exposure |
|||
|
Population Subgroups |
Total Exposure, mg/kg/day |
Pesticides and Air |
Background Food |
Toothpaste |
Drinking Water |
|
Modeled average water consumer (Tap water at 4 mg/L, nontap water at 0.5 mg/L; Table 2-11) |
|||||
|
All infants (<1 year) |
0.209 |
1.6 |
4.6 |
0 |
93.9 |
|
Nursing |
0.079 |
3.3 |
5.9 |
0 |
89.0 |
|
Nonnursing |
0.258 |
1.4 |
4.4 |
0 |
94.1 |
|
Children 1-2 years |
0.137 |
4.7 |
15.3 |
8.4 |
71.6 |
|
Children 3-5 years |
0.126 |
3.5 |
14.4 |
9.0 |
73.1 |
|
Children 6-12 years |
0.086 |
2.5 |
14.3 |
8.7 |
74.5 |
|
Youth 13-19 years |
0.063 |
2.2 |
15.4 |
5.3 |
77.1 |
|
Adults 20-49 years |
0.076 |
1.7 |
15.0 |
1.9 |
81.5 |
|
Adults 50+ years |
0.079 |
1.7 |
12.8 |
1.8 |
83.7 |
|
Females 13-49 yearsa |
0.075 |
1.8 |
14.3 |
2.2 |
81.7 |
|
EPA default water intake all water at 4 mg/L (1 L/day for 10-kg child; 2 L/day for 70-kg adult; Table 2-12) |
|||||
|
All infants (<1 year) |
0.413 |
0.8 |
2.3 |
0 |
96.9 |
|
Nursing |
0.409 |
0.6 |
1.1 |
0 |
97.9 |
|
Nonnursing |
0.415 |
0.9 |
2.8 |
0 |
96.4 |
|
Children 1-2 years |
0.439 |
1.5 |
4.8 |
2.6 |
91.1 |
|
Adults 20-49 years |
0.128 |
1.0 |
8.9 |
1.1 |
89.0 |
|
High end of high water intake individuals, all water at 4 mg/L (based on intake rates in Table 2-4) |
|||||
|
Athletes and workers |
0.294 |
0.4 |
3.9 |
0.5 |
95.2 |
|
DM patients (3-5 years) |
0.434 |
1.0 |
4.2 |
2.6 |
92.2 |
|
DM patients (adults) |
0.294 |
0.4 |
3.9 |
0.5 |
95.2 |
|
NDI patients (3-5 years) |
0.634 |
0.7 |
2.9 |
1.8 |
94.7 |
|
NDI patients (adults) |
0.614 |
0.2 |
1.9 |
0.2 |
97.7 |
|
aWomen of childbearing age. ABBREVIATIONS: DM, diabetes mellitus; NDI, nephrogenic diabetes insipidus |
|||||
and Tables 2-13, 2-14, and 2-15). The major contributing factor is their much higher model-estimated drinking-water exposure than other age groups (Table 2-10). The total exposures of nonnursing infants are approximately 2.8-3.4 times that of adults. By holding the exposure from drinking water at a constant with the EPA default water intake rates, children 1-2 years old have slightly higher total exposure than the nonnursing infants, reflecting the higher exposure from nonwater sources (Table 2-9). The estimated total fluoride exposures for children 1-2 years old are 0.139, 0.239,
and 0.439 mg/kg/day for 1, 2, and 4 mg/L of fluoride in drinking water, respectively (Tables 2-13, 2-14, 2-15). These exposures are approximately 3.4 times that of adults. The estimated total exposure for children 1-2 years old and adults at 4 mg/L fluoride in drinking water is approximately two times the exposure at 2 mg/L and three times the exposure at 1 mg/L.
The estimated total daily fluoride exposures for three population subgroups with significantly high water intake rates are included in Tables 2-13, 2-14, and 2-15. The matching age groups for data presented in Table 2-4 are: adults ≥ 20 years old for the athletes and workers, and both children 3-5 years old (default body weight of 22 kg) and adults for individuals with diabetes mellitus and nephrogenic diabetes insipidus. In estimating the total exposure, the high-end water intake rates from Table 2-4 are used to calculate the exposure from drinking water. The total exposures for adult athletes and workers are 0.084, 0.154, and 0.294 mg/kg/day at 1, 2, and 4 mg/L of fluoride in water, respectively. These doses are approximately two times those of the adults with a default water intake rate of 2 L/day. For individuals with nephrogenic diabetes insipidus, the respective total fluoride exposures for children (3-5 years old) and adults are 0.184 and 0.164 mg/kg/ day at 1 mg/L, 0.334 and 0.314 mg/kg/day at 2 mg/L, and 0.634 and 0.614 mg/kg/day at 4 mg/L. Compared to the exposure of children 1-2 years old, who have the highest total exposure among all age groups of the general population (i.e., 0.139-0.439 mg/kg/day at 1-4 mg/L, assuming EPA’s 100 mL/kg/day default water intake rate for children), the highest estimated total exposure among these high water intake individuals (i.e., 0.184-0.634 mg/kg/day for children 3-5 years old with nephrogenic diabetes insipidus, assuming 150 mL/kg/day high-end water intake rate) are 32-44% higher.
The relative contributions from each source of exposure are also presented in Tables 2-13, 2-14, and 2-15. For an average individual, the model-estimated drinking-water contribution to the total fluoride exposure is 41-83% at 1 mg/L in tap water, 57-90% at 2 mg/L, and 72-94% at 4mg/L in tap water (see also Figures 2-1, 2-2, and 2-3). Assuming that all drinking-water sources (tap and nontap) contain the same fluoride concentration and using the EPA default drinking-water intake rates, the drinking-water contribution is 67-92% at 1 mg/L, 80-96% at 2 mg/L, and 89-98% at 4 mg/L. The drinking-water contributions for the high water intake individuals among adult athletes and workers, and individuals with diabetes mellitus and nephrogenic diabetes insipidus, are 75-91% at 1 mg/L, 86-96% at 2 mg/L, and 92-98% at 4 mg/L.
As noted earlier, these estimates were based on the information that was available to the committee as of April 2005. Any new and significant sources of fluoride exposure are expected to alter the percentage of drinking-water contribution as presented in this chapter. However, water will still be the most significant source of exposure.
BIOMARKERS OF EXPOSURE, EFFECT, AND SUSCEPTIBILITY
Biological markers, or biomarkers, are broadly defined as indicators of variation in cellular or biochemical components or processes, structure, or function that are measurable in biological systems or samples (NRC 1989a). Biomarkers often are categorized by whether they indicate exposure to an agent, an effect of exposure, or susceptibility to the effects of exposure (NRC 1989a). Vine (1994) described categories of biological markers in terms of internal dose, biologically effective dose, early response, and disease, plus susceptibility factors that modify the effects of the exposure. Factors that must be considered in selecting a biomarker for a given study include the objectives of the study, the availability and specificity of potential markers, the feasibility of measuring the markers (including the invasiveness of the necessary techniques and the amount of biological specimen needed), the time to appearance and the persistence of the markers in biological media, the variability of marker concentrations within and between individuals, and aspects (e.g., cost, sensitivity, reliability) related to storage and analysis of the samples (Vine 1994). ATSDR (2003) recently reviewed biomarkers of exposure and effect for fluoride.
Biomarkers of exposure to fluoride consist of measured fluoride concentrations in biological tissues or fluids that can be used as indices of an individual’s exposure to fluoride. For fluoride, concentrations in a number of tissues and fluids, including teeth, bones, nails, hair, urine, blood or plasma, saliva, and breast milk, have been used to estimate exposures (Vine 1994; Whitford et al. 1994; ATSDR 2003). Table 2-16 gives examples of measurements in humans together with the associated estimates of exposure. The Centers for Disease Control and Prevention (CDC 2003, 2005) has measured a number of chemicals in blood or urine of members of the U.S. population, but thus far fluoride has not been included in their survey.
Fluoride concentrations in bodily fluids (e.g., urine, plasma, serum, saliva) are probably most suitable for evaluating recent or current fluoride exposures or fluoride balance (intake minus excretion), although some sources indicate that samples obtained from fasting persons may be useful for estimating chronic fluoride intake or bone fluoride concentrations (e.g., Ericsson et al. 1973; Waterhouse et al. 1980). Examples of the association between estimated fluoride intakes (or mass-normalized intakes) and measured fluoride concentrations in urine, plasma, and serum for individuals and groups are shown in Figures 2-4, 2-5, 2-6, and 2-7. Note that in most cases, the variation in fluoride intake is not sufficient to explain the variation in the measured fluoride concentrations. A number of parameters affect individual fluoride uptake, retention, and excretion (Chapter 3) (Whitford 1996). In addition, a significant decrease in fluoride exposure might not be
TABLE 2-16 Summary of Selected Biomarkers for Fluoride Exposure in Humans
|
Fluoride Exposure |
Number of Persons |
Fluoride Concentration |
Reference |
|
Urine |
|||
|
1.2-2.2 mg/day |
5 |
0.8-1.2 mg/day |
Teotia et al. 1978 (Figure 2-4) |
|
2.5-3.8 mg/daya |
2 |
1.2-2.2 mg/day |
|
|
8.7-9.2 mg/day |
3 |
3.2-5.8 mg/day |
|
|
21.0-28.0 mg/day |
2 |
10.0-11.0 mg/day |
|
|
48.0-52.0 mg/day |
2 |
15.0-18.5 mg/day |
|
|
1.0 mg/L in drinking water |
17 |
1.5 (0.2) mg/L |
Bachinskii et al. 1985 (Figure 2-6) |
|
|
|
1.9 (0.3) mg/day |
|
|
2.3 mg/L in drinking water |
30 |
2.4 (0.2) mg/L |
|
|
|
|
2.7 (0.2) mg/day |
|
|
0.09 (range, 0.06-0.11) mg/L in drinking water |
45 |
0.15 (0.07) mg/Lb |
Schamschula et al. 1985 (Figure 2-6) |
|
0.82 (range, 0.5-1.1) mg/L in drinking water |
53 |
0.62 (0.26) mg/Lb |
|
|
1.91 (range, 1.6-3.1) mg/L in drinking water |
41 |
1.24 (0.52) mg/Lb |
|
|
0.32 mg/L in drinking water |
100 |
0.77 (0.49) mg/Lb |
Czarnowski et al. 1999 (Figure 2-6) |
|
1.69 mg/L in drinking water |
111 |
1.93 (0.82) mg/Lb |
|
|
2.74 mg/L in drinking water |
89 |
2.89 (1.39) mg/Lb |
|
|
About 3 mg/day |
1 |
2.30-2.87 mg/day |
Whitford et al. 1999a |
|
About 6 mg/day |
1 |
4.40-5.13 mg/day |
|
|
7.35 (1.72) mg/dayb |
50 |
9.45 (4.11) mg/Lb |
Gupta et al. 2001 (Figure 2-7) |
|
11.97 (1.8) mg/dayb |
50 |
15.9 (9.98) mg/Lb |
|
|
14.45 (3.19) mg/daya |
50 |
17.78 (7.77) mg/La |
|
|
32.56 (9.33) mg/daya |
50 |
14.56 (7.88) mg/La |
|
|
11 |
0.91 (0.45) mg/Lb |
Haftenberger et al. 2001 (Figure 2-5) |
|
|
1.190 (0.772) mg/day from all sourcesb |
20 |
0.481 (0.241) mg/dayb |
Pessan et al. 2005 |
|
Plasma |
|||
|
1.2-2.2 mg/day |
5 |
0.020-0.038 mg/L |
Teotia et al. 1978 (Figure 2-4) |
|
2.5-3.8 mg/day |
2 |
0.036-0.12 mg/L |
|
|
8.7-9.2 mg/day |
3 |
0.15-0.18 mg/L |
|
|
21.0-28.0 mg/day |
2 |
0.11-0.17 mg/L |
|
|
48.0-52.0 mg/day |
2 |
0.14-0.26 mg/L |
|
|
Serum |
|||
|
1.0 mg/L in drinking water |
17 |
0.21 (0.01) mg/L |
Bachinskii et al. 1985 (Figure 2-6) |
|
2.3 mg/L in drinking water |
30 |
0.25 (0.01) mg/L |
|
|
7.35 (1.72) mg/dayb |
50 |
0.79 (0.21) mg/Lb |
Gupta et al. 2001 (Figure 2-7) |
|
11.97 (1.8) mg/dayb |
50 |
1.10 (0.58) mg/Lb |
|
|
14.45 (3.19) mg/dayb |
50 |
1.10 (0.17) mg/Lb |
|
|
32.56 (9.33) mg/dayb |
50 |
1.07 (0.17) mg/Lb |
|
|
Fluoride Exposure |
Number of Persons |
Fluoride Concentration |
Reference |
|
0.3 mg/L in drinking water: Breastfed infants |
48 |
0.0042 (0.0027) mg/Lb |
Hossny et al. 2003 |
|
All infants (4 weeks-2 years) |
97 |
0.0051 (0.0030) mg/Lb |
|
|
Preschoolers (2-6 years) |
100 |
0.011 (0.0049) mg/Lb |
|
|
Primary schoolers (6-12 years) |
99 |
0.010 (0.0042) mg/Lb |
|
|
Saliva |
|||
|
0.09 (range, 0.06-0.11) mg/L in drinking water |
45 |
6.25 (2.44) µg/Lb |
Schamschula et al. 1985 |
|
0.82 (range, 0.5-1.1) mg/L in drinking water |
53 |
11.23 (4.29) µg/Lb |
|
|
1.91 (range, 1.6-3.1) mg/L in drinking water |
41 |
15.87 (6.01) µg/Lb |
|
|
0.1 mg/L in drinking water |
27 |
1.9-55.1 µg/L |
Oliveby et al. 1990 |
|
1.2 mg/L in drinking water |
27 |
1.9-144 µg/L |
Oliveby et al. 1990 |
|
Plaque |
|||
|
0.09 (range, 0.06-0.11) mg/L in drinking water |
45 |
5.04 (4.60) ppmb |
Schamschula et al. 1985 |
|
0.82 (range, 0.5-1.1) mg/L in drinking water |
53 |
8.47 (9.69) ppmb |
|
|
1.91 (range, 1.6-3.1) mg/L in drinking water |
41 |
19.6 (19.3) ppmb |
|
|
Hair |
|||
|
0.09 (range, 0.06-0.11) mg/L in drinking water |
45 |
0.18 (0.07) µg/gb |
Schamschula et al. 1985 |
|
0.82 (range, 0.5-1.1) mg/L in drinking water |
53 |
0.23 (0.11) µg/gb |
|
|
1.91 (range, 1.6-3.1) mg/L in drinking water |
41 |
0.40 (0.25) µg/gb |
|
|
0.27 mg/L in drinking water and 2.8 µg/m3 in air |
59 |
1.35 (0.95) µg/gb |
Hac et al. 1997 |
|
0.32 mg/L in drinking water |
53 |
4.13 (2.24) µg/gb |
Czarnowski et al. 1999 |
|
1.69 mg/L in drinking water |
111 |
10.25 (6.63) µg/gb |
|
|
2.74 mg/L in drinking water |
84 |
14.51 (6.29) µg/gb |
|
|
Breast milk |
|||
|
0.2 mg/L in drinking water |
47 |
0.0053 mg/L (colostrum) |
Spak et al. 1983 |
|
Fluoride Exposure |
Number of Persons |
Fluoride Concentration |
Reference |
|
1.0 mg/L in drinking water |
79 |
0.0068 mg/L (colostrum) |
|
|
1.0 mg/L in drinking water |
17 |
0.007 mg/L (mature milk) |
|
|
Nonfluoridated community |
32 |
0.0044 mg/L |
Dabeka et al. 1986 |
|
1 mg/L in drinking water |
112 |
0.0098 mg/L |
|
|
22.1 mg/day (mean) |
27 |
0.011-0.073 mg/L |
Opinya et al. 1991 |
|
0.3 mg/L in drinking water |
60 |
0.0046 (0.0025) mg/Lb |
Hossny et al. 2003 |
|
Fingernails |
|||
|
0.09 (range, 0.06-0.11) mg/L in drinking water |
45 |
0.79 (0.26) ppmb |
Schamschula et al. 1985 |
|
0.82 (range, 0.5-1.1) mg/L in drinking water |
53 |
1.31 (0.49) ppmb |
|
|
1.91 (range, 1.6-3.1) mg/L in drinking water |
41 |
2.31 (1.14) ppmb |
|
|
About 3 mg/day |
1 |
1.94-3.05 mg/kg |
Whitford et al. 1999a |
|
About 6 mg/day (after 3.5 months) |
1 |
4.52-5.38 mg/kg |
|
|
0.1 mg/L in drinking water |
10 |
0.75-3.53 mg/kg |
|
|
1.6 mg/L in drinking water |
6 |
2.28-7.53 mg/kg |
|
|
2.3 mg/L in drinking water |
9 |
4.00-13.18 mg/kg |
|
|
0.7-1.0 mg/L in drinking water, without fluoride dentifrice |
10 |
2.3-7.3 mg/kg |
Corrêa Rodrigues et al. 2004 |
|
0.7-1.0 mg/L in drinking water, with fluoride dentifrice (after 4 months) |
10 |
10.1 mg/kg (peak) |
|
|
0.004 ± 0.003 mg/kg/day |
15 |
0.42-6.11 µg/g |
Levy et al. 2004 |
|
0.029 ± 0.029 mg/kg/day |
15 |
0.87-7.06 µg/g |
|
|
Toenails |
|||
|
0.09 mg/L in drinking water |
|
4.2 ppm |
Feskanich et al. 1998 |
|
1.0 mg/L in drinking water |
|
6.4 ppm |
|
|
3 mg/day |
1 |
1.41-1.60 mg/kg |
Whitford et al. 1999a |
|
0.7-1.0 mg/L in drinking water, without fluoride dentifrice |
10 |
2.5-5.6 mg/kg |
Corrêa Rodrigues et al. 2004 |
|
0.7-1.0 mg/L in drinking water, with fluoride dentifrice (after 4 months) |
10 |
9.2 mg/kg (peak) |
|
|
0.004 ± 0.003 mg/kg/day |
15 |
0.08-3.89 µg/g |
Levy et al. 2004 |
|
0.029 ± 0.029 mg/kg/day |
15 |
0.81-6.38 µg/g |
|
|
Teeth |
|||
|
Normal |
NA |
190-300 ppm (total ash) |
Roholm 1937 |
|
Fluoride Exposure |
Number of Persons |
Fluoride Concentration |
Reference |
|
Cryolite workers |
5 |
1,100-5,300 ppm (total ash) |
|
|
Enamel (0.44-0.48 µm depth) |
|||
|
0.09 (range, 0.06-0.11) mg/L in drinking water |
45 |
1,549 (728) ppmb |
Schamschula et al. 1985 |
|
0.82 (range, 0.5-1.1) mg/L in drinking water |
53 |
2,511 (1,044) ppmb |
|
|
1.91 (range, 1.6-3.1) mg/L in drinking water |
41 |
3,792 (1,362) ppmb |
|
|
Enamel (2.44-2.55 µm depth) |
|||
|
0.09 (range, 0.06-0.11) mg/L in drinking water |
45 |
641 (336) ppmb |
Schamschula et al. 1985 |
|
0.82 (range, 0.5-1.1) mg/L in drinking water |
53 |
1,435 (502) ppmb |
|
|
1.91 (range, 1.6-3.1) mg/L in drinking water |
41 |
2,107 (741) ppmb |
|
|
Enamel |
|||
|
0.7 or 1.0 mg/L in drinking water |
30 |
0-192 µg/g |
Vieira et al. 2005 |
|
Dentin |
|||
|
0.7 or 1.0 mg/L in drinking water |
30 |
59-374 µg/g |
Vieira et al. 2005 |
|
Bones |
|||
|
Normal |
NA |
480-2,100 ppm in bone ash (ribs) |
Roholm 1937 |
|
Cryolite workers |
2 |
9,900 and 11,200 ppm in bone ash (ribs) ranges (ppm in bone ash, various bone types, 3,100-9,900 and 8,100-13,100 in the 2 individuals |
|
|
0.1-0.4 mg/L in drinking water |
33 |
326-2,390 ppm in bone ashc |
Zipkin et al. 1958 |
|
1.0 mg/L in drinking water |
5 |
1,610-4,920 ppm in bone ashd |
|
|
2.6 mg/L in drinking water |
27 |
1,560-10,800 ppm in bone ashe |
|
|
4.0 mg/L in drinking water |
4 |
4,780-11,000 ppm in bone ashf |
|
|
Fluoride Exposure |
Number of Persons |
Fluoride Concentration |
Reference |
|
< 0.2 mg/L in drinking water since infancy |
8 |
1,379 (179) ppm in bone ashg |
Eble et al. 1992 |
|
1 mg/L in drinking water at least 23 years or since infancy |
9 |
1,775 (313) ppm in bone ashg |
|
|
0.27 mg/L in drinking water and 2.8 µg/m3 in air |
59 |
Hac et al. 1997 |
|
|
0.7 or 1.0 mg/L in drinking water |
30 |
0-396 ppmi |
Vieira et al. 2005 |
|
aPrevious exposure of 30-38 mg/day, 2-5 years before study. bMean and standard deviation. cReported as 0.019-0.119% in bone, with ash content of 43.2-68.4%. dReported as 0.100-0.238% in bone, with ash content of 45.9-62.2%. eReported as 0.092-0.548% in bone, with ash content of 32.7-66.7%. fReported as 0.261-0.564% in bone, with ash content of 44.3-62.8%. gMean and standard error of the mean. hReported as µg fluoride per gram bone; appears to be dry weight of bone, not bone ash. iMeasured by Instrumental Neutron Activation Analysis; appears to be wet weight of bone. ABBREVIATION: NA, not available. |
|||
reflected immediately in urine or plasma, presumably because of remobilization of fluoride from resorbed bone.14
Concentrations of salivary fluoride (as excreted by the glands) are typically about two-thirds of the plasma fluoride concentration and independent of the salivary flow rate (Rölla and Ekstrand 1996); fluoride in the mouth from dietary intake or dentifrices also affects the concentrations measured in whole saliva. Significantly higher concentrations of fluoride were found in whole saliva and plaque following use of a fluoridated dentifrice versus a nonfluoridated dentifrice by children residing in an area with low fluoride (<0.1 mg/L) in drinking water. Concentrations were 15 times higher in whole saliva and 3 times higher in plaque, on average, 1 hour after use of the dentifrice (Whitford et al. 2005). Whitford et al. (1999b) found that whole-saliva fluoride concentrations in 5- to 10-year-old children were not signifi-
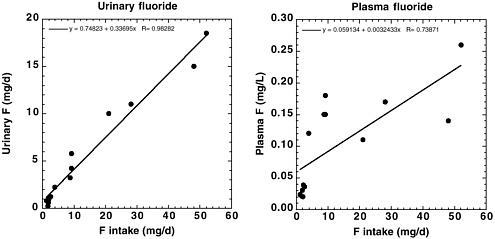
FIGURE 2-4 Urinary fluoride excretion (left) and fasting plasma fluoride concentration (right) as functions of current daily fluoride intake for individual adults (nine males, five females) aged 18-58 years. Data from Teotia et al. 1978.
cantly related to those in either plasma or parotid ductal saliva. However, fluoride concentrations in parotid ductal saliva were strongly correlated to the plasma fluoride concentrations (r = 0.916), with a saliva-to-plasma fluoride concentration ratio of 0.80 (SE = 0.03, range from 0.61 to 1.07). For three-quarters of the study population (13 of 17), the fluoride concentration in parotid ductal saliva could be used to estimate plasma fluoride concentrations within 20% or less, and the largest difference was 32%.
Measured fluoride concentrations in human breast milk have been correlated with the mother’s fluoride intake in some studies (Dabeka et al. 1986) and not well correlated in other studies (Spak et al. 1983; Opinya et al. 1991). In general, measurements of fluoride in breast milk would be of limited use in exposure estimation because of the very low concentrations even in cases of high fluoride intake, lack of a consistent correlation with the mother’s fluoride intake, and limitation of use to those members of a population who are lactating at the time of sampling.
Schamschula et al. (1985) found increasing concentrations of fluoride in urine, nails, hair, and saliva with increasing water fluoride concentration in a sample of Hungarian children, but fluoride contents were not directly proportional to the water fluoride content. Although means were significantly different between groups, there was sufficient variability among individuals within groups that individual values between groups overlapped. Feskanich et al. (1998) used toenail fluoride as an indicator of long-term
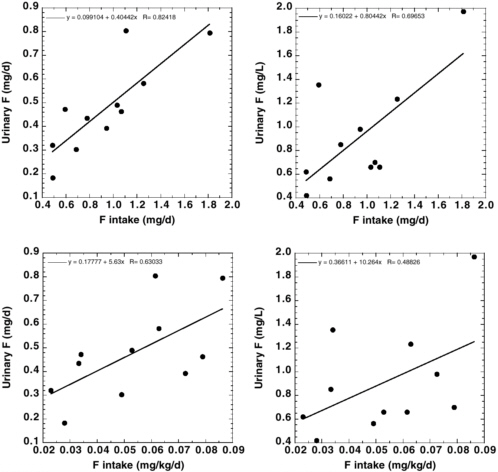
FIGURE 2-5 Urinary fluoride excretion (left) and concentration (right) as functions of current daily fluoride intake (top) or body-weight normalized intake (bottom) for individual children (six boys, five girls) aged 3-6 years. Data from Haftenberger et al. 2001.
fluoride intake and considered it to be a better long-term marker than plasma concentrations.
Whitford et al. (1999a) found a direct relationship between fluoride concentrations in drinking water and fluoride concentrations in fingernail clippings from 6- to 7-year-old children with no known fluoride exposure other than from drinking water. In nail samples from one adult, Whitford et al. (1999a) also found that an increase in fluoride intake was reflected in fingernail fluoride concentrations approximately 3.5 months later and that toenails had significantly lower fluoride concentrations than fingernails. Levy et al. (2004) also found higher fluoride concentrations in fingernails
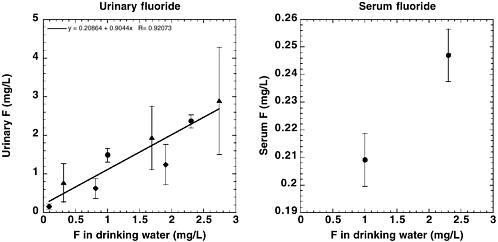
FIGURE 2-6 Urinary (left) and serum (right) fluoride concentrations as functions of fluoride concentration in drinking water. Dark symbols indicate means of groups; vertical lines indicate 1 standard deviation from the mean. Data from Bachinskii et al. (1985; circles), Schamschula et al. (1985; diamonds), and Czarnowski et al. (1999; triangles). Data from Bachinskii et al. represent 47 adults (ages 19-59); data from Schamschula et al. represent children aged 14 years; and data from Czarnowski et al. represent adults (ages 24-77, mean age 50).
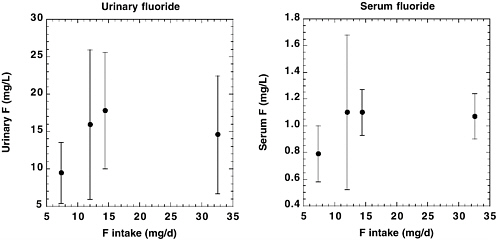
FIGURE 2-7 Urinary (left) and serum (right) fluoride concentrations as functions of estimated daily fluoride intake (data from Gupta et al. 2001). Dark circles indicate means of groups of 50 children (ages 6-12); vertical lines indicate 1 standard deviation from the mean.
than in toenails in 2- to 6-year old children and showed a correlation between nail concentrations and dietary fluoride intake (exclusive of fluoride in toothpaste). Plasma fluoride in these children was not correlated with fluoride in fingernails, toenails, diet, or drinking water.
In contrast, Corrêa Rodrigues et al. (2004), in samples from 2- to 3-year-old children, found no significant differences in fluoride concentrations between fingernails and toenails collected at the same time. An increase in fluoride intake in these children was reflected in nail samples approximately 4 months later (Corrêa Rodrigues et al. 2004). Most likely, differences in “lag times” and differences between fingernails and toenails in the same individual reflect differences in growth rates of the nails due to factors such as age or differences in blood flow. McDonnell et al. (2004) found a wide variation in growth rates of thumbnails of 2- and 3-year-old children; age, gender, and fluoride exposure had no effect on the growth rates. However, it was emphasized that, for any study in which it is of interest to estimate the timing of a fluoride exposure based on measurements of fluoride in nails, the growth rate of the nails should be measured for each individual.
Czarnowski et al. (1999) found correlations between water fluoride concentrations and urinary fluoride, fluoride in hair, and bone mineral density measured in 300 people in the Gdánsk region of Poland. For workers with occupational exposure to airborne fluoride (largely HF), Czarnowski and Krechniak (1990) found good correlation among groups of workers between fluoride concentrations in urine and nails (r = 0.99); correlation between concentrations in urine and hair or hair and nails was also positive but not as good (r = 0.77 and 0.70, respectively). For individual values, positive correlation was found only between concentrations in urine and nails (r = 0.73). It was not possible to establish correlations between fluoride concentrations in biological media and air (Czarnowski and Krechniak 1990).
Measuring the fluoride content of teeth and bones can give an indication of chronic or cumulative fluoride exposure, although after cessation of fluoride exposure, bone fluoride concentrations slowly decrease because of resorption of bone. In addition, bone turnover results in the accumulation of various concentrations of fluoride in different bone types and sites (Selwitz 1994). Dentin has also been suggested as a reasonably accurate marker for long-term exposure (Selwitz 1994), although Vieira et al. (2005) found no correlation between bone fluoride and either enamel or dentin fluoride in persons with exposure to 0.07 or 1.0 mg/L fluoride in drinking water.
Roholm (1937) reported that the fluoride content in normal teeth varied from 190 to 300 ppm (0.19 to 0.30 mg/g) in the total ash, with 5-7 times as much fluoride in the dentin as in the enamel. Fluoride content in the total ash of teeth from five cryolite workers (employed 8-10 years; three with osteosclerosis) contained 1,100-5,300 ppm (1.1-5.3 mg/g), with the most carious teeth containing the most fluoride. Roholm (1937) also reported
normal bone fluoride concentrations of 480-2,100 ppm in bone ash (0.48-2.1 mg/g bone ash in ribs), with concentrations between 3,100 and 13,100 ppm in bone ash (3.1 and 13.1 mg/g bone ash; varying with type of bone) in two cryolite workers. Hodge and Smith (1965), summarizing several reports, listed mean concentrations of bone fluoride in normal individuals between 450 and 1,200 ppm in bone ash and in people “suffering excessive exposure” to fluorides between 7,500 and 20,830 ppm in bone ash. More recently, Eble et al. (1992) have reported fluoride concentrations in bone ash ranging from 378 ppm (16-year old with <0.2 mg/L fluoride in drinking water since infancy) to 3,708 ppm (79-year old with fluoridated water). A 46-year old female with chronic renal failure had a fluoride concentration in bone ash of 3,253 ppm (Eble et al. 1992).
The data of Zipkin et al. (1958) shows a good relationship between drinking-water fluoride and the mean percentage of fluoride in bone (iliac crest, rib, and vertebra) for adults in areas of various fluoride concentrations in drinking water. However, the ranges (Table 2-16; see also Chapter 3, Figure 3-1) suggest that variability among individuals within groups could be large, probably reflecting variability in individual fluoride intakes, duration of exposure, and age. A major disadvantage of measuring bone fluoride is the invasiveness of bone sampling in live individuals. Although easier to do, x-ray screening for increased bone density should be done only when the need for information justifies the radiation dose involved; in addition, bone density might not be related solely to fluoride exposure or to bone fluoride content.
The two most important biomarkers of effect for fluoride are considered to be enamel fluorosis and skeletal fluorosis (ATSDR 2003); these are discussed more fully in Chapters 4 and 5. Enamel fluorosis is characterized by mottling and erosion of the enamel of the teeth and is associated with elevated fluoride intakes during the childhood years when the teeth are developing. According to the U.S. Public Health Service (PHS 1991), both the percent prevalence and the increasing severity of enamel fluorosis are associated with increasing fluoride concentration in drinking water (and presumably actual fluoride intake). For “optimally” fluoridated water (0.7-1.2 mg/L), 22% of children examined in the 1980s showed some fluorosis (mostly very mild or mild); at water fluoride concentrations above 2.3 mg/L, more than 70% of children showed fluorosis (PHS 1991; NRC 1993). Some children developed fluorosis even at the lowest fluoride concentrations (<0.4 mg/L), suggesting that either fluoride intakes are variable within a population with the same water supply or there is variability in the susceptibility to fluorosis within populations (or both). Baelum et al. (1987) indicated that 0.03 mg/kg/day might not be protective against enamel fluorosis, and Fejerskov et al. (1987) stated that the borderline dose above which enamel fluorosis might develop could be as low as 0.03 mg/kg/day.
DenBesten (1994) described the limitations of using enamel fluorosis as a biomarker of exposure: enamel fluorosis is useful only for children less than about 7 years old when the exposure occurred; the incidence and degree of fluorosis vary with the timing, duration, and concentration; and there appear to be variations in individual response. Selwitz (1994), summarizing a workshop on the assessment of fluoride accumulation, also indicated that variability in response (incidence and severity of enamel fluorosis) to fluoride exposure may result from physiological differences among individuals and that enamel fluorosis is not an adequate biomarker for fluoride accumulation or potentially adverse health effects beyond the period of tooth formation. Selwitz (1994) did suggest that enamel fluorosis could be used as a biomarker of fluoride exposure in young children within a community over time.
Skeletal fluorosis (see also Chapter 5) is characterized by increased bone mass, increased radiographic density of the bones, and a range of skeletal and joint symptoms; preclinical skeletal fluorosis is associated with fluoride concentrations of 3,500-5,500 ppm in bone ash and clinical stages I, II, and III with concentrations of 6,000-7,000, 7,500-9,000, and >8,400, respectively (PHS 1991), although other sources indicate lower concentrations of bone fluoride in some cases of skeletal fluoride (see Chapter 5). According to the Institute of Medicine, “Most epidemiological research has indicated that an intake of at least 10 mg/day [of fluoride] for 10 or more years is needed to produce clinical signs of the milder forms of [skeletal fluorosis]” (IOM 1997). However, the National Research Council (NRC 1993) indicated that crippling (as opposed to mild) skeletal fluorosis “might occur in people who have ingested 10-20 mg of fluoride per day for 10-20 years.” A previous NRC report (NRC 1977) stated that a retention of 2 mg of fluoride per day (corresponding approximately to a daily intake of 4-5 mg) “would mean that an average individual would experience skeletal fluorosis after 40 yr, based on an accumulation of 10,000 ppm fluoride in bone ash.” Studies in other countries indicate that skeletal fluorosis might be in part a marker of susceptibility as well as exposure, with factors such as dietary calcium deficiency involved in addition to fluoride intake (Pettifor et al. 1989; Teotia et al. 1998).
Hodge and Smith (1965) summarized a number of studies of skeletal fluorosis, including two that indicated affected individuals in the United States with water supplies containing fluoride at 4.8 or 8 mg/L. They also stated categorically that “crippling fluorosis has never been seen in the United States.” The individuals with endemic fluorosis at 4.8 mg/L are referred to elsewhere as having “radiographic osteosclerosis, but no evidence of skeletal fluorosis” (PHS 1991). In combination with high fluid intake and large amounts of tea, “the lowest drinking-water concentration of fluoride
associated with symptomatic skeletal fluorosis that has been reported to date is 3 ppm, outside of countries such as India” (NRC 1977).
Both the PHS (1991) and the NRC (1993) indicated that only five cases of crippling skeletal fluorosis have been reported in the literature in the United States (including one case in a recent immigrant from an area with fluoride in the drinking water at 3.9 mg/L) (PHS 1991). These individuals were said to have water supplies ranging from 3.9 to 8.0 mg/L (water fluoride content given for one of the individuals is actually less than 3.9 mg/L) (PHS 1991). Two of the individuals had intakes of up to 6 L/day of water containing fluoride at 2.4-3.5 or 4.0-7.8 mg/L (PHS 1991; NRC 1993); this corresponds to fluoride intakes of up to 14.4-21 or 24-47 mg/day.
Several cases of skeletal fluorosis reported in the United States are summarized in Table 2-17. These reports indicate that a fluoride concentration of 7-8 mg/L for 7 years is sufficient to bring about skeletal fluorosis (Felsenfeld and Roberts 1991), but skeletal fluorosis may occur at much lower fluoride concentrations in cases of renal insufficiency (Juncos and Donadio 1972; Johnson et al. 1979). People who consume instant tea are at increased risk of developing skeletal fluorosis, especially if they drink large volumes, use extra-strength preparations, or use fluoridated or fluoride-contaminated water (Whyte et al. 2005).
In summary, selecting appropriate biomarkers for a given fluoride study depends on a number of factors, as listed above. A major consideration is the time period of interest for the study (e.g., current or recent exposures versus exposures in childhood versus cumulative exposures) and whether the intent is to demonstrate differences among groups or to characterize exposures of specific individuals. Many of the areas for further research identified by a 1994 workshop (Whitford et al. 1994) are still relevant for improving the assessment of fluoride exposures.
FINDINGS
Table 2-18 summarizes various published perspectives on the significance of given concentrations of fluoride exposure. Historically, a daily intake of 4-5 mg by an adult (0.057-0.071 mg/kg for a 70-kg adult) was considered a “health hazard” (McClure et al. 1945, cited by Singer et al. 1985). However, the Institute of Medicine (IOM 1997) now lists 10 mg/day as a “tolerable upper intake” for children > 8 years old and adults, although that intake has also been associated with the possibility of mild (IOM 1997) or even crippling (NRC 1993) skeletal fluorosis.
The recommended optimal fluoride intake for children to maximize caries prevention and minimize the occurrence of enamel fluorosis is often stated as being 0.05-0.07 mg/kg/day (Levy 1994; Heller et al. 1999, 2000). Burt (1992) attempted to track down the origin of the estimate of 0.05-0.07
TABLE 2-17 Case Reports of Skeletal Fluorosis in the United States
|
Study Subjects |
Exposure Conditions |
Comments |
Reference |
|
(a) 18-year-old boy, 57.4 kg (b) 17-year-old girl, 45.65 kg |
(a) “high” intake of well water containing fluoride at 2.6 mg/L since early childhood; current intake, 7.6 L/day (0.34 mg/kg/day) (b) “high” intake of water containing fluoride at 1.7 mg/L since infancy; current intake, 4 L/day (0.15 mg/kg/day) |
Enamel fluorosis and roentgenographic bone changes consistent with “systemic fluorosis,” attributed to the combination of renal insufficiency and polydipsia (the latter resulting from the renal disease); reported by the Mayo Clinic |
Juncos and Donadio 1972 |
|
Six renal patients seen at the Mayo Clinic over a several year period (includes the two patients reported by Juncos and Donadio) |
Drinking water with 1.7-3 mg/L fluoride; water consumption not stated, but urine volumes of “most” of the patients exceeded 3 L/day |
Fluoride “may have been the cause of detectable clinical and roentgenographic effects” Five of the patients had renal disease of at least 15 years duration before skeletal symptoms developed |
Johnson et al. 1979 |
|
54-year-old woman in Oklahoma |
Well water with fluoride concentration of 7.3-8.2mg/L (382-429 µmol/L); duration of residence at that location, 7 years; prior to that she had used municipal water at less than 2 mg/L fluoride; water consumption not reported, but considered likely to be “increased” due to hot summers |
Osteosclerosis, elevated serum alkaline phosphatase, stiffness of knees and hips (2 years duration), kyphosis Renal insufficiency was not a factor |
Felsenfeld and Roberts 1991 |
|
52-year-old woman in Missouri |
Daily consumption of 1-2 gallons (3.8-7.6 L) per day of double-strength instant tea made with unfiltered well water (2.8 mg/L fluoride in the well water) for close to 10 years; estimated fluoride intake of 37-74 mg/day (11-22 mg/day from well water and 26-52 mg/day from tea) |
Osteosclerosis, increased bone mineral density, bone and joint pains Intake of fluoride from well water alone was considered sufficient to cause mild skeletal fluorosis No mention of any renal disease |
Whyte et al. 2005 |
TABLE 2-18 Summary of Current and Historical Perspectives on Fluoride Exposure
|
Exposure, mg/kg/day |
Description |
Reference |
|
0.0014 |
“Adequate intake” for children < 6 months olda (0.01 mg/day) |
IOM 1997; ADA 2005 |
|
0.01-0.04 |
Average daily dietary fluoride intake for children 0-2 years old residing in nonfluoridated areas (< 0.4 mg/L) |
IOM 1997b |
|
0.017-0.031 |
Average daily intake by adults in a fluoridated area (1.2-2.2 mg/day)c |
NRC 1993 |
|
0.017-0.054 |
Lower end of “safe and adequate daily dietary intake” for children ≥ 0-10 yearsd (0.1-1.5 mg/day) |
NRC 1989b |
|
0.019-0.033 |
Lower end of “safe and adequate daily dietary intake” for children 10 years and adultsd (1.5 mg/day) |
NRC 1989b |
|
0.02-0.10 |
Average daily dietary fluoride intake for children 1-9 years residing in fluoridated areas (0.7-1.1 mg/L) |
McClure 1943e |
|
0.038-0.069 |
Upper end of “safe and adequate daily dietary intake” for children ≥ 10 years and adultsd (2.5-4.0 mg/day) |
NRC 1989b |
|
0.04-0.07 |
Average daily intake by children in a fluoridated area |
NRC 1993 |
|
0.05 |
IOM 1997; ADA 2005 |
|
|
0.05 |
ATSDR’s minimal risk levelg (chronic duration, based on increased rate of bone fractures)h |
ATSDR 2003 |
|
0.05-0.13 |
Average daily dietary fluoride intake for children 0-2 years old residing in fluoridated areas (0.7-1.1 mg/L) |
IOM 1997b |
|
0.05-0.07 |
“Optimal” intake to maximize caries prevention and minimize the occurrence of enamel fluorosis |
Levy 1994; Heller et al. 1999, 2000 |
|
0.05-0.07 |
“Useful upper limit for fluoride intake in children” |
Burt 1992 |
|
0.057-0.071 |
“Health hazard” for adults (4-5 mg/day)c |
McClure et al. 1945 |
|
0.057 |
EPA’s SMCL (2 mg/l; adult intake)i |
40CFR 143.3[2001] |
|
0.06 |
EPA’s reference dosej (based on protection of children from objectionable enamel fluorosis)k |
EPA 1989 |
|
0.083-0.13 |
Upper end of “safe and adequate daily dietary intake” for children 0-10 years oldd (0.5-2.5 mg/day) |
NRC 1989b |
|
0.10 |
IOM 1997; ADA 2005 |
|
|
0.10 |
EPA’s SMCL (2 mg/L; child intake)m |
40CFR 143.3 [2001] |
|
0.11 |
EPA’s MCLG and MCL (4 mg/L; adult intake)n |
40CFR 141.62(b)[2001] |
|
0.13-0.18 |
IOM 1997; ADA 2005 |
|
|
0.2 |
EPA’s MCLG and MCL (4 mg/L; child intake)p |
40CFR 141.62(b)[2001] |
|
Exposure, mg/kg/day |
Description |
Reference |
|
0.25 |
IOM 1997; ADA 2005 |
|
|
aBased on intakes and average body weights listed by IOM (1997) and ADA (2005); see Table B-17 in Appendix B. bSummaries of papers published between 1979 and 1988 (IOM 1997). cBased on a 70-kg adult. dBased on intakes and median weights listed by NRC (1989b); see Table B-16 in Appendix B. eSummarized by IOM (1997). fRange, 0.045-0.056 mg/kg/day. gA minimal risk level (MRL) is an estimate of the daily human exposure to a hazardous substance that is likely to be without appreciable risk of adverse noncancer health effects over a specified duration of exposure (ATSDR 2003). hThe ATSDR (2003) states that an intermediate-duration MRL derived from a study of thyroid effects in rats would have been lower (more protective) than the chronic-duration MRL of 0.05, but the value of that MRL is not given. iBased on intake of 2 L/day by a 70-kg adult of water containing fluoride at 2 mg/L. jReference dose (RfD) is an estimate (with uncertainty spanning perhaps an order of magnitude) of a daily oral exposure to the human population (including sensitive subgroups) that is likely to be without an appreciable risk of deleterious effects during a lifetime (EPA 1989). kBased on a fluoride concentration of 1 mg/L in drinking water; the RfD for fluoride contains no uncertainty factor or modifying factor, although RfDs for other substances contain uncertainty factors to account for things such as variability within the human population (EPA 2003b). lBased on moderate enamel fluorosis (IOM 1997). mBased on intake of 1 L/day by a 20-kg child of water containing fluoride at 2 mg/L. nBased on intake of 2 L/day by a 70-kg adult of water containing fluoride at 4 mg/L. oBased on skeletal fluorosis for adults and children ≥ age 9 (IOM 1997). pBased on intake of 1 L/day by a 20-kg child of water containing fluoride at 4 mg/L. |
||
mg/kg/day as an optimum intake of fluoride but was unable to find it. He interpreted the available evidence as suggesting that 0.05-0.07 mg/kg/day (from all sources) “remains a useful upper limit for fluoride intake in children” (see also NRC 1993).
Figure 2-8 shows the average intake of fluoride from all sources estimated in this report (Table 2-11), with 1 mg/L in drinking water; Figure 2-9 shows the average intake of fluoride from drinking water alone (Table 2-10), given a fluoride concentration at the MCLG/MCL (4 mg/L). For comparison purposes, an intake of 0.05-0.07 mg/kg/day is indicated on the graphs.
Based on EPA’s estimates of community water consumption by consumers with an average intake (EPA 2000a), if that water is fluoridated, children
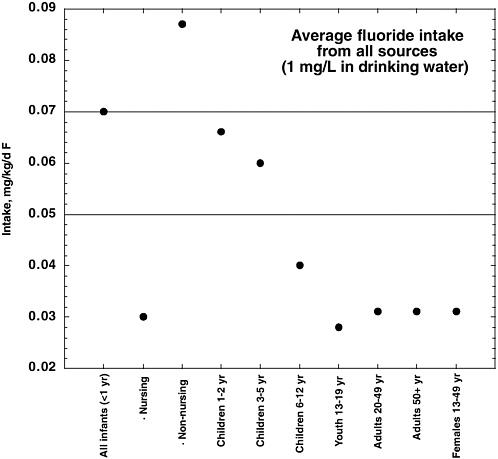
FIGURE 2-8 Estimated average intake of fluoride from all sources, at 1 mg/L in drinking water (based on Table 2-11). Horizontal lines indicate an intake of 0.05-0.07 mg/kg/day.
less than 6 months old have an intake at or above 0.05-0.07 mg/kg/day (see Appendix B, Table B-10). Children from 6 months to 1 year old have similar intakes if their water is fluoridated at 1 or 1.2 mg/L. No other age groups have that intake at ordinary fluoride concentrations; all age groups reach or exceed that intake with water at 4 mg/L. For individuals with higher-than-average intake of community water, intakes for the youngest children (<1 year) might exceed 0.05-0.07 mg/kg/day at all concentrations of water fluoridation (see Appendix B, Tables B-11, B-12, and B-13); for fluoride concentrations corresponding to the SMCL (2 mg/L) or MCL (4 mg/L), an intake of 0.05-0.07 mg/kg/day is reached or exceeded by all age groups. Note that the estimates in Appendix B include only the fluoride contribution from
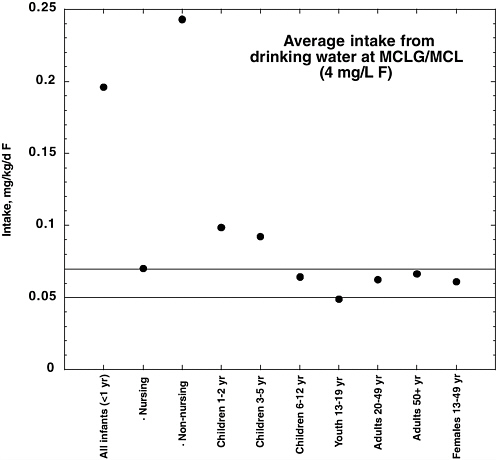
FIGURE 2-9 Estimated average intake of fluoride from drinking water alone, based on a fluoride concentration of 4 mg/L (MCLGl/MCL; based on Table 2-10). Horizontal lines indicate an intake of 0.05-0.07 mg/kg/day.
community water (drinking water, plus beverages and foods prepared with community water at home or in local eating establishments); if contributions from food, tea, commercial beverages, toothpastes, and other sources are added, total intakes by individuals will increase accordingly.
Estimates of total exposure (typical or average) shown in Table 2-11 indicate that all children through age 12 who take fluoride supplements (assuming low water fluoride) will reach or exceed 0.05-0.07 mg/kg/day. For children not on supplements, nonnursing infants with fluoride in tap water at ≥0.5 mg/L will exceed 0.05-0.07 mg/kg/day for typical exposures. Also, children through 5 years old (≥0.5 mg/L in tap water), children 6-12 years old (≥2 mg/L in tap water), and teenagers and adults (≥4 mg/L in tap water) will exceed 0.05-0.07 mg/kg/day with typical or average fluoride exposures in terms of water consumption and toothpaste ingestion.
A number of researchers have pointed out both the importance of evaluating individual fluoride intake from all sources and the difficulties associated with doing so, given the variability of fluoride content in various foods and beverages and the variability of individual intakes of the specific items (Clovis and Hargreaves 1988; Nowak and Nowak 1989; Chan et al. 1990; Stannard et al. 1990, 1991; Weinberger 1991; Toumba et al. 1994; Duperon et al. 1995; Van Winkle et al. 1995; Chan and Koh 1996; Kiritsy et al. 1996; Warren et al. 1996; Heilman et al. 1997, 1999; Heller et al. 1999; Levy and Guha-Chowdhury 1999; Lalumandier and Ayers 2000). However, as shown in Figure 2-1, for typical individuals, the single most important contributor to fluoride exposures (approaching 50% or more) is fluoridated water and other beverages and foods prepared or manufactured with fluoridated water.
RECOMMENDATIONS
-
Fluoride should be included in nationwide biomonitoring surveys and nutritional studies (e.g., CDC’s National Health and Nutrition Examination Survey and affiliated studies). In particular, analysis of fluoride in blood and urine samples taken in these surveys would be valuable.
-
National data on fluoridation (e.g., CDC 1993) should be updated on a regular basis.
-
Probabilistic analysis should be performed for the uncertainty in estimates of individual and group exposures and for population distributions of exposure (e.g., variability with respect to long-term water consumption). This would permit estimation of the number of people exposed at various concentrations, identification of population subgroups at unusual risk for high exposures, identification or confirmation of those fluoride sources with the greatest impact on individual or population exposures, and identification or characterization of fluoride sources that are significant contributors to total exposure for certain population subgroups.
-
To assist in estimating individual fluoride exposure from ingestion, manufacturers and producers should provide information on the fluoride content of commercial foods and beverages.
-
To permit better characterization of current exposures from airborne fluorides, ambient concentrations of airborne hydrogen fluoride and particulates should be reported on national and regional scales, especially for areas of known air pollution or known sources of airborne fluorides. Additional information on fluoride concentrations in soils in residential and recreational areas near industrial fluoride sources also should be obtained.
-
Additional studies on the relationship between individual fluoride exposures and measurements of fluoride in tissues (especially bone and nails) and bodily fluids (especially serum and urine) should be conducted. Such
-
studies should determine both absolute intakes (mg/day) and body-weight normalized intakes (mg/kg/day).
-
Assumptions about the influence of environmental factors, particularly temperature, on water consumption should be reevaluated in light of current lifestyle practices (e.g., greater availability of air conditioning, participation in indoor sports).
-
Better characterization of exposure to fluoride is needed in epidemiology studies investigating potential effects. Important exposure aspects of such studies would include the following:
-
collecting data on general dietary status and dietary factors that could influence exposure or effects, such as calcium, iodine, and aluminum intakes
-
characterizing and grouping individuals by estimated (total) exposure, rather than by source of exposure, location of residence, fluoride concentration in drinking water, or other surrogates
-
reporting intakes or exposures with and without normalization for body weight (e.g., mg/day and mg/kg/day)
-
addressing uncertainties associated with exposure, including uncertainties in measurements of fluoride concentrations in bodily fluids and tissues
-
reporting data in terms of individual correlations between intake and effect, differences in subgroups, and differences in percentages of individuals showing an effect and not just differences in group or population means.
-
-
Further analysis should be done of the concentrations of fluoride and various fluoride species or complexes (especially fluorosilicates and aluminofluorides) present in tap water, using a range of water samples (e.g., of different hardness and mineral content). Research also should include characterizing any changes in speciation that occur when tap water is used for various purposes—for example, to make acidic beverages.
-
The possibility of biological effects of SiF62−, as opposed to free fluoride ion, should be examined.
-
The biological effects of aluminofluoride complexes should be researched further, including the conditions (exposure conditions and physiological conditions) under which the complexes can be expected to occur and to have biological effects.


