
APPENDIX B
Measures of Exposure to Fluoride in the United States: Supplementary Information
U.S. DATA ON ARTIFICIAL AND NATURAL FLUORIDE IN DRINKING WATER
The recommended “optimal” fluoride concentrations for community public water supply systems and school public water supply systems are shown in Table B-1. Both sets of recommendations are based on the “annual average of maximum daily air temperatures” (CDC 1995, based on two studies in the 1950s). Table B-2 provides the approximate number of persons receiving artificially fluoridated public water in 1992, by fluoride concentration. In practice, most states seem to use a single fluoride concentration for the whole state. Figure B-1 shows the fluoride concentration by state with respect to annual average temperature for that state over the period 1971-2000. Table B-3 presents the approximate number of persons receiving naturally fluoridated public water in 1992, by fluoride concentration.
The number of persons served with public water supplies exceeding 4 milligrams (mg) of fluoride per liter (L) is expected to be substantially lower now than in 1992. For example, South Carolina, which had more than half of the persons in that category in 1992 (Table B-3), now has only occasional violations of the maximum contaminant level (MCL) (e.g., two water systems with 10 violations in calendar year 2003; SCDHEC 20041). On the other hand, a recent news article indicates that some areas in Virginia
|
1 |
See also local drinking water information by state at http://www.epa.gov/safewater/dwinfo.htm. |
TABLE B-1 Recommended Optimal Fluoride Concentrations for Public Water Supply Systems
|
Annual Average of Maximum Daily Air Temperaturesa |
Recommended Fluoride Concentrations, mg/L |
||
|
°F |
°C |
Community Water Systems |
School Water Systemsb |
|
50.0-53.7 |
10.0-12.0 |
1.2 |
5.4 |
|
53.8-58.3 |
12.1-14.6 |
1.1 |
5.0 |
|
58.4-63.8 |
14.7-17.7 |
1.0 |
4.5 |
|
63.9-70.6 |
17.8-21.4 |
0.9 |
4.1 |
|
70.7-79.2 |
21.5-26.2 |
0.8 |
3.6 |
|
79.3-90.5 |
26.3-32.5 |
0.7 |
3.2 |
|
aBased on temperature data obtained for a minimum of 5 years. bBased on 4.5 times the optimal fluoride level for communities. School water fluoridation is recommended only when the school has its own source of water and is not connected to a community water system. Several other criteria are also considered; for example, if >25% of the children attending the school already receive optimally fluoridated water at home, the school’s water should not be fluoridated. SOURCE: CDC 1995. |
|||
are still served by water systems with fluoride exceeding 4 mg/L (Hirschauer 2004).
Miller-Ihli et al. (2003) reported on fluoride concentrations in water samples collected in 1999 from 24 locations nationwide; these locations were expected to provide nationally representative samples for the National Food and Nutrient Analysis Program.2 Not unexpectedly, their findings indicate a bimodal distribution of fluoride concentrations in public drinking water: either water was fluoridated at approximately 1 mg/L or it was not fluoridated, with concentrations bordering on undetectable.
WATER INGESTION AND FLUORIDE INTAKES
Tables B-4 to B-7 summarize recent estimates by the U.S. Environmental Protection Agency (EPA) of the mean and selected percentiles of water ingestion by source (community supplies, bottled water, “other” sources, and all sources combined) and subpopulation (EPA 2000a); Tables B-8 and B-9
TABLE B-2 Population Sizes by Level of Artificial Fluoridation in 1992
|
Fluoride, mg/L |
Number of Statesa |
Population |
Percentage |
States |
|
0.7 |
1 |
149,290 |
0.11 |
Hawaii |
|
0.7-0.9 |
1 |
8,014,583 |
5.88 |
Texas |
|
0.7-1.0 |
1 |
1,282,425 |
0.94 |
Arizona |
|
0.8 |
4 |
12,886,396 |
9.46 |
Florida, Louisiana, Oklahoma, South Carolina |
|
0.8-1.0 |
1 |
432,700 |
0.32 |
Delaware |
|
0.9 |
2 |
7,177,525 |
5.27 |
|
|
0.9-1.2 |
1 |
1,921,525 |
1.41 |
Colorado |
|
1.0 |
29 |
93,060,026 |
68.30 |
Alabama, California, Connecticut, District of Columbia, Georgia, Idaho, Illinois, Indiana,c Kansas, Maryland, Massachusetts, Michigan, Mississippi, Missouri, Nebraska, Nevada, New Jersey, New Mexico, New York, North Carolina,c Ohio, Oregon, Pennsylvania, Rhode Island, Tennessee, Utah, Washington, West Virginia,c Wisconsin |
|
1.0-1.1 |
2 |
1,931,337 |
1.42 |
Iowa, Wyoming |
|
1.0-1.2 |
2 |
214,865 |
0.16 |
Montana, New Hampshire |
|
1.1 |
1 |
233,447 |
0.17 |
Vermontd |
|
1.2 |
5 |
5,026,243 |
3.69 |
Alaska, Maine, Minnesota,e North Dakota, South Dakota |
|
No dataf |
2 |
3,911,884 |
2.87 |
Arkansas, Puerto Rico |
|
Total |
52 |
136,242,246 |
100 |
|
|
aIncludes the 50 states, the District of Columbia, and Puerto Rico. bA few small water supplies have artificial fluoride concentrations of 4.0 mg/L. cA few small water supplies have artificial fluoride concentrations of 4.5 mg/L. dA few small water supplies have artificial fluoride concentrations of 4.9 mg/L. eA few small water supplies have artificial fluoride concentrations of 5.4 mg/L. fData for Arkansas were not provided (the table for Arkansas contained a duplication of the Alaska data). The water fluoridation data were not provided for Puerto Rico. SOURCE: CDC 1993. |
||||
give the corresponding estimates for consumption of community water or all water as a function of body weight. The data in Tables B-4 through B-9 are for those persons who actually consume water from the indicated source, rather than per capita estimates for the entire population. Estimates include plain (noncarbonated) drinking water and indirect water (water added to foods and beverages during preparation at home or by local food service establishments). Water in processed foods (commercial water) or naturally contained in foods (biological water) was not included.
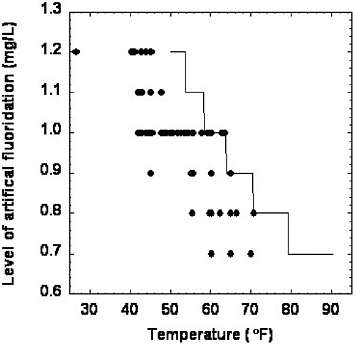
FIGURE B-1 Level of artificial fluoridation in 1992 by state (Table B-2; CDC 1993) versus area-weighted annual average temperature (°F) for that state over the period 1971-2000 (NCDC 2002a). Temperature for the District of Columbia is for Climate District 4 of the state of Maryland (NCDC 2002b). States with a range of artificial fluoride levels (Arizona, Colorado, Delaware, Iowa, Montana, New Hampshire, Texas, and Wyoming) are included at each relevant fluoride level. Arkansas and Puerto Rico are not included because of the lack of information on fluoride levels. Thin line indicates the “recommended optimal fluoride levels” for the given range of “annual average of maximum daily air temperatures” (emphasis added; Table B-1; CDC 1995).
EPA’s estimates are based on U.S. Department of Agriculture surveys taken in 1994, 1995, and 1996 of food ingestion data for two nonconsecutive days for a sample of more than 15,000 individuals in the 50 states and the District of Columbia selected to represent the entire U.S. population based on 1990 census data (EPA 2000a). (An additional survey of children in 1998 was included in the estimates used in Chapter 2.) Because these estimates were developed for the purpose of estimating people’s exposures to substances in drinking water and also are based on relatively recent data,
TABLE B-3 Population Sizes by Level of Natural Fluoridation in 1992
|
|
|
Reported Level of Natural Fluoride, mg/L |
|
||||
|
Statea |
Reported Range, mg/L |
≤1.2 |
1.3-1.9 |
2.0-3.9 |
≥4.0 |
Not givenb |
Reported Totalc |
|
Alabama |
0.7-3.6 |
27,368 |
25,195 |
6,827 |
0 |
— |
54,283 |
|
Arizona |
0.7-7.4 |
242,309 |
63,132 |
39,259 |
516 |
— |
345,266 |
|
Arkansas |
NAd |
— |
— |
— |
— |
— |
17,239 |
|
California |
0.7-3.5 |
389,715 |
24,583 |
500 |
0 |
— |
414,798 |
|
Colorado |
0.1-11.2 |
363,905 |
75,755 |
361,969 |
1,926 |
— |
801,224 |
|
Connecticut |
0.7-1.9 |
870 |
160 |
0 |
0 |
— |
1,030 |
|
Delaware |
0.6-0.9 |
7,171 |
0 |
0 |
0 |
— |
7,171 |
|
Florida |
0.5-3.6 |
890,443 |
37,435 |
1,227 |
0 |
— |
929,105 |
|
Georgia |
0.7-2.0 |
16,039 |
878 |
1,200 |
0 |
7,475 |
25,592 |
|
Hawaii |
0.7 |
354 |
0 |
0 |
0 |
— |
354 |
|
Idaho |
0.6-15.9 |
293,127 |
8,275 |
2,650 |
500 |
— |
304,552 |
|
Illinois |
0.7-4.0 |
291,600 |
91,237 |
56,481 |
500 |
6,658 |
446,050 |
|
Indiana |
0.7-4.4 |
177,890 |
36,254 |
5,541 |
5,790 |
31,928 |
264,233 |
|
Iowa |
0.7-7.0 |
186,936 |
90,182 |
28,484 |
1,445 |
— |
302,652 |
|
Kansas |
0.5-2.6 |
81,884 |
14,958 |
22,846 |
0 |
41,558 |
161,515 |
|
Kentucky |
NAe |
0 |
0 |
0 |
0 |
1,899 |
1,899 |
|
Louisiana |
0.7-3.8 |
302,520 |
44,787 |
12,599 |
0 |
— |
357,210 |
|
Maryland |
0.3-5.1 |
36,583 |
11,705 |
100 |
225 |
— |
48,613 |
|
Massachusetts |
1.0-1.1 |
122 |
0 |
0 |
0 |
— |
122 |
|
Michigan |
0.7-1.9 |
114,605 |
9,968 |
0 |
0 |
— |
124,623 |
|
Minnesota |
0.7-3.2 |
2,386 |
908 |
367 |
0 |
— |
4,000 |
|
Mississippi |
0.8-3.5 |
93,120 |
9,965 |
1,560 |
0 |
— |
104,645 |
|
Missouri |
0.7-5.0 |
74,412 |
58,168 |
16,906 |
180 |
— |
143,603 |
|
Montana |
0.1-7.3 |
85,452 |
3,923 |
7,171 |
1,814 |
492 |
82,985 |
|
Nebraska |
0.3-1.4 |
31,246 |
4,352 |
0 |
0 |
— |
35,598 |
|
Nevada |
0.5-2.6 |
16,440 |
3,628 |
5,187 |
0 |
— |
25,255 |
|
New Hampshire |
1.0-3.9 |
12,612 |
3,749 |
11,190 |
0 |
— |
27,551 |
|
New Jersey |
0.7-2.5 |
32,344 |
56,450 |
24,651 |
0 |
— |
113,445 |
|
New Mexico |
0.7-13 |
178,754 |
45,619 |
58,556 |
4,295 |
261 |
287,485 |
|
New York |
NAe |
0 |
0 |
0 |
0 |
1,536 |
1,216 |
|
North Carolina |
0.0-2.7 |
0 |
7,200 |
325 |
0 |
183,076 |
190,601 |
|
North Dakota |
0.5-7.0 |
5,205 |
6,002 |
6,024 |
3,793 |
— |
20,421 |
|
Ohio |
0.8-2.8 |
131,963 |
104,558 |
13,450 |
0 |
1,010 |
249,755 |
|
Oklahoma |
0.7-12.0 |
62,353 |
20,803 |
8,966 |
18,895 |
— |
111,017 |
|
Oregon |
0.7-2.4 |
39,865 |
2,320 |
680 |
0 |
— |
42,865 |
|
South Carolina |
0.1-5.9 |
62,924 |
27,968 |
190,430 |
105,618 |
— |
378,995 |
|
South Dakota |
0.7-6.0 |
10,097 |
14,053 |
41,038 |
692 |
— |
37,758 |
|
Texas |
0.7-8.8 |
2,234,504 |
426,341 |
233,326 |
36,863 |
25,200 |
2,955,395 |
|
Utah |
0.7-2.0 |
8,240 |
2,560 |
0 |
0 |
— |
10,800 |
|
Virginia |
0.7-6.3 |
8,418 |
11,423 |
207,924 |
18,726 |
408 |
246,694 |
|
Washington |
0.7-2.7 |
54,460 |
3,117 |
4,916 |
0 |
— |
62,493 |
|
West Virginia |
1.2 |
659 |
0 |
0 |
0 |
— |
659 |
|
Wisconsin |
0.7-2.7 |
90,713 |
36,570 |
50,140 |
0 |
— |
174,850 |
|
Wyoming |
0.7-4.5 |
14,694 |
21,984 |
2,144 |
120 |
— |
38,942 |
|
Totals |
|
6,674,302 |
1,406,165 |
1,424,634 |
201,898 |
301,501 |
9,954,559 |
|
aAlaska, the District of Columbia, Maine, Pennsylvania, Rhode Island, Tennessee, and Vermont reported no water systems with natural fluoridation. bReported as 0.0 or some other number suspected to be a misprint. cTotal given in the summary table for each state. Because of apparent internal inconsistencies, the numbers in the preceding columns do not necessarily give the same total. dData for Arkansas were not provided (the table for Arkansas contained a duplication of the Alaska data). eReported as 0.0 for all systems with natural fluoride. SOURCE: CDC 1993. |
|||||||
TABLE B-4 Estimated Average Daily Water Ingestion (mL/day) from Community Sources During 1994-1996, by People Who Consume Water from Community Sources
|
Population |
Mean |
50th Percentile |
90th Percentile |
95th Percentile |
99th Percentile |
Sample Size |
Population |
|
All consumers |
1,000 |
785 |
2,069 |
2,600 |
4,273 |
14,012 |
242,641,675 |
|
<0.5 year |
529 |
543 |
943 |
1,064 |
1,366 |
111 |
1,062,136 |
|
0.5-0.9 year |
502 |
465 |
950 |
1,122 |
1,529 |
135 |
1,449,698 |
|
1-3 years |
351 |
267 |
719 |
952 |
1,387 |
1,625 |
10,934,001 |
|
4-6 years |
454 |
363 |
940 |
1,213 |
1,985 |
1,110 |
11,586,632 |
|
7-10 years |
485 |
377 |
995 |
1,241 |
1,999 |
884 |
14,347,058 |
|
11-14 years |
641 |
473 |
1,415 |
1,742 |
2,564 |
759 |
14,437,898 |
|
15-19 years |
817 |
603 |
1,669 |
2,159 |
3,863 |
777 |
16,735,467 |
|
20-24 years |
1,033 |
711 |
2,175 |
3,082 |
5,356 |
644 |
17,658,027 |
|
25-54 years |
1,171 |
965 |
2,326 |
2,926 |
4,735 |
4,599 |
106,779,569 |
|
55-64 years |
1,242 |
1,111 |
2,297 |
2,721 |
4,222 |
1,410 |
19,484,112 |
|
≥ 65 years |
1,242 |
1,149 |
2,190 |
2,604 |
3,668 |
1,958 |
28,167,077 |
|
Males (all) |
1,052 |
814 |
2,164 |
2,733 |
4,616 |
7,082 |
118,665,763 |
|
<1 year |
462 |
441 |
881 |
1,121 |
1,281 |
118 |
1,191,526 |
|
1-10 years |
444 |
355 |
934 |
1,155 |
1,731 |
1,812 |
18,847,070 |
|
11-19 years |
828 |
595 |
1,673 |
2,058 |
3,984 |
768 |
15,923,625 |
|
≥ 20 years |
1,242 |
1,038 |
2,387 |
3,016 |
4,939 |
4,384 |
82,703,542 |
|
Females (all) |
951 |
747 |
2,005 |
2,482 |
3,863 |
6,930 |
123,975,912 |
|
<1 year |
560 |
542 |
967 |
1,122 |
1,584 |
128 |
1,320,308 |
|
1-10 years |
426 |
329 |
940 |
1,109 |
2,014 |
1,807 |
18,020,621 |
|
11-19 years |
638 |
457 |
1,382 |
1,774 |
2,598 |
768 |
15,249,740 |
|
≥ 20 years |
1,116 |
943 |
2,165 |
2,711 |
4,268 |
4,227 |
89,385,243 |
|
Lactating women |
1,665 |
1,646 |
2,959 |
3,588 |
4,098 |
34 |
971,057 |
|
Pregnant women |
872 |
553 |
1,844 |
2,588 |
3,448 |
65 |
1,645,565 |
|
Women aged 15-44 years |
984 |
756 |
2,044 |
2,722 |
4,397 |
2,176 |
55,251,477 |
|
SOURCE: EPA 2000a. |
|||||||
TABLE B-5 Estimated Average Daily Water Ingestion (mL/day) from Bottled Water During 1994-1996, by People Who Consume Bottled Water
|
Population |
Mean |
50th Percentile |
90th Percentile |
95th Percentile |
99th Percentile |
Sample Size |
Population |
|
All consumers |
737 |
532 |
1,568 |
1,967 |
3,316 |
3,078 |
57,316,806 |
|
<0.5 year |
411 |
349 |
896 |
951 |
1,193 |
51 |
538,267 |
|
0.5-0.9 year |
437 |
361 |
802 |
808 |
1,578 |
37 |
456,103 |
|
1-3 years |
302 |
232 |
649 |
819 |
1,175 |
368 |
2,532,201 |
|
4-6 years |
390 |
315 |
794 |
922 |
1,319 |
213 |
2,336,873 |
|
7-10 years |
416 |
323 |
828 |
985 |
1,767 |
164 |
2,808,756 |
|
11-14 years |
538 |
361 |
1,099 |
1,420 |
2,192 |
148 |
2,896,893 |
|
15-19 years |
665 |
468 |
1,503 |
1,777 |
3,149 |
163 |
3,528,434 |
|
20-24 years |
786 |
532 |
1,640 |
2,343 |
3,126 |
179 |
5,089,216 |
|
25-54 years |
822 |
621 |
1,773 |
1,981 |
3,786 |
1,174 |
28,487,354 |
|
55-64 years |
860 |
685 |
1,833 |
2,306 |
2,839 |
279 |
3,987,578 |
|
≥ 65 years |
910 |
785 |
1,766 |
2,074 |
2,548 |
302 |
4,655,131 |
|
Males (all) |
749 |
523 |
1,626 |
2,097 |
3,781 |
1,505 |
26,298,392 |
|
<1 year |
414 |
317 |
805 |
1,012 |
1,397 |
48 |
575,019 |
|
1-10 years |
365 |
266 |
767 |
847 |
1,685 |
376 |
3,755,220 |
|
11-19 years |
682 |
464 |
1,423 |
1,822 |
2,802 |
144 |
2,969,950 |
|
≥ 20 years |
845 |
592 |
1,774 |
2,303 |
3,855 |
937 |
18,998,203 |
|
Females (all) |
727 |
532 |
1,542 |
1,893 |
3,031 |
1,573 |
31,018,414 |
|
<1 year |
436 |
428 |
895 |
896 |
1,301 |
40 |
419,351 |
|
1-10 years |
375 |
289 |
765 |
993 |
1,347 |
369 |
3,922,610 |
|
11-19 years |
544 |
357 |
1,116 |
1,537 |
3,143 |
167 |
3,455,377 |
|
≥ 20 years |
819 |
690 |
1,747 |
1,975 |
3,060 |
997 |
23,221,076 |
|
Lactating women |
749 |
608 |
1,144 |
1,223 |
1,286 |
7 |
278,308 |
|
Pregnant women |
891 |
683 |
1,910 |
1,957 |
2,198 |
27 |
698,645 |
|
Women aged 15-44 years |
766 |
592 |
1,598 |
1,922 |
3,093 |
611 |
16,279,438 |
|
SOURCE: EPA 2000a. |
|||||||
TABLE B-6 Estimated Average Daily Water Ingestion (mL/day) from Other Sources (e.g., Wells and Cisterns) During 1994-1996, by People Who Consume Water from Those Sources
|
Population |
Mean |
50th Percentile |
90th Percentile |
95th Percentile |
99th Percentile |
Sample Size |
Population |
|
All consumers |
965 |
739 |
1,971 |
2,475 |
3,820 |
2,129 |
34,693,744 |
|
<0.5 year |
306 |
188 |
637 |
754 |
878 |
15 |
117,444 |
|
0.5-0.9 year |
265 |
172 |
552 |
560 |
567 |
14 |
198,639 |
|
1-3 years |
347 |
291 |
710 |
761 |
1,190 |
206 |
1,243,498 |
|
4-6 years |
390 |
285 |
778 |
1,057 |
1,332 |
137 |
1,382,002 |
|
7-10 years |
485 |
399 |
992 |
1,093 |
1,623 |
134 |
2,121,832 |
|
11-14 years |
733 |
553 |
1,561 |
1,884 |
3,086 |
121 |
2,243,452 |
|
15-19 years |
587 |
395 |
1,221 |
1,721 |
2,409 |
109 |
2,372,842 |
|
20-24 years |
640 |
472 |
1,305 |
1,648 |
1,937 |
67 |
1,809,825 |
|
25-54 years |
1,124 |
917 |
2,175 |
2,834 |
4,728 |
731 |
15,480,754 |
|
55-64 years |
1,276 |
1,110 |
2,365 |
2,916 |
5,152 |
272 |
3,504,576 |
|
≥65 years |
1,259 |
1,188 |
2,136 |
2,470 |
3,707 |
323 |
4,218,880 |
|
Males (all) |
1,031 |
785 |
2,107 |
2,821 |
4,734 |
1,155 |
17,880,530 |
|
<1 year |
243 |
148 |
554 |
567 |
773 |
16 |
198,829 |
|
1-10 years |
426 |
320 |
884 |
1,077 |
1,630 |
259 |
2,566,652 |
|
11-19 years |
702 |
564 |
1,366 |
1,753 |
2,787 |
103 |
2,011,715 |
|
≥20 years |
1,212 |
1,001 |
2,286 |
3,017 |
4,883 |
777 |
13,103,334 |
|
Females (all) |
894 |
710 |
1,826 |
2,225 |
3,035 |
974 |
16,813,214 |
|
<1 year |
344 |
256 |
537 |
579 |
759 |
13 |
117,254 |
|
1-10 years |
416 |
352 |
865 |
1,039 |
1,165 |
218 |
2,180,680 |
|
11-19 years |
624 |
406 |
1,394 |
1,873 |
2,489 |
127 |
2,604,579 |
|
≥ 20 years |
1,046 |
941 |
1,925 |
2,371 |
3,123 |
616 |
11,910,701 |
|
Lactating women |
1,248 |
915 |
2,148 |
2,410 |
2,620 |
7 |
182,414 |
|
Pregnant women |
1,066 |
660 |
1,676 |
1,807 |
3,374 |
7 |
168,433 |
|
Women aged 15-44 years |
904 |
666 |
1,863 |
2,319 |
3,056 |
283 |
6,759,992 |
|
SOURCE: EPA 2000a. |
|||||||
TABLE B-7 Estimated Average Daily Water Ingestion (mL/day) from All Sources During 1994-1996 by Consumers of Water
|
Population |
Mean |
50th Percentile |
90th Percentile |
95th Percentile |
99th Percentile |
Sample Size |
Population |
|
All consumers |
1,241 |
1,045 |
2,345 |
2,922 |
4,808 |
15,172 |
259,972,235 |
|
<0.5 year |
544 |
545 |
947 |
1,078 |
1,365 |
156 |
1,507,727 |
|
0.5-0.9 year |
580 |
563 |
1,130 |
1,273 |
1,672 |
154 |
1,732,993 |
|
1-3 years |
422 |
351 |
807 |
993 |
1,393 |
1,814 |
12,143,483 |
|
4-6 years |
548 |
468 |
1,019 |
1,268 |
2,031 |
1,193 |
12,438,322 |
|
7-10 years |
608 |
514 |
1,131 |
1,425 |
2,172 |
937 |
15,248,676 |
|
11-14 years |
815 |
651 |
1,625 |
1,962 |
3,033 |
812 |
15,504,627 |
|
15-19 years |
1,006 |
776 |
1,897 |
2,414 |
4,027 |
814 |
17,697,092 |
|
20-24 years |
1,283 |
1,013 |
2,508 |
3,632 |
5,801 |
678 |
18,544,787 |
|
25-54 years |
1,486 |
1,273 |
2,638 |
3,337 |
5,259 |
4,906 |
113,011,204 |
|
55-64 years |
1,532 |
1,378 |
2,557 |
2,999 |
4,395 |
1,541 |
21,145,387 |
|
≥65 years |
1,453 |
1,345 |
2,324 |
2,708 |
3,750 |
2,167 |
30,997,937 |
|
Males (all) |
1,300 |
1,070 |
2,483 |
3,149 |
5,212 |
7,689 |
126,998,276 |
|
<1 year |
549 |
538 |
1,121 |
1,278 |
1,567 |
151 |
1,560,310 |
|
1-10 years |
536 |
451 |
1,024 |
1,254 |
1,817 |
1,993 |
20,495,833 |
|
11-19 years |
1,001 |
761 |
1,898 |
2,434 |
4,011 |
809 |
16,887,932 |
|
≥ 20 years |
1,549 |
1,331 |
2,740 |
3,524 |
5,526 |
4,736 |
88,054,201 |
|
Females (all) |
1,185 |
1,021 |
2,221 |
2,703 |
4,252 |
7,483 |
132,973,959 |
|
<1 year |
577 |
559 |
950 |
1,131 |
1,654 |
159 |
1,680,410 |
|
1-10 years |
528 |
445 |
993 |
1,226 |
2,035 |
1,951 |
19,334,648 |
|
11-19 years |
830 |
664 |
1,652 |
1,955 |
3,083 |
817 |
16,313,787 |
|
≥20 years |
1,389 |
1,221 |
2,416 |
2,928 |
4,512 |
4,556 |
95,645,114 |
|
Lactating women |
1,806 |
1,498 |
3,021 |
3,767 |
4,024 |
41 |
1,171,868 |
|
Pregnant women |
1,318 |
1,228 |
2,339 |
2,674 |
3,557 |
70 |
1,751,888 |
|
Women aged 15-44 years |
1,265 |
1,065 |
2,366 |
2,952 |
4,821 |
2,314 |
58,549,659 |
|
SOURCE: EPA 2000a. |
|||||||
TABLE B-8 Estimated Average Daily Water Ingestion (mL/kg of Body Weight per Day) from Community Sources during 1994-1996, by People Who Consume Water from Community Sources
|
Population |
Mean |
50th Percentile |
90th Percentile |
95th Percentile |
99th Percentile |
Sample Size |
Population |
|
All consumers |
17 |
13 |
33 |
44 |
79 |
13,593 |
236,742,834 |
|
<0.5 year |
88 |
85 |
169 |
204 |
240 |
106 |
1,034,566 |
|
0.5-0.9 year |
56 |
52 |
116 |
127 |
170 |
128 |
1,405,128 |
|
1-3 years |
26 |
20 |
53 |
68 |
112 |
1,548 |
10,417,368 |
|
4-6 years |
23 |
18 |
45 |
65 |
95 |
1,025 |
10,751,616 |
|
7-10 years |
16 |
12 |
33 |
39 |
60 |
820 |
13,427,986 |
|
11-14 years |
13 |
10 |
27 |
36 |
54 |
736 |
14,102,256 |
|
15-19 years |
12 |
9 |
26 |
32 |
62 |
771 |
16,646,551 |
|
20-24 years |
15 |
11 |
31 |
39 |
80 |
637 |
17,426,127 |
|
25-54 years |
16 |
13 |
32 |
40 |
65 |
4,512 |
104,816,948 |
|
55-64 years |
17 |
14 |
32 |
38 |
58 |
1,383 |
19,011,778 |
|
≥65 years |
18 |
16 |
32 |
37 |
53 |
1,927 |
27,702,510 |
|
Males (all) |
16 |
13 |
32 |
43 |
81 |
6,935 |
117,076,195 |
|
<1 year |
66 |
60 |
139 |
175 |
235 |
115 |
1,180,289 |
|
1-10 years |
21 |
16 |
43 |
55 |
87 |
1,705 |
17,865,064 |
|
11-19 years |
14 |
10 |
27 |
38 |
67 |
755 |
15,717,364 |
|
≥ 20 years |
15 |
13 |
30 |
38 |
62 |
4,360 |
82,313,478 |
|
Females (all) |
17 |
14 |
35 |
45 |
77 |
6,658 |
119,666,639 |
|
<1 year |
72 |
69 |
139 |
169 |
203 |
119 |
1,259,405 |
|
1-10 years |
21 |
17 |
45 |
61 |
98 |
1,688 |
16,731,906 |
|
11-19 years |
12 |
9 |
26 |
32 |
48 |
752 |
15,031,443 |
|
≥20 years |
17 |
14 |
33 |
41 |
63 |
4,099 |
86,643,885 |
|
Lactating women |
26 |
20 |
54 |
55 |
57 |
33 |
940,375 |
|
Pregnant women |
14 |
9 |
|
43 |
47 |
65 |
1,645,565 |
|
Women aged 15-44 years |
15 |
12 |
32 |
39 |
66 |
2,126 |
54,000,618 |
|
SOURCE: EPA 2000a. |
|||||||
TABLE B-9 Estimated Average Daily Water Ingestion (mL/kg of Body Weight per Day) from All Sources During 1994-1996 by Consumers of Water
|
Population |
Mean |
50th Percentile |
90th Percentile |
95th Percentile |
99th Percentile |
Sample Size |
Population |
|
All consumers |
21 |
17 |
38 |
50 |
87 |
14,726 |
253,667,688 |
|
<0.5 year |
92 |
87 |
169 |
196 |
239 |
149 |
1,465,837 |
|
0.5-0.9 year |
65 |
58 |
120 |
164 |
185 |
147 |
1,688,423 |
|
1-3 years |
31 |
26 |
60 |
74 |
118 |
1,732 |
11,603,245 |
|
4-6 years |
27 |
23 |
51 |
68 |
97 |
1,103 |
11,556,872 |
|
7-10 years |
20 |
17 |
36 |
44 |
70 |
873 |
14,329,604 |
|
11-14 years |
16 |
14 |
33 |
40 |
60 |
786 |
15,116,291 |
|
15-19 years |
15 |
12 |
29 |
38 |
66 |
806 |
17,564,502 |
|
20-24 years |
18 |
14 |
34 |
44 |
86 |
668 |
18,224,524 |
|
25-54 years |
20 |
17 |
37 |
46 |
69 |
4,813 |
110,938,819 |
|
55-64 years |
20 |
18 |
35 |
42 |
59 |
1,513 |
20,646,201 |
|
≥65 years |
21 |
19 |
34 |
39 |
54 |
2,136 |
30,533,370 |
|
Males (all) |
20 |
16 |
38 |
49 |
86 |
7,532 |
125,266,552 |
|
<1 year |
77 |
66 |
164 |
173 |
233 |
147 |
1,538,210 |
|
1-10 years |
25 |
20 |
48 |
62 |
91 |
1,882 |
19,480,513 |
|
11-19 years |
16 |
13 |
32 |
42 |
69 |
794 |
16,642,651 |
|
≥20 years |
19 |
16 |
34 |
43 |
67 |
4,709 |
87,605,178 |
|
Females (all) |
22 |
18 |
39 |
50 |
88 |
7,194 |
128,401,136 |
|
<1 year |
79 |
72 |
158 |
170 |
200 |
149 |
1,616,050 |
|
1-10 years |
26 |
21 |
50 |
66 |
104 |
1,826 |
18,009,208 |
|
11-19 years |
15 |
13 |
29 |
36 |
56 |
798 |
16,038,142 |
|
≥20 years |
21 |
18 |
37 |
45 |
69 |
4,421 |
92,737,736 |
|
Lactating women |
28 |
25 |
53 |
57 |
70 |
40 |
1,141,186 |
|
Pregnant women |
21 |
19 |
39 |
44 |
61 |
69 |
1,729,947 |
|
Women aged 15-44 years |
20 |
16 |
36 |
46 |
77 |
2,258 |
57,164,907 |
|
SOURCE: EPA 2000a. |
|||||||
they are appropriate for the present purpose of estimating the range of current exposures to fluoride. These estimates are based on a 2-day average, whereas for fluoride exposure, long-term averages of intake are usually more important. However, given the size of the population sampled, the likelihood that the entire sample represents days of unusually high or unusually low water intake is small. Thus, these values are considered reasonable indicators both of typical water consumption and of the likely range of water consumption from various sources on a long-term basis. However, they should not be used by themselves to estimate the number of individuals or percentage of the population that consumes a given amount of water on a long-term basis, especially not at the extremes of the range. Water intakes at the low end are not of major importance for the present report, and water intakes at the high end are considered separately (Chapter 2), with additional information beyond what is provided by EPA.
It may be helpful to compare the water intakes (all sources, Table B-7) with values for adequate intake3 (AI) of water recently published by the Institute of Medicine (IOM 2004; Table B-10). The AI for total water (drinking water, other beverages, and moisture contained in food) is set “to prevent deleterious, primarily acute, effects of dehydration, which include metabolic and functional abnormalities” (IOM 2004). “Given the extreme variability in water needs which are not solely based on differences in metabolism, but also in environmental conditions and activity, there is not a single level of water intake that would ensure adequate hydration and optimal health for half4 of all apparently healthy persons in all environmental conditions” (IOM 2004). The AI for total water is based on the median total water intake from U.S. survey data (NHANES III, 1988-1994; described by IOM 2004). Daily consumption below the AI is not necessarily a concern “because a wide range of intakes is compatible with normal hydration. Higher intakes of total water will be required for those who are physically active or who are exposed to [a] hot environment” (IOM 2004). For the intake values shown in Table B-10, approximately 80% of the intake comes from drinking water and other beverages (including caffeinated and alcoholic beverages).
Use of bottled water in the United States has at least doubled since 1990 (Grossman 2002), suggesting that more people use bottled water now than in 1994-1996 and/or that individuals use more bottled water per person.
TABLE B-10 Adequate Intake Values (L/day) for Total Water
|
|
Males |
Females |
||||
|
Group |
From Foods |
From Beverages |
Total Water |
From Foods |
From Beverages |
Total Water |
|
0-6 months |
0 |
0.7 |
0.7 |
0 |
0.7 |
0.7 |
|
7-12 months |
0.2 |
0.6 |
0.8 |
0.2 |
0.6 |
0.8 |
|
1-3 years |
0.4 |
0.9 |
1.3 |
0.4 |
0.9 |
1.3 |
|
4-8 years |
0.5 |
1.2 |
1.7 |
0.5 |
1.2 |
1.7 |
|
9-13 years |
0.6 |
1.8 |
2.4 |
0.5 |
1.6 |
2.1 |
|
14-18 years |
0.7 |
2.6 |
3.3 |
0.5 |
1.8 |
2.3 |
|
>19 years |
0.7 |
3.0 |
3.7 |
0.5 |
2.2 |
2.7 |
|
Pregnancya |
— |
— |
— |
0.7 |
2.3 |
3.0 |
|
Lactationa |
— |
— |
— |
0.7 |
3.1 |
3.8 |
|
aWomen aged 14-50 years. SOURCE: IOM 2004. |
||||||
However, total water consumption per person from all sources combined probably has not changed substantially. Information for a few groups in the tables (children < 1 year of age, pregnant and lactating women) is based on relatively small sample sizes, and the confidence to be placed in specific percentile values is therefore lower. Sample sizes for some other population subgroups of potential interest (e.g., Native Americans with traditional lifestyles, people in hot climates, people with high physical activity, people with certain medical conditions) were not large enough to evaluate intake by members of the subgroup, although some people from those groups are included in the overall sample (EPA 2000a).
Tables B-11 to B-14 summarize fluoride intakes that would result from ingestion of community water (for the mean, 90th, 95th, and 99th percentiles of consumption estimated by EPA) at various levels of water fluoride (“optimal” fluoridation levels of 0.7, 1.0, or 1.2 mg/L, and the present secondary MCL [SMCL] and MCL of 2 and 4 mg/L, respectively). The SMCL and MCL are included for purposes of comparison; most people in the Unites States do not drink water with those fluoride levels. An average consumer below the age of 6 months would have an intake of 0.06-0.1 mg/kg/day from fluoridated water (0.7-1.2 mg/L), whereas an adult would ingest approximately 0.01-0.02 mg/kg/day. Individuals at the upper levels of water intake from EPA’s estimates (Table B-14) could have fluoride intakes in excess of 1 mg/day at the lowest levels of fluoridation up to about 6 mg/day for some adults, depending on age and level of water fluoridation. Persons in the high-water-intake groups described above could have even higher intakes.
TABLE B-11 Estimated Intake of Fluoride from Community Water for Average Consumersa
EXPOSURES FROM FLUORINATED ANESTHETICS
The sampled data in Table B-15 illustrate wide ranges of reported mean peak serum fluoride concentrations from the use of fluorinated anesthetics under various surgical conditions and for different age groups ranging from 22-day-old infants to people > 70 years old. These data are collected from studies conducted in many countries, including Australia, France, Finland, Germany, Ireland, Japan, the United Kingdom, and the United States. The
TABLE B-12 Estimated Intake of Fluoride from Community Water for 90th Percentile Consumersa
minimum alveolar concentration per hour (MAC-hr) ranged from short-term (e.g., for cesarean section as reported by Abboud et al. 1989) to prolonged (e.g., >10 hours as reported by Murray et al. 1992 and Obata et al. 2000) surgery and up to 7 days of continuous exposure for critically ill patients (e.g., as reported by Osborne et al. 1996). Test subjects included healthy males who underwent 3-9 hours of anesthesia (Munday et al. 1995), female smokers (Laisalmi et al. 2003), infants and children (age as indicated
TABLE B-13 Estimated Intake of Fluoride from Community Water for 95th Percentile Consumersa
in Table B-15), and patients with renal insufficiency (Conzen et al. 1995). In general, higher MAC-hr resulted in higher peak serum inorganic fluoride concentration. None of the studies presented in Table B-15 shows clear evidence of renal impairment as a result of the increased serum fluoride concentration, except transient reduction in renal function among the elderly (>70 years) reported by Hase et al. (2000). Higher peak serum concentration
TABLE B-14 Estimated Intake of Fluoride from Community Water for 99th Percentile Consumersa
was reported for smokers (Cousins et al. 1976; Laisalmi et al. 2003) and is associated with alcohol, obesity, and multiple drug use (Cousins et al. 1976). Because the reference point for the potential nephrotoxicity in these studies was the peak serum fluoride concentration, data are generally not available for an estimation of the total fluoride load or the area under the curve from the use of these anesthetics.
TABLE B-15 Serum Inorganic Fluoride Concentration from Fluorinated Anesthetic Agents
|
|
|
|
Mean Serum Inorganic Fluoride, μM |
|
|
|
Age (range) |
No. of Subjects |
MAC-houra |
Baseline |
Peak |
References |
|
Isoflurane |
|
|
|
|
|
|
51 years |
13 |
NA |
NA |
No change |
Hara et al. 1998 |
|
NA |
90 |
NA |
NA |
3 |
Groudine et al. 1999 |
|
>70 years |
6 |
3.7 |
NA |
4 |
Hase et al. 2000 |
|
55.5 years |
26 |
NA |
about 2.5 |
5 |
Goldberg et al. 1996 |
|
57 years |
24 |
1.1 |
3.8 |
5.4 |
Newman et al. 1994 |
|
28 years |
11 |
9.2 |
<2 |
5.5 |
Higuchi et al. 1995 |
|
28 yearsb |
20 |
0.06 |
5.6 |
5.6 |
Abboud et al. 1989 |
|
27.7 yearsb |
20 |
0.14 |
5.9 |
5.6 |
Abboud et al. 1989 |
|
48.5 years |
20 |
15.9 |
NA |
7.4 |
Obata et al. 2000 |
|
53.7 years |
7 |
4.8 |
NA |
8 |
Matsumura et al. 1994 |
|
26-54 years |
5 |
NAc |
2.1-2.4 |
8.4-27.9 |
Osborne et al. 1996 |
|
20-75 years |
9 |
19.2 |
3.5-3.8 |
43.2 |
Murray et al. 1992 |
|
Enflurane |
|
|
|
|
|
|
22 days to 11 years |
40 |
0.3-0.7 |
NA |
2-8 |
Oikkonen and Meretoja 1989 |
|
|
|
0.7-1.5 |
NA |
4-10 |
Oikkonen and Meretoja 1989 |
|
|
|
1.5-3.3 |
NA |
6-10 |
Oikkonen and Meretoja 1989 |
|
22 day |
1 |
0.6 |
NA |
3 |
Oikkonen and Meretoja 1989 |
|
29 day |
1 |
1.5 |
NA |
7 |
Oikkonen and Meretoja 1989 |
|
3 months |
1 |
1.6 |
NA |
11 |
Oikkonen and Meretoja 1989 |
|
4 months |
1 |
1.6 |
NA |
11 |
Oikkonen and Meretoja 1989 |
|
9 months |
1 |
2.0 |
NA |
7 |
Oikkonen and Meretoja 1989 |
|
1-9 years |
8 |
NA |
1.7 |
10.5 |
Hinkle 1989 |
|
47-60 years |
5 |
4-6.8 |
about 2-3 |
7 |
Sakai and Takaori 1978 |
|
63.9 years |
20 |
1.07 |
NA |
13.3 |
Conzen et al. 1995 |
|
48 years(27-58 years) |
16 |
1 |
NA |
13.8 |
Laisalmi et al. 2003 |
|
44 years (35-39 years)d |
17 |
1 |
NA |
18.7 |
Laisalmi et al. 2003 |
|
59.3 years |
40 |
2.8 |
1.2 |
16.75 |
Blanco et al. 1995 |
|
47.8 years |
8 |
1.24 |
2-2.5 |
18 |
Cousins et al. 1987 |
|
40.2 years |
10 |
2.7 |
1.8 |
22.2 |
Cousins et al. 1976 |
|
18-35 years |
5 |
6 |
|
28.1 |
Munday et al. 1995 |
|
18-35 years |
5 |
|
NA |
27.5 |
Munday et al. 1995 |
|
Halothane |
|
|
|
|
|
|
41.5 years |
10 |
4.9 |
1.9 |
1.6 |
Cousins et al. 1976 |
|
6.2 years (1-12 years) |
40 |
2.6 |
NA |
1.8 |
Sarner et al. 1995 |
|
42-57 years |
5 |
2.9-4.9 |
2-3 |
3 |
Sakai and Takaori 1978 |
|
50 years |
8 |
2.5 |
2-2.5 |
4 |
Cousins et al. 1987 |
|
28.9 years |
20 |
0.07 |
5.9 |
5.6 |
Abboud et al. 1989 |
|
9.2 years (5-12 years) |
25 |
2.2 |
NA |
6 |
Taivainen et al. 1994 |
|
20-75 years |
10 |
19.5 |
3.8 |
12.6 |
Murray et al. 1992 |
|
Sevoflurane |
|
|
|
|
|
|
12 months (7.7-25 months) |
41 |
4.7 |
NA |
13.8 |
Lejus et al. 2002 |
|
6.2 years (1-12 years) |
40 |
2.6 |
NA |
14.7 |
Sarner et al. 1995 |
|
>70 years |
7 |
5.1 |
NA |
18 |
Hase et al. 2000 |
|
8.8 years |
25 |
2.2 |
NA |
21 |
Taivainen et al. 1994 |
|
50 years |
25 |
0.8 |
3.8 |
23 |
Newman et al. 1994 |
|
67.4 years |
21 |
1.01 |
NA |
25 |
Conzen et al. 1995 |
|
60.5 years |
40 |
2.9 |
1.2 |
27.7 |
Blanco et al. 1995 |
|
52.7 years |
24 |
NA |
about 2.5 |
28 |
Goldberg et al. 1996 |
|
18-35 years |
5 |
3 |
NA |
30.5 |
Munday et al. 1995 |
|
|
5 |
6 |
|
31-34 |
|
|
|
5 |
9 |
|
36.6 |
|
|
29 years |
15 |
9.9 |
<2 |
36.8 |
Higuchi et al. 1995 |
|
53 years |
13 |
3.7 |
NA |
about 31 |
Hara at al. 1998 |
|
NA |
98 |
2.9 |
NA |
40 |
Groudine et al. 1999 |
|
|
|
|
Mean Serum Inorganic Fluoride, μM |
|
|
|
Age (range) |
No. of Subjects |
MAC-houra |
Baseline |
Peak |
References |
|
26.6 years (19-49 years) |
11 |
10.6 |
NA |
41.9 |
Higuchi et al. 1994 |
|
56.8 years |
10 |
18.0 high flow |
NA |
47.1 |
Obata et al. 2000 |
|
62.0 years |
10 |
16.7 low flow |
NA |
53.5 |
Obata et al. 2000 |
|
54.9 years |
8 |
6.1 |
NA |
54 |
Matsumura et al. 1994 |
|
24 years |
8 |
14.0 |
<2 |
57.5 |
Higuchi et al. 1995 |
|
aMAC is the minimum alveolar concentration, or the mean end-tidal anesthetic concentration. When MAC-hr is not reported, it is estimated as MAC-hr = (mean percent concentration) x (anesthesia time). bCesarean section patients with induction to delivery time of 7.4-8.4 minutes. cCritically ill patients under anesthesia for 5-7 days at 0.6-1.2% isoflurane. dSmoking > 10 cigarettes a day. ABBREVIATION: NA, not applicable. |
|||||
TABLE B-16 Summary of Estimated Safe and Adequate Daily Dietary Intakesa of Fluoride
|
Age, years |
Weight, kgb |
Range, mg/day |
Range, mg/kg/dayc |
||
|
0-0.5 |
6 |
0.1 |
0.5 |
0.017 |
0.083 |
|
0.5-1 |
9 |
0.2 |
1.0 |
0.022 |
0.11 |
|
1-3 |
13 |
0.5 |
1.5 |
0.038 |
0.12 |
|
4-6 |
20 |
1.0 |
2.5 |
0.050 |
0.13 |
|
7-10 |
28 |
1.5 |
2.5 |
0.054 |
0.089 |
|
Males |
|||||
|
11-14 |
45 |
1.5 |
2.5 |
0.033 |
0.056 |
|
15-18 |
66 |
1.5 |
2.5d |
0.023 |
0.038 |
|
19-24 |
72 |
1.5 |
4.0e |
0.021 |
0.056 |
|
25-50 |
79 |
1.5 |
4.0 |
0.019 |
0.051 |
|
51+ |
77 |
1.5 |
4.0 |
0.019 |
0.052 |
|
Females |
|||||
|
11-14 |
46 |
1.5 |
2.5 |
0.033 |
0.054 |
|
15-18 |
55 |
1.5 |
2.5d |
0.027 |
0.045 |
|
19-24 |
58 |
1.5 |
4.0e |
0.026 |
0.069 |
|
25-50 |
63 |
1.5 |
4.0 |
0.024 |
0.063 |
|
51+ |
65 |
1.5 |
4.0 |
0.023 |
0.062 |
|
aThe term “safe and adequate daily dietary intake” was used by the NRC (1989b) “when data were sufficient to estimate a range of requirements, but insufficient for developing [a Recommended Dietary Allowance].” This category was to be accompanied by “the caution that upper levels in the safe and adequate range should not be habitually exceeded because the toxic level for many trace elements may be only several times usual intakes.” Use of this term should not be taken to imply that the present committee considers these intakes to be safe or adequate. bMedian for age group. cCalculated from range (mg/day) and weight (kg) given for age groups. dUpper limit for children and adolescents (upper age not specified). eUpper limit for adults. SOURCE: NRC 1989b. |
|||||
REFERENCE INTAKES OF FLUORIDE
Table B-16 provides the median weight and range of fluoride intake (mg/day; safe and adequate daily dietary intake5), by age group, from the National Research Council (NRC 1989b). Table B-17 provides the reference
TABLE B-17 Summary of Dietary Reference Intakes of Fluoride
|
|
Reference Weight, kg |
Adequate Intake |
Tolerable Upper Intake |
||
|
Age, years |
mg/d |
mg/kg/daya |
mg/d |
mg/kg/daya |
|
|
0-0.5 |
7 |
0.01 |
0.0014 |
0.7 |
0.10 |
|
0.5-1 |
9 |
0.5 |
0.056 |
0.9 |
0.10 |
|
1-3 |
13 |
0.7 |
0.054 |
1.3 |
0.10 |
|
4-8 |
22 |
1 |
0.045 |
2.2 |
0.10 |
|
9-13 |
40 |
2 |
0.050 |
10 |
0.25 |
|
Boys 14-18 |
64 |
3 |
0.047 |
10 |
0.16 |
|
Girls 14-18 |
57 |
3 |
0.053 |
10 |
0.18 |
|
Males 19+ |
76 |
4 |
0.053 |
10 |
0.13 |
|
Females 19+ |
61 |
3 |
0.049 |
10 |
0.16 |
|
aCalculated from intake (mg/day) and weight (kg) given for age groups by IOM (1997) and ADA (2005). SOURCES: IOM 1997; ADA 2005. |
|||||
weight and range of fluoride intake (mg/day; dietary reference intake), by age group, from the Institute of Medicine (IOM 1997) and the American Dental Association (ADA 2005). In both tables, the intakes in terms of mg/ kg/day were calculated from the cited information as indicated.


