
APPENDIX D
Comparative Pharmacokinetics of Rats and Humans
In healthy young and middle-aged adult humans, fasting plasma fluoride concentrations (expressed as micromoles per liter [µmol/L]) are thought to be approximately equal to concentrations in water (expressed as parts per million [ppm] or milligrams per liter [mg/L]) provided that water is the major source of chronic exposure (NRC 1993; Whitford 1996). Dunipace et al. (1995) exposed weanling male Sprague-Dawley rats to fluoride in water plus a low-fluoride diet for 18 months. Plasma fluoride concentrations increased up to 3 months and remained fairly constant afterward. Plasma levels (µmol/L) were three to seven times less than water concentrations (ppm or mg/L) at several different concentrations and time points. In another chronic experiment with Sprague-Dawley rats, plasma/water fluoride ratios decreased from 4.2 at 2 months to 1.5 at 18 months (Whitford and Birdsong-Whitford 2000; G. Whitford, University of Georgia, personal communication, June 2, 2004). The reason for the difference between the experiments is unclear. Dunipace et al. (1995) concluded that rats require about five times greater water concentrations than humans to reach the same plasma concentration. That factor appears uncertain, in part because the ratio can change with age or length of exposure. In addition, this approach compares water concentrations, not dose. Plasma levels can also vary considerably both between people and in the same person over time (Ekstrand 1978).
Comparing bone fluoride levels in a 16-week rat experiment with human data from Zipkin et al. (1958), Turner et al. (1992) estimated that “humans incorporate fluoride ~18 times more readily than rats when the
rats are on a normal calcium diet.” The comparison was based on water fluoride concentrations.
Several longer-term animal experiments are compared in Table D-1. The National Toxicology Program (NTP) (Bucher et al. 1991) and Maurer et al. (1990) experiments are well-known long-term fluoride carcinogenicity assays. Of the four studies, Maurer et al. (1990) added fluoride to feed; the others added fluoride to water. Figure D-1 shows results for male rats for the three studies that added fluoride to water. Fluoride bone concentrations for female rats were somewhat higher in the NTP study and somewhat lower in the Maurer et al. study. Femur and vertebra fluoride concentrations were similar in the Dunipace et al. (1995) study. Femur diaphysis fluoride concentrations were similar to concentrations in other sites, except for femur epiphysis, which was higher (Whitford and Birdsong-Whitford 2000; G. Whitford, University of Georgia, personal communication, June 2, 2004). Figure D-1 also shows regression lines through each set of rat data, as well as the crude and adjusted estimates for the human data (Zipkin et al. 1958) discussed earlier. The adjusted line estimates bone concentrations in males with 70 years of residence, but the slope is very similar to the crude model.
Assuming that linear models are realistic in this range and that rats at 18 to 24 months are roughly physiologically comparable to humans at 70 years (Dunipace et al. 1995), the committee compared the slopes for the human and rat studies. The estimates in the left column of Table D-2 (bone versus water) were computed by dividing the slopes for the human data by the slopes estimated for the Dunipace and NTP rat studies. (The commit-
TABLE D-1 Four Chronic Rat Experiments That Measured Fluoride in Bone
|
|
Dunipace et al. 1995 |
NTPa |
Maurer et al. 1990 |
Whitford and Birdsong-Whitford 2000b |
|
Strain |
Sprague-Dawley |
F344/N |
Sprague-Dawley |
Sprague-Dawley |
|
Sampling |
3, 6, 12, 18 months |
103 weeks |
99 weeks |
2, 6, 12, 18 months |
|
Start time |
Weanling |
Weanling |
6 weeks |
6 weeks |
|
Sex |
M |
M, F |
M, F |
|
|
Water fluoride, mg/L |
0, 5, 15, 50 |
0, 11, 45, 79 |
— |
1, 10, 100 |
|
Diet fluoride, ppm |
≤1.2 |
8 |
Various |
|
|
Bone samples |
Femur, vertebra |
Humerus |
Radius, ulna |
Femur, radius, calvarium |
|
aThe NTP results were published by Bucher et al. (1991). bData are available only in abstract form; unpublished data provided by G. Whitford, University of Georgia, personal communication, June 2, 2004 |
||||
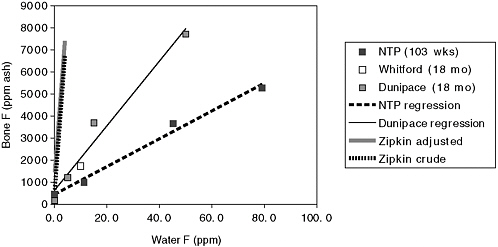
FIGURE D-1 Comparison of bone concentrations in humans and rats on the basis of drinking water concentration
Male rats: NTP (humerus), Whitford (femur diaphysis), Dunipace (femur).
Zipkin data: Regression results from crude and adjusted model, the latter assuming males and 70 years residency.
Regression results:
Dunipace: y = 625 + 147x (r2 = 0.97)
NTP: y = 443 + 63.1x (r2 = 0.99)
Human (crude): y = 517 + 1,549x
Human (adjusted to male, 70 years residence): y = 1,300 + 1,527x
tee also estimated two slopes for the human data, crude and adjusted for length of residency and sex. The crude and adjusted estimates are similar, barely changing the ratios in Table D-2.) These results suggest that rats require water concentrations 10 to 20 times higher than humans to achieve comparable bone fluoride concentrations.
Why are the Dunipace bone concentrations larger than the NTP results? As shown in Table D-1, the NTP study was longer and had higher fluoride concentrations in feed, but both of those factors should increase bone concentrations. The use of different rat strains could contribute to the difference. Type of bone is unlikely to explain the difference. Even if water concentrations are the same, doses might be different. The NTP study provided estimates of average absorbed fluoride doses (assuming 100% from water, 60% from feed) of 0.2, 0.8, 2.5, and 4.1 mg/kg/day for the four experimental groups. Using data provided by Dunipace et al. (1995), the committee estimates average fluoride doses of 0.042, 0.34, 0.96, and 2.83
TABLE D-2 Comparative Uptake of Fluoride Between Humans and Rats
|
|
Bone Versus Water |
Bone Versus Dosea |
|
Zipkin/NTP |
24 to 25b |
42 |
|
Zipkin/Dunipace |
10 to 11b |
20 |
|
Zipkin/Maurer |
NA |
40 |
|
aUse of the crude and adjusted human models produces very similar results (difference of less than 1). bThe lower value uses the adjusted human model (male, 70 years residency); the higher value uses the crude human model. |
||
mg/kg/day for the four experimental groups (divide fluoride intake, µg/day, by body weight for each water concentration and each time interval: 3, 6, 12, and 18 months). At each water concentration, the doses decrease over time. Compute the time-weighted average dose. That does not account for absorption, but feed intake is a small fraction of the total, especially for higher doses. Figure D-2 plots the average doses versus bone fluoride for both studies. Use of average dose reduces the difference in slopes between the Dunipace and NTP studies but not very much. Dunipace et al. found that bone fluoride concentrations increased very rapidly in the first 3 months, followed by a slow increase. As a result, average dose might not be the best metric. On the basis of water consumption rates, exposures appear similar at 3 months (C. Turner, Indiana University, personal communication). Calcium concentrations in feed were higher in the NTP study (0.6 ppm) than in the Dunipace study (0.5 ppm), reducing fluoride absorption (C. Turner, Indiana University, personal communication). The slope estimated for the Maurer data lies between the other two, but the results of this experiment appear to be nonlinear.
To estimate dose for the Zipkin data, the committee assumed the same water consumption (2 L/day) and body weight (70 kg) for every subject, based on standard the U.S. Environmental Protection Agency figures. This assumption multiplies the slope calculated earlier by a constant, 70/2.
The right-hand column of Table D-2 compares human and rat fluoride uptake on an average dose basis. The ratio of the slopes has increased to 20 to 40. The ratios would be higher if a smaller water consumption rate for humans had been assumed. The very high bone concentration predicted by Rao et al. (1995) for women exposed to fluoride in drinking water at 4 mg/L for 70 years suggests an even higher ratio.
Because many assumptions were involved in estimating the values presented in Table D-2, they should be used with caution. But values support a rat-to-human conversion factor for bone fluoride uptake of at least an order of magnitude.
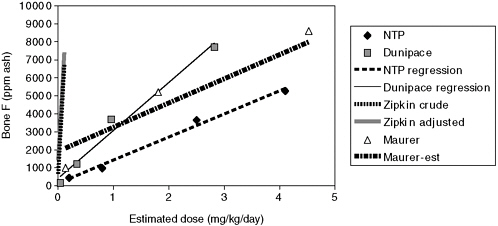
FIGURE D-2 Comparison of bone concentrations in humans and rats on the basis of estimated dose.
To keep the results visible, the figure omits the high data point from Maurer et al. (11.3 mg of fluoride/kg/day, 16,760 mg/kg ash).
Male rats: NTP (humerus), Dunipace (femur), Maurer (radius and ulna).
Zipkin data: Regression results from crude and adjusted model, the latter assuming males and 70 years residency.
|
Regression results: |
|
|
Dunipace: |
y = 415 + 2,664x (r2 = 0.98) |
|
NTP: |
y = 145 + 1,283x (r2 = 0.99) |
|
Maurer: |
y = 1,911+1,345x (r2 = 0.98) |
|
Human (crude): |
y = 517 + 1,549(70/2)x |
|
Human (adjusted to male, 70 years residence): |
y = 1,300 + 1,527(70/2)x |


