
5
Item Response Theory and Food Insecurity
Item response theory (IRT) models, and in particular the Rasch model, are important elements in the U.S. Department of Agriculture (USDA) classification of households in terms of food insecurity. This chapter reviews IRT and related statistical models and discusses the use and applicability of IRT models in the development of such classifications. In addition, some modifications of the current IRT methodology used by USDA are recommended that can increase the amount of information that is used and make the methods more appropriate to the types of data that are currently collected using the Food Security Supplement (FSS) to the Current Population Survey (CPS).
This chapter is organized as follows. The first section provides a brief history of latent variable models, of which IRT models are a special case. The next section discusses latent variable models in general and IRT models in particular. It contains a description of how latent variable models are parameterized, their interpretation, and the concept of conditional independence that drives their modeling. It also discusses how they are estimated using data and some general issues of the identifiability of these models. The next section considers how IRT models are used by USDA in the measurement of food insecurity and suggests how they might be used in different (improved) ways to accomplish this measurement. The last section considers a simple way to modify the existing models currently used by USDA to take into account the polytomous nature of the data collected. A summary of conclusions reached and the recommendations that flow from them concludes the chapter.
BRIEF HISTORY OF LATENT VARIABLE MODELS
Statistical models that incorporate latent variables (i.e., variables that are inherently unobservable) began at least as early as the observation of Spearman (1904) that scores on different educational or academic tests were usually positively correlated; that is, examinees performing well on one academic test often performed well on other tests. This phenomenon was observed in many circumstances, and Spearman concluded that it could be explained by a simple statistical model in which each examinee was postulated as having an underlying unidimensional, but not directly observed, “academic ability” or “general intelligence” that varied from person to person. He assumed that this ability was positively related to a person’s performance on each of the different tests. The higher a person’s ability, the higher he or she tended to score on any test of some aspect of academic or intellectual performance.
Spearman’s simple model was elaborated and led to the development of factor analysis as a statistical methodology, as well as to various theories of intelligence, as a topic within psychology. Early references to factor analysis are Spearman (1904), Thurstone (1931), and Kelley (1935).
Closely related to factor analysis was true score theory, in which a single educational or “mental” test was the object of study rather than several tests. In this framework, observed test scores were considered the result of a latent true score plus measurement error. This was a powerful theory that allowed the development of quantitative measures of reliability and validity that have become routine measures of the efficacy of any test (Spearman, 1907; Kelly, 1923).
Starting in the 1940s, latent structure or latent class models were developed and applied to sets of individual test or survey questions to produce scales for both the questions and the respondents (Stouffer et al., 1950). These were further developed in Anderson (1954) and Lazarsfeld and Henry (1968). At roughly the same time, item response theory, of which the Rasch model is an example, was developed for educational and psychological tests (Lawley, 1943; Tucker, 1946; Lord, 1952; Rasch, 1960; Birnbaum, 1968; Lord, 1980). The word “item” in item response theory is a term used by test developers and psychometricians to refer to the questions on tests and the rules for scoring them.
Bartholomew (1987) gives a unified discussion of the three related types of latent variable models—factor analysis, latent class analysis, and item response theory. This general class of statistical models is discussed more extensively next.
STRUCTURE OF LATENT VARIABLE MODELS
Factor analysis, latent class analysis, and item response theory when viewed as statistical models all share a basic mathematical structure. Examples from the measurement of food insecurity, when appropriate, are used to make the ideas concrete. These three types of statistical models all involve several observed variables or measurements and one (or more) latent, unobserved variable. These models have contact with data because they may be used to describe the distribution of the observed variables over a population of respondents. In addition, they allow users to draw inferences about the unobserved latent variable (e.g., food insecurity) based on the observed data (e.g., the FSS questions).
In general, the observed data consist of a set of p variables that are observed for each respondent in the study. These are called the manifest variables. Denote them by X1, X2, … Xp. In factor analysis, the X’s are the observed test scores from p tests for each person in the study. In latent class analysis, the X’s are the observed categorical responses of each respondent to p questions on a survey instrument. In IRT, the X’s are the dichotomous/binary or ordered polytomous responses of respondents to p questions/items on a test or survey instrument. In factor analysis, the manifest variables are continuous variables. In latent class analysis, the manifest variables may be dichotomous or polytomous nominal variables whose values are unordered categories. In IRT, the manifest variables are typically categorical and ordered and may be dichotomous/binary (e.g., “wrong/right” or “affirmed/not affirmed”) or polytomous (e.g., “never, sometimes, often”), as opposed to the continuous manifest variables of factor analysis or the unordered nominal manifest variables of latent class analysis.
In addition to the manifest variables, all latent variable models also assume the existence of a latent variable, the value of which varies from respondent to respondent but that is not directly observable for any respondent. The value of the latent variable affects the distribution of each manifest variable for each respondent—for example, the probability of endorsing each food insecurity question. This chapter uses the symbol ![]() to denote the latent variable to remind us that the main application of interest here is the measurement of food insecurity.
to denote the latent variable to remind us that the main application of interest here is the measurement of food insecurity.
The three different types of latent variable models make different assumptions about the nature of the latent variable and how they are connected to the manifest variables. In factor analysis, each latent factor is continuous and univariate and the mean or expected value of each manifest variable is a linear combination of the latent factors. The weights on these linear combinations indicate the influence of each underlying latent factor on each test score.
In latent class analysis, the latent variable is a discrete latent class to which each respondent is assumed to belong. Thus, in latent class analysis the latent variable is categorical rather than continuous, and it may or may not have an implied order among its values. Latent class models do not necessarily assume any particular form for the connection between the manifest variables and the latent class variable. (This is a source of the problem of identifiability discussed in a later section.)
For IRT models, the latent variable is continuous and univariate (or multivariate). In educational applications, the latent variable indicates the underlying latent proficiency of each test taker that in turn influences the likelihood of correct responses to the test. In the application to food insecurity measurement, the latent variable represents the degree of food insecurity experienced by a given household that in turn influences the likelihood of endorsing or affirming responses to questions about lack of food due to economic constraints. There is a close connection between IRT models and latent class models. If the latent variable in an IRT model is assumed to have a discrete distribution concentrated on a few points, it becomes a latent class model with ordered latent classes.
Deciding whether a latent variable is more appropriately thought of as discrete or continuous cannot really be based on data, and in fact it is often impossible to assess any difference between the fit of the two types of models (Lindsey, Clogg, and Grego, 1991). More usually, this decision is based on other considerations. For example, in the case of food insecurity, it seems plausible that ![]() varies in a continuous way across households rather than only having a few possible values that it can take on.
varies in a continuous way across households rather than only having a few possible values that it can take on.
It is evident that, of these different types of latent variable models, IRT models are particularly appropriate for modeling the measurement of food insecurity using survey data of the type collected in the CPS. The manifest variables or indicators of food insecurity in the FSS are all either binary or polytomous and ordered. In addition, food insecurity may be viewed as an underlying continuous, unidimensional, but not directly observable quantity that varies from household to household. Higher values of latent food insecurity are indicated by higher probabilities of endorsing or affirming survey items that indicate higher degrees of not being able to obtain sufficient food due to a lack of economic resources.
Returning to the structure of latent variable models, they all involve the notion of conditional statistical independence, so the panel first reviews this important idea.
Conditional Statistical Independence
Statistical Independence
A familiar example of statistical independence is the result of two tosses of a coin. Neither coin toss can influence the outcome of the other so they yield statistically independent results. More generally, if two variables are statistically independent, then neither one affects probabilities that involve the other variable. This is a very strong notion that there is “no relationship” between the two variables. This idea is formalized using conditional probability, and, to define it, some notation is now introduced that applies to the rest of this chapter.
The conditional probability that one variable, X2, has the value x2, given that (or conditional on) the fact that another variable, X1, has the value x1 is commonly denoted by
(1)
In the example of two tosses of a coin, X1 could denote the outcome of the first toss and X2 the outcome of the second toss. In this example, x1 and x2 are the values “heads” and “tails.”
In terms of conditional probability, the statistical independence of X1 and X2 is expressed by
(2)
The probability on the right side of equation (2) is just the ordinary, marginal, or unconditional probability that X2 = x2. The equality of the two probabilities in equation (2) means that the probability distribution of X2 is unaffected by the value of X1. In other words, the conditional probability is constant as a function of x1.
It is well known (for example, see Parzen, 1960) that the constant conditional probability rule in equation (2) is equivalent to the following “product rule” for joint probabilities of independent variables
(3)
The product rule means that the joint probability that X1 = x1and that X2 = x2, the left side of equation (3), is found by multiplying together the two marginal probabilities for each variable separately, the right side of equation (3). Both the constant conditional probability rule in equation (2) and the product rule in equation (3) are important for understanding the structure of latent variable models.
By itself, statistical independence is too strong a condition to apply directly to most survey data. For example, for questions on the FSS in the CPS, the assumption of statistical independence asserts that the probability that an individual endorses or affirms any survey item is independent of whether or not they endorse any other item. On its face, this assumption seems too strong, since it would be expected that the endorsement of one food insecurity question would increase the probability of endorsing other food insecurity questions. However, a modified form of independence, conditional statistical independence, is a more useful idea and is described next.
Conditional Statistical Independence
Two variables, X1 and X2, are statistically independent conditionally given a third variable, Z, if their probabilities satisfy a conditional version of the product rule in equation (3), i.e.,
(4)
Equation (4) says that when Z is fixed at (or conditioned to be) a specific value, z, then X1 and X2 are statistically independent, using the product rule. It is possible for variables to be conditionally statistically independent given a third variable but not to be statistically independent themselves. In this circumstance, it is sometimes said that Z “explains” any association or dependence between X1 and X2, because, once the value of Z has been conditioned on or fixed, there is no more association left to explain. A coin tossing example of conditional independence arises if there are two unfair coins. For example, suppose that coin A is biased towards heads and produces heads with probability 2/3, while coin B is biased towards tails and produces heads with probability 1/3. Now the procedure is to pick one of the two coins out of a box at random and then toss it twice. If which coin is being tossed is known, then there is statistical independence between X1 and X2 as before. In this case Z is the coin being tossed, A or B. Conditioning on or knowing which coin was selected makes the results of the two tosses be independent. But if the coin being tossed is unknown, then X1 and X2 are statistically dependent. If, for example, the coin is pulled out of the box at random and tossed and X1 is heads, then it is more likely than not that the coin is A, and therefore X2 is more likely than not to be a heads as well.
Measurement Models
One way to understand the role of conditional independence in latent variable models is in terms of measurement models. In this usage, the
latent variable, ![]() , is regarded as the quantity being “measured.” The value of
, is regarded as the quantity being “measured.” The value of ![]() for a given respondent is regarded as fixed, and the values of the various observed measurements or manifest variables, the X’s, for that respondent are regarded as statistically independent indicators of different aspects of
for a given respondent is regarded as fixed, and the values of the various observed measurements or manifest variables, the X’s, for that respondent are regarded as statistically independent indicators of different aspects of ![]() . The connection between
. The connection between ![]() and the X’s is assumed probabilistic so that two respondents with the same value of
and the X’s is assumed probabilistic so that two respondents with the same value of ![]() may still have different values for the observed values of the X’s. Any correlation among the manifest variables that is observed across the population of respondents is regarded as due to the fact that the manifest variables all measure the same underlying quantity
may still have different values for the observed values of the X’s. Any correlation among the manifest variables that is observed across the population of respondents is regarded as due to the fact that the manifest variables all measure the same underlying quantity ![]() that varies across respondents.
that varies across respondents.
From this perspective, the conditional independence of the X’s given a respondent’s value of ![]() is the natural way to define “independent” indicators of
is the natural way to define “independent” indicators of ![]() . The relationship between the manifest variables and the latent variable is then expressed by the equation of conditional independence of the X’s given
. The relationship between the manifest variables and the latent variable is then expressed by the equation of conditional independence of the X’s given ![]() , i.e.,
, i.e.,
(5)
Equation (5) is the basic defining assumption of all latent variable models. It says that the joint distribution of the manifest variables simplifies to independence once one conditions on the latent variable, ![]() . In IRT, this is called the assumption of local independence. Equation (5) is couched under the assumption that the manifest variables are discrete rather than continuous because the application to food insecurity involves such data. In the language of educational and psychological measurement, the form assumed for the conditional probabilities, P{Xi = xi |
. In IRT, this is called the assumption of local independence. Equation (5) is couched under the assumption that the manifest variables are discrete rather than continuous because the application to food insecurity involves such data. In the language of educational and psychological measurement, the form assumed for the conditional probabilities, P{Xi = xi | ![]() }, is often referred to as the measurement model. These models are discussed more in a later subsection.
}, is often referred to as the measurement model. These models are discussed more in a later subsection.
When applied to the measurement of food insecurity, the conditional independence specified in equation (5) implies that, for a household with a given level of food insecurity, ![]() , the probability that they affirm one food insecurity survey question is conditionally independent of whether or not they affirm any other food insecurity question. Thus, the responses to the various food insecurity questions for a single household are regarded as statistically independent even though across all the households in the study there are obvious correlations between the responses to the different questions on the FSS. As described above, the degree of food insecurity,
, the probability that they affirm one food insecurity survey question is conditionally independent of whether or not they affirm any other food insecurity question. Thus, the responses to the various food insecurity questions for a single household are regarded as statistically independent even though across all the households in the study there are obvious correlations between the responses to the different questions on the FSS. As described above, the degree of food insecurity, ![]() , as it varies across households, explains these observed correlations.
, as it varies across households, explains these observed correlations.
While equation (5) appears to be a strong assumption, this is a bit misleading. For example, equation (5) cannot be directly tested with the data because that would require knowledge of the value of ![]() for each respondent and, by definition,
for each respondent and, by definition, ![]() is unobserved for every respondent. The issue of testing IRT models is discussed further in a later section.
is unobserved for every respondent. The issue of testing IRT models is discussed further in a later section.
Measurement Models and Item Response Functions
The conditional distributions for the individual manifest variables, P{Xi = xi | ![]() }, specify the measurement model that connects each manifest variable, Xi, to the latent variable
}, specify the measurement model that connects each manifest variable, Xi, to the latent variable ![]() . As
. As ![]() varies over the respondents, so does the probability distribution of Xi. In IRT, P{Xi = xi |
varies over the respondents, so does the probability distribution of Xi. In IRT, P{Xi = xi | ![]() } is called the item response function, and in latent class models it was originally called the trace line. In factor analysis, P{Xi = xi |
} is called the item response function, and in latent class models it was originally called the trace line. In factor analysis, P{Xi = xi | ![]() } is specified by a linear regression equation that connects the latent factors to the conditional expected values of the manifest variables given
} is specified by a linear regression equation that connects the latent factors to the conditional expected values of the manifest variables given ![]() .
.
The measurement model that defines the form of P{Xi = xi | ![]() } includes parameters that may vary with the Xi’s and allow the measurement model to express different aspects of the conditional distribution, P{Xi = xi |
} includes parameters that may vary with the Xi’s and allow the measurement model to express different aspects of the conditional distribution, P{Xi = xi | ![]() }. In IRT, these are called the item parameters because each Xi denotes the responses to one item. Two types of item parameters that arise repeatedly in IRT are:
}. In IRT, these are called the item parameters because each Xi denotes the responses to one item. Two types of item parameters that arise repeatedly in IRT are:
-
Those that indicate the location of the conditional distribution, P{Xi = xi |
 }, along the -scale, called item “difficulty” parameters because the larger they are the less likely the respondent is to give response xi.
 -
Those that indicate the strength of the connection between Xi and
—the item “discrimination” parameters. The larger these are, the stronger and the more deterministic the connection is between and Xi.
The Rasch Model
To make the idea of a measurement model and item parameters more concrete, consider the Rasch model used by USDA. Suppose X is the manifest variable that codes the response to a given food insecurity question as 1 = affirm and 0 = not affirm. For the Rasch model, the item response function is determined by the conditional probability of affirming the binary food insecurity question given ![]() , P{X = 1 |
, P{X = 1 | ![]() }, and is given by the formula
}, and is given by the formula
(6)
In equation (6), b is the item parameter. As b increases, the probability of affirming the question decreases for a household with a specific value of ![]() , that is, for larger values of b the question is “harder” and less likely to be affirmed by respondents. Thus, b is an example of a “location or difficulty” parameter for the item response function. As
, that is, for larger values of b the question is “harder” and less likely to be affirmed by respondents. Thus, b is an example of a “location or difficulty” parameter for the item response function. As ![]() increases while b remains
increases while b remains
fixed, the probability increases. Thus, the Rasch model exhibits a monotonic increasing relationship between the latent variable and the probability of affirming the item. When ![]() is larger than b, then the probability that the household affirms the item is greater than 1/2—the respondent is more likely than not to affirm the item. When
is larger than b, then the probability that the household affirms the item is greater than 1/2—the respondent is more likely than not to affirm the item. When ![]() is smaller than b the reverse holds.
is smaller than b the reverse holds.
The Rasch model is very simple and does not have a separate parameter for the strength of the connection between ![]() and X. An example of a model with this additional type of parameter is the 2-parameter logistic (2PL) model whose corresponding item response function for dichotomous items is given by
and X. An example of a model with this additional type of parameter is the 2-parameter logistic (2PL) model whose corresponding item response function for dichotomous items is given by
(7)
In equation (7), the “discrimination” parameter, a, must be greater than or equal to zero and indicates the strength of the connection between ![]() and X. When a is near zero, the connection is weak (i.e., for a = 0 there is no connection between
and X. When a is near zero, the connection is weak (i.e., for a = 0 there is no connection between ![]() and the probability (1/2) that the respondent endorses the item). When a is positive and large, the connection is strong and the item is said to be highly discriminating. For the Rasch model, the discrimination parameters are all assumed to be the same and correspond to setting a = 1. For the 2PL model, when
and the probability (1/2) that the respondent endorses the item). When a is positive and large, the connection is strong and the item is said to be highly discriminating. For the Rasch model, the discrimination parameters are all assumed to be the same and correspond to setting a = 1. For the 2PL model, when ![]() exceeds b the respondent is more likely than not to affirm the item.
exceeds b the respondent is more likely than not to affirm the item.
Threshold Models for Item Response Functions
Both the Rasch model and the 2PL model are examples of threshold models that are used in other applications in which observations are made with some degree of measurement error. An example in which such models are often used is the field of signal detection, in which an observer is trying to identify a signal in the midst of a noisy background (Peterson, Birdsall, and Fox, 1954; Birdsall, 1955). Threshold models provide a simple explanation for the form assumed for the item response functions in equations (6) and (7) that is described next.
Continuing the example of a dichotomous/binary item response of “affirming or not affirming” a given item on the FSS, a threshold, b, is assumed such that if the value of ![]() for a household exceeds b then the respondent will affirm the item, but if
for a household exceeds b then the respondent will affirm the item, but if ![]() is below b then a nonaffirming response is given.
is below b then a nonaffirming response is given.
This measurement model has a deterministic connection between ![]() and the response. To introduce measurement error to make it more realistic, instead of
and the response. To introduce measurement error to make it more realistic, instead of ![]() determining the responses directly depending on where
determining the responses directly depending on where ![]() is relative to b,
is relative to b, ![]() is first perturbed by a stochastic measurement error, V/a, and then the same rules for determining responses to the item are applied to
is first perturbed by a stochastic measurement error, V/a, and then the same rules for determining responses to the item are applied to
![]() + V/a rather than to
+ V/a rather than to ![]() . The item parameter, a, determines how much the measurement error changes
. The item parameter, a, determines how much the measurement error changes ![]() . The parameter a is the previously mentioned item discrimination parameter from equation (7) in a different guise, just as the threshold b is the item difficulty parameter mentioned earlier. A large a-value results in little measurement error, and a small a-value indicates a large amount of measurement error. The stochastic quantity V is taken to be independent of
. The parameter a is the previously mentioned item discrimination parameter from equation (7) in a different guise, just as the threshold b is the item difficulty parameter mentioned earlier. A large a-value results in little measurement error, and a small a-value indicates a large amount of measurement error. The stochastic quantity V is taken to be independent of ![]() and to have a symmetric distribution with mean 0. Hence, the value of
and to have a symmetric distribution with mean 0. Hence, the value of ![]() + V/a fluctuates around
+ V/a fluctuates around ![]() in a random way.
in a random way.
The probability of affirming the item, the item response function, is given by:
(8)
where, in equation (8), FV(t) denotes the cumulative distribution function (cdf) of V. For the Rasch and 2PL models, FV(t) is assumed to be the logistic cdf, while for the Normal Ogive model it is the Gaussian cdf.
Finally, the conditional independence assumption in equation (5) corresponds to the assumption that the measurement errors for different items, Vi, are statistically independent. Threshold models provide a convenient way to fit many types of latent variable models into a common framework.
Only two of the items on the Household Food Security Survey Module (HFSSM) are actually dichotomous or binary, requesting a yes or no response. The other questions are either trichotomous or are two-part questions that, when considered together, have four possible ordered responses. The current use by USDA is to reduce the nondichotomous item response to binary responses by collapsing the response options to two possibilities that are regarded as either affirming or not affirming the question. A later section briefly considers more general item response functions that are directly applicable to the case of polytomous ordered responses to the food insecurity questions.
The Latent Distribution
In order to be able to specify the joint distribution of the manifest variables, X1, X2, … Xp, it is necessary to integrate out or marginalize over the latent distribution, f(![]() ). Depending on the continuous or discrete nature of
). Depending on the continuous or discrete nature of ![]() , f(
, f(![]() ) is assumed to be either a probability density or a discrete probability function. The latent distribution reflects the heterogeneity of
) is assumed to be either a probability density or a discrete probability function. The latent distribution reflects the heterogeneity of ![]() across the population of respondents at a relevant point in time. A common assumption for IRT models is that f(
across the population of respondents at a relevant point in time. A common assumption for IRT models is that f(![]() ) is the Gaussian distribution with mean 0 and variance 1. However, the latent distribution may have parameters that describe both the location and the degree of variation in
) is the Gaussian distribution with mean 0 and variance 1. However, the latent distribution may have parameters that describe both the location and the degree of variation in ![]() over a particular population of respondents as well. Johnson (2005) suggested a left-truncated
over a particular population of respondents as well. Johnson (2005) suggested a left-truncated
Gaussian distribution for the case of food insecurity because the full set of food insecurity questions is asked only for those households that are likely to have large values of ![]() .
.
The latent distribution, f(![]() ), along with the item response functions, P{Xi = xi |
), along with the item response functions, P{Xi = xi | ![]() }, may be combined using equation (5) to specify the joint distribution of the manifest variables, i.e.,
}, may be combined using equation (5) to specify the joint distribution of the manifest variables, i.e.,
(9)
for continuous latent variables; a sum replaces the integral in equation (9) for discrete latent variables.
The parameters of the joint distribution of the X’s in equation (9) include both the item parameters from the item response functions and possibly other parameters from the latent distribution. It is this joint distribution for the manifest variables that allows these parameters to be estimated and for the latent variable model to be tested against data.
Multiple Groups of Respondents
It often happens that important subgroups of respondents need to be studied separately. For example, households with children are asked questions that are not appropriate for households without children. It is possible for the latent distribution to vary with the subgroup. When there are large differences in these latent distributions, it may be important to include them in the model for the manifest variables.
To denote this situation, let G be a variable that distinguishes between different subgroups of respondents. For example G = 0 could indicate a household without children, while G = 1 indicates a household with children. In this setting, equation (9) can be expanded to
(10)
where G = g denotes one of the subgroups of interest. In many IRT applications, the latent distributions, f(![]() | G = g), are assumed to be Gaussian with means and variances that vary with g.
| G = g), are assumed to be Gaussian with means and variances that vary with g.
Differential Item Functioning
In order for equation (10) to be a correct formula, ![]() has to “explain” (in the sense of conditional independence mentioned earlier) any dependence between subgroup membership and responses to the questions. In
has to “explain” (in the sense of conditional independence mentioned earlier) any dependence between subgroup membership and responses to the questions. In
other words, given ![]() , both Xi and G must be conditionally independent for any item.
, both Xi and G must be conditionally independent for any item.
It is possible for this type of conditional independence to fail. When Xi and G are not conditionally independent given ![]() , the item indicated by Xi is said to exhibit differential item functioning (DIF), that is, to function differently for some or all of the subgroups indicated by G. For example, some of the FSS questions regarding adults could be easier to affirm for adults in households with children than for those without children. This might occur if the available household resources were used to feed the children first while the adults went without food for some period. In this hypothetical example, the item would function differently in terms of
, the item indicated by Xi is said to exhibit differential item functioning (DIF), that is, to function differently for some or all of the subgroups indicated by G. For example, some of the FSS questions regarding adults could be easier to affirm for adults in households with children than for those without children. This might occur if the available household resources were used to feed the children first while the adults went without food for some period. In this hypothetical example, the item would function differently in terms of ![]() for households with and without children. Differential item functioning is discussed extensively in Holland and Wainer (1993). If an item is found to exhibit DIF in two groups, it may be appropriate to allow different item parameters for it that depend on which subgroup the respondent is in rather than the usual no-DIF assumption that they are the same for all subgroups. USDA should evaluate the amount and consequences of DIF in the FSS.
for households with and without children. Differential item functioning is discussed extensively in Holland and Wainer (1993). If an item is found to exhibit DIF in two groups, it may be appropriate to allow different item parameters for it that depend on which subgroup the respondent is in rather than the usual no-DIF assumption that they are the same for all subgroups. USDA should evaluate the amount and consequences of DIF in the FSS.
The Latent Posterior Distribution
It is evident that what can be deduced about the latent variable for a respondent depends on the values of the manifest variables for that respondent and the features assumed for the latent variable model. In particular, the latent posterior distribution, denoted here by f(![]() | X1 = x1, …, Xp = xp), of
| X1 = x1, …, Xp = xp), of ![]() given the values of the manifest variables, X1 = x1, …, Xp = xp, summarizes everything that is known about the value of
given the values of the manifest variables, X1 = x1, …, Xp = xp, summarizes everything that is known about the value of ![]() for any respondent with a given pattern of values of the manifest variables, X1 = x1, …, Xp = xp. When the household’s membership in a subgroup, indicated by G = g, is also considered to be important, then what is known about f can be summarized by the latent posterior distribution, f(
for any respondent with a given pattern of values of the manifest variables, X1 = x1, …, Xp = xp. When the household’s membership in a subgroup, indicated by G = g, is also considered to be important, then what is known about f can be summarized by the latent posterior distribution, f(![]() | X1 = x1, …, Xp = xp, G = g), where the conditioning is now on both the pattern of values of the manifest variables and the group membership indicated by G.
| X1 = x1, …, Xp = xp, G = g), where the conditioning is now on both the pattern of values of the manifest variables and the group membership indicated by G.
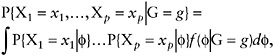
It is well known that the latent posterior distribution is given by the expression
(11)
The numerator of equation (11) is the product of the item response functions and the latent distribution, which can be estimated once the item parameters are estimated. The denominator of equation (11) is the joint distribution of the manifest variables given in equation (9).
When group membership, indicated by G = g, is included along with the pattern of manifest variables, and it is assumed that there is no DIF as described above, then the latent posterior distribution is given by the expression:
(12)
The numerator and denominator of equation (12) are similar to those of equation (11) but now include conditioning on the value of G as well.
The equations for the latent posterior distributions given in equations (11) and (12) show how the various features of the latent variable model combine. These features connect what is observed about the respondents in terms of the manifest variables to the unobservable latent variable ![]() . When the latent posterior distribution is concentrated around a small interval of
. When the latent posterior distribution is concentrated around a small interval of ![]() -values, the manifest variables restrict what the value of
-values, the manifest variables restrict what the value of ![]() can be. The stronger the dependence of the item response functions on the value of
can be. The stronger the dependence of the item response functions on the value of ![]() and the more of them there are, the greater the restriction on the value of
and the more of them there are, the greater the restriction on the value of ![]() and the more that is known about it.
and the more that is known about it.
Estimating IRT Models
The parameters of IRT models may be estimated several different ways using the observed data from the manifest variables. These include the method of moments (Lord and Novick, 1968), conditional maximum likelihood (Andersen, 1980), joint (or unconditional) maximum likelihood (Lord and Novick, 1968), maximum marginal likelihood (Bock and Lieberman, 1979), and fully Bayesian methods (Patz and Junker, 1999; Bradlow et al., 1999; Johnson, 2004). Each of these methods has both strengths and limitations.
The method of moments estimates are simple and direct but appear to be feasible only for Normal Ogive models that are assumed to have a Gaussian latent distribution. Conditional maximum likelihood estimation eliminates the need for assumptions about the latent distribution but is satisfactory only for the Rasch model and closely related models in which the strength of the connection between the latent variable and the manifest variable is assumed the same for all of the manifest variables. Joint maximum likelihood estimation avoids assumptions about the latent distribution by treating both the item parameters and the value of ![]() for each respondent as parameters to be estimated. However, this approach is known to produce biased estimates of item parameters when the number of items is small (Haberman, 1977; Andersen, 1980; Opsomer et al., 2002). Various methods have been proposed for correcting this bias. Maximum marginal
for each respondent as parameters to be estimated. However, this approach is known to produce biased estimates of item parameters when the number of items is small (Haberman, 1977; Andersen, 1980; Opsomer et al., 2002). Various methods have been proposed for correcting this bias. Maximum marginal
likelihood methods are widely used but require assumptions about the latent distribution. When these assumptions hold, they produce unbiased estimates of the item parameters. In addition, these methods allow for multiple groups that have different latent distributions as in equation (10). Fully Bayesian methods also require assumptions about the latent distribution and allow for multiple groups, but they are computationally more complicated than other approaches; however, they are becoming more widely used because of their flexibility and utility.
Over the years, USDA has used several of these methods to estimate item parameters, including joint, conditional, and maximum marginal likelihood methods assuming a single group of respondents. The different methods have yielded similar estimates for the item parameters when the Rasch model is assumed. However, if USDA moves to a more general model, the method used to estimate the item parameters may make a larger difference in the results.
Latent Variable Models and Problems of Model Identifiability
Because latent variables are not directly observed, there is no direct check on whether the form that is assumed for the measurement model is correct. That is, one cannot directly check that the form that is assumed for either the measurement model or the latent distribution is correct. This has the important consequence that if the form of the measurement model, P{Xi = xi | ![]() }, is completely unrestricted, then it is impossible to infer anything about the latent variable. In fact, the Suppes-Zanotti theorem shows that many such unrestricted latent variable models will describe the data perfectly (Holland and Rosenbaum, 1986). This result asserts that every joint distribution of p manifest variables, no matter how complicated, can be represented as conditionally independent given a unidimensional latent variable. Moreover, this representation can be achieved in many different ways. Hence, without further assumptions on the nature of the latent variable or on the conditional distributions, P{Xj = xj |
}, is completely unrestricted, then it is impossible to infer anything about the latent variable. In fact, the Suppes-Zanotti theorem shows that many such unrestricted latent variable models will describe the data perfectly (Holland and Rosenbaum, 1986). This result asserts that every joint distribution of p manifest variables, no matter how complicated, can be represented as conditionally independent given a unidimensional latent variable. Moreover, this representation can be achieved in many different ways. Hence, without further assumptions on the nature of the latent variable or on the conditional distributions, P{Xj = xj | ![]() }, or both, the assumption of a latent variable model is vacuous and has no empirical consequences.
}, or both, the assumption of a latent variable model is vacuous and has no empirical consequences.
This somewhat subtle point is not always appreciated. Latent variable models are useful in practice because of assumptions that are made in addition to the conditional independence assumption in equation (5). For example, in the case of food insecurity it is natural to assume that households with higher (or lower) values for ![]() will have higher (or lower) probabilities of endorsing each of the food insecurity questions. This monotonicity in the connection between
will have higher (or lower) probabilities of endorsing each of the food insecurity questions. This monotonicity in the connection between ![]() and the probabilities of endorsing any of the food insecurity questions is a natural assumption, and it is critical to the use of such models for food insecurity measurement. In the use of IRT models by USDA, the item response functions, P{Xj = xj |
and the probabilities of endorsing any of the food insecurity questions is a natural assumption, and it is critical to the use of such models for food insecurity measurement. In the use of IRT models by USDA, the item response functions, P{Xj = xj | ![]() }, are specified by the Rasch
}, are specified by the Rasch
model, which implies a monotonic relationship between ![]() and the endorsement probabilities.
and the endorsement probabilities.
For all latent variable models, the form assumed for P{Xi = xi | ![]() } determines what can be said about the latent variable. Some common examples of the types of restrictions assumed on the form of the measurement model are as follows. In factor analysis, it is assumed that there is a linear regression of Xi on
} determines what can be said about the latent variable. Some common examples of the types of restrictions assumed on the form of the measurement model are as follows. In factor analysis, it is assumed that there is a linear regression of Xi on ![]() . In IRT, the probability of a correct response to a dichotomous item is assumed to be a monotone increasing function of
. In IRT, the probability of a correct response to a dichotomous item is assumed to be a monotone increasing function of ![]() , or a very specific type of monotone function, for example, the Rasch model, the 2PL model, or the Normal Ogive model. In latent class analysis, there is often no assumption made about the item response functions or trace, P{Xi = xi |
, or a very specific type of monotone function, for example, the Rasch model, the 2PL model, or the Normal Ogive model. In latent class analysis, there is often no assumption made about the item response functions or trace, P{Xi = xi | ![]() }. Instead, a restriction is placed on the number of values that
}. Instead, a restriction is placed on the number of values that ![]() can have, often just two. It is known that unless some restriction is placed on the number of latent classes, a variety of problems of estimation arise. These are due to the large number of parameters being estimated relative to the amount of data that are available (Bartholomew, 1987). In IRT modeling, it is also known that estimation problems arise when the assumed form of the item response functions has certain types of parameters beyond the basic location and discrimination parameters indicated in an earlier section, for example, guessing parameters (Lord, 1980). Both of these types of estimation problems are ultimately due to the lack of identifiability of latent variable models when the conditional distributions, P{Xi = xi |
can have, often just two. It is known that unless some restriction is placed on the number of latent classes, a variety of problems of estimation arise. These are due to the large number of parameters being estimated relative to the amount of data that are available (Bartholomew, 1987). In IRT modeling, it is also known that estimation problems arise when the assumed form of the item response functions has certain types of parameters beyond the basic location and discrimination parameters indicated in an earlier section, for example, guessing parameters (Lord, 1980). Both of these types of estimation problems are ultimately due to the lack of identifiability of latent variable models when the conditional distributions, P{Xi = xi | ![]() }, are not restricted sufficiently.
}, are not restricted sufficiently.
Thus, despite the appeal of latent variable models as ways of organizing independent indicators of an underlying latent variable, there is a clear sense that one gets out of a latent variable model no more than what one puts into it.
The issue of testing the fit of IRT and other latent variable models is complex because it is equation (5) plus whatever other assumptions are made about the latent variable model that must be tested, rather than each of them separately. This is discussed in more detail in Holland and Rosenbaum (1986); Stout et al. (1996) also provide methods for testing some aspects of IRT models.
Even when the restrictions placed on the latent variable model are sufficient to resolve the identifiability problem just described, there is still a slight problem of identifiability that is well known to users of continuous latent variables. The location and scale parameters of the latent distribution are confounded with the difficulty and discrimination parameters of the measurement model. The indeterminacy of IRT scales is avoided in a variety of ways. A common way is to assume that the mean of the latent distribution is 0 and the variance is 1, thus fixing the scale to be in terms of standard deviation units. When there are multiple groups, this restriction is
placed on only one of them, the standard group, and the other groups have means and variances that are relative to those of the standard group.
USE OF ESTIMATED IRT MODELS FOR MEASURING FOOD INSECURITY
This section examines how USDA currently uses an IRT model to measure food insecurity and its prevalence in the United States, describing its classification system for households without children, and then interpreting this in terms of the material developed earlier. For households with children similar comments apply, so this case is not considered further here.
The responses to the 10 “adult” food insecurity questions are dichotomized and then the number of affirming responses to these 10 questions is used to classify the households into food insecurity levels. Households affirming two or fewer questions are classified as food secure; those with three to five affirmations are classified as food insecure without hunger; and those with six or more affirmations are classified as food insecure with hunger.
Basing the levels of food insecurity on the number of affirming responses to the dichotomized questions greatly simplifies the task of classifying households. For example, using the 10 dichotomized questions for households without children, the number of possible affirmations range from 0 to 10. On the one hand, using these same 10 questions, and, accounting for the fact that two pairs of them allow only three possible responses for each pair rather than four, there are 2632 = 576 different possible patterns of affirming and nonaffirming responses. If the questions were not dichotomized or if missing data were also taken into account, then the number of possible response patterns across the items could be much greater.
On the other hand, this simplification has also led to criticism of the food insecurity categories. Bavier (2004) noted that households that did not affirm the one question that specifically asks “… were you ever hungry …” would be, on the basis of affirming six or more other questions, classified by USDA as food insecure with hunger. Furthermore, households that did affirm the “hunger” questions but affirmed only four additional questions would not be classified as food insecure with hunger. It can also be argued that the location of the “were you ever hungry” question on the Rasch scale is a more reasonable cut point for the “food insecure with hunger” category. To the right of that point, the Rasch model predicts that the respondents are more likely than not to affirm the hunger question, but to the left they are less likely than not to affirm it. The “were you ever hungry” question is the seventh least likely to be affirmed of the 10 household adult questions. This suggests that the criterion for the category should be seven or more affirmations rather than only six. Of course, the criticism of Bavier men-
tioned above would still apply to this cut point as well, although it would occur less often.
To estimate the prevalence of the food insecurity categories, the food insecurity classification of a sampled household is treated as a household characteristic, just like other characteristics, such as the number of adults in the household. The population estimates of the percentage of households in the target population that are in the three categories are computed from the characteristics of the sampled households in the standard way (appropriate weighted averages).
Thus, the estimates of the prevalence of food insecurity for households without children are simply estimates of the percentage of households in the target population that would affirm two or fewer, from three to five, or six or more of the food insecurity questions if they were asked. There is no need to use an IRT model to justify these estimates.
The role of the IRT model is to assist in other decisions. One of these is the location of the cut points that define the food insecurity categories. There are several ways to use IRT models to do this. Ohls, Prakash, Radbill, and Schirm (1999) give a brief description of the procedure to define the original set of three cut points that were later reduced to two. That discussion suggests that the focus was on deciding how many questions should be affirmed in order to classify households into the categories. This did not involve the IRT model except as justification for reducing the aforementioned 576 possible response patterns to a much smaller number of affirmations that ignores which questions were affirmed.
The alternative is to use the IRT model to set cut points along the latent ![]() -scale first and then to use these cut points to classify households in terms of their location along the latent food insecurity
-scale first and then to use these cut points to classify households in terms of their location along the latent food insecurity ![]() -scale.
-scale.
Setting cut points along the ![]() -scale: The IRT model can relate the probability of affirming each question to locations along the
-scale: The IRT model can relate the probability of affirming each question to locations along the ![]() -scale. For example, as indicated earlier, the locations of the estimated b-parameters for the items show where respondents are as likely as not to affirm each question. Moreover, the estimated Rasch item response function in equation (6) can be used to indicate where, along the
-scale. For example, as indicated earlier, the locations of the estimated b-parameters for the items show where respondents are as likely as not to affirm each question. Moreover, the estimated Rasch item response function in equation (6) can be used to indicate where, along the ![]() -scale, respondents have a probability of, say, 80 percent, of affirming a given question. This response probability information can be used, along with expert judgment, to come to agreement as to where the cut points should be placed. Johnson (2005) discusses several approaches to setting cut points along a latent scale. The National Assessment of Educational Progress (NAEP) has a similar task in establishing its achievement levels (basic, proficient, and advanced) along its latent scales for various subjects and grades. These are also cut points along a latent continuum. In NAEP, these cut points were formed using a complex process that incorporated expert judgments and the results of scal-
-scale, respondents have a probability of, say, 80 percent, of affirming a given question. This response probability information can be used, along with expert judgment, to come to agreement as to where the cut points should be placed. Johnson (2005) discusses several approaches to setting cut points along a latent scale. The National Assessment of Educational Progress (NAEP) has a similar task in establishing its achievement levels (basic, proficient, and advanced) along its latent scales for various subjects and grades. These are also cut points along a latent continuum. In NAEP, these cut points were formed using a complex process that incorporated expert judgments and the results of scal-
ing a large number of test questions onto a common unidimensional scale. It appears that substantially more information was available about examinee performance to make the judgments needed to locate the achievement levels for NAEP than was available for deciding on the cut points for the food insecurity levels (Ohls et al., 1999). The methods used for the NAEP achievement levels may usefully inform a similar process for food insecurity measurement. For example, their methods may suggest ways for USDA to incorporate health and other relevant data more closely into the assessment of the cut points on the ![]() -scale using special samples of households who answer the FSS questions as well. Johnson (2005) alludes to using extra data sources in his discussion of validity studies.
-scale using special samples of households who answer the FSS questions as well. Johnson (2005) alludes to using extra data sources in his discussion of validity studies.
There is a somewhat nonintuitive aspect of deciding the location of cut points along a continuous scale that reflects the measurement error in IRT models. Suppose a cut point is established on the ![]() -scale, say at
-scale, say at ![]() *. Judges who examine the manifest data of households whose
*. Judges who examine the manifest data of households whose ![]() -values are well below or well above
-values are well below or well above ![]() * will tend to agree on which side of the cut point to locate the households. However, for a household near the cut point, these same judges will tend to disagree on the household’s classification. Thus, somewhat against intuition, disagreement among judges about household classifications based on manifest data is a potential indicator of where to locate cut points along a latent scale.
* will tend to agree on which side of the cut point to locate the households. However, for a household near the cut point, these same judges will tend to disagree on the household’s classification. Thus, somewhat against intuition, disagreement among judges about household classifications based on manifest data is a potential indicator of where to locate cut points along a latent scale.
Classifying households based on the manifest data: Once a latent variable model is estimated and the latent posterior distributions are available, these can be used to determine cut points along the latent scale. The probability that a household with given values of the manifest variables, X1 = x1, …, Xp = xp, has a ![]() -value above a cut point, say
-value above a cut point, say ![]() *, is given by the integral
*, is given by the integral
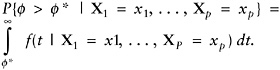
(13)
If membership in a subgroup denoted by G = g is also considered when classifying a household, as it is for households with and without children, then equation (13) is replaced by
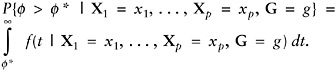
(14)
If the probability in equation (13) or (14) exceeds 50 percent then it is more likely than not that the household does fall above f* on the f-scale, and it often makes sense to so classify the household. More complicated rules can be devised that take account of possibly different costs for errors of misclassification.
The approach outlined above is a basic way to form a classification system using an IRT model. If the Rasch IRT model is assumed, then it may be shown that the latent posterior distribution in equation (11) depends only on the number of affirming responses of the household rather than on which questions are affirmed. This simplifies the classification rule to make it more like the one used by USDA, but it requires that the Rasch model accurately represents the distribution of the observed responses to the dichotomized HFSSM questions. Johnson (2004) indicates that the 2PL model provides a better fit to the HFSSM data that he examined.
Prevalence Rates on Latent and Manifest Scales
When a cut point, ![]() *, has been established along the
*, has been established along the ![]() -scale, the prevalence rate in the population described by the latent distribution, f(
-scale, the prevalence rate in the population described by the latent distribution, f(![]() ), for the condition that
), for the condition that ![]() exceeds
exceeds ![]() * is naturally defined as
* is naturally defined as
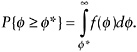
(15)
In addition to this overall prevalence rate, the prevalence in a subgroup of household indicated by G = g is given by
(16)
However, the practice of USDA is to set the cut points on the scale of the manifest variables, that is, on the number of affirmations of the HFSSM questions. What is the connection between the proportions of households that affirm some number of the HFSSM questions and the prevalence rate defined in equation (15) or (16)? To answer this, let A denote the number of the dichotomized HFSSM questions affirmed by a household, then the percentage of households that affirm x or more of the questions is
(17)
Examples of subgroup prevalence rates are found in Table 2 of Nord et al. (2004). If the interest is on the percentage of households in a subgroup
that affirm x or more of the questions, then, assuming no DIF, equation (17) is modified, as in equation (16), that is,
(18)
Equations (17) and (18) express the probabilities, P{A ≥ x} and P{A ≥ x | G = g}, as the average of the conditional probability P{A ≥ x | ![]() } in a standard way. For any plausible IRT model, P{A ≥ x |
} in a standard way. For any plausible IRT model, P{A ≥ x | ![]() } is an increasing function of
} is an increasing function of ![]() , ranging from a small value for low values of
, ranging from a small value for low values of ![]() to nearly 1 for large values of
to nearly 1 for large values of ![]() .
.
If, for some value of x, P{A ≥ x |![]() } were a step function, that was zero to the left of
} were a step function, that was zero to the left of ![]() * a nd 1 to the right of
* a nd 1 to the right of ![]() *, then the prevalence rate in equation (15) and the affirmation rate in equation (17) would be equal. However, for any value of x, P{A ≥ x |
*, then the prevalence rate in equation (15) and the affirmation rate in equation (17) would be equal. However, for any value of x, P{A ≥ x | ![]() } is far from a step function, due to the inherent measurement error between the latent and manifest variables. It is possible that, for an appropriate choice of x, the parts of t he function, P{A ≥ x |
} is far from a step function, due to the inherent measurement error between the latent and manifest variables. It is possible that, for an appropriate choice of x, the parts of t he function, P{A ≥ x | ![]() }, above and below the cut point,
}, above and below the cut point, ![]() *, would “balance,” but this would have to be investigated in each case and for equation (18) could depend on the value of g. The difference between equations (15) and (17) is the bias arising from the use of a cut point based on the manifest variables and the use of one defined on the latent scale. This bias was addressed in a way in Nord (1999). How well he was able to investigate this bias is not clear to us due to the complexity of the task.
*, would “balance,” but this would have to be investigated in each case and for equation (18) could depend on the value of g. The difference between equations (15) and (17) is the bias arising from the use of a cut point based on the manifest variables and the use of one defined on the latent scale. This bias was addressed in a way in Nord (1999). How well he was able to investigate this bias is not clear to us due to the complexity of the task.
The form assumed for the latent distribution, f(![]() ), can make a difference in the estimated prevalence of food insecurity. This can be studied to some extent by trying out different assumptions and seeing what effect they have. As the number of manifest variables increases, the effects of different assumptions about the latent distribution grow less, but in the case of food insecurity the number of manifest variables is too small for this to be assumed.
), can make a difference in the estimated prevalence of food insecurity. This can be studied to some extent by trying out different assumptions and seeing what effect they have. As the number of manifest variables increases, the effects of different assumptions about the latent distribution grow less, but in the case of food insecurity the number of manifest variables is too small for this to be assumed.
Johnson (2005) describes several approaches to estimating prevalence rates that are defined by cut points along the ![]() -scale and of the form in equation (15) rather than equation (17). These methods avoid the biases mentioned above and apply to either overall or subgroup-specific prevalence rates. An example of the bias in prevalence estimates that arises from the failure to condition appropriately on the subgroup is given in Mislevy et al. (1992) for an educational testing application.
-scale and of the form in equation (15) rather than equation (17). These methods avoid the biases mentioned above and apply to either overall or subgroup-specific prevalence rates. An example of the bias in prevalence estimates that arises from the failure to condition appropriately on the subgroup is given in Mislevy et al. (1992) for an educational testing application.
The Consequences of Measurement Error
As discussed earlier, the latent posterior distribution in equation (11), f(![]() | X1 = x1, …, Xp = xp), summarizes all that is known about the latent
| X1 = x1, …, Xp = xp), summarizes all that is known about the latent
variable from the values of the manifest variables. The fact that there is measurement error in the connection between the manifest variables and the latent variable in any latent variable model results in the latent posterior distributions being spread over a range of values along the ![]() -scale, rather than being concentrated on a single point along this scale. In the special circumstances in which many manifest variables are all strongly connected to the latent variable, the estimated posterior distribution is strongly peaked over a single value, so that it then makes sense to “estimate
-scale, rather than being concentrated on a single point along this scale. In the special circumstances in which many manifest variables are all strongly connected to the latent variable, the estimated posterior distribution is strongly peaked over a single value, so that it then makes sense to “estimate ![]() ” by, for example, the unconditional maximum likelihood approach (Haberman, 1977; Holland, 1990). This situation often happens in educational testing applications of IRT models, in which the tests may comprise 40 to 100 test items.
” by, for example, the unconditional maximum likelihood approach (Haberman, 1977; Holland, 1990). This situation often happens in educational testing applications of IRT models, in which the tests may comprise 40 to 100 test items.
However, in the case of the dichotomized HFSSM questions on the CPS, there are relatively few manifest variables on which to base our knowledge of ![]() for a given individual—at most 10 for households without children and 18 for those with children. In this circumstance, the estimated posterior distributions are not highly peaked over a single value of
for a given individual—at most 10 for households without children and 18 for those with children. In this circumstance, the estimated posterior distributions are not highly peaked over a single value of ![]() and spread over a range of values.
and spread over a range of values.
Johnson (2004, p. 23) gives a graph of two estimated posterior distributions that correspond to two different patterns of responses to the food insecurity questions. Johnson’s graphs indicate that the estimated posterior distributions have substantial standard deviations, as one would expect, because of the small number of items. In addition, the two posterior distributions almost completely overlapped. Thus, measurement error is a significant aspect of the measurement of food insecurity by USDA.
An important consequence of this type of measurement error concerns the intuitively plausible use of the distribution of estimated values of the latent variable as a proxy of the latent distribution. These estimated values of the latent variable are a side benefit of the unconditional maximum likelihood method of estimating the item parameters. However, when the effect of measurement error is large, as it is in the case of food insecurity measurement, the distribution of the estimated values of ![]() across the sampled households does not form an unbiased estimate of the latent distribution.
across the sampled households does not form an unbiased estimate of the latent distribution.
As mentioned earlier, an additional issue relevant to measurement error is that when the number of manifest variables is relatively small, the form assumed for the latent distribution can affect the estimated latent posterior distribution and through that estimates of prevalence. Thus, even the form of the latent posterior distribution is somewhat uncertain when the number of items is small.
Stability of Scales over Time
The food insecurity scales were defined in the late 1990s. Unlike NAEP, the questions on the HFSSM remain the same year after year. Nevertheless, Ohls et al. (1999) discuss some indications that the scales were somewhat different for some of the years investigated. The source of this variability remains uncertain and could be due to several sources, for example, the poor fit of the Rasch model, technical aspects of the data collection, and different interpretations of the HFSSM questions in different years. The possibility that scale drift might occur should be examined on an ongoing manner to the extent possible. Methods of detecting differential item functioning may be used to investigate it with the data from different years being treated as the multiple groups.
BETTER MATCH BETWEEN THE MEASUREMENT MODEL AND THE DATA COLLECTED
The current approach to IRT modeling used by USDA is to create dichotomous/binary questions out of the several types of questions on the HFSSM, and then to use the Rasch model, which is designed for dichotomous questions. This approach has the potential of not using all of the information that is available in the battery of food insecurity questions. In addition, because two pairs of the questions are each two parts of a single question, the assumption of conditional independence in equation (5) is violated with unclear consequences. This section briefly outlines how this practice could be modified using ordered polytomous items.
Using Polytomous Items
In the current HFSSM, three types of questions are asked of either all households or households with children. First, there are dichotomous/binary questions with a yes/no response set. Second, there are questions with a trichotomous ordered response set (never, sometimes, often). Third, there are two-part questions that include a frequency follow-up to an initial question. The initial questions have a yes/no response set, and the frequency follow-up, if the initial answer is yes, has the trichotomous response set of (1–2 months, some months but not every month, or almost every month). For all households there is one dichotomous, three trichotomous, and four two-part questions. For households with children there is, in addition, one dichotomous, three trichotomous, and three two-part questions. Hence, for all households there are 8 different measures of food insecurity and for households with children there are an additional 7 measures, for a total of 15. These enumerations include only the questions that ask about “in the
last 12 months” and omit those that ask about “in the last 30 days,” because only the former are used to classify households and to estimate the prevalence rates.
The dichotomization of the trichotomous items is never/(sometimes or often); for the frequency follow-ups of the two-part questions, the dichotomy is 1–2 months/(some months but not every month or almost every month). The use of dichotomized responses carries with it the potential of a loss of information, but the degree of this loss is currently unknown for the data from USDA’s food insecurity module (Ramsay, 1973). In addition, the approach used by USDA ignores the correlated nature of the dichotomized two-part questions.
It is possible to turn the responses to each two-part question into a single polytomous response set with four responses. These four responses are easily seen to be “no, yes in 1–2 months, yes in some months but not in every month, and yes in almost every month.” These form an ordered set of responses that indicate an increased frequency, and therefore intensity of food insecurity.
There is a slight problem that missing data can create for this polytomization of the two-part questions. When there is an answer to the initial question of yes but, for some reason, there is no response to the follow-up question, the yes response can not be further pigeonholed. This can be handled in a variety of ways. For example, a conservative approach would be to assign a response of “yes in 1–2 months” to such cases. Other approaches might be considered as well.
Polytomous IRT Models for Polytomous Food Insecurity Questions
This section gives some details regarding an IRT model that is appropriate for polytomous food insecurity questions. The model developed here is one of several that allow for general ordered response categories rather than simply the binary case of endorse or not. It is an example of a threshold model described earlier for dichotomous items, and it includes that case as well. This more general approach can use all of the item response data that are currently available, including both the trichotomous questions and the two-part questions. In addition, it does not ignore the correlated aspect of the two-part questions.
The models described here are examples of graded response models (Samejima, 1969) and are specifically designed for ordered polytomous responses to the items. The panel considers them here because the measurement model is easy to understand, and it is sufficiently general for the currently collected food insecurity data. Different but related IRT models for ordered responses are given in Masters (1982) and Muraki (1992).
For concreteness, consider one of the trichotomous HFSSM questions with the possible responses of “never, sometimes, or often.” Similar considerations apply to the above proposed way to make a single four-category item from a question with a frequency follow-up. The responses are ordered from least to most often. To specify a measurement model for this question, continue to assume that there is a latent variable, ![]() , that underlies a respondent’s answer to food insecurity questions. The higher
, that underlies a respondent’s answer to food insecurity questions. The higher ![]() is, the more likely the household is to give a response of “often” for this question and the less likely a response of “never.”
is, the more likely the household is to give a response of “often” for this question and the less likely a response of “never.”
Because there are three possible responses, there will be two thresholds, b1 and b2, on the ![]() -scale (rather than the single threshold of the dichotomous case). Furthermore, since it is literally a “higher threshold,” b2 is greater than b1. For the case of four ordered responses, there will be three thresholds to categorize the possible responses. The idea is the same as before for the dichotomous case. The location of
-scale (rather than the single threshold of the dichotomous case). Furthermore, since it is literally a “higher threshold,” b2 is greater than b1. For the case of four ordered responses, there will be three thresholds to categorize the possible responses. The idea is the same as before for the dichotomous case. The location of ![]() with respect to these thresholds will determine the probability of the response of the household to the question. As in the dichotomous case,
with respect to these thresholds will determine the probability of the response of the household to the question. As in the dichotomous case, ![]() is perturbed by a statistically independent measurement error, V/a, and if
is perturbed by a statistically independent measurement error, V/a, and if ![]() + V/a is less than b1, then the household’s response is “never” to the question. If
+ V/a is less than b1, then the household’s response is “never” to the question. If ![]() + V/a is between b1 and b2, then the household’s response is “sometimes” to the question. If
+ V/a is between b1 and b2, then the household’s response is “sometimes” to the question. If ![]() + V/a exceeds b2, then the household’s response is “often” to the question.
+ V/a exceeds b2, then the household’s response is “often” to the question.
In the case of ordered responses, it is natural to define the item response function in terms of P{X ≥ x | ![]() }, the probability of a response equal to or exceeding x in intensity or frequency. Note that the notation X ≥ x makes sense because the possible responses are “ordered.” In this case, X denotes the response of a household to the question, x denotes one of the values “sometimes” or “often,” and
}, the probability of a response equal to or exceeding x in intensity or frequency. Note that the notation X ≥ x makes sense because the possible responses are “ordered.” In this case, X denotes the response of a household to the question, x denotes one of the values “sometimes” or “often,” and ![]() is the household’s value of the latent variable. When considering the probability, P{X ≥ x |
is the household’s value of the latent variable. When considering the probability, P{X ≥ x | ![]() }, it is useful to remember that the values of x that make sense to consider in a trichotomous example are the highest two, that is, “sometimes” and “often,” because P{X ≥ never |
}, it is useful to remember that the values of x that make sense to consider in a trichotomous example are the highest two, that is, “sometimes” and “often,” because P{X ≥ never | ![]() } always has the value 1.0 for any value of
} always has the value 1.0 for any value of ![]() . As functions of
. As functions of ![]() , P{X ≥ sometimes |
, P{X ≥ sometimes | ![]() } must be larger than P{X ≥ often |
} must be larger than P{X ≥ often | ![]() } as
} as ![]() varies, because “X ≥ sometimes” means “X = sometimes or X = often” and therefore it is more likely than “X ≥ often.”
varies, because “X ≥ sometimes” means “X = sometimes or X = often” and therefore it is more likely than “X ≥ often.”
The item response functions for this threshold model are given by
(19)
and
(20)
Rearranging terms in equation (19) and exploiting both the symmetry and independence of V shows that
(21)
where FV(t) is the cdf of V as in equation (8). A similar formula holds for P{X ≥ often | ![]() } with b2 replacing b1.
} with b2 replacing b1.
The choice of FV(t) for V gives rise to different IRT models for this situation. If it is assumed that V has the normal distribution with mean 0 and variance 1, the result is the Normal Ogive graded response model, one of the earliest IRT models for ordered polytomous responses (Samejima, 1969). If V has a logistic distribution, the result is a logistic graded response model, of which the Rasch model is a dichotomous special case with a = 1. When a is allowed to vary across the items, the result is a graded version of the 2PL model in equation (7). The general family of models given by equation (19) or (20) describes a wide range of the common IRT models used in practice.
In the trichotomous case, the item parameters are a, b1, and b2. The item parameters affect the probability of the different responses—never, sometimes, and often—to the question for a household with the specified value of ![]() . The thresholds, b1 and b2, are examples of location parameters (akin to the single b parameter in the Rasch model for dichotomous responses), and they control how likely or unlikely the corresponding responses are for a given value of
. The thresholds, b1 and b2, are examples of location parameters (akin to the single b parameter in the Rasch model for dichotomous responses), and they control how likely or unlikely the corresponding responses are for a given value of ![]() . The discrimination parameter, a, controls the amount of measurement error as it does in the dichotomous case.
. The discrimination parameter, a, controls the amount of measurement error as it does in the dichotomous case.
The values of the item parameters depend on the nature of the question and the types of possible responses. For a question that asked if the respondent “worried about running out of money for food,” one would expect that it does not have as large a b1-value as does a question that asked if the respondent actually “did not eat because there was not enough money to do so.” “Not eating because there was not enough money” is a more severe indicator of food insecurity than “worrying about food running out.” For example, in the data published by the USDA for 2004, 16.6 percent of households affirmed the “worry” question, but only 3.1 percent affirmed the “not eating” question (Nord et al., 2005b). The model is consistent with a conception of food insecurity that assumes that households with larger values of ![]() are more likely to respond more intensely or frequently to a trichotomous or two-part indicator of food insecurity than those with lower values of
are more likely to respond more intensely or frequently to a trichotomous or two-part indicator of food insecurity than those with lower values of ![]() .
.
The location of the b-parameters for a given question indicates the degree to which respondents do or do not endorse the question and at what level. More respondents affirm questions with lower b’s and fewer respondents affirm questions with higher b’s. This inequality reflects the way that
the responses to the food insecurity questions are indicators of the underlying latent variable of food insecurity.
In order to complete the model for the joint distribution of responses to a set of food security questions, it is necessary to assume a latent distribution for ![]() . The simplest assumption is that
. The simplest assumption is that ![]() has a Gaussian distribution with mean 0 and variance 1. However, due to the level of prior screening of households who are asked the FSS questions, Johnson (2004) suggested using a truncated Gaussian distribution, rather than the standard Gaussian distribution.
has a Gaussian distribution with mean 0 and variance 1. However, due to the level of prior screening of households who are asked the FSS questions, Johnson (2004) suggested using a truncated Gaussian distribution, rather than the standard Gaussian distribution.
When there are several items being modeled, it is assumed that the measurement errors, Vi, are independent across the items, as in the dichotomous case. The independence of the measurement errors implies the conditional independence of the responses to questions given the latent variable ![]() , so that equation (5) holds.
, so that equation (5) holds.
As a final point, the panel observes that the type of IRT model just described allows frequency information that is currently collected to be more systematically examined than it is now. However, it does not address the measurement of the duration of spells of food insecurity. In order to address duration, more detailed data would need to be collected and more complicated time-dependent IRT models would need to be used to analyze them.
CONCLUSIONS AND RECOMMENDATIONS
Many issues have been raised in this chapter about the use of IRT models in the measurement of food insecurity and, in particular, the specific use of the Rasch model. These and related issues are summarized below and recommendations for improvement are presented.
-
Regarding food insecurity as an unobserved latent variable with the observed USDA survey questions regarded as a collection of manifest indicators of that latent variable is appropriate.
-
IRT models are appropriate for modeling survey responses that collect information on food insecurity of households.
-
Some empirical evidence suggests that the assumption of the Rasch model of equal item discrimination may not hold particularly well for the bank of survey items currently being used by USDA in its measurement of food insecurity.
-
The current practice in which responses to the food insecurity questions are dichotomized when, in fact, most of the questions have ordered polytomous response options may lead to a significant amount of information loss regarding that household’s level of food
-
insecurity. This is especially of concern given the relatively few questions that define the food insecurity measure.
-
Several questions in the food insecurity supplement are follow-up questions asked only if “yes” is answered to a previous question. This structure should be taken into account in summarizing information about food insecurity. In particular, the responses to the stem item and the frequency follow-up question are not conditionally independent, an assumption made by the IRT model.
-
Under current practice, estimates of food insecurity at the household level ignore the large amounts of inherent uncertainty that exist due to its measurement by a small number of items. As a result, it is more appropriate to regard each household’s value of
as estimated by its posterior distribution of -values rather than by an estimated value that does not reflect its uncertainty. It is not appropriate to ignore this uncertainty when classifying households or estimating the prevalence of food insecurity, either overall or in subsets of households. -
Currently USDA collects information on the intensity and frequency of food insecurity in U.S. households. The information does not address the measurement of the duration of spells of food insecurity, either overall or in subsets of households.
These conclusions lead to the following recommendations to improve the categorization of households into food insecurity levels:
Recommendation 5-1: USDA should consider more flexible alternatives to the dichotomous Rasch model, the latent variable model that underlies the current food insecurity classification scheme. The alternatives should reflect the types of data collected in the Food Security Supplement. Alternative models that should be formally compared include:
-
Modeling ordered polytomous item responses by ordered polytomous rather than dichotomous item response functions.
-
Treating items with frequency follow-up questions appropriately, for example, as a single ordered polytomous item rather than as two independent questions.
-
Allowing the item discrimination parameters to differ from item to item when indicated by relevant data.
Recommendation 5-2: USDA should undertake the following additional analyses in the development of the underlying latent variable model:
-
Fitting models that allow for different latent distributions for households with children and those without children and possibly other subgroups of respondents.
-
Fitting models that allow for different item parameters for households with and without children for the questions that are appropriate for all households in order to study the possibility and effects of differential item functioning.
-
Studying the stability of the measurement system over time, possibly using the methods of differential item functioning.
Recommendation 5-3: To implement the underlying latent variable model that results from the recommended research, USDA should develop a new classification system that reflects the measurement error inherent in latent variable models. This can be accomplished by classifying households probabilistically along the latent scale, as opposed to the current practice of deterministically using the observed number of affirmations. Furthermore, the new classification system should be more closely tied to the content and location of food insecurity items along the latent scale.
Recommendation 5-4: USDA should study the differences between the current classification system and the new system, possibly leading to a simple approximation to the new classification system for use in surveys and field studies.
Recommendation 5-5: USDA should consider collecting data on the duration of spells of food insecurity in addition to the currently measured intensity and frequency measures. Measures of frequency and duration spells may be used independently of the latent variable measuring food insecurity.


