
1
The Changing Context for Foreign Assistance
Responding to Developing Country Aspirations for Effectively Using S&T
SHARED BENEFITS FROM THE APPLICATION OF SCIENCE AND TECHNOLOGY
Each year tens of millions of children die because of lack of access to adequate health care, food supplies, and clean water. The death rates from HIV/AIDS, tuberculosis, malaria, and other widespread diseases continue their upward trajectories. Life-sustaining ecosystems throughout the developing world are being damaged beyond repair in quests by both the rich and the poor for immediate utilization of natural resources.
|
BOX 1-1 I’ve been in war, and I’ve been through a number of hurricanes, tornadoes, and other relief operations; but I have never seen anything like this. Millions are homeless, and the international community has pledged $2 billion in relief efforts. SOURCE: Former Secretary of State Colin Powell as he viewed damage from the tsunami that struck Indonesia and other Southeast Asia countries in January 2005. Tsunami Aid Pledges Top $3 Billion. 2005. CBS News, January 5, 2005. |
Despite the efforts of many developing-country governments and local institutions—supported by international organizations, bilateral donors, and private organizations—to moderate these and other life-threatening problems, more than 100 developing countries face ominous long-term development issues that adversely affect vulnerable populations with unrelenting intensity. At the same time, tens of millions of lives are plunged deeper into poverty each year as the result of natural disasters and armed violence that strike throughout the developing world, an example of which is
TABLE 1-1 Development Indicators: Low- and Middle-Income Countries and the United States
|
Region |
Population (millions) |
Life Expectancy (years) |
GNI per Capita |
% Population below $1 Poverty Line* |
R&D Expenditures % of GDP |
Fixed Line/Mobile Subscribersß (per 1000 people) |
Net Aid Flows ($ millions) |
|
East Asia & Pacific |
1,855 |
70 |
1,070 |
14.9 |
1.11 |
357 |
7,131 |
|
Europe & Central Asia• |
472 |
68 |
2,580 |
3.6 |
.9 |
438 |
10,465 |
|
Latin America & Caribbean |
533 |
71 |
3,280 |
9.5 |
.53 |
416 |
6,151 |
|
Middle East & N. Africa |
312 |
69 |
2,390 |
2.4 |
-- |
237 |
7,629 |
|
South Asia |
1,425 |
63 |
510 |
31.3 |
.75 |
61 |
6,171 |
|
Sub-Saharan Africa |
705 |
46 |
500 |
46.4 |
-- |
62 |
24,146 |
|
United Statesß |
296 |
78 |
41,400++ |
-- |
2.79 |
1117.9 |
-- |
|
Key Indicators: Regional Data from the WDI Database http://www.worldbank.org/data/databytopic/reg_wdi.pdf * World Development Indicators 2005 (World Bank): Poverty http://www.worldbank.org/data/wdi2005/pdfs/Table2_5.pdf ß CIA World Fact Book http://www.cia.gov/cia/publications/factbook/geos/us.html + Fixed Line and Mobile Phone Subscribers http://www.nationmaster.com/graph-T/med_pho_sub ++ United States GNI per Capita: http://www.worldbank.org/data/databytopic/GNIPC.pdf • Europe & Central Asia: Albania, Armenia, Azerbaijan, Belarus, Bosnia and Herzegovina, Bulgaria, Croatia, Czech Republic, Estonia, Georgia, Hungary, Kazakhstan, Kyrgyz Republic, Latvia, Lithuania, Macedonia FYR, Moldova, Poland, Romania, Russian Federation, Serbia and Montenegro, Slovak Republic, Tajikistan, Turkey, Turkmenistan |
|||||||
|
BOX 1-2 USAID is an independent government agency that provides economic, development, and humanitarian assistance in 100 developing countries. The types of assistance include technical assistance and capacity building, training and scholarships, food aid and disaster relief, infrastructure construction, small-enterprise loans, budget support, enterprise funds, and credit guarantees. USAID has partnerships with American businesses, private voluntary organizations, indigenous groups, universities, international organizations, other governments, trade and professional associations, faith-based organizations, and other U.S. government agencies. USAID has working relationships through contracts and grant agreements with more than 3,500 companies and over 300 U.S.-based private voluntary organizations. Its budget for FY 2005 was $9 billion, of which $3.7 billion was managed jointly by USAID and the Department of State, and $1.1 billion was PL-480 Food for Peace. SOURCE: USAID Primer: What We Do and How We Do It. Washington, DC: USAID, November 2005. |
indicated in Box 1-1. On a broader scale, Table 1-1 indicates the economic gap between industrialized and developing countries.
Science and technology (S&T) capabilities are fundamental for overcoming many types of problems in developing countries; for example, in the health sector, scientific research supported by the U.S. Agency for International Development (USAID) led to the development and introduction of oral rehydration therapy, which became the cornerstone of international efforts to control diarrheal diseases. The agency carried out research that established that two cents worth of vitamin A given to individual children every six months could reduce child mortality in many countries by over one-third.1
USAID’s mandate is very broad, of course, and its portfolio extends well beyond health, as indicated in Box 1-2. Many other development organizations have also financed research and innovation activities in almost all development sectors. In addition, multinational companies, private foundations, and international research centers have supported such activities in developing countries.
There is a growing consensus among development specialists that research and innovation are critical elements of the international effort to address difficult development issues within the much broader challenge of effectively applying S&T to address problems in many types of physical, political, and economic environments.
Problems in developing countries affect the United States in many ways; for example, emerging and endemic diseases, such as SARS, avian flu, and tuberculosis, cross borders at unprecedented rates as international flows of people and goods increase. Environmental threats—including regional air pollution, growing water scarcity, and dwindling biodiversity—affect local livelihoods as well as U.S. interests and the interests of many other nations.
As to direct U.S. benefits from S&T-based foreign assistance activities, modern technologies deployed in distant countries from vaccines to information systems can be important in limiting the extent that problems in these countries adversely affect both local populations and the broader global community. In addition, the talents and perspectives of geoscientists, biologists, and other researchers in poor countries contribute to international science. Unique innovations by local engineers and researchers to cope with problems prevalent in harsh environments often lead to broader replication such as the use of ferro-cement and new approaches to dry-land agriculture.
|
BOX 1-3 USAID has helped put Bangladesh’s number two export, shrimp, on a much firmer footing in the international market place by launching the Seal of Quality Program. Since exporters must respond to emerging global standards in food safety to receive the seal, the program helps ensure the long-term viability of exports currently valued at over $300 million annually. SOURCE: NRC report of field visit to Bangladesh, January 2005. |
Meanwhile, global trade is expanding, along with international integration of financial systems and growth of worldwide communication networks. However, many developing countries lack both the financial resources and the technical skills and experience to participate effectively in this globalization dynamic. Indeed, some are becoming victims of the process as global markets become more competitive, and long-standing trade patterns are disrupted. Many governments are uncertain about the new requirements of the World Trade Organization (WTO) and are deeply concerned that they will be isolated further from the mainstream of international commerce. How will they cope with strict enforcement of intellectual property rights, demands for higher levels of quality control of export products, and other legal obligations, they ask.
WTO is, nevertheless, a reality. Few countries have a choice other than to attempt to adjust their trade and related policies even if newly established international norms and standards adversely affect their economies. These adjustments in developing countries in turn often directly affect American consumers and American businesses. Box 1-3 sets forth an example of a USAID project in Bangladesh that has important implications for enhancing capabilities to meet current standards for international trade. A call for assistance related to international trade from the USAID mission in Bolivia is presented in Box 1-4. The situation there in 2004 exemplified the international uncertainty associated with the evolving trade environment.
|
BOX 1-4 Guidance on how USAID can most effectively use international trade negotiations and agreements to mutually support S&T developments in the United States as well as in host countries would be valuable. USAID has provided assistance on trade capacity building in a number of countries, including Bolivia. This assistance is directed to enhancing a country’s capability to participate effectively in trade negotiations, including expansion of civil society participation in the process, provision of training for officials on important trade topics, and technical assistance to private enterprises that are or could be involved in international trade. SOURCE: USAID Bolivia, December 2004. |
S&T, even when narrowly defined, are integral components of U.S. foreign policy and U.S. international programs—particularly foreign assistance activities. The United States benefits on many fronts from successful foreign assistance programs. These programs are now widely recognized in Washington as essential activities in promoting the national security interests of the United States.2
Foreign assistance, probably more than any other international endeavor, provides opportunities for the U.S. government and its partners to join on a continuing basis with political and economic leaders, intellectuals, and activists of dozens of countries in constructive dialogues and in concrete projects designed to enhance the quality of life of hundreds of millions of people. S&T are often the keystones for successful projects and therefore focal points for discussion and analysis.
In sum, the developing countries have urgent needs to use international S&T achievements effectively while the United States has innumerable opportunities for promoting humanitarian, political, economic, and national security interests through sharing its expertise in S&T. These mutually beneficial challenges pro-
vide the backdrop for this report on the role of S&T in foreign assistance. Maintaining and strengthening the contributions of the science, engineering, and medical capabilities of the United States to programs administered by USAID are the themes of the report. These contributions result in improved selection of assistance interventions, better-designed programs, more rigorous evaluations of the effectiveness of interventions, and broader applications of S&T.
SCIENCE AND TECHNOLOGY AS A BROAD PLATFORM FOR DEVELOPMENT
The interim report3 of this study released in October 2004 defined the term “science and technology” (S&T) as used throughout the study to include the natural sciences, engineering, technology, the health sciences, and the economic and social sciences. This report continues to include these disciplines within the scope of S&T. In most cases in the developing countries, S&T activities are components, or enabling elements, within programs directed to achieve educational, economic, social, and political objectives. This concept recognizes the pervasive role of S&T in development and is somewhat broader than more traditional definitions of S&T, which focus on research and science and engineering education.
From the vantage point of developing countries, S&T should involve interconnected national and international systems of activities that encourage the acquisition and generation of important knowledge and the application of this knowledge to improve the quality of life and the security of populations. Thus, S&T are fundamental building blocks for development.
In the context of U.S. foreign assistance, S&T are integral to the capacity of the public and private sectors in developing countries to:
-
Provide technical services that support economic and social development—such as provision of health care, education, agriculture extension, transportation, communications, maintenance and upgrading of water supplies and sanitation facilities, management of natural resources, and energy and environmental services;
-
Assess the technical and economic merits of technologies being considered for use in the country of interest and within that context carry out research, development, technology transfer, technology adaptation, and technology application activities;
-
Produce industrial goods and agricultural products based on technologies and modern management methods that are well suited to the local environment;
-
Prepare and evaluate implementation of economic, trade, industrial, agricultural, health, education, environmental, and other policies that have technical dimensions or that influence the acquisition and use of technical resources;
-
Participate in international trade negotiations, environmental treaty discussions, and other types of policy dialogues involving technical issues of political, economic, and social importance;
-
Conduct programs that heighten public awareness of the potential and limitations of modern technologies to improve the well-being of the public; and
-
Develop an appropriate physical infrastructure, human resource base, and educational and training institutions to support the foregoing activities.
|
BOX 1-5 As a result of Mali’s heavy dependence on agriculture, combined with a relatively inhospitable and increasingly fragile environment, Mali’s stability is directly linked to natural systems. It is essential to devote greater attention to how S&T resources can be used to sustain livelihoods without substantially degrading the natural resource base. SOURCE: Unpublished report of the NRC Committee on Science and Technology in Foreign Assistance on field visit to Mali, March 2005. |
Box 1-5 highlights concerns over inadequate attention to S&T in Mali where USAID has major programs but invests little in developing human resources trained in important S&T fields.
In addressing the role of USAID in capitalizing on the S&T strengths of U.S. and other organizations, this report gives special attention to the agency’s capabilities to:
-
Assess the S&T capacity of developing countries to design, manage, and evaluate programs that contribute to the development and maintenance of this capacity;
-
Evaluate available technologies and encourage development of promising new approaches while incorporating suitable technologies, research findings, and modern management methods in USAID projects—with special attention to facilitating the transfer of these methods and technologies to the developing countries themselves;
-
Participate effectively in interagency and international discussions involving S&T-related issues in developing countries while supporting and helping to coordinate U.S. government-wide S&T activities relevant to USAID’s development objectives; and
-
Recruit, retain, and effectively utilize personnel capable of supporting the foregoing activities.
USAID has valuable experience with each of these activities. Indeed, the agency has a long history of international leadership in mobilizing technical exper-
tise and related resources to promote development. Since the 1960s, USAID has been in the forefront among development agencies in institution building—for example, in supporting the establishment of high-quality technical universities; hospitals, clinics, and medical research centers; agricultural research and extension organizations; and environmental agencies and regulatory structures. While USAID’s interest in institution building has been on the decline in recent years, the committee nevertheless was able to draw on extensive experience of the agency in formulating its views as to future directions for institution building as well as other activities. Box 1-6 highlights one of USAID’s long-standing institution-building programs in Bangladesh.
|
BOX 1-6 The International Center for Diarrheal Disease Research in Bangladesh was established in 1978 with major support from USAID. It has had stunning success in developing treatments for these diseases, and its hospital in Dhaka now saves the lives of more than 30 children per day while spreading the results of its research and its experience in treating patients to tens of millions of children throughout South Asia. The center has been renamed the Center for Health and Population Research, reflecting its expansion to include hospital management, epidemiology, family planning, and child survival. SOURCE: Report of the NRC field visit to Bangladesh, January 2005. |
This report emphasizes the importance of considering S&T within a broad systems context that determines the effectiveness of the use of technologies in specific development sectors. At the same time, support of research and innovation, which are core aspects of more traditional definitions of S&T, should not be pushed aside; for example, Table 1-2 points out a number of important engineering challenges in the energy sector that require solutions based on research and innovation. Some of these challenges could be addressed by USAID and its partners, while others are more appropriate for the private sector. The importance of advances in this sector cannot be overstated given projected increases in the cost of energy as worldwide demand increases. Table 1-3 addresses the emerging field of nanotechnology.
PAYOFFS FROM INVESTMENTS IN S&T
A few developing countries where USAID has invested in large S&T-oriented programs (e.g., Thailand, Korea, Brazil) have demonstrated the payoff, particularly in increased labor productivity, from building an effective indigenous S&T infrastructure that enables the countries to use the technological achievements of others while gradually realizing the benefits of their own accom-
TABLE 1-2 Research and Training Challenges in Energy
|
Advances in wind technology are putting this technology within reach of some developing countries. Capital costs are likely to continue to drop over the next few years. |
|
Improving the energy efficiency of transportation systems has very large economic and environmental implications. |
|
Maintaining and upgrading conventional power plants is a challenge facing many developing countries. |
|
Developments continue in sophisticated control systems for power transmission and distribution systems, requiring additional training and maintenance capabilities. |
|
Hydrogen technology and fuel cells are of increasing interest in some developing countries. |
|
The integrated gasification combined cycle (IGCC) is increasingly the technology of choice for coal utilization. There may be pressure on development assistance to “buy down” capital costs and to provide training in plant operations. IGCC is much more complicated to operate and maintain than traditional coal plants. |
|
Some countries will export liquefied natural gas. Effective export and liquefaction facilities can be major S&T challenges. |
|
Carbon capture and storage are important for fossil fuel systems throughout the world. Key issues include capacity to develop the legal and regulatory frameworks as well as to evaluate and monitor activities. |
|
Reducing methane emissions from landfills, coal mines, and other fossil fuel sources is increasingly important, requiring technology transfer capabilities in developing countries. |
|
Cleaner fuels will continue to be a priority for health as well as environmental reasons in urban areas throughout the world. |
plishments.4 The adaptation of Western S&T approaches to local circumstances has been an important factor in the economic growth of these countries. On a more limited scale, many USAID-supported projects in a large number of countries with substantial S&T components have had very positive impacts in improving economic and social conditions. At the same time, an important lesson has been the need to encourage development of an innovative private sector (see Box 1-7). Unfortunately, many developing countries, particularly the poor countries of Africa, do not have the human resources, physical and economic infrastructures, and access to capital to take full advantage of the S&T expertise and achievements of the United States and other industrialized countries.
TABLE 1-3 Applications of Nanotechnology Relevant to Developing Countries
|
Renewable energy: Improved solar cells; production and safe storage of hydrogen. |
|
Agricultural productivity enhancement: Nanoparticles that deliver nutrients, fertilizers, and herbicides to crops and improve livestock nutrition. |
|
Water treatment and remediation: Portable and affordable filters made from nanomaterials; specially coated nanoparticles for chemical and magnetic processes that remove hazardous pollutants. |
|
Disease diagnosis and screening: Handheld technologies for blood diagnostics and for tests for hormone imbalances and diseases. |
|
Drug delivery systems: Hollow capsules and specially coated spheres for drug delivery; improved shelf life using nanomaterials. |
|
Food processing and storage: Improved plastic film coatings; sensors to detect contamination by pathogens. |
|
Air pollution and remediation: Destruction of air pollutants and improvement in the efficiency of catalytic converters. |
|
Construction: Less expensive and more durable housing materials, water-resistant asphalt and concrete, and self-cleaning surfaces for public facilities. |
|
Health monitoring: Biosensors that continuously track glucose, carbon dioxide, and cholesterol levels. |
|
Vector and pest detection and control: Specially targeted pesticides, insecticides, and insect repellents and sensors to detect pests. |
|
SOURCE: P. Singer et al. Harnessing nanotechnology to improve global equity. Issues in Science and Technology, University of Texas at Dallas (2005):58. |
|
BOX 1-7 There certainly are more private entities and networks that deal with S&T issues. A key issue in strengthening S&T capacity in developing countries will be how these can be tapped and how USAID can assist in these efforts. SOURCE: USAID Colombia, November 2004. |
For poor countries that cannot sustain a strong S&T infrastructure in the absence of unrealistically large external assistance programs, regional and other approaches may be appropriate for providing gateways to S&T that can contribute to improved economic and social progress. The experiences of the many regional S&T institutions that have been supported by USAID and other donors in recent years should be carefully examined to improve understanding of the cost-effectiveness and political feasibility of such approaches. USAID has extensive experience in twinning American institutions, primarily universities, with counterpart institutions in the poor
countries for periods as long as 20 years; and the importance of this networking in developing human capital deserves close examination to help guide efforts to emulate successful programs. In any event, the necessity to examine how S&T institutions can best respond to development requirements and capabilities country by country is clear.
A series of recent reports document the conclusions of a number of organizations that effective use of S&T can significantly enhance the development process. These reports include the following:
-
R. Watson, M. Crawford, and S. Farley. Strategic Approaches to Science and Technology in Development, Policy Research Working Paper. Washington, DC: The World Bank, April 2003.
-
House of Commons. The Use of Science in UK International Development Policy. London: House of Commons Science and Technology Committee, 2004.
-
The InterAcademy Council. Inventing a Better Future, A Strategy for Building Worldwide Capacities in Science and Technology. InterAcademy Council: Amsterdam: 2004.
-
U.N. Millennium Project, Task Force on Science, Technology, and Innovation. Innovation: Applying Knowledge in Development. Earthscan. Sterling, VA: 2005.
-
Canada’s International Development Research Center. Support to Science, Technology, and Knowledge for Development: A Snapshot of the Global Landscape. Canada’s International Development Research Center with the World Bank and the Rockefeller Foundation, 2005.
The reports argue that investments is S&T in developing countries, if appropriately targeted and sustained, can provide substantial benefit to local populations. Quantifying the cost-benefit ratio of investments in S&T in developing countries, however, has not been done in these reports or elsewhere. Studies of the impact of foreign assistance projects dependent on engineering skills have shown positive results. Efforts to correlate investments in basic research with economic growth have been plagued by methodological problems that are amplified in developing countries where basic standard-of-living improvements are often the most important outcome of such investments.5 Still, the numerous examples of the impacts of S&T investments cited in this report and in the reports
of others provide authoritative testimonials that carefully designed S&T-related programs can benefit populations in tangible ways.
Countries at all levels of development have a strong desire for more robust S&T capabilities. In the first instance, many would like to be able to use the products of decades of international research and innovation activity—whether the technology is a device to capture wind power, a genetic approach to improve plant resistance to pests, or software to optimize chemical production processes. As to their aspirations for a self-sustaining indigenous capability to develop, adapt, and use modern technologies effectively, the type and extent of an S&T capacity that can effectively respond to development challenges vary greatly among countries that are recipients of U.S. foreign assistance. But some capability—to understand the potential and limitations of S&T, to select suitable foreign technologies, and to develop local innovations—is a continuing need in every country.
In almost all developing countries, well-trained managers are increasing in number, and new groups of specialists trained in various S&T disciplines are emerging every year. If deployed within an appropriate political, economic, and organizational framework, the skills of the managers and specialists can contribute significantly to local efforts to overcome poverty, to promote sustainable development, and to realize benefits from private investment and expanded global commerce. Too often, however, these specialists are not well integrated into the priority activities of government and business organizations or do not have access to adequately equipped facilities where they can use their talents. When their human skills are left on the sidelines, a brain drain of top talent may follow. A key to effective use of S&T in developing countries is a long-term commitment by political and economic leaders of the governments to building and using technological capabilities as cornerstones of development.
As previously noted, there are vast differences in the capabilities of the many poor African countries with only a few trained S&T specialists to use technologies effectively and the technology-skilled middle-income countries where USAID has programs. Indeed, in some African countries, significant S&T capacity probably remains decades into the future. Limited capabilities are needed now, however.
In sum, S&T capacity on its own will be of little significance in developing countries. But when effectively integrated into the mainstream of development, S&T can make significant contributions to social and economic progress. Even in the poorest countries, investments in demand-driven S&T deserve priority. And even in the most advanced developing countries, investments in supply-driven S&T may have limited returns.
The importance of technology in development is illustrated in the December 2004 conclusions of the National Intelligence Council—an organization reporting to the Director of National Intelligence—after a year-long set of unclassified consultations on global trends with hundreds of experts throughout the world:
The gulf between “haves” and “have nots” may widen as the greatest benefits of globalization accrue to countries and groups that can access and adopt new technologies. Indeed, a nation’s level of technological achievement generally will be defined in terms of its investment in integrating and applying the new, globally available technologies—whether the technologies are acquired through a country’s own basic research or from technology leaders. Nations that remain behind in adopting technologies are likely to be those that have failed to pursue policies that support application of new technologies—such as good governance, universal education, and market reforms—and not solely because they are poor.
|
BOX 1-8 To adaptive nations go technology’s spoils. SOURCE: U.S. National Intelligence Council. Mapping the Global Future, Report of the National Intelligence Council’s 2020 Project, 2004. |
Those that employ such policies can leapfrog stages of development, skipping over phases that other high-tech leaders such as the United States and Europe had to traverse in order to advance. China and India are well positioned to achieve such breakthroughs. Yet, even the poorest countries will be able to leverage prolific, cheap technologies to fuel their own development—although at a slower rate.6
The “bottom line” of this assessment by the National Intelligence Council is highlighted in Box 1-8.
While there is wide recognition that S&T should be important components of the development process for even the poorest countries, the characteristics and extent of S&T capabilities and activities that are appropriate depend on conditions in the specific countries. The accumulated experience of American institutions over many years can help guide on a broad basis the approaches of both local governments and international partners in strengthening important elements of S&T infrastructures—approaches that usually call for significant adaptation of American concepts.
THE CHANGING GLOBAL ENVIRONMENT AND APPROACHES TO FOREIGN ASSISTANCE
Approaches to foreign assistance by different bilateral donors and international organizations vary greatly. Many are in a state of change in response to new global challenges, but several trends relevant to this study are clear.
-
Global programs rooted in S&T to combat infectious diseases, expand food supplies, and protect the environment, for example, are growing in number and size.
-
Some donors are moving toward providing budgetary support for activities in broadly defined areas of development. However, USAID continues to emphasize support of specific projects with well-defined boundaries and objectives in order to ensure that the agency does not fuel corruption.
-
Foreign assistance activities are increasingly intertwined with counter-terrorism efforts involving a number of national and international institutions active in foreign assistance activities, as exemplified by the situation in the Philippines described in Box 1-9.
-
Development agencies are giving greater attention to private sector development, which may lead to more emphasis on supporting engineering capacity and less attention to support of public sector research capacity.
-
Local civil society organizations are playing an increasingly important role in the implementation of foreign assistance programs, but few have strong S&T capabilities.
-
Africa, where many countries are plagued by economic stagnation, has emerged as a priority geographic area for assistance, as reflected in agreements at the G-8 Summit in Gleneagles, Scotland, in 2005.
-
The information revolution is having a dramatic effect on the design and implementation of assistance programs in almost all sectors.
Many additional developments are particularly important for USAID, including the following:
-
While USAID has lost much of its capability to manage large-scale nation-building programs, it must now recover such capabilities to address high-priority problems in Iraq and Afghanistan and possibly elsewhere, particularly in the fields of engineering, economics, and political science.
-
While some developing countries increasingly rely on modern manufacturing, information, and communications technologies to fuel economic development, USAID does not support the transfer of such technologies if they will be used to manufacture products or provide services that compete with products or services offered by American companies.
-
USAID’s poverty alleviation efforts seem concentrated in Africa, but some Asian countries with greater S&T capacities for supporting these efforts, such as Pakistan, deserve continuing support.
As the levels of assistance funding continue to increase and as programs expand in many directions, coordination of activities among the donor governments is increasingly important and complex. Coordination of S&T-related activities is particularly critical given the limited capabilities of developing countries to assess different approaches that may be advocated by different donors and
|
BOX 1-9 Many of the new directions of the USAID program have been determined by the strategic context of addressing global terrorism. Since September 11, many of USAID’s resources have been directed toward Mindanao in an attempt to address conflict more comprehensively. This includes decentralizing the healthcare system; reintegrating thousands of rebel soldiers into a peaceful economy; helping hundreds of communities take control over their forests, fish, and water; and completing the power sector reform. Dealing with so many different problems at once is clearly a challenge, but finally gives greater recognition to the interrelationship of poverty and conflict. SOURCE: Report of field visit to the Philippines, November 2004. |
their international and local partners. In most countries there are a limited number of adequately trained local collaborators who have both the technical and the management skills to direct international programs. In the absence of effective coordination, overloading the absorptive capacity of important local collaborators can easily occur with the possibility of wasting resources due to inadequate management attention.
Coordination should be carried out within the context of the priorities of the developing countries themselves, and the host governments should be at the center of coordination discussions. To the extent possible, these discussions should consider all relevant programs of the many international organizations, philanthropic organizations, and nongovernmental organizations involved in providing assistance at the country level. A particularly important challenge for USAID is to find its appropriate role among the expanding network of dozens of foreign assistance providers.
Private financial flows with S&T dimensions are of growing significance; for example, more important than in the past are foreign direct investment by technology-oriented companies, remittances to developing countries sent home by émigrés to support technical education opportunities for family and friends, business and other arrangements between diasporas in industrial countries and colleagues in their countries of origin, and initiatives by multinational companies together with local partners that protect the environment or otherwise benefit local populations. Private foundations sometimes support high-risk research projects in search of breakthroughs; Table 1-4 highlights a recent initiative of the Bill & Melinda Gates Foundation in addressing critical health problems.
The role of public-private partnerships in mobilizing financial and technological resources has moved up on the agendas of a number of development
TABLE 1-4 The Bill & Melinda Gates Foundation’s Grand Challenges to Global Health
|
Long-Term Goal to Improve Health in the Developing World |
Associated Grand Challenges |
|
Improve childhood vaccines |
|
|
Create new vaccines |
|
|
Control insects that transmit agents of disease |
|
|
Improve nutrition to promote health |
|
|
Improve drug treatment of infectious diseases |
|
|
Cure latent and chronic infection |
|
|
Measure health status accurately and economically in developing countries |
|
|
SOURCE: Gates Foundation, August 2005. |
|
organizations. Of considerable interest are the activities of the Global Alliance Office of USAID. This office has sponsored more than 300 public-private alliances. Many alliances draw on the technological capabilities of private sector partners. Box 1-10 describes a collaborative effort that USAID considers successful.
In 2000 the governments of the world banded together under the United Nations umbrella and agreed to address some of the most critical development
|
BOX 1-10 Ugandan university students will receive training in computer networks and high-tech manufacturing through a partnership involving USAID, the Ugandan Government, Cisco Systems, and Electronic Data Systems. Cisco is providing $8 million and USAID $2 million to create 10 network academies in the Uganda university system. EDS will provide $4.2 million and USAID $100,000 to train Ugandan students in computerized manufacturing, with the goal of making Uganda a high-tech engineering and manufacturing hub in East Africa. SOURCE: USAID website, June 2005. |
problems. They identified the following eight Millennium Development Goals and established targets for meeting these goals:
-
Eradicate extreme poverty and hunger;
-
Achieve universal primary education;
-
Promote gender equality and empower women;
-
Reduce child mortality;
-
Improve maternal health;
-
Combat HIV/AIDS, malaria, and other diseases;
-
Ensure environmental sustainability; and
-
Develop a global partnership for development.
Alleviating the most abject manifestations of poverty reflected in these goals became an important objective of many foreign assistance programs. As indicated in Box 1-11, S&T have been recognized as critical components of efforts to meet these goals.
|
BOX 1-11 To help drive economic development and to enable developing countries to forge solutions to their own problems, a significantly increased global effort is required to support research and development to address the special needs of the poor in the areas of health, agriculture, natural resources and environmental management, energy, and climate. SOURCE: K. Annan. In Larger Freedom: Towards Development, Security and Human Rights for All. New York, NY: UN, March 21, 2005. |
Three objectives should continue to be at the top of the list of the international development agenda, namely, reducing poverty; building local capacity to stimulate and support economic and social progress while absorbing the shocks of natural and human-induced disasters; and enabling developing countries to adjust to globalization. For countries to achieve success in each of these areas, access to S&T together with the development of human capital can and must play a key role. Without continuing access to some level of S&T, no country will be able to reach a level of development that fulfills the most basic aspirations of its people.
EXPANSION OF ASSISTANCE-RELATED ACTIVITIES WITHIN THE U.S. GOVERNMENT
The responsibilities of the U.S. government for programs in developing countries are rapidly expanding and diffusing among 40 departments and agencies, with USAID now financing only about 50 percent of the government’s international development programs. The independent Millennium Challenge Corporation (MCC) has a multibillion-dollar development program now directed to 23 countries although it has been slow in launching its initial projects. The Department of State has relatively new responsibilities for programs directed to combating HIV/AIDS, also with an annual budget in the billions of dollars, and its program is moving forward very quickly. A number of other U.S. departments and agencies, international organizations, and private foundations finance directly related activities as indicated in Figure 1-1.
A new office in the Department of State is responsible for planning and coordinating reconstruction activities following hostilities in countries around the globe. In addition to USAID, the Department of Defense continues to be a major contributor to reconstruction efforts in war-torn countries and plays a critical role in responding to humanitarian disasters. Many other departments and agencies, including the Centers for Disease Control and Prevention, Department of Agriculture, Environmental Protection Agency (EPA), and Department of Energy, for example, have expanded the international dimensions of their mission activities that overlap with traditional development activities. A large fraction of these programs have substantial S&T components.
USAID’S ROLE IN SUPPORTING S&T WITHIN FOREIGN ASSISTANCE
Within this myriad of expanding activities, USAID has unique and broad legislative authority for bilateral foreign assistance programs, but its role in carrying out this authority is increasingly determined by congressional earmarks and White House initiatives. As indicated in Table 1-5, many of these special programs are based in large measure on S&T.
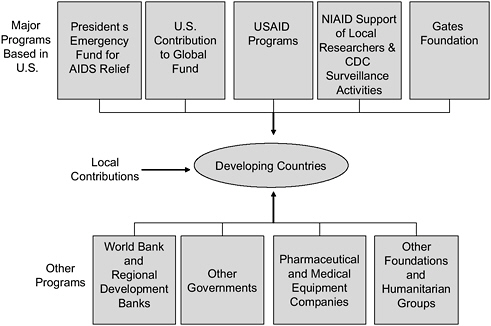
FIGURE 1-1 Organizations involved in combating HIV/AIDS in developing countries.
Earmarks and initiatives will undoubtedly continue to play an important role in determining the priorities for USAID and, indeed, in sustaining important programs. For example, earmarks in human reproduction, child health, and population have helped to maintain a balance in the overall health portfolio increasingly focused on HIV/AIDS. Nevertheless, some earmarks may be low-payoff distractions. USAID should ensure that all earmarked programs are subjected to external evaluation, along with other USAID-supported programs, to assess whether they are contributing effectively to foreign assistance objectives. When the special interest programs prove not to be cost-effective or support only narrow and relatively insignificant objectives, the White House and Congress should be informed promptly (see Box 1-12).
|
BOX 1-12 In carrying out the mandate of a congressional earmark, the NGOs financed by USAID are primarily concerned with biological conservation and do a reasonable job in that regard. However, there is little thought given to building local capacity. When this does occur, it appears to be incidental to other objectives. SOURCE: Report of the NRC field visit to Central America, January 2005. |
Since S&T are integral components of many foreign assistance activities,
TABLE 1-5 Examples of Earmarks and Special Initiatives
|
Examples of USAID Earmarks (2005 appropriations in millions of dollars) |
Presidential Initiatives |
Administration Initiatives |
|
|
|
|
SOURCE: USAID, May 2005. |
||
consideration of USAID’s efforts to draw on the nation’s S&T capabilities in carrying out its programs must begin with consideration of USAID’s broader role in foreign assistance. To this end, the committee considered the three models set forth below that could define USAID’s role during the next few years, particularly with regard to development assistance. The committee recognized that programs to provide humanitarian assistance, disaster relief, and reconstruction in war-torn regions might require somewhat different models that emphasize greater flexibility and more rapid deployment.
-
USAID could focus narrowly on several development issues—perhaps health, agriculture, and education—and develop strong internal expertise and a wide range of specialized external resources required to assist host governments develop the capability to design, implement, and manage all aspects of development interventions in these fields.
-
USAID could return to its role of decades past as a provider of S&T support across the multiple dimensions of foreign assistance that are likely to be required by low-income countries. It would support a wide array of long-term programs to build institutional capacity in developing countries, relying on greatly expanded internal technical staff capabilities to provide leadership in defining and implementing institutional development programs in many fields.
-
USAID could continue its current course of being a program management agency, responding to problems that emerge in many fields of interest to the developing countries, the Congress, and the Administration. It would use a combination of internal staffs of direct-hire specialists, assignees from other U.S. agencies, and contractor personnel to develop strategies and manage programs that are implemented by USAID’s partners.
In considering these options, the committee took into account:
-
The organizational structure and programs currently in place and the likelihood they will continue throughout this Administration;
-
The earmarks and White House initiatives that range over many topics as noted above;
-
The steady decline in USAID’s internal technical capabilities and the ceilings on direct-hire staff and other personnel embedded in the agency;
-
The recent decline in long-term institution-building programs financed by the agency; and
-
The unique capabilities of USAID to provide field perspectives on development issues.
In addition, the decisions of the Administration to establish an independent MCC and to assign major responsibilities for HIV/AIDS to the Department of State rather than entrusting these two initiatives to USAID have eroded the
agency’s stature as the nation’s preeminent foreign assistance provider, thereby complicating recruitment and retention of high-quality foreign assistance practitioners with S&T expertise.
The committee believes that a modification of the third option is the most realistic vision during the next several years for improving USAID’s capabilities to contribute to the nation’s foreign assistance effort while drawing on appropriate S&T resources in achieving its goal. USAID will, of course, continue to follow the decisions of the Administration and Congress to support program activities in many fields within USAID’s established program framework of governance and humanitarian assistance, reconstruction in war-torn areas, global health, and broadly defined economic growth. However, the agency should to the extent possible select a few niche areas within this framework where it could concentrate resources and be an international leader as it has become in its support for democratic governance. Criteria for selecting areas of emphasis should include (1) high levels of developing country interest, (2) opportunities to have significant impacts on development, (3) relevance of USAID’s unique field experience, and (4) limited interest of other U.S. departments and agencies in providing substantial financial support for activities in the area.
Programs in some or all of the areas will undoubtedly require substantial S&T inputs. One example of a possible area of emphasis is health delivery systems, an area the committee strongly supports. Other examples the committee believes should be considered are small innovative firms, natural resource management, agriculture extension, and information technology. Each of these areas reflects the criteria set forth above. The program emphasis within each niche area should be institution building, including establishment of research, education, training, and service capabilities. This report calls for support of schools of public health to do just that, as discussed in Chapter 3.
In order to continue to support its current portfolio of programs as well as new activities in the areas of emphasis, USAID needs stronger in-house technical staff capabilities. As recommended in Chapter 4, the agency should recruit an adequate number of technically trained direct-hire employees to lead the design and evaluation of institution building and innovative activities, particularly in the specific areas selected.
Within USAID’s missions, the capabilities of personnel to identify opportunities for innovation and to hold their own in technical discussions with highly trained professionals from host countries and other donors have also eroded and need strengthening. Of special importance is a capability within the USAID missions to understand the development potential and limitations of programs of other U.S. departments and agencies and to provide these organizations with field perspectives that will increase their contributions to social and economic development.
WORKING BOTH AT THE FRONTIERS AND IN THE MAINSTREAM OF S&T
USAID has recorded many successes in facilitating the use of S&T to overcome obstacles to development; for example, wheat-rice rotation schemes have dramatically increased agriculture production in Bangladesh. The development of a policy framework for energy networks has brought electrical power to thousands of remote villages in South Africa. In Namibia a USAID partnership with Microsoft and Compaq has developed effective e-government services and has enhanced civil participation in parliamentary affairs.
Biotechnology, nanotechnology, electronic technology, and other technological areas may be opening new vistas to improve life in poor countries. USAID should be fully aware of the potential and limitations of such technologies. Even more importantly, USAID should have a strong capability to draw on many proven technologies in ensuring that its investments in international development have the largest possible returns.
S&T sensitivity throughout the agency can have significant payoffs. Up-to-date awareness of S&T development is increasingly important in both stimulating and coordinating innovative activities not only within the U.S. government but also in partnership with foreign donors, multinational corporations, and international NGOs.
|
BOX 1-13 At the interagency meeting on developing an early warning system for future tsunamis all that other agencies wanted from USAID was money to enable them to buy hardware for their satellite and related systems. SOURCE: Personal communication to committee staff from a senior USAID official, May 2005. |
The effects of the erosion of USAID’s technical capacity during the past two decades are evident in Washington and in the field. USAID is increasingly viewed as simply a mechanism to pass through funds to other organizations as reflected in Box 1-13. Its competence as an agency steeped in development realities but staying abreast of rapidly advancing technological opportunities is doubted by other U.S. departments and agencies in spite of its long history as an intellectual leader in many successful development enterprises. This characterization of USAID needs to be changed, and a strengthened S&T orientation within the agency will go a long way toward enhancing the agency’s role and credibility as a leader in international development while improving the effectiveness of U.S.-supported programs.
This chapter has highlighted the potential contributions to international development of modern technologies. Some of these technologies may be within the grasp of developing countries. Others may be only long-term targets for poor nations, but there are also simple innovations that can be used effectively even in
the poorest countries (e.g., pedal driven ground water pumps, plastic bottles that measure and contain the correct amount of bleach needed to destroy bacteria in dispensers of drinking water, and concrete towers supporting electronic connections for transmitting signals of mobile telephones). As USAID intensifies its efforts to enhance the capabilities of developing countries to use more advanced technologies, the agency must not neglect the incremental improvements that can be realized through wider use of technologies that have been available for many years.
|
BOX 1-14 I can’t tell you the number of times our counterparts (and beneficiaries) have said that as much as they welcome our funding, they would welcome even more our ability to engage on technical matters. USAID Kosovo, Dec. 2004. |
The importance of USAID’s field experience in helping to ensure that U.S. assistance efforts involving S&T are sound and have impact cannot be overstated. A report from USAID Kosovo, highlighted in Box 1-14, underscores this experience.
CAN A STRONG SCIENCE AND TECHNOLOGY PRESENCE BE SUSTAINED WITHIN USAID?
A fundamental tension has existed in the U.S. foreign assistance program since its inception, taking on increasingly virulent expression as budget pressures increased in the post-Vietnam era. The basic division has been between constituencies that embrace basic human needs, or bottom-up development, versus other constituencies that focus on technology transfer, stimulation of economic growth, and diffusion of benefits to the general population from innovative nodes in the economy and society. The 1960s and the 1970s saw tremendous swings from the latter to the former, setting the stage for another swing of the pendulum back to the latter as a result of disappointments with the results of diffuse grassroots investments of the 1970s.
In the early 1980s the USAID leadership embraced S&T as essential drivers of development while recognizing many other benefits to the United States from expanded cooperation in S&T. In the wake of the Green Revolution and the emerging technological achievements of the Asian tigers (Taiwan, Korea, Singapore, and Hong Kong), USAID was restructured and the recruitment of technically trained development practitioners expanded. A rapidly expanding budget between 1981 and 1986 facilitated an approach that could increase S&T activities substantially while still maintaining traditional U.S. leadership in child survival, nutrition, food aid, and other household interventions.
As might be predicted, less than a decade later, a new USAID leadership in the 1990s was determined to change directions and support a new variant of the
grassroots approach. In the face of substantial budgetary cutbacks wherein both approaches could not be supported simultaneously, S&T capabilities rapidly declined. S&T proponents within and outside USAID, particularly land-grant universities, had simply not produced sufficient evidence in a decade to balance the claims of the basic-human-needs constituencies (with ever-shortening time horizons) that long-term investments in S&T were not justifiable. In short, in the view of many, USAID’s S&T activities in the 1980s and their subsequent demise reaffirmed the fundamental split between the development groups in Washington and among larger political constituencies.
As we enter the twenty-first century, it will be difficult to persuade some foreign assistance constituencies that an approach that highlights the role of S&T in USAID programs is warranted. There are, however, constituencies that recognize that even the poor countries want to reap benefits from globalization, and they recognize that S&T must play an important role. We are clearly in another era of robust resources that are available for foreign assistance. With nearly $20 billion annually in the foreign operations budget category alone, there should now be an opportunity for a revitalized S&T effort aimed at long-term economic growth while still maintaining support for grassroots and good governance programs. Stronger health systems and expanded information dissemination capabilities should become core concerns of the very constituencies that have been reluctant to embrace S&T as a priority.
As globalization of problems, institutions, and solutions moves forward, the need for S&T capabilities tethered to activities in all development sectors is greater than ever. Thus, S&T must become integrated into the U.S. government’s presence abroad on a wide front, and concretely into USAID’s activities. The entire foreign assistance establishment must recognize S&T achievements as crucial enablers of development and not simply as endpoints. Just as governance has become a significant overarching rationale for much of America’s global presence, so S&T must be recognized as an essential platform for transforming aspirations for better lives into durable and practical reality. Only then will the sustainability of a strong S&T component within USAID be assured.


