
Panel III
Software Measurement—What Do We Track Today?
INTRODUCTION
Kenneth Flamm
University of Texas at Austin
Dr. Flamm, welcoming the audience back from lunch, said that discussion of software’s technical aspects was to give way now to an examination of economic and accounting issues. He introduced Prof. Ernst Berndt of MIT’s Sloan School of Management, a pioneer in developing price indexes for high-tech goods, and Dr. Alan White of Boston’s Analysis Group, Inc., to jointly report on their analysis of prepackaged software prices.32
MEASURING PRICES OF PREPACKAGED SOFTWARE
Alan G. White
Analysis Group, Inc.
Dr. White began by disclosing that Microsoft had funded most of the research on which he and Dr. Berndt had been collaborating, a pair of studies conducted over the previous 4 years. Counsel for Microsoft had retained Dr. Berndt in 2000 to work on price-measurement issues in the software industry, his essential tasks having been to demonstrate how to measure software prices, and to explain how they had been changing over time. Dr. White said that he and Dr. Berndt would not be speaking about the merits or otherwise of Microsoft’s actions, but rather would describe their own work in estimating price changes for prepackaged software over time.
Although better estimates of price change existed for prepackaged than for own-account or custom software, Dr. White said, many of those studies were old, dating to the late 1980s or early 1990s. And, in any event, important challenges remained for those constructing measures of price and price change, even when their activity focused on prepackaged software. One such challenge, at the fundamental level, was ascertaining which price to measure, since software products may be sold as full versions or upgrades, as stand-alone applications or suites. Evoking Windows to demonstrate the complexity of this issue, Dr. White ran down a variety of options: buying a full version of Windows 98; upgrading to Windows 98 from Windows 95; or, in the case of a student, buying an academic version of Windows 98. Other product forms existed as well: An enterprise agreement differed somewhat from a standard full version or an upgrade in that it gave the user rights to upgrades over a certain period of time. The investigators had to determine what the unit of output was, how many licenses there were, and which price was actually being measured. Adding to the challenge was the fact that Microsoft sold its products through diverse channels of distribution. It was selling through original equipment manufacturers (OEMs) like Compaq, Dell, and Gateway, which bundled the software with the hardware, but also through distributors like Ingram and Merisel. Prices varied by channel, which also needed to be taken into account. Another issue, to be discussed by Dr. Berndt, was how the quality of software had changed over time and how that should be incorporated into price measures. These issues had to be confronted, because measuring prices matters for producing an accurate measure of inflation, which is used to deflate measures of GDP both at an aggregate level and by sector.
Prices Received by Microsoft Declined Between 1993 and 2001
Dr. White said he would discuss one of two studies he and Dr. Berndt had done, both of which showed that software prices had been declining. The study
Dr. White would summarize used internal Microsoft transaction data and thus was situated “essentially at the first line of distribution,” taking into account both primary channels through which Microsoft was selling its products, the OEM channel and the finished-goods or distributor-wholesale channel. The prices he would be referring to would thus be those that Microsoft had received, and whose levels had declined between 1993 and 2001.
In constructing measures of price change, Drs. White and Berndt needed to take into account not only such issues as full versions and upgrades, or academic and non-academic licenses, but also volume license agreements and the shift, which had begun in the 1990s, to selling word processors and spreadsheets as part of a suite rather than as stand-alone applications. In the early 1990s, about 50 percent of word processors were sold as stand-alone components, a percentage that had decreased considerably. Excel and Word were now more commonly sold through the Office suite, with stand-alone sales of the latter dropping to fewer than 10 percent in 2001 from over 50 percent in 1993. Volume licensing sales, representing sales to large organizations in the form of a 500-site license or a 1,000-site license, for example, had grown for Microsoft over time. As to the two channels of distribution through which Microsoft sold, operating systems were sold predominantly through the OEM channel, whereas applications were sold predominantly through distributors.
The study employed matched-model price indexes generally consistent with Bureau of Labor Statistics (BLS) procedures that treated full versions and upgrades as separate products, or separate elementary units, in constructing measures of price change. Dr. White posted a chart demonstrating that price changes varied quite a bit depending on the product, although all Microsoft software product categories posted declines in 1993-2001 for an overall annual average growth rate of minus 4.26 percent during that period (See Figure 10). The rate of decline also varied somewhat within the period studied (See Figure 11). He stressed that the study, based exclusively on prices received by Microsoft, did not necessarily say anything directly about changes in the prices paid by final consumers. In addition, quality change was not explicitly incorporated into its measures of price change, but Dr. Berndt was about to deal with that subject in his talk.
Ernst R. Berndt
MIT Sloan School of Management
Addressing quality change and price measurement in the mail-order channel, Dr. Berndt stated that since the mail-order channel included prices of products that competed with those of Microsoft, a study of it had its advantages over a study limited to the Microsoft transactions data. The disadvantage, however, was that the mail-order channel was becoming increasingly less important, as most current sales were going through the OEM channel and through the resellers or
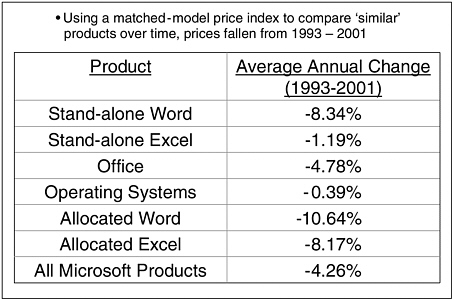
FIGURE 10 Microsoft’s prepackaged software prices have declined at varying rates.
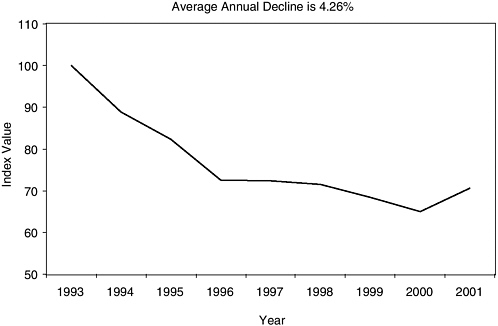
FIGURE 11 Microsoft’s prepackaged software prices have declined, 1993-2001.
NOTE: AAGRs are -7.79% (1993-1997), -0.60% (1997-2001), -4.26% (1993-2001).
SOURCE: Jaison R. Abel, Ernst R. Berndt and Alan G. White, “Price Indexes for Microsoft’s Personal Computer Software Products,” NBER Working Paper No. 9966, Cambridge, MA: National Bureau for Economic Research, 2003.
distributors channel. Drs. Berndt and White had conducted this part of their study for two reasons: (1) because there had been a lot of previous work on the retail channel; and (2) because they had wanted to construct some measures of quality change, or hedonics, for operating systems and productivity suites that, to the best of their knowledge, had not been done before.
Surveying the types of quality changes that might come into consideration, Dr. Berndt pointed to improved graphical user interface and plug-n-play, as well as increased connectivity between, for example, different components of the suite. Greater word length, embedded objects, and other sorts of quality change should be taken into account as well. Hedonic price indexes attempt to adjust for improvements in product quality over time using multivariate regression techniques in which the left-hand variables are prices and the right-hand variables are various measures of quality, and into which time is also incorporated. The product attributes for operating systems had been taken from various documents over the 13-year period between 1987 and 2000; a sample done for productivity suites using prices taken from mail-order ads in the magazine PC World covered a longer period, 1984-2000, and also included quality attributes and price measures.
Different Computations, Different Curves
Posting a graph showing the basic results for operating systems, Dr. Berndt explained the three curves plotted on it: “Average Price Level,” representing the price per operating system computed as a simple average, which showed an average annual growth rate of roughly 1 percent; “Matched-model,” mimicking BLS procedures by using a matched-model price-index methodology, which showed a decline of around 6 percent a year, “a considerably different picture”; and “Hedonic,” using a traditional approach of multivariate regressions, which showed a much larger rate of price decline, around 16 percent a year (See Figure 12). Splitting the sample into two periods, 1987-1993 and 1993-2000, highlighted considerable variability in price declines with some more recent acceleration.
For productivity suites, the story was slightly different (See Figure 13). The “Average Price Level” had fallen very sharply in the final few years of the study, in part, because prices for WordPerfect and Lotus suites were slashed beginning around 1997. The “Matched-model” index showed a decline of not quite 15 percent per year with a marked difference between the first and second halves of the sample: zero and minus 27, respectively. “Hedonics” in this case had shown a rate of price decline that was on average a bit larger than that shown by “Matchedmodel” over the same period.
Recapping the two studies, Dr. Berndt expressed regret at not being able to procure data on the rest of the market, saying that “remains a big hole,” but noted that even Microsoft was unable to get data on its competitors’ prices. He also pointed to an interesting methodological question arising from the studies: How
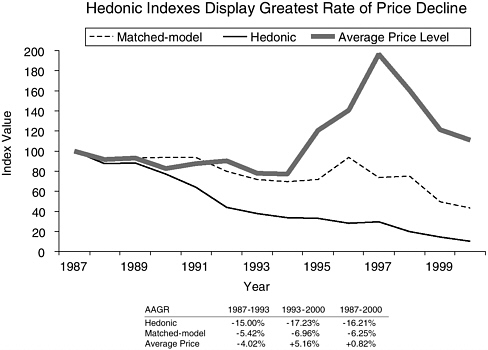
FIGURE 12 Quality-adjusted prices for operating systems have fallen, 1987-2000.
SOURCE: Alan White, Jaison R. Abel, Ernst R. Berndt, and Cory W. Monroe, “Hedonic Price Indexes for Operating Systems and Productivity Suite PC Software” NBER Working Paper 10427, Cambridge, MA: National Bureau for Economic Research, 2004.
can software price changes be measured and related to consumer-demand theory when software is sold bundled with hardware? The economic theory of bundling was well worked out only for cases in which consumers are very heterogeneous, he stated, adding, “And that’s why you bundle.” But a price index based on economic theory that is based on heterogeneous consumers raises a number of very difficult measurement issues, as well as theoretical issues.
DISCUSSION
Hugh McElrath of the Office of Naval Intelligence asked Dr. White whether Microsoft had shared its per-unit prices with him or the data had become public in conjunction with a court case.
Dr. White said that he and Dr. Berndt had had access to Microsoft’s internal transactions data because it was part of litigation proceedings. He emphasized, however, that their study presented an index based on the per-unit prices they had received but did not disclose actual price levels.
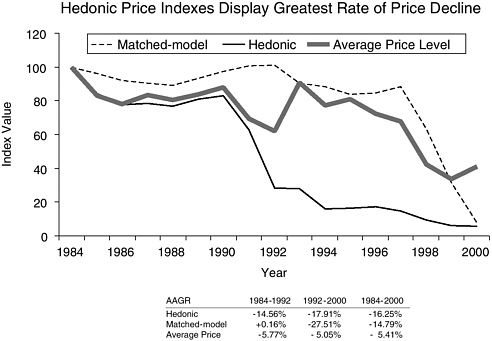
FIGURE 13 Quality-adjusted prices for productivity suites have fallen, 1984-2000.
SOURCE: Alan White, Jaison R. Abel, Ernst R. Berndt, and Cory W. Monroe, “Hedonic Price Indexes for Operating Systems and Productivity Suite PC Software” NBER Working Paper 10427, Cambridge, MA: National Bureau for Economic Research, 2004.
Dr. Flamm pointed to the discrepancies between the MS sales matched-model and hedonic price index results, and the reasons that might be behind them, as an interesting aspect of these two presentations. He asked whether a decline in mail-order margins over time, perhaps with greater competition in the field, could account for them. Second, he wondered whether a matched-model price index could fully capture pricing points between generations of products and speculated that a hedonic index might be able to do so, offering as an example the movement downward of Office-suite prices from one generation to the next. Third, he asked whether it was correct that bundling was mandatory for most U.S. OEMs and, as such, not a decision point, saying he recalled that Microsoft had threatened to sue computer manufacturers if they did not license Windows when they shipped the box.
While Drs. Berndt and White admitted that they could not answer Dr. Flamm’s last question with total certainty, Dr. Berndt said that he had been looking at a different question: how to put together a price index that was consistent with consumer-demand theory when bundling is occurring. And he reiterated that the pricing theory on bundling usually put forward was based on heterogeneous consumers.
Dr. Flamm responded that he was only commenting that, in this case, bundling might not have been entirely voluntary on the part of the manufacturers. He then introduced Shelly Luisi, the Senior Associate Chief Accountant in the Office of the Chief Accountant of the U.S. Securities and Exchange Commission (SEC), who was to talk in tandem with Greg Beams of Ernst & Young about accounting rules for software.
ACCOUNTING RULES: WHAT DO THEY CAPTURE AND WHAT ARE THE PROBLEMS?
Shelly C. Luisi
Securities and Exchange Commission
Ms. Luisi said that while she and Mr. Beams would both be addressing the financial reporting that affects software, she would speak more on a conceptual level, while Mr. Beams would speak more about the financial standards specific to software companies and to recognizing software development. Before beginning her talk, she offered the disclaimer that all SEC employees must give when they speak in public, that the views she would express were her own and did not necessarily represent those of the commissioners or other staff at the Commission.
Beginning with a general rundown of the objectives of financial reporting, Ms. Luisi explained that the Financial Accounting Standards Board (FASB) has a set of concept statements that underlie all of its accounting standards and that the Board refers back to these statements and tries to comply with them when promulgating new standards. The Board had determined three objectives for financial reporting:
-
furnishing information useful in investment and credit decisions;
-
furnishing information useful in assessing cash flow prospects; and
-
furnishing information about enterprise resources, claims to those resources, and changes in them.
These objectives stem primarily from the needs of the users of the financial statements, which FASB has defined as investors, whether they are debt investors or equity investors.33 In light of a general sentiment that financial statements
|
33 |
Debt investment is investment in the financing of property or of some endeavor, in which the investor loaning funds does not own the property or endeavor, nor share in its profits. If property is pledged, or mortgaged, as security for the loan, the investor may claim the property to repay the debt if the borrower defaults on payments. Equity investment is investment in the ownership of property, in which the investor shares in gains or losses on the property. Definitions of the U.S. Department of Treasury can be accessed at <http://www.ots.treas.gov/glossary/gloss-d.html>. |
should be all things to all people, it is important to realize when looking at financial statements that the accounting standards used to create them are developed with only one user in mind: the investor. “They are not made for regulators, as much as we might like them to be made for us,” Ms. Luisi observed. “They are not made for economists to study. They are not even made for management.” It is the goal of providing this one user, the investor, with unbiased, neutral information that shapes accounting standards. The goal is not to influence investors in a given direction or to get public policy implemented in a certain way by making a company appear a certain way; it is purely to present unbiased, neutral information on the basis of which investors can do their own research and determine what decisions they want to make regarding an investment.
Financial statements are part of financial reporting. Disclosures are also part of financial reporting, and they are very important. When promulgating standards, FASB uses disclosures extensively; that a number is not to be found in a financial statement does not mean that the Board has decided it was unimportant. Disclosures are very important from the SEC perspective as well, noted Ms. Luisi, adding, “We obviously have our own requirements in MD&A [Management’s Discussion and Analysis] and various other places—in 10-Ks (a type of SEC filing) and registration statements—requiring disclosures that we think are important.”
Qualifications for Recognition vs. Disclosure
There are three primary qualifications distinguishing information that must be recognized in a financial statement from information that merely needs to be disclosed. Information that must be recognized:
-
must meet the definition of an element; assets, liabilities, equity, revenue, expenses, gains, and losses are in this category.
-
must trip recognition; an example of an asset that meets the definition of an element but doesn’t trip a criterion for recognition is a brand’s name. “Surely [Coca-Cola’s] brand name is an asset, surely it has probable future economic benefits that they control,” acknowledged Ms. Luisi, “but, in our current financial accounting framework, they haven’t tripped a recognition criterion that would allow them to recognize that asset on their balance sheet.” and
-
must have a relevant attribute that is capable of reasonably reliable measurement or estimate. While historical cost was considered to be such an attribute in the past, the world has been moving more and more toward fair value, defined as “the amount at which an asset (or liability) could be bought (or incurred) or sold (or settled) in a current transaction … other than a forced sale or liquidation.”
Moving to the terms “asset” and “liability,” Ms. Luisi stressed that their definitions and uses in accounting are not the same as in common English or,
perhaps, in economics. In its concept statements, the FASB has defined “asset” and “liability” as follows:
-
Asset: probable future economic benefits obtained or controlled by a particular entity as a result of past transactions or events
-
Liability: probable future sacrifice of economic benefits arising from present obligations of a particular entity to transfer assets or provide services to other entities in the future as a result of past transactions or events
She stressed that a future economic benefit must be probable, it cannot not merely be expected, in order to be recorded on a balance sheet as an asset. Additionally, that probable future benefit must be controlled as part of a past transaction; it cannot depend on the action of another party. “You can’t say, ‘This company has put out a press release and so we know that it is probable that they are going to do something that will result in value to us,’ ” she explained. “You don’t control that benefit—you can’t make them follow through.”
Tracing how the capitalization (or estimation of value) of software on the balance sheet arrived at its current form, Ms. Luisi recounted that in October 1974 the FASB put out Statement of Financial Accounting Standards No. 2 (FAS 2), Accounting for Research and Development Costs. The Board’s move to issue this statement the year following its creation indicates that, from the very beginning, it placed a high priority on the matter. This impression is strengthened by the fact that the Board held public hearings in 1973 while deliberating on FAS 2, and the fact that it cited National Science Foundation statistics on R&D in its Basis for Conclusion on the standard. The Board’s decision—which predates even its putting in place a definition for an asset—was that R&D was an expense, with the Basis for Conclusion stating that R&D lacks a requisite high degree of certainty about the future benefits to accrue from it.
FASB Rules Software Development to Be R&D
Four months after FAS 2 came out, an interpretation of it, FASB Interpretation No. 6 (FIN 6), was issued. FIN 6, Applicability of FASB Statement No. 2 to Computer Software, essentially said that the development of software is R&D also. FIN 6 drew an interesting line between software for sale and software for operations, for which reason different models apply today to (a) software developed to be sold or for use in a process or a product to be sold and (b) software developed for internal use, such as in payroll or administrative systems. Ten years thereafter, in 1985, the Board promulgated FAS 86, Accounting for the Costs of Computer Software to be Sold, Leased, or Otherwise Marketed, which Ms. Luisi characterized as “a companion to FAS 2.” From FAS 86 came the concept in the accounting literature of “technological feasibility,” that point at which a project under development breaks the probability threshold and qualifies as an asset.
FAS 86 thereby gives a little more indication of how to determine when the cost of software development can be capitalized on the balance sheet rather than having to be expensed as R&D.
But 13 more years passed before the promulgation of Statement of Position 98-1 (SOP 98-1), Accounting for Costs of Computer Software Developed or Obtained for Internal Use, by a subgroup of the FASB, the Accounting Standards Executive Committee (AcSEC). It was at the recommendation, or request, of the Securities and Exchange Commission’s chief accountant in 1994 that SOP 98-1 was added to the AcSEC’s agenda and created. During the intervening time, practice had become very diverse. Some companies, analogizing to FAS 86, were reporting their software-design costs as R&D expenses; others, regarding software used internally more as a fixed asset, were capitalizing the costs. SOP 98-1 set a different threshold for capitalization of the cost of software for internal use, one that allows it to begin in the design phase, once the preliminary project stage is completed and a company commits to the project. AcSEC was agreeing, in essence, with companies that thought reaching technological feasibility was not prerequisite to their being in a position to declare the probability that they would realize value from a type of software. It is worth noting that AcSEC’s debate on SOP 98-1 extended to the issue of whether software is a tangible or intangible asset. Unable to come to a decision on this point, the committee wrote in its Basis for Conclusion that the question was not important and simply said how to account for it. Ms. Luisi said she believed that, in most financial statements, software is included in property, plant, and equipment rather than in the intangible-assets line and is thus, from an accountant’s perspective, a tangible rather than an intangible asset.
Further FASB Projects May Affect Software
At that time, the FASB was working on a number of projects with the potential to affect how software is recognized on the balance sheet:
-
Elements. With regard to the three qualifications for recognition in financial statements, the Board was going increasingly to an asset/liability model for everything. She noted that “the concepts of an earnings process to recognize revenue are going away,” and “the concepts of ‘this is a period expense, it needs to be on the income statement’ are going away.” This represented an important change to the accounting model that most contemporary accountants were taught in school and had been applying, and one that required an adjustment. Internally developed software was recognized on a balance sheet, unlike such intangible assets as a brand name. And, while it was recognized at a historical cost, it had tripped a recognition criterion.
-
Recognition. With the Internet bubble of the previous decade, when there was a huge gap between market capitalization and equity, the FASB had been
-
under great pressure to explain to investors why there was so much value that was not in the balance sheet. At that time the Board added a project on disclosure of the value of intangible assets, but that had been taken off its agenda about 2 weeks before the present conference; with the pressure apparently off, FASB board members voted 4 to 3 to remove it. According to Ms. Luisi, two of these four believed that investors do not need to know more about intangible assets than was covered by current disclosure, while the other two were at the opposite end of the spectrum: They wanted to go further by instituting a recognition-criteria trigger that would put brand names and other intangible assets on the balance sheet. She called the vote unfortunate and expressed hope that the issue would return to the FASB’s agenda in the future.
-
Measurement attribute. Is historical value or fair value appropriate? In accounting circles, moving to fair value had long been discussed as tantamount to entering “the Promised Land,” Ms. Luisi reported, the assumption being that financial statements all would be all fair value one day. But a lively debate had arisen as to whether fair value is truly the most relevant measurement attribute for every single asset and liability on the balance sheet. There were suggestions that the mixed-attribute model, which had always been referred to as a bad thing, might not be so bad—that having some fair-value and some historical-cost elements on the balance sheet might be in the best interest of investors. On the FASB agenda was a project intended to increase discipline regarding how fair value is determined in order to give accountants a little more comfort around that concept. Once accountants become more comfortable, she said, it was possible that the issue of recognizing intangible assets at fair value would be revisited. Such a move was not imminent, however.
At the core of this debate was the trade-off of relevance against reliability. Recalling Dr. Lam’s discussion of the trade-off of the completeness of a software product against its features and time to market, Ms. Luisi noted that similar debates regarding trade-offs between relevance and reliability are frequent in accounting. “We can get an extremely relevant set of financial statements with fair values all over them,” she said, “but are they reliable? How are the numbers determined? Is some valuation accountant just sitting in a room figuring out what should go on the balance sheet? How is an auditor going to audit it?” Working through these issues is a slow process, but progress was being made.
Before concluding, Ms. Luisi emphasized that the term “fair value” has a meaning specific to accounting that is related to market-participant value and should not be confused with “fair market value” as the IRS or an appraiser might determine it. Even if the accounting model changes so that software is recorded as an asset on a company’s balance sheet, it will not carry the value that that company places on it but rather a value that can be substantiated based on the assumptions of many market participants. This means that if the software is so
customized that no market participant would purchase it, its balance-sheet value will not be high.
DISCUSSION
Asked by Stephen Merrill of the STEP Board where other countries were on the question of recognizing intangible assets and assigning fair value, Ms. Luisi said that, with regard to fair-value measurements, they were behind the United States, which had more elements at fair value. She noted that a significant debate was in progress, as the International Accounting Standards Board (IASB) was trying to drive European accounting for financial instruments to a fair-value model and the French banks were resisting. She added that international accounting standards were consistent with U.S. accounting standards in not recognizing internally developed intangibles on the balance sheet, which was corroborated by the next speaker, Mr. Greg Beams of Ernst & Young. Most software companies, he added, did not want to have much in the way of capitalized software under their FAS 86-developed products. The window between the moment when such a product hits technological feasibility and the moment when it is out the door and being sold is very narrow, and most of the financial markets are not looking for a big asset that’s been created as the product is developed.
Greg Beams
Ernst & Young
To complement Ms. Luisi’s overview, Mr. Beams said, he would speak from the perspective of a software company on what triggers the sales numbers as reported in its financial statements and, more importantly, what hurdles it has to overcome in order to be able to recognize revenue. Sales of shrink-wrapped software are generally less complex in terms of when to recognize revenue, whether the software comes bundled with hardware or is purchased separately, and whether the software is ordered through mail order or in a store. In the case of installations of larger enterprise resource planning (ERP) systems, on the other hand, the software often undergoes significant customization, and, depending on the specific facts and circumstances, divergence can often result in how companies report their revenues. But before turning to examples of the latter, Mr. Beams proposed to talk about some of the different models that companies were using to recognize revenue and report it in their financial statements; broader hurdles to revenue recognition as they applied to software companies; and revenue-recognition hurdles that were specific to software companies (See Figure 14).
“From a financial-reporting perspective,” he commented, “software-company revenue recognition is one of the more difficult areas to get your arms around as an auditor, and one of the more difficult areas to determine, as a company, exactly
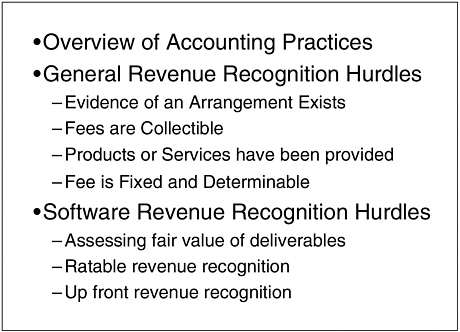
FIGURE 14 Accounting for software revenue and costs.
how some of the contracts should be recorded.” Finally, he would touch on how software users were recording not only their purchases but also internally developed software products, and how these were being reported in the software users’ financial statements. He hoped that the discussion would shed some light on the numbers reported by software companies.
Different Models of Recognizing Revenue
Shrink-wrapped software is generally reported at the time of sale and tends to be purchased without additional deliverables such as installation services and maintenance. Most buyers just take the software home and try to install it themselves.
More complex software, in contrast, usually requires some amount of installation, and customers often purchase what is referred to as “maintenance”: bug fixes, telephone support, and upgrades. Companies want the software to remain current and so will often pay recurring maintenance fees each year. In moving from a situation where their customers are purchasing shrink-wrapped software to a situation where they are purchasing software with multiple deliverables—maintenance and, perhaps, installation services in addition to the software—software companies come up against accounting rules requiring that they allocate
value to each of those deliverables and then recognize revenue in accordance with the requirements for those deliverables.
With software customization, this becomes even more complex: Installing an ERP system, to pick a typical example, can take multiple years, and professional-service fees covering installation and customization generally make up the majority of the overall cost. Testing and customer acceptance may be encompassed in the agreement, and there can be extended payment terms as well.
All of these variables go into the mix, and companies must try to determine how to report revenue for them. Generally speaking, for software installations with significant customization, companies will report revenue on a percentage-of-completion basis under contract accounting, recognizing revenue as the software company performs the customization.
This then results in a wide difference in when revenue is recognized by the software company. As in the examples we just discussed, this varies from a vendor of shrink-wrapped software who recognizes revenue up-front to a significant customization vendor recognizing revenue over time.
All of this revenue is then being reported in the financial statements of the respective software company, and there is additional disclosure surrounding each company’s revenue-recognition practices, but at times it can be difficult for the reader of financial statements to understand the revenue numbers that a particular software company is reporting.
Mr. Beams said he would focus next, in discussing both general hurdles and those specific to the software sector, on vendors who were selling software along with implementation and ongoing maintenance but who were involved in customization only in unique circumstances, because it was in that market segment where the most vendors were to be found. The usual aim of such vendors is to develop a product that replicates itself so that they can sell the same product to multiple customers without needing a great deal of horsepower or a lot of “consulting-type folks” providing implementation services, thus generating significant product revenues on more of a fixed cost base.
General Recognition Hurdles as They Apply to Software
Of general market hurdles that apply to this group of software vendors, the first hurdle they must overcome in order to be able to recognize revenues is securing evidence that an arrangement exists. Seeking such evidence often means having a contract that was signed before the end of the reporting period. If the contract is not signed before the end of the period, the vendor will delay recognizing revenue until the contract is signed, regardless of (a) whether the customer has paid or (b) whether the customer already had the product and was using it; this is not, however, a problem for most software vendors. The second hurdle involves whether the products or services have been provided, which for a
software vendor is more typically determined by whether the product has been shipped. As long as the software product has been shipped to the customer before the end of the period, then software vendors have generally been considered to have met this hurdle.
The next two hurdles are a little more difficult to evaluate. Are the fees collectible? Is the customer creditworthy? For a vendor that’s selling into a new market or to startup companies, collectibility can become an issue. If the vendor cannot assess collectibility at the outset, the company often ends up recognizing revenue on a cash basis—thus, differently than a company selling into more established markets. The last hurdle is even more judgmental: Is the fee fixed and determinable? That is to say, is the software vendor providing extended payment terms or granting concessions to its customers? When a software vendor allows a customer to pay through some type of multiple-payment stream, Mr. Beams explained, the customer often comes back toward the end of that payment stream and says: “ ‘I’m not really getting much in the way of value. The promises that your salesperson made on the front end really aren’t materializing. Therefore, I don’t think I’m going to make this last payment, and you can take me to court if you want to try to get it.’ ” The vendor might offer a 20 percent discount in reaction to entice the customer to pay. This is considered a concession, and, if this behavior becomes a pattern, the software vendor can end up with some serious revenue-recognition issues. The software vendor could be obliged to defer all the revenue that it would otherwise recognize at the time the initial sale is made until the contract is completed and until the software vendor has, in essence, proven that no concessions have been made before the revenue can be recognized. Many times, granting such a concession can be a very smart business decision, especially if the sales people in fact did oversell the functionality of the software, but the accounting guidance can become fairly draconian when it comes to the vendor’s financial statements and how it then is required to report its revenues.
Hurdles to Revenue Recognition Applying Specifically to Software
Turning to hurdles that apply specifically to software vendors, Mr. Beams said he would next talk exclusively about vendors that provide software licenses and maintenance, and that he would leave aside professional services, the inclusion of which would complicate the revenue-recognition picture considerably.
When more than one deliverable is involved in reporting a software transaction, each of the deliverables must be assigned a value, and revenue must be recognized in association with that separate value. The FASB has defined how fair value is developed for a software vendor in a way that is unique to software accounting; and the Board has indicated that, in order to establish the fair value of a deliverable, the vendor must sell that deliverable on a stand-alone basis. But because these types of software products are most frequently bundled with maintenance, most software vendors in this group have difficulty in ascribing value to
individual elements. Also, if the vendor does sell the individual elements separately, it must do so in a consistent range of prices.
In the software industry, however, it is not at all uncommon for vendors to realize 50 percent or more of their sales in the last month of a quarter—in fact, it is not unusual for them to recognize one-third of their sales in the last 2 weeks of a quarter. Customers know that, in order for a software company to record revenue, it must have a signed deal in place before the end of the quarter, so customers will use that timing as leverage to try to strong-arm the software vendor into giving concessions in order to get the best price they can. In these circumstances, developing pricing that is within a consistent range can be more challenging than one might otherwise think.
Warning that he was generalizing, Mr. Beams nonetheless asserted that while “each and every contract that a software vendor would execute has to be looked at individually, generally speaking software vendors in that situation often end up with ratable revenue recognition.”
The majority of software companies typically try to get up-front revenue recognition because it gives them a higher growth rate earlier on in their existence, something they believe usually translates into a higher market capitalization. And if a company is considering going public or doing a liquidity transaction, that higher value can translate into more dollars in the company coffers; so it is a lure that, to date, has been difficult for most companies to overcome. While most are chasing up-front revenue recognition, some software companies want ratable revenue recognition and have structured their agreements to get it; moreover, it is not that hard to trip the software accounting rules such that it would be mandatory to record revenue ratably. As a result, of two software companies that are identical in structure and selling very similar products, one may be accounting for its revenue up front, the other ratably. Thus, it is important to understand, in evaluating revenue that is reported in software company financial statements, whether that company is recognizing revenue on an up-front basis or on a ratable basis. And the latter, by so doing, takes away the leverage that its customers might otherwise have at the end of the quarter.
How Purchasers Account for Software Transactions
How software transactions are accounted for by buyers is another source of information on market activity in the industry. Most companies make two types of software purchases, Mr. Beams stated: “They are either buying software and having somebody come in and install it for them, in which case they’re cutting checks and recording that as an asset in their balance sheet; or they are developing software internally for internal use and so are capitalizing those costs.” He warned that these costs are being put on the balance sheet before going through the profit and loss statements (P&L)—and that they do not go through the P&L until the projects are up and running and actually being utilized, at which point
the company would start to record depreciation over some estimated useful life. For this reason, the depreciation associated with the costs of some major projects—projects, he said, that companies were starting to do again, as the economy had become somewhat more robust than it had been for software vendors—probably would not show up for some time. Such projects remained in the capitalization phase as opposed to being in the depreciation stage.
In conclusion, Mr. Beams stated his belief as an auditor that information published in software vendors’ financial statements is useful, although mainly to the shareholder. He acknowledged that detail is often lacking, and that distinguishing one software company’s reporting from another, and aggregating such information so that it tells a meaningful story, can be extremely challenging.
Dr. Flamm introduced David Wasshausen of the Bureau of Economic Analysis (BEA), who was to speak on how the government makes sense of those aggregated numbers.
A BEA PERSPECTIVE: PRIVATE FIXED SOFTWARE INVESTMENT
David Wasshausen
Bureau of Economic Analysis
Mr. Wasshausen laid out four points he would address in his discussion of how private fixed investment in software is measured in the U.S. National Income and Product Accounts:
-
when software first began to be recognized as capital investment;
-
how estimates of software are measured nominally;
-
how estimates of software prices are measured and what alternatives have been explored recently in an attempt to improve some of the price indexes used; and
-
software trends that have been observed and some of the challenges that those trends present the BEA as it measures private fixed investment in software.
BEA introduced capitalization of software in its 1999 comprehensive revision of the National Income and Product Accounts. Prior to that software had been treated as an intermediate expense, but there are several reasons it should be treated as a capital investment:
-
Software exhibits significant growth with key features of investment.
-
Software provides a multi-year flow of services.
-
Software is depreciated over multiple years.
-
BEA was able to eliminate two inconsistencies when it began to recognize software as an investment: (1) before then, only software that was bundled with hardware was being capitalized; and (2) although software has features that
-
are consistent with other types of investment goods, it was not being treated as such.
Although BEA did not have complete source data to estimate fixed investment in software, something that has not changed in the meantime, it judged that the pros of capitalizing software in the National Income and Product Accounts outweighed the cons, and so it proceeded to do so. It recognized the same three types of software listed by previous speakers: prepackaged, custom, and own-account. Endorsing Dr. Raduchel’s earlier statement that software is the single largest asset type in the United States, Mr. Wasshausen placed business’ 2003 purchases of capitalized prepackaged software at around $50 billion, those of custom software at almost $60 billion, and those of own-account software at about $75 billion.
This change had less impact on real GDP growth than some had expected, which according to Mr. Wasshausen could probably be attributed to the fact that the price index for software, when it was first introduced as a capitalized good, showed a very gradual increase of about 1 percent. “If our users were expecting it to look more like computer hardware, which has an average annual rate of decline of about 17 percent, then certainly they would be surprised by the lack of impact on real GDP growth rates,” he commented. On the other hand, there were those who were somewhat surprised by the sheer magnitude of the numbers; in particular, officials at the Organisation for Economic Co-operation and Development (OECD) were surprised by the large proportion at which BEA was capitalizing and felt that its estimates for intermediate consumption of software were a little low, a subject to which he would return.
Mr. Wasshausen showed a graph juxtaposing the software price indexes of 10 different countries to illustrate that there is no consensus worldwide on how to measure software prices (See Figure 15). He pointed out that software prices in Sweden, Greece, and Finland have been increasing over time, while Australia and Denmark have displayed significant rates of price decline in the same period and the U.S. has been in the middle.
BEA’s Methods for Estimating Nominal Fixed Investments in Software
BEA uses a supply-side approach, the “commodity-flow” technique, to measure prepackaged and custom software, starting with total receipts, adding imports, and subtracting exports, which leaves total available domestic supply. From that it subtracts intermediate, household, and government purchases to come up with business investment in software. Demand-based estimates for software available from the U.S. Census Bureau’s annual Capital Expenditure Survey for 1998 were quite a bit lower than BEA’s estimates; the Census Bureau was working to expand its survey to include own-account software and other information that had not previously been captured. Mr. Wasshausen said it was his understanding that the Census Bureau intended to start publishing this information
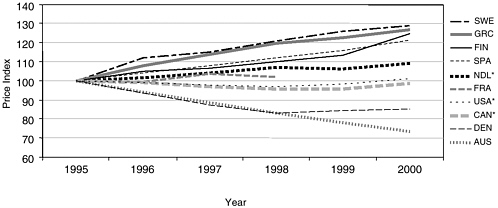
FIGURE 15 Worldwide software prices. Investment in software: price indices from 1995 onwards, 1995 = 100.
SOURCE: Organisation for Economic Co-operation and Development, Report of the OECD Task Force on Software Measurement in the National Accounts.
annually as opposed to every five years, the current publication frequency for investment by type. “Having that detailed annual capital expenditure survey data available,” he said, “will, if nothing else, provide us with a very valuable check for the supply-side approach.”
In contrast to prepackaged and custom software, own-account software is measured as the sum of production costs, including not only compensation for programmers and systems analysts but also such intermediate inputs as overhead, electricity, rent, and office space. BEA’s estimates for own-account software are derived primarily from two pieces of source data: (1) employment and mean wages from the Bureau of Labor Statistics’ Occupational Employment and Wage Survey, and (2) a ratio of operating expenses to annual payroll from the Census Bureau’s Business Expenditures Survey. The computing of private fixed investment in own-account software starts with programmers and systems analysts employment, which is multiplied by a mean wage rate. Several factors are then applied:
-
one reduces that number to account for programmers and systems analysts who are producing custom software, in order to avoid double counting;
-
another reduction factor accounts for the fact that these programmers and systems analysts do not spend all their work time solely on creating investment software. Much of their time might be spent on things that would not necessarily be characterized as investment, like maintenance and repair;34 and
-
a ratio that converts from a wage concept to total operating expenses.
If a slide displayed by Dr. Raduchel that put the programmers’ cost at only 10 percent or so of the total cost of producing software proved accurate, said Mr. Wasshausen, then BEA was underestimating own-account software.
For the time being, he lamented, BEA had little more to base its quarterly estimates for prepackaged and custom software on than trended earnings data from reports to the SEC by companies that sell such products. “The idea,” he explained, “is that as company earnings are increasing, that also means that they must be selling more software.” BEA was, however, able to supplement this with data purchased from a local trade source. that tracks monthly retail and corporate sales of prepackaged software. And it expected to have access soon—perhaps from the first quarter of 2004—to better information for the purpose of making the estimates, as the Census Bureau was in the process of conducting a quarterly survey that was to capture receipts for both prepackaged and custom software companies.35 Meanwhile, BEA’s quarterly estimates for own-account software reflected judgmental estimates tied to recent private fixed investment in a variety of areas, including computer hardware, prepackaged and custom software, and some related products.
Recent BEA Software Accounting Improvements
Beginning a rundown of recent BEA improvements, many of them first incorporated in the 1997 input-output accounts that the BEA released in 2003, Mr. Wasshausen pointed to an expansion of the definitions of prepackaged- and custom-software imports and exports used in the aforementioned commodity-flow technique so that the definitions included royalties and license fees, as well as affiliated and unaffiliated software services that are part of BEA’s international transactions accounts. Previously, as the BEA was picking up only merchandise in the foreign trade accounts, these were not included. Also improved had been
|
|
for Software as Investment: Methodology and Quantitative Impacts, 1959-98,” paper presented to BEA’s Advisory Committee, May 5, 2000, accessed at <http://www.bea.doc.gov/bea/papers/software.pdf>. For example, Parker and Grimm note that an important change to the National Income and Products Accounts in the recently released comprehensive benchmark revision is the recognition of business and government expenditures for computer software as investment. Previously, only software embedded in equipment by the producer of that equipment was counted as investment. |
estimates of how much of the total prepackaged and custom software purchased was for intermediate consumption. This was another area for which the Census Bureau did not collect a great deal of illuminating data, but BEA had augmented the Census Bureau data by looking at companies’ reports to the SEC and trying to figure out how much of their revenue came from OEM software sales.
Additionally, BEA was hoping that the Census Bureau would begin, as part of its improved Annual Capital Expenditure Survey coverage, to ask companies how much of their software expenditure was for intermediate and how much was actually a capital expense, and to tabulate the responses. This would allow BEA to harness that information in order to improve its intermediate consumption expenditures for software as well.
In other recent improvements, BEA also had adopted a more direct calculation of total costs for producing own-account software and had replaced median wages with mean wages for its own-account estimates. Finally, it had begun to recognize the production of software originals used for reproduction as capital investment. When a company creates a software original that it intends to reproduce or distribute, it has created an asset. Furthermore, when businesses buy copies of that asset, that is also capital investment. So it is important to capitalize the original production, because what is produced is indeed an asset for the company.
Software Price Indexes
Taking up the issue of price indexes, Mr. Wasshausen noted that the index used for prepackaged software reflected the BLS Producer Price Index and that BEA applied to it a downward bias adjustment of about 3 percent per year. Over-all, BEA was “pretty happy” with this index, he said. For own-account software, the Bureau had been using only an input-cost price index that included compensation and intermediate inputs. Because no allowance was made for any changes in productivity, the price index would go up as compensation rates went up for programmers and systems analysts—an obvious weakness in the index. To allow for productivity changes, BEA had begun weighting the input-cost price index, which it assigned a value of 75 percent, together with the prepackaged software price index, which it assigned a value of 25 percent. This had been the same methodology used to compute the custom software price index.
BEA had explored two alternatives for improving its custom and own-account software prices but had yet to implement either. One used “function points,” a metric designed to quantify functionality of a given software application to derive a quality-adjusted price index. The idea for the other was to construct a labor-productivity adjustment and to apply that adjustment to the input-cost index.
Function points. At first, BEA had wanted to estimate a price index directly from this function-point data set, whether using hedonics or the average cost per function point. The problem with the function-point data sets that BEA identified
was that, while they captured many variables, there was one variable that they did not collect and capture: the true price or the cost of the project. And because it was almost impossible to construct a price index directly from the function-point data set without that information, BEA gave up its efforts to do this. Saying, however, that to his knowledge function points were “the only game in town” when it came to developing a uniform metric for customized software applications, Mr. Wasshausen expressed the wish to be put in touch with someone from the Software Engineering Institute or any other organization with specialized knowledge of software metrics, in the hope he might receive suggestions. “We’re certainly open to other areas of improvement,” he remarked.
Labor-productivity adjustment. There were two options for creating a labor-productivity adjustment: (1) Using a newly available BLS labor-productivity measure for prepackaged software, and (2) trying to construct a labor-productivity measure directly from the function-point data set. Broadly speaking, BEA would take a relative of the input-cost index and a relative for labor productivity, then dividing the input-cost index relative by the labor-productivity relative to derive a productivity-adjusted input-cost index.
In the case of the first option, the argument was that there was a correlation, or that there were relationships, between own-account software and prepackaged software in terms of productivity changes over time. That both share things like Internet and e-mail, improved hardware, and improved programming tools bolster arguments in favor of using a prepackaged-software labor-productivity adjustment for own-account. But because there are differences as well—for instance, prepackaged software enjoys economies of scale while own-account software does not—BEA agreed to make a layer of downward adjustments to any productivity changes that it got out of prepackaged software, which would create a proxy own-account labor-productivity measure.
In favor of the second option, using function points as the labor-productivity measure, was that these data sets are designed for the task. When companies hire someone to evaluate function points, they are really trying to get a feel for whether a specific software project is on track—or, roughly speaking, how much it should cost. Unfortunately, the results for productivity that BEA obtained using function points showed great volatility compared to the proxy measure constructed using the BLS productivity measure (See Figure 16). The data set it purchased comprised over 2,000 observations spanning 13 or 14 years and captured everything from platform type, the way the function points were actually counted, to development type, whether new development or enhancement was involved. There were many different ways to slice the data, but no matter which way was tried, the results for productivity always came back extremely volatile. Pointing out the sharp drop in productivity in 2001 as measured with the function-point data set, Mr. Wasshausen noted that, from his perspective, the “good news” was that he could argue that the trend was similar between the two sets of data up through 1999 and perhaps 2000.
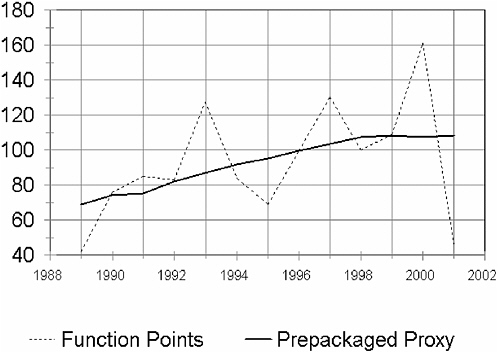
FIGURE 16 Productivity estimates comparison: Own-account SW productivity, 1996 = 100.
Favorable to constructing a labor-productivity adjustment, BEA concluded, were that the issue of including productivity changes needed to be addressed and that the price index that resulted from the adjustment looked more like the price indexes for similar goods. But counterbalancing these “pros” were two powerful “cons”: that the adjustments were too arbitrary and that, at the time, making a productivity adjustment was somewhat unorthodox. Believing that the cons simply outweighed the pros, the BEA decided not to move forward.
Software Trends to Present Accounting Challenges
Mr. Wasshausen proceeded to identify and comment upon a number of software trends that BEA had observed:
-
Demand computing. Suited to businesses with limited software requirements—an example being small companies that use payroll software only once a month—this would allow access on an as-needed basis to an application residing on an external server.
-
Application service providers (ASPs). Similar to demand computing and seemingly catching on, this practice creates a “very fine line” that poses a chal-
-
lenging question to BEA: Is software simply being rented, or is an investment involved?
-
Open-source code. If no dollars are changing hands, it will be very difficult to measure the economic activity that is taking place. While pricing according to the “next-best alternative” may be practicable, Mr. Wasshausen expressed doubt that that would provide any “feel” for overall volume in the economy.
-
Outsourcing overseas. Looking forward to a session on the subject later in the afternoon, he noted that BEA’s International Transactions Accounts measure both affiliated and unaffiliated transactions for such services, which are reflected in its commodity-flow procedure.
In summation, Mr. Wasshausen remarked that, despite its 1999 comprehensive revision, accurate software measurement continued to pose challenges to BEA simply because software is such a rapidly changing field. Characterizing attempts made so far to deal with the issue as “piecemeal”—“we’re trying to get the best price index for software, the best price index for hardware, the best price index for LAN equipment or routers, switches, and hubs”—he put forward the notion of a single measure that would capture the hardware, software, and communication equipment making up a system. “If I have a brand new PC with the latest processor and software that works great, but my LAN isn’t communicating well with my operating system, I’m going to be processing slow as molasses,” he stated. “That’s something that, ideally, we’d take into account with an overall type of measure.”
Closing, Mr. Wasshausen called the communication taking place at the day’s symposium is very important for BEA, as one of its “biggest emphases” is to improve its custom and own-account software prices.
Dr. Flamm then introduced Dirk Pilat, a Senior Economist with responsibilities for work on Productivity, Growth, and Firm-level Analysis at the Directorate for Science, Technology, and Industry of the OECD. Dr. Pilat, said Dr. Flamm, would discuss how the OECD looks at issues like those with which BEA has been grappling in the United States.
WHAT IS IN THE OECD ACCOUNTS AND HOW GOOD IS IT?
Dirk Pilat
Organisation for Economic Co-operation and Development
Dr. Pilat introduced the OECD as an international organization of about 30 member countries whose mission is to promote economic development, in part through improving the measurement of economic activity. He said he would be offering an overview of the official measures of software currently in use for OECD countries, to include measures of software investment; the size of the software industry at a very aggregate level; and software price change. In addi-
tion, he would point to various factors that affect the comparability of such measures across countries and would discuss both attempts to improve these measures and the impact improved measures might have on the analysis of economic growth and productivity.
Many of the problems that are inherent in making comparisons across countries had already come up during the symposium:
-
Software is intangible, and, as such, can be somewhat harder to measure than other products.
-
Markets for software are different from those for other goods, which means that, particularly as ownership and licensing arrangements are so common, software is a bit more complicated to deal with.
-
Duplication of software is easy and often low cost, raising the question of whether a copy is an asset. In the current view, the answer was, basically, “yes.”
-
The service life of software can be hard to measure, at least in the way that it is traditionally employed by national accountants.
-
Software’s physical characteristics are not always clear.
These special problems do not invalidate the system of national accounts that is used to measure investment, but figuring out how to apply the system’s rules to software does require special effort.
Dr. Pilat displayed a chart based on official OECD data for 18 countries’ software investment in 1985, represented by crude estimates; in 1995; and in 2001, the last year for which figures were available (See Figure 17). While observing that, over the period depicted, investment had gone up for all countries, he remarked that there were very large differences among the countries. In Denmark, the United States, and Sweden about 15 percent of total 2001 nonresidential investment had gone to software, but for the UK, a country that might be expected to devote a similar amount of investment to software, official estimates put the total at only about 1.5 percent. “There may be a problem there,” he said.
The picture of the computer services industry, which is basically the main producer of software, is somewhat different (See Figure 18). The UK is among the countries with a large industry that produces software services, and Ireland, which was just above the UK at the bottom of the software-investment chart, actually seems to have a large computer services industry. This result again suggests complications that might merit looking at in more detail.
Use of Deflators Also Varies Country to Country
Moving on to the issue of deflators, Dr. Pilat pointed to “very different treatment across countries in how software is looked at,” offering as evidence the fact that official statistics for Australia and Denmark showed a very rapid price decline
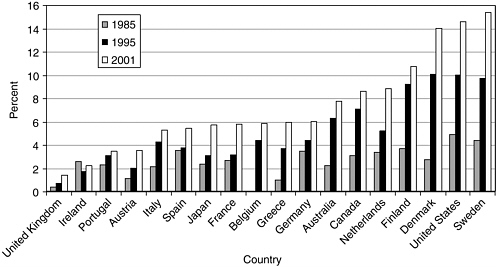
FIGURE 17 The data: software investment, as a percentage of non-residential gross fixed capital formation.
SOURCE: Organisation for Economic Co-operation and Development, Database on Capital Services.
FIGURE 18 Computer service industry as a percentage of total business services value added, 2000.
SOURCE: Organisation for Economic Co-operation and Development, Technology and Industry Scoreboard, 2003.
over time, while those for Greece and Sweden showed prices increasing strongly (See Figure 19).
Factors Accounting for the Difference
As one problem contributing to the variation in measures of software investment, Dr. Pilat named that businesses and business surveys—that, he said, generally use “very prudent criteria” when counting software as investment—do not treat software as national accountants might like it to be treated. The consequence is a big difference between business survey data on software investment, which currently exists for only a few countries, and official measures of software investment as they show up in national accounts. Own-account software would not normally be picked up as investment in the business surveys, he remarked.
If business surveys do not reveal much, national accountants must attempt to measure supply using the commodity-flow method described earlier by Mr. Wasshausen. But after ascertaining the total supply of computer services, national accountants make very different decisions on how much of that to treat as investment. Investment ratios therefore differ greatly from country to country, making it quite unlikely that data are comparable For example, about 65 or 70 percent of the total supply of software was being treated as investment by Spain
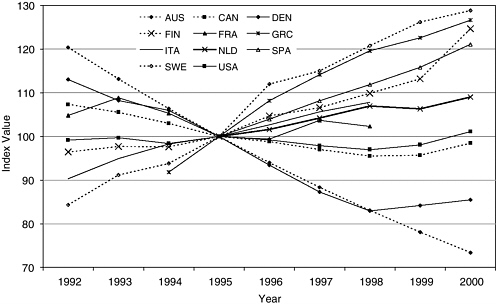
FIGURE 19 Deflators for investment in software, 1995=100.
SOURCE: Ahmad, 2003.
and Greece, whereas the corresponding number for the UK was only about 4 percent (See Figure 20).
What accounts for this difference? It arises in part because the computer services industry represents a fairly heterogeneous range of activities, including not only software production but also such things as consulting services, and national accountants would not want to treat all of them as investment. The main problem is that criteria determining what to capitalize differ across countries. There are also small differences in the definitions of computer services that may exist across countries, although not within the European Union. And there are also problems with accounting for imports, because the trade data don’t provide much information on software, as well as with several technical adjustments, which can also differ across countries.
Harmonizing the World Investment Picture Using a Standard Ratio
To some extent, it is possible to tell what would happen if all countries used exactly the same investment ratio. On the basis of an investment ratio for all countries of 0.4 percent—that is, one treating 40 percent of all supply as investment—a very large increase would show up in software investment and GDP levels for the United Kingdom (See Figure 21). Meanwhile, there would be sub-
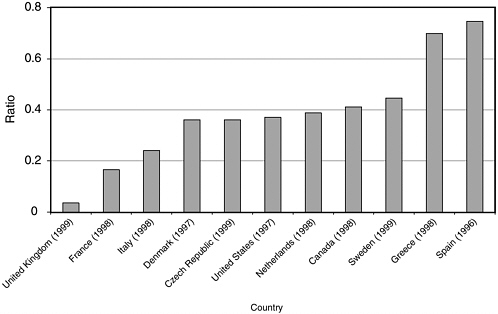
FIGURE 20 Investment ratios for software differ (Share of total supply of computer services capitalized).
SOURCE: Ahmad, 2003.
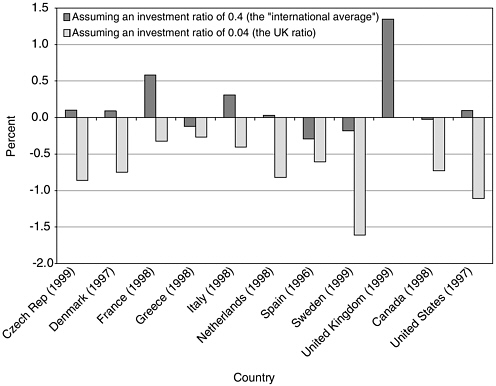
FIGURE 21 Impact on GDP if investment ratios were the same.
SOURCE: Ahmad, 2003.
stantial changes for France and Italy as well, and some decline in a few other countries.
Returning to the problem of own-account software, Dr. Pilat traced the differential treatment it receives across countries:
-
Japan excludes own-account from its national accounts altogether.
-
Some countries that do include it ignore intermediate costs, looking only at wages and salaries of those who produce it—and then use widely divergent methods of estimating those wages and salaries, especially in regard to the time computer programmers spend on own-account vs. custom production.
-
Among countries that take intermediate costs into account, adjustments used for them vary.
-
Own-account production of original software designed for reproduction is not capitalized everywhere.
Harmonized estimates reflecting identical treatment of own-account across countries, similar to those for investment ratio already discussed, would show a
significant change in levels of software investment (See Figure 22). The portion of Japanese GDP accounted for by own-account software would rise from zero to 0.6 percent, and most other countries would post fairly big increases, with the exception of Denmark, which would register a decrease. Dr. Pilat cautioned that these estimates, which he characterized as “very rough,” were not the product of a careful process such as BEA had undertaken for the U.S. economy but had been put together at the OECD solely for the purpose of illustrating what the problems are.
OECD Task Force’s Software Accounting Recommendations
In an effort to improve current-price estimates, an OECD-Eurostat Task Force was established in 2001, and it published a report in 2002 that included a range of recommendations on how to use the commodity-flow method, how to use the supply-based method, and how to treat own-account software in different countries. Most of these recommendations had been accepted by OECD countries and were being implemented. Work was also under way to improve business surveys in the hope of deriving more evidence from them over time. If all Task Force recommendations were implemented, Dr. Pilat predicted, the UK would be most significantly affected, but other countries’ software-investment data would show rises as well (See Figure 23).
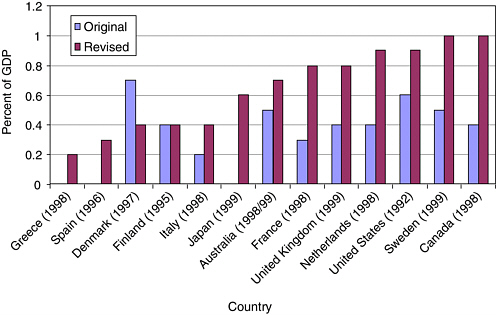
FIGURE 22 Impact of “harmonized” treatment own-account (percent of GDP).
SOURCE: Ahmad, 2003.
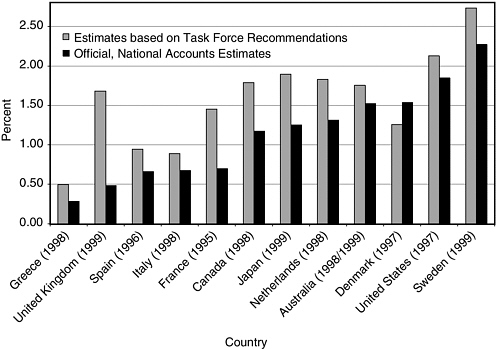
FIGURE 23 Estimated investment in software as a percentage of GDP if Task Force recommendations were implemented.
SOURCE: Ahmad, 2003.
The use of deflators varied widely from country to country as well. While some countries used the U.S. deflator for prepackaged software and adjusted it somewhat, many others used such proxies as a general producer-price index, a price index for office machinery, or input methods. For own-account and customized software, earnings indexes were often being used. The reigning recommendation in these areas, on which the Task Force did not focus to any great extent, was to use the U.S. price index for prepackaged software or to adjust it a little while using earnings indexes for own-account and custom software.
Harmonized Measures’ Potential Effect on GDP Levels
As current OECD estimates for information and communication technologies (ICT) investment remained very much based on official measures, adoption of harmonized measures would have the most significant impact on the level of GDP in the UK, France, and Japan (See Figure 24). “While there might be a small change in the growth rate of GDP,” Dr. Pilat said, “some [factors] might actually wash out, so it is not entirely clear what that would do to different countries.” Software’s role in total capital input would definitely increase, which would mean
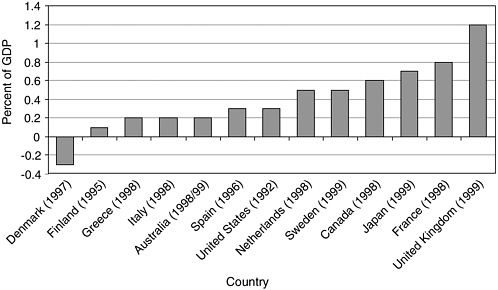
FIGURE 24 Impact of “harmonized” measures on the level of GDP, percentage of GDP.
SOURCE: Ahmad, 2003.
that estimates of multifactor productivity would be changing quite a bit as well. There would probably also be reallocation of other types of capital to software. “Sometimes a country will say, ‘we’re pretty happy with our total investment expenditure, but we don’t quite know where to put it: It may be software, but sometimes we treat it as other types of hardware,’” he explained.
Dr. Pilat then displayed a graph demonstrating that the UK would experience a slight up-tick in cumulative growth rates for the second half of the 1990s if software measurement were changed (See Figure 25). According to another graph, this one showing the contribution of software investment to GDP growth according to growth-accounting analyses for the two halves of the 1990s (See Figure 26), revised estimates would produce a marked increase in that contribution for countries such as Japan and the UK that had a very small contribution to total GDP growth coming from software investment. Contributions of software to total capital in countries like Ireland, the UK, Japan, and Portugal are very small compared to those of other types of IT, which suggests that something isn’t entirely right and that a different contribution in the total growth accounting would result from revised estimates (See Figure 27).
Concluding, Dr. Pilat observed that measures of software investment varied quite a lot among countries, but that OECD countries had more or less reached agreement on the treatment of software in their national accounts. Steps were on the way in most countries to move closer to one another in statistical practices,
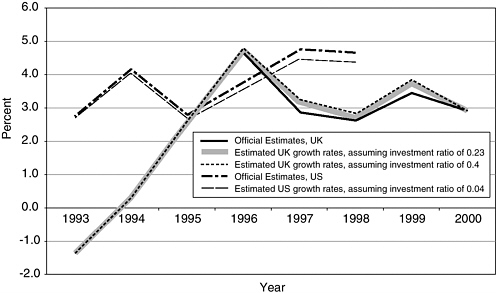
FIGURE 25 Sensitivity of GDP growth to different investment ratios for purchased software.
SOURCE: Ahmad, 2003.
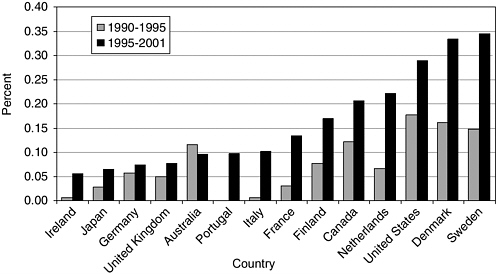
FIGURE 26 Contribution of software investment to GDP growth, 1990-1995 and 1995-2001 (in percentage points).
SOURCE: Organisation for Economic Co-operation and Development, Database on Capital Services, 2004.
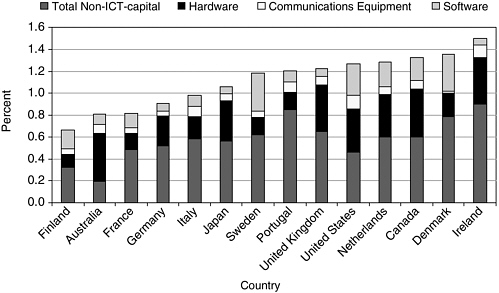
FIGURE 27 Contribution of software investment and other capital to GDP growth, 1995-2001 (in percentage points).
SOURCE: Organisation for Economic Co-operation and Development, Database on Capital Services, 2004.
and there would be some effort by the OECD to monitor the implementation of the Task Force recommendations via a survey due in 2004. But there were some data issues still outstanding, price indexes being one of them. And software trade remained a significant problem, as did detail on software supplies in many important industries, which was not available in many countries. He commended to the audience’s attention a working paper entitled “Measuring Investment in Software” by his colleague Nadim Ahmad, which served as the basis for his presentation and was to be found online at <http://www.oecd.org/sti/working-papers>.
DISCUSSION
Dr. Jorgenson asked whether it was correct to conclude from Dr. Pilat’s presentation that most of the OECD’s effort in standardization had been focused on the nominal value of investment, and that the radical differences in prices revealed in one of Dr. Pilat’s graphs had yet to be addressed.
Acknowledging that this was indeed correct, Dr. Pilat said that the only place where the OECD had tried to do some harmonization was for the hedonic price indexes for investment in IT hardware. None had yet been done in any software estimates, although he suggested that the OECD could try it to see what it did. He
was also considering using both his rough and his revised estimates of software investment to see what effect it might have on the OECD’s growth accounting estimates.
Dr. Flamm commented that a lot of interesting work was in progress in all the spheres that had been discussed, and that much work was apparently still to be done at the OECD. He regarded as “good news,” however, that improved measures of software prices seemed to be coming down the road, with BEA, university, and other researchers working on the subject.


