
3
Arctic Observations: Existing Activities and Gaps
This chapter reviews ongoing and planned arctic and related global observing activities and highlights critical gaps that exist in these activities. The chapter is comprised of an overview of these activities and gaps and an extensive supporting annex. The annex has three parts. The first is a large but not exhaustive list of ongoing and planned networks, observatories, satellites, data centers, coordinating bodies, and programs that could be the foundation of the Arctic Observing Network (AON). The second annex provides additional details of some of the major global and regional observing networks that include the Arctic. The third annex examines current measurement approaches and gaps among temperature measurements in particular and cryospheric measurements in general.
EXISTING ACTIVITIES
The AON will connect local observations with those from regional and global networks to provide the coverage needed to monitor and document current state and change throughout the Arctic. This network will be founded on and support existing observing stations, networks, and programs (Annex 3A, B) that cover a broad spectrum of domains, including the atmosphere, hydrosphere, cryosphere, biosphere, and human dimension. The AON is being conceived at a time when significant new observation systems, platforms, networks, and integrating functions are being planned (e.g., Annex 3A, B) in connection with the International Polar Year (IPY). A rare opportunity exists to advance arctic observations on a unified track.
A challenge for AON participants will be to define the appropriate level of connection among its component activities. For example, the large networks described in Annex 3B have a wide range of foci, variables being measured, data management approaches, and funding mechanisms. Possible solutions to this challenge are presented in subsequent chapters, but it is worth highlighting examples of existing and planned arctic or global networks that already have an interdisciplinary outlook, are well coordinated, and therefore share goals with the AON.
An international-scale example is AMAP (Arctic Monitoring and Assessment Programme, Annex 3B), which was established in 1991 to implement components of the Arctic Environmental Protection Strategy. AMAP measures the concentrations and assesses the effects of contaminants, climate, and ultraviolet radiation in the arctic environment. It has produced a series of assessments of pollution trends in the Arctic.1
A national-scale example that is just starting is ArcticNet (Annex 3B)—a network of Canadian centers of excellence that brings together numerous individuals to study the impacts of climate change in the coastal Canadian Arctic. The central objective of ArcticNet is to contribute to the development and dissemination of knowledge needed to formulate adaptation strategies and national policies related to climate change and globalization in the Arctic.2
An example of a planned international network that closely relates to AON goals is the Global Earth Observation System of Systems (GEOSS) (see Box 1.4 and Annex 3B), which seeks to obtain high-quality information on the state of the entire Earth system for policy and decision making. The Integrated Earth Observation System (IEOS) is the U.S. contribution to GEOSS, and is intended to be an interagency effort that builds on current observing systems. The AON would also be integral to the Study of Environmental Arctic Change (SEARCH) (Annex 3B)—a U.S.-driven activity—and its fledgling international umbrella, ISAC (International Study of Arctic Change). SEARCH, currently in the planning and early implementation phase, is conceived as a broad, interdisciplinary activity geared toward understanding the future of the Arctic.
|
1 |
See http://www.amap.no. |
|
2 |
CRITICAL GAPS
Long-term records over large geographical areas are required to understand the arctic system and project possible changes and their consequences. Understanding the rate and scale of arctic change is also inherently a multidisciplinary problem, and records of many interconnected variables are needed (Schlosser et al., 2003). Unfortunately, long-term records for key arctic variables are incomplete and there are measurement gaps in all domains. In some cases, there are huge voids. These include the Arctic Ocean as a whole (Figure 3.1). Because there is uneven coverage across the Arctic in many variables (e.g., Figure 3.2), it is critical to engage all arctic nations in addressing gaps from the outset.
Many voids exist because measurement programs are simply inadequate for the task. Other gaps are created by technological limitations, which are pervasive in the Arctic due to the unique challenges created by extreme cold and remoteness. Some areas have actually lost capabilities as important networks and observatories have been decommissioned due to lack of resources (Shiklomanov et al., 2002; Annex 3C). Declines in ground-based observations also erode the capability to validate satellite imagery, thus undermining the usefulness of that source. Work is being done to fill some gaps, but resources are insufficient to address all critical needs.
Various planning and research groups have identified data gaps (e.g., AMAP, 1998; SEARCH, 2001; AHDR, 2004; ACIA, 2005; GEOSS, 2005). There is considerable overlap between the Committee’s list of key variables and gaps (Table 2.1) and the list of global observational requirements from the GEOSS planning process (GEOSS, 2005), for example. Space prohibits a complete discussion of all the
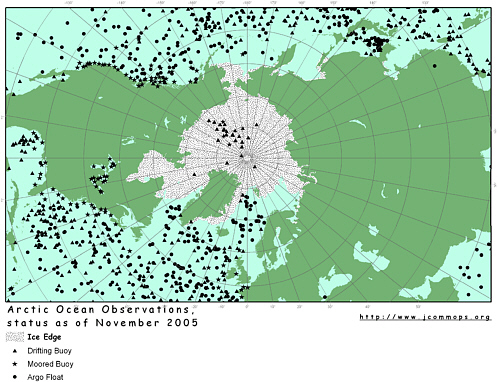
FIGURE 3.1 Distribution of Argo floats (measuring temperature and salinity), drifting buoys (measuring sea-surface velocity and temperature, air pressure [in some cases], and subsurface temperature profiles [in a small number of cases]), and moored buoys (measuring sea-surface temperature, air pressure and temperature, wind, and mean significant wave heights) in the world’s northern oceans on September 13, 2005. SOURCE: Argo Information Centre, http://argo.jcommops.org.
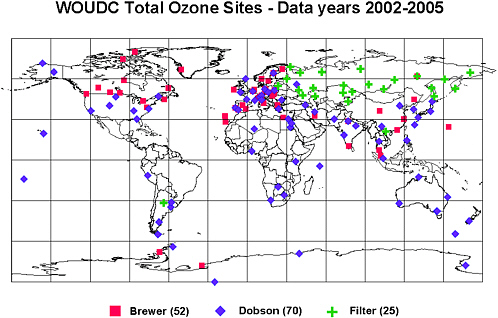
FIGURE 3.2 Global distribution of stations in a network that measures ozone concentration in the atmosphere (data years 2002-2005). The different types of data points represent different types of instruments. Squares, diamonds, and crosses represent Brewer, Dobson, and filter instruments, respectively. Gaps are apparent especially over northern Canada, Siberia, and northern Greenland—areas where indigenous communities live and could be affected by changes in ultraviolet radiation tied to fluctuations in ozone concentration. There are also gaps in the subpolar North Atlantic. SOURCE: This image was produced by the WOUDC (World Ozone and Ultraviolet Radiation Data Centre), which is operated by Environment Canada under the auspices of the World Meteorological Organization.
gaps. Instead, the Committee presents examples of what it considers critical gaps. These gaps are in spatial and temporal coverage, thematic and disciplinary coverage, and data access and management. The entries in Annex 3B include supporting details on gaps in existing and planned large global and regional networks. In addition, Chapter 5 includes an expanded discussion of spatial gaps and Table 2.1 lists examples of critical spatial, temporal, and thematic gaps in key variables.
System-wide Gaps
In the Arctic as a whole, the needs are acute for monitoring of surface radiation balances, precipitation, ocean salinity and temperature, sea ice distribution and thickness, and land cover characteristics to advance the understanding of global climate and produce more accurate weather prediction and reanalysis models. There is little ongoing collection of radiative data for the entire arctic region and no precipitation data are collected regularly over the Arctic Ocean. Compared to other regions of the Earth, and especially given its vast area, the Arctic in general has very few precipitation gauging stations. Furthermore, there is a lack of salinity and temperature data for the Arctic Ocean, especially in the areas covered by sea ice (e.g., Figure 3.1). Sea ice thickness data are lacking, as is high-quality information on ice in coastal regions (e.g., Holloway and Sou, 2002). Finally, high-resolution land cover data are lacking in most of the Arctic, as are time series of albedo, especially in vegetated areas and on ice (Box 3.1).
Temporal Gaps
Making measurements in the Arctic is inherently challenging, particularly during the winter. There are only a few sites where measurements are made year-round, and the number has been declining. This lack of continuous measurements makes it difficult to fully understand the system, identify trends, or study the intensity and frequency of extreme events. For some variables, arctic residents might be able to provide year-round measurements. And satellite-
|
Box 3.1 Surface albedo datasets must capture the progression of melt-freeze at sufficient resolution for surface energy budget evaluations and model validation (NRC, 2001). Although optical measurements are continually made in polar regions, the only surface albedo product that covers land, sea ice, and ice sheets available on a daily basis is the Advanced Very High Resolution Radiometer Polar Pathfinder Product which contains twice-daily, gridded observations. These data run from 1981 to 2000, and thus there is a gap after 2000 even though the instruments are still flying. A prototype snow albedo algorithm for MODIS (Moderate Resolution Imaging Spectroradiometer) was developed and could have been used to fill the temporal gap after 2000, but the algorithm was not incorporated into the routine processing of Terra and Aqua snow data products until September 2003. Because of the lack of calibration and verification, the MODIS daily snow albedo product is considered a beta-test product and therefore may still contain significant errors. Additionally, the dataset does not provide surface albedo over sea ice—only snow-covered land surfaces. There is a 16-day MODIS albedo product that can fill the data gap between 2000 and 2003, but its coarse spatial resolution misses important daily or weekly events and it too does not provide albedo over sea ice. |
derived information can supplement ground-based measurements for a number of key variables unless the long polar night affects the satellite measurements.
A comprehensive AON must satisfy the needs for long-term measurements of many variables over differing time scales. For example, temperature needs to be measured frequently, whereas the movement of the tree line does not. Extreme events may be short-lived, rare, localized, and observed only if there happen to be measurements at that time and place, whereas documenting the arctic-wide interactions of longer term climatic variability such as the Arctic Oscillation and the North Atlantic Oscillation3 is also part of the AON. The current array of arctic observing activities does not satisfy these demands.
Thematic Gaps
Observations within the AON should characterize chemical, biological, physical, and human systems and their interconnections. However, there are limited pan-arctic records of long-term changes in these systems (e.g., Holmes et al., 2000) and many disciplines and domains are not represented within existing observational networks. Examples of measurement gaps in chemical systems (carbon dioxide fluxes), biological systems (landscape-related parameters such as leaf area index and net primary production, species lists, biological sampling from drifting and moored marine platforms), physical systems (glacier contributions to freshwater fluxes, bathymetry and elevation), and human systems (human-environment relations and demographic data) are discussed in this section. In addition to these straight thematic gaps, there is also a lack of integration across themes—for example, among ecological and physical data.
It is not currently possible to measure carbon fluxes and variations through time. Although it is generally thought that warming temperatures will increase the role of the Arctic as a carbon dioxide (CO2) source (Billings et al., 1982), it is not known whether the Arctic as a whole is a source or a sink for CO2 and methane. Presently, fluxes are only resolved for small experimental measurement sites (e.g., Weller et al., 1995).
Within the biological domain, there is a dearth of landscape-related parameters such as net primary production and leaf area indices that could be monitored routinely by satellite. No follow-on Landsat mission is planned, and the most similar mission—ASTER (Advanced Spaceborne Thermal Emission and Reflection Radiometer)—will not replace the types of observations made by Landsat. Even a basic species list for many taxa is lacking,4 and, in the marine domain, biological sampling from drifting and moored platforms is just beginning and requires substantial sensor development before biological observations from these platforms will have broad-based use.
In the physical domain, quantifying the contribution of glacier melt to the overall freshwater flux in the Arctic is a critical gap. Although the mass balance of the Greenland Ice Sheet has been monitored through NASA’s Program for Regional Climate Assessment, there has been little systematic observation of the mass balance of other, smaller ice masses (Arendt et al., 2002). Dyurgerov and Carter (2004) concluded that glacier runoff was a larger source than river runoff for increased freshwater fluxes to the Arctic Ocean between 1961 and 1998, but also stated “[w]e cannot accurately calculate the meltwater discharge from all pan-arctic glaciers due to the lack of data.”
In addition to physical parameters that are changing over human time frames, baseline information that is taken for
|
3 |
The Arctic Oscillation (AO) is a mode of atmospheric variability that currently has a positive trending index that may be indicative of greenhouse warming (SEARCH, 2001). Climate indices supported by many physical and biological time series show coherent changes across the Arctic that are decadal in scale (Overland et al., 2004). Variations in the AO and the North Atlantic Oscillation may have direct links to interannual to decadal variations in precipitation and river discharge in the Arctic (Peterson et al., 2002; Déry and Wood, 2005). |
|
4 |
See, for example, http://www.sfos.uaf.edu/research/arcdiv/index.html. |
granted outside the Arctic such as oceanic bathymetric information and digital elevation models (DEMs) is broadly lacking in the Arctic. Bathymetry and DEMs are needed to help develop future models and monitoring strategies. Tide gauges in the Arctic Ocean are also sparse (Plag, 2000).
In the human domain, there are many questions about human-environment relationships for which substantial information gaps exist. For example, human demographic data (e.g., population size, composition, birth rates, death rates, and migration) often are collected through national and state agencies and it can be difficult to locate or access the data. The AON could help fill a key gap by making existing demographic data (and other human dimension data such as those on health and education) more easily available and helping organize these data into a common structure so that information is comparable across the Arctic. In addition, there is an absence of and need for disaggregated data (e.g., broken down by indigenous/non-indigenous, male/female, by community, size) (AHDR, 2004) that would show community-level trends rather than only national trends.
Data Management and Access Gaps
Many attendees of the Committee’s two workshops expressed concern over data management and access limitations for arctic data and a strong need for a unified approach to data management and data sharing by those collecting arctic observations.5 There is a gap in the synthesis and integration of data being collected throughout the Arctic that is partly caused by difficulties “stitching together” time series from sensors and platforms that span different time frames, sampling frequencies, and levels of accuracy. In addition, different measurements of a particular variable are often difficult to reconcile. For example, there are substantial qualitative differences among precipitation amounts obtained from gauges and their various correction procedures, from different interpolation methods, and from in situ and remote sensing information.
Data accessibility is a related problem (see Annex 3C). Access to data is impeded by a number of barriers that include national regulations that limit access because of national security and exclusive economic zone restrictions, age and geographic constraints (e.g., research embargos) that influence when or where data are shared, and concerns over privacy and intellectual property rights.6 Different nations and different government agencies often have their own rules for data distribution and access, and data collected by the private sector are often not accessible. Finally, individual scientists often only store their data in personal archives with the likelihood that these data will be lost if there is no concerted effort to share them with data centers that can manage and share them more effectively in the long term.
SUMMARY AND CHAPTER RECOMMMENDATIONS
There are many ongoing and planned international activities that, if coordinated and integrated, could be the core of the AON. However, there are also many geographic, temporal, thematic, and other gaps even given these available resources. This lack of adequate and coordinated observations limits the capability to identify the geographic extent of ongoing changes, as well as the attribution of these changes. It limits society’s responses to these ongoing changes and its capability to anticipate, predict, and respond to future changes that affect physical processes, ecosystems, and arctic and global residents. An initial focus of effort on consistently measuring a subset of important variables (e.g., the key variables discussed in the previous chapter) could provide a practical starting point.
Recommendation: An Arctic Observing Network should be initiated using existing resources and with the flexibility to expand and improve to satisfy current and future scientific and operational needs. In its initial phase, the network should monitor selected key variables consistently across the arctic system.
The upcoming IPY is an opportunity to “design and implement multidisciplinary observing networks” (NRC, 2004). The IPY will include an international, coordinated set of activities that will provide a burst of new and intensive monitoring for a two-year period that will help jump-start the AON. Experience, knowledge, and infrastructure (in particular, new data, new data measurement and management approaches, and new logistical support) gained through IPY could provide additional resources to advance the AON beyond its existing core components.
Recommendation: Work to design and implement an internationally coordinated Arctic Observing Network should begin immediately to take advantage of a unique window of opportunity created by a convergence of international activities during the International Polar Year that focus on observations.
ANNEX 3A
EXAMPLES OF EXISTING NETWORKS, OBSERVATORIES, DATA CENTERS, SATELLITES, COORDINATING BODIES, AND PROGRAMS
A fundamental message of this report is that the AON should not start from scratch. Myriad networks and programs, existing and planned, are its building blocks. This annex provides an overview of the range of observatories, networks, programs, and other resources that could be these building blocks. It is difficult to separately group networks, observatories, instruments, and programs, for different elements of an observatory may be parts of separate networks—perhaps because of differences in the historical development of the variety of observing programs and also in how different countries and disciplines operate. These are critical factors that the AON will need to embrace as it develops. The Committee has tried to identify as many resources as possible, but the list is not exhaustive. If the reader becomes acquainted with more new entities than they find missing, then the Committee has achieved its goal for this table. Nonetheless, readers should contact the Polar Research Board with information on missing observatories, networks, or other entries to help expand the master list of potential partners and observation platforms that could contribute to the AON. This annex contains six tables that provide examples of networks, observatories, satellites, data centers, coordinating bodies, and programs, respectively. The following abbreviations are used in all tables:
|
Abbreviation |
Domain |
|
A |
Atmosphere |
|
Co |
Coastal |
|
Cr |
Cryosphere |
|
F |
Freshwater |
|
HD |
Human Dimensions |
|
M |
Marine |
|
SP |
Space Physics |
|
T |
Terrestrial |
ANNEX TABLE 3A.1 Examples of Currently Operating and Planned Arctic Networksa
|
Currently Operational Networks |
|||||||
|
Acronym |
Domainb |
Acronym Definition |
What Is Measured/Products/Key Variables |
Inception |
Region |
Extent in the Arcticc |
More Information/URL |
|
ABEKC |
HD, T |
Arctic Borderlands Ecological Knowledge Co-op |
Community-based monitoring of weather, ice, rivers, fish, caribou, other animals, and land activities |
1995 |
Alaska |
|
This network identifies key variables. http://www.taiga.net/coop/index.html |
|
ALIS |
SP |
Auroral Large Imaging System |
Aurora |
1993 |
Sweden |
SM |
|
|
ALISON |
Cr, T |
Alaska Lake Ice and Snow Observatory Network |
Ice thickness, snow depth, temperature and mean density |
1999 |
Alaska |
MED |
|
|
AMAP/Marine |
M |
Arctic Monitoring and Assessment Programme |
Contaminants, climate, UV, and physical, chemical, and biological variables |
1991 |
Pan-arctic |
|
This network identifies key variables. http://www.amap.no/ |
|
AMAP/Atmosphere |
A |
See previous |
Contaminants, climate, UV, and physical and chemical variables |
1991 |
Pan-arctic |
|
See previous URL |
|
AMAP/Freshwater |
F |
See previous |
Contaminants, climate, UV, and physical, chemical, and biological variables |
1991 |
Pan-arctic |
|
See previous URL |
|
Currently Operational Networks |
|||||||
|
Acronym |
Domainb |
Acronym Definition |
What Is Measured/Products/Key Variables |
Inception |
Region |
Extent in the Arcticc |
More Information/URL |
|
AMAP/Human Health |
HD |
See previous |
Contaminants, climate, UV, and physical, chemical, and biological variables |
1991 |
Pan-arctic |
|
See previous URL |
|
AmeriFlux |
T |
|
Ecosystem-level exchanges of CO2, water, energy, and momentum spanning diurnal, synoptic, seasonal, and interannual time scales |
1996 |
Alaska, U.S. National Network |
SM |
|
|
ANKN |
MD |
Alaska Native Knowledge Network |
Information related to Alaska Native Knowledge systems |
|
Alaska |
|
|
|
AOOS |
M |
Alaska Ocean Observing System |
Oceanographic, sea ice, and biological observing |
2005 |
Arctic Alaska and Bering Sea |
|
|
|
ARCN I&M |
T |
Arctic Network Inventory and Monitoring Program |
Climate, water quality, plant biodiversity, plant productivity (NDVI), mammal diversity, lemming populations, visitor impact, plant phenology, cultural integrity, and snow melt patterns |
1994 |
Alaska |
SM |
Operated by the National Park Service http://www1.nature.nps.gov/im/units/arcn/index.cfm |
|
ARGO |
M |
— |
Floats that measure temperature and salinity of the upper 2000 m of the ocean |
2000 |
Global |
LG |
|
|
ASIAQ |
T |
“Asiaq” is a weather goddess in Inuit mythology |
Climate, glacier maps, and hydrological gauging stations |
1975 |
Greenland |
|
|
|
Canopus |
SP |
Canadian Auroral Network for the Open Program Unified Study |
Aurora |
1989 |
Canada |
MED |
|
|
Digisonde network |
SP |
University of Massachusetts Digisonde Network |
Ionospheric density |
1981 |
Global |
LG |
|
|
DMI Geomagnetic, Ionosonde, and Riometer Observatories |
A, SP |
Danish Meteorological Institute |
Absolute and relative geomagnetic vector data, ionization of gases in the atmosphere, and ionospheric absorption of cosmic radio noise |
1950s |
Greenland |
MED |
|
|
Currently Operational Networks |
|||||||
|
Acronym |
Domainb |
Acronym Definition |
What Is Measured/Products/Key Variables |
Inception |
Region |
Extent in the Arcticc |
More Information/URL |
|
DMI Meteorological Observing Stations |
A |
See previous |
Climate, precipitation, temperature, relative humidity, wind, and air pressure |
1960s |
Denmark, Faroe Islands and Greenland |
SM |
|
|
Eiscat |
SP |
European Incoherent Scatter Radar |
Ionospheric and thermospheric parameters |
1996 |
Scandinavia |
SM |
|
|
EMAN-North |
Co, Cr, F, T |
Ecological Monitoring and Assessment Network-North |
Impacts of industrial development and climate change in northern ecosystems |
1991 |
Northern Canada |
MED |
|
|
EMEP |
A |
Cooperative Programme for Monitoring and Evaluation of the Long-range Transmission of Air Pollutants in Europe |
Collection of emission data, measurements of air and precipitation quality, and modeling of atmospheric transport and deposition of air pollution |
2000 |
Europe |
LG+ |
|
|
EuroFlux |
T |
|
Long-term carbon dioxide and water vapour fluxes of European forests and interactions with the climate system |
1996 |
Iceland, Denmark, Finland |
MED |
http://www.unitus.it/dipartimenti/disafri/progetti/eflux/euro.html |
|
GCOS |
A, Cr, F, M, T |
Global Climate Observing System |
Detects climate trends and climate change due to human activities, predicts seasonal-to-interannual climate, reduces uncertainties in long-term climate prediction, and improves data for impact analysis |
1992 |
Global |
LG+++ |
This network identifies key variables. http://www.wmo.ch/web/gcos/Second_Adequacy_Report.pdf (section 6.2) and http://www.wmo.ch/web/gcos/Implementation_Plan_(GCOS).pdf (Chapter 5) |
|
GEMS |
F |
Global Environment Monitoring System |
Maintains a global freshwater quality information system and provides this information to support global and regional environmental assessments |
1977 |
Global |
LG+++ |
|
|
GLOBE |
MD |
Global Learning and Observations to Benefit the Environment |
Atmosphere, hydrology, soils, and land cover/phenology |
1995 |
Global |
|
GLOBE is a worldwide hands-on, primary and secondary school-based education and science program in which students take scientifically valid measurements. http://www.globe.gov |
|
Currently Operational Networks |
|||||||
|
Acronym |
Domainb |
Acronym Definition |
What Is Measured/Products/Key Variables |
Inception |
Region |
Extent in the Arcticc |
More Information/URL |
|
GOOS |
Co, M |
Global Ocean Observing System |
Physical, chemical, and biological oceanography |
1991 |
Arctic Ocean |
LG+++ |
|
|
GSN |
A |
GCOS-Surface Network |
Surface temperature, precipitation, and pressure |
1997 |
Global |
LG+++ |
This network identifies key variables. http://www.wmo.ch/web/gcos/gcoshome.html |
|
GTOS/GTN-P |
T |
Global Terrestrial Observing System/GTOS Terrestrial Network for Permafrost |
Bore hole temperature |
1999 |
Europe |
LG+ |
This network identifies key variables. http://www.gtnp.org/index.html |
|
GTOS/GTN-P/CALM |
T |
GTOS/GTN-P/Circumpolar Active Layer Monitoring |
Active layer, permafrost monitoring network |
1994 |
Pan-arctic |
LG |
This network identifies key variables. http://www.fao.org/gtos |
|
GTOS/GTN-P/INPO |
T |
GTOS/GTN-P/International Network of Permafrost Observatories |
Bore hole temperature |
2000 |
Pan-arctic |
LG |
This network identifies key variables. http://www.fao.org/gtos |
|
GUAN |
A |
GCOS-Upper Air Network |
Vertical profiles of temperature, humidity, and wind speed and direction through the troposphere |
1992 |
Global |
LG+ |
This network identifies key variables. http://www.wmo.ch/web/gcos/gcoshome.html |
|
IABP |
M |
International Arctic Buoy Program |
Maintains drifting buoy network measuring meteorological and oceanographic data, including sea ice |
1970s |
Arctic Ocean |
LG |
|
|
ICS |
HD |
International Circumpolar Surveillance |
Infectious disease |
1999 |
Pan-arctic |
|
|
|
ITEX/NATEX and CANTEX |
T |
International Tundra Experiment/North American Tundra Exp. and Canadian Tundra Exp. |
Climate, biodiversity, and ecosystem function |
1992 |
Pan-arctic |
MED |
Plot level passive warming manipulation. This network identifies key variables. http://www.itex-science.net/ |
|
LTER |
T |
Long Term Ecological Research |
Terrestrial and aquatic ecosystem monitoring |
1987 |
Toolik Lake & Bonanza Creek, Alaska, U.S. National Network |
SM |
|
|
MACCS |
SP |
Magnetometer Array for Cusp and Cleft Studies |
Magnetic field |
1995 |
Canada |
SM |
|
|
Currently Operational Networks |
|||||||
|
Acronym |
Domainb |
Acronym Definition |
What Is Measured/Products/Key Variables |
Inception |
Region |
Extent in the Arcticc |
More Information/URL |
|
Miracle |
SP |
Magnetometers-Ionospheric Radars-Allsky Cameras Large Experiment |
Magnetic field and aurora |
1997 |
Scandinavia |
MED |
|
|
MLTR |
A, SP |
Mesosphere Lower Thermosphere Radar Network |
Mesospheric winds |
2000 |
Global |
MED |
|
|
NDBC/Atmosphere |
A |
National Data Buoy Center/Atmosphere |
Wind direction, speed, and gust, barometric pressure, air temperature, and relative humidity |
1991 |
Global |
SM |
|
|
NDBC/Marine |
M |
National Data Buoy Center/Marine |
SST, significant wave height, and average and dominant wave period |
1991 |
Global |
MED |
|
|
NOP |
M |
National Observer Program |
Biological data and fisheries |
1973 |
North Pacific & Bering Sea |
SM |
|
|
Norwegian Atmospheric Terrestrial and Freshwater Monitoring |
A, F, T |
|
Acidification of fresh water, precipitation, ground ozone, and forest observations |
Early 1970s |
Norway |
LG+ |
This is a Norwegian national effort. |
|
NWS Radiosonde Network |
A |
National Weather Service Radiosonde Network |
Tropospheric winds and state variables |
1940s |
Global |
LG |
|
|
NWS VOS |
A |
National Weather Service Voluntary Observing Ship Program |
Weather |
|
Global |
LG+++ |
|
|
R-ArcticNet/National |
F |
Regional-ArcticNet |
River runoff and chemistry |
1960s |
Pan-arctic |
LG+++ |
|
|
SCANNET |
T |
Scandinavian/North European Network of Terrestrial Field bases |
Climate variability, key human drivers of change, indicators of social and environmental change, trends of biodiversity, and species performance and phenology |
1987 |
Scandinavia |
MED |
|
|
SliCA |
HD |
Survey of Living Conditions in the Arctic |
Living conditions |
2000 |
Pan-arctic |
|
This network identifies key variables. http://www.iser.uaa.alaska.edu/projects/Living_conditions/index.html |
|
SuperDarn |
SP |
Super Dual Auroral Radar Network |
Ionospheric convection patters and mesospheric winds |
1993 |
Arctic and Antarctic |
MED |
|
|
Currently Operational Networks |
|||||||
|
Acronym |
Domainb |
Acronym Definition |
What Is Measured/Products/Key Variables |
Inception |
Region |
Extent in the Arcticc |
More Information/URL |
|
WHYCOS (WMO) |
F |
World Hydrological Cycle Observing System (World Meteorological Organization) |
Range of hydrological parameters |
1993 |
Global |
|
|
|
WMO-GOS/WWW |
A |
WMO-Global Observing System of World Weather Watch |
Physical parameters of atmosphere |
1963 |
Europe, North America |
LG+++ |
Made up of 10,000 stations, 7,000 ships, and 3,000 aircraft |
|
WMO-GAW |
A |
WMO-Global Atmosphere Watch |
Chemical parameters of atmosphere |
1989 |
Global |
LG++ |
GAW is considered the atmospheric chemistry component of the Global Climate Observing System (GCOS). http://www.wmo.ch/web/arep/gaw/gaw_home.html |
|
Planned Networks |
|||||
|
Acronym |
Domainb |
Acronym Definition |
What Will Be Measured/Products/Key Variables |
Region |
Comments |
|
ACCO-Net |
Co, M |
Arctic Circum polar Coastal Observatory Network |
Approximately 20 sites including deltas and estuaries of major Siberian and North American rivers are proposed. The sites will be loci for multidisciplinary studies and will include sensitive areas with varying degrees of human impact. Site selection will be coordinated with local communities and build upon existing monitoring programs and data availability. |
Pan-arctic |
|
|
AICEMI |
HD |
International Network of Arctic Indigenous Community-Based Environmental Monitoring and Information Stations |
Community based monitoring of environmental, social, economic variables |
Pan-arctic |
Proposed IPY 2007-2008 project |
|
ARN |
HD |
Arctic Residents’ Network |
Integration of local/traditional knowledge and science to assess vulnerability |
Pan-arctic |
Proposed IPY 2007-2008 project |
|
BTF |
T |
Back to the Future |
Vegetation change in polar regions |
Pan-arctic |
Proposed IPY 2007-2008 project |
|
CAFF-CBMP |
T |
Conservation of Arctic Flora and Fauna/Circumpolar Biodiversity Monitoring Program |
Biodiversity of arctic flora and fauna |
Pan-arctic |
This network identifies key variables. http://www.caff.is/ |
|
CARMA |
T |
Circumarctic Rangifer Monitoring & Assessment Network |
Wild rangifer subspecies, focusing on the large migratory herds from North America and Russia |
Pan-arctic |
Proposed IPY 2007-2008 project http://www.rangifer.net/carma/ |
|
CAT-B |
T |
Circum-Arctic Terrestrial Biodiversity |
Terrestrial biodiversity |
Pan-arctic |
Proposed IPY 2007-2008 project |
|
Planned Networks |
|||||
|
Acronym |
Domainb |
Acronym Definition |
What Will Be Measured/Products/Key Variables |
Region |
Comments |
|
ELOKA |
HD |
Exchange for Local Observations and Knowledge of the Arctic |
Community-based monitoring and data management and networking service for local and traditional knowledge and observations |
Pan-arctic |
Proposed IPY 2007-2008 project |
|
EMSO |
M |
European Multidisciplinary Seafloor Observatory |
Continuous monitoring of geophysical, biogeochemical, oceanographic, and biological active phenomena |
Europe |
Project proposed by the the European Strategy Forum on Research Infrastructure (ESFRI) to establish 10 regional monitoring networks |
|
MAOOS |
M |
Mooring-Based Arctic Ocean Observational System |
Ocean circulation, water mass transformations, biogeochemical fluxes, key mechanisms of variability, and links to the lower-latitude processes |
Arctic Ocean |
Proposed IPY 2007-2008 project |
|
NEON/HLEO |
T |
National Ecological Observatory Network/High Latitude Ecological Observatory |
Interdisciplinary measurements and experiments on ecological systems |
Alaska |
|
|
RENNET |
HD |
Reindeer Network |
Coping mechanisms and the adaptive capacity of reindeer herding in a changing climate |
Norway |
Proposed IPY 2007-2008 project; an arctic vulnerability network study driven by ACIA |
|
NOTE: A network is a collection of spatially distributed instruments managed by different lead investigators or researchers using the same or similar methodologies to measure common or similar parameters that can be integrated with the goal of addressing a specific scientific question or uncertainty. Networks typically consist of a few (5 to 10) to hundreds of standardized measurement units distributed across a geographic region. These measurement units can be automated instrument packages or may involve a human component. aA dash (—) indicates undetermined information or not applicable. bA = atmosphere, Co = coastal, Cr = cryosphere, F = freshwater, HD = human dimensions, M = marine, SP = space physics, T = terrestrial. cExtent in the Arctic refers to the number of sites (N) in the Arctic, even though some networks may extend beyond the Arctic. SM (N < 10); MED (10 ≤ N ≤ 25); LG (25 ≤ N ≤ 100), LG+ (100 ≤ N ≤ 250), LG++ (250 ≤ N ≤ 500), and LG+++ (N ≥ 500). |
|||||
ANNEX TABLE 3A.2 Examples of Currently Operational Arctic Observatoriesa
|
Name |
Domainb |
What Is Measured/Products/Key Variables? |
Inception |
Location |
More Information/URL |
|
Abisko |
T |
Dynamics of plant populations, recent climate changes in the region, and local variations of the microclimate in subalpine and alpine ecosystems |
1903 |
Sweden |
|
|
Alert |
A, M, T |
Chemistry of the atmosphere - greenhouse gases, organic pesticides and fine particles, stratospheric ozone, etc. |
1956 |
Ellesmere Island, Canada |
|
|
Alexandra Fjord |
T |
Nitrogen and other nutrients in tundra ecosystems |
1992 |
Ellesmere Island, Canada |
Sites operated under by the International Tundra Experiment (ITEX) |
|
Arctic Lidar Observatory for Middle Atmosphere Research (ALOMAR) |
A, SP |
Atmospheric wind, temperature, chemistry, aurora, and ionosphere |
1994 |
Norway |
|
|
Arctic Station |
Cr |
Air temperature, humidity, incoming and outgoing radiation, wind speed and direction, rainfall, and ground temperature |
|
Disko Island, Greenland |
|
|
Atmospheric Radiation Measurement (ARM) |
A |
Radiation, climate, and other atmospheric parameters |
Barrow, Atqasuk |
||
|
Barentsberg |
Co |
Sea level |
Svalbard |
|
|
|
Barrow Environmental Observatory (BEO) |
A, M, T |
Long-term baseline and monitoring studies for contaminants, permafrost, soils, vegetation, wildlife, etc. |
1992 |
Alaska |
|
|
Bering Strait Environmental Observatory (BSEO) |
M |
Physical, chemical, and biological variables in the marine environment |
2000 |
Bering Strait |
|
|
Bonanza Creek |
T |
Forest dynamics and biogeochemistry |
1987 |
Alaska |
|
|
Cherski (Northeast Science Station) |
A, Co, M |
Geological and marine investigations along the coast of the Arctic Ocean, global carbon and methane fluxes, seasonal cycle of atmospheric CO2, and the discharge of carbon and nitrogen into the Arctic Ocean |
1989 |
Russia |
|
|
Eureka (Arctic Stratospheric Ozone Observatory) |
A |
Stratospheric ozone |
1993 |
Ellesmere Island, Canada |
|
|
Hornsund (Polish Polar Station) |
M |
Marine biodiversity |
1957 |
Svalbard |
|
|
Kilpisjarvi |
A |
Ionospheric studies |
1994 |
Finland |
|
|
Kiruna (Swedish Institute of Space Physics) |
A, SP |
Atmosphere, ionosphere, and aurora |
1957 |
Sweden |
|
|
Lena Delta (The International Biological Station) |
T |
Biodiversity |
1995 |
Siberia, Russia |
|
|
Longyearbyn |
A, SP |
Atmosphere and aurora |
|
Svalbard |
Operated by the University of Spitzbergen |
|
Name |
Domainb |
What Is Measured/Products/Key Variables? |
Inception |
Location |
More Information/URL |
|
Mars Arctic Research Station (MARS) |
M |
The Earth’s geologic past, cosmic phenomena (e.g., impact cratering), and robotic testing and human exploration technologies and strategies |
1999 |
Nunavut, Canada |
|
|
Nansen and Amundsen Basin Observational System/Canadian Basin Observational System (NABOS/CABOS) |
M |
Structure, strength, water-mass transformation mechanisms, heat transport, and variability of ocean circulation |
|
Arctic Ocean |
http://nabos.iarc.uaf.edu/ http://www.frontier.iarc.uaf.edu/NABOS/index.php http://www.frontier.iarc.uaf.edu/CABOS/index.php |
|
North Pole Environmental Observatory (NPEO) |
Cr, M |
Physical variables for sea ice, surface meteorological observations, ocean conditions over a wide area and to the bottom of the Arctic Ocean |
2000 |
Arctic Ocean |
|
|
Ny Ålesund |
A, Cr, M, T |
Atmosphere, ionosphere, cryosphere, biosphere, and marine systems |
|
Svalbard |
Multinational research done by Norway, Germany, Japan, France, Italy, China, etc. |
|
Oulu Cosmic Ray Station |
A, SP |
Cosmic ray measurements |
1964 |
Finland |
|
|
Point Barrow Observatory |
A, M, SP, T |
Aerosol quality control plots, Barrow isentropic plots, carbon cycle sampling network, chromatograph of trace gases, station meteorology, total ozone data, and the Geomagnetism Program of the USGS |
1973 |
Alaska |
|
|
Poker Flat |
A, SP |
Atmosphere, ionosphere, and aurora |
1968 |
Alaska |
|
|
Resolute Bay |
A, SP |
Atmosphere, ionosphere, and aurora |
1966 |
Canada |
|
|
Sermilik Station |
Cr |
Glaciological monitoring of the Mittvakkat-glacier |
1970 |
Greenland |
Owned by the University of Copenhagen http://www.geogr.ku.dk/facilit/fieldst/sermiklik.html |
|
Sondrestrom Fjord |
A, SP |
Atmosphere, ionosphere, and aurora |
1983 |
Greenland |
|
|
Summit |
A, Cr |
Atmospheric chemistry, meteorological data, and snow-atmosphere interactions |
1989 |
Greenland |
|
|
Tiksi Bay Observatory |
A, SP |
Weather and geophysical station |
|
Russia |
Operated by the Institute of Cosmophysical Research and Aeronomy (IKFIA) |
|
Toolik Field Station |
F, T |
Biology, physiology, climatology, hydrology, and ecology |
1975 |
Alaska |
|
|
Zackenberg Ecological Research Operations (ZERO) |
M, T |
Biological variables, climate, and snow cover |
1996 |
Denmark |
|
|
Zhigansk Ionospheric Station |
Sp |
Ionospheric studies |
|
Russia |
|
|
NOTE: An observatory is a site or locality that supports the operation of multiple measurement units all managed by a single lead investigator or a collaboration of investigators drawn to the same site/locality of interest. Observatories range in size from large, multidisciplinary sites to smaller, more focused observatories that support single disciplines or focus on a specific scientific topic. aA dash (—) indicates undetermined information. bA = atmosphere, Co = coastal, Cr = cryosphere, F = freshwater, HD = human dimensions, M = marine, SP = space physics, T = terrestrial. |
|||||
ANNEX TABLE 3A.3 Examples of Arctic-related Satellite Missions and Instruments Past, Present, and Planned
|
Key Variable |
Domaina |
Satellite(Instrument) |
|
Physical Variables |
||
|
Albedo |
Cr, M |
Landsat 3-5(TM), AQUA(MODIS,CERES), Envisat(MERES), EO-1 Hyperion, Landsat 7(ETM), TERRA(MODIS, CERES, MISR, ASTER), NOAA1-17(AVHRR), POLDER, SPOT-5, METOP(AVHRR), NPOESS(VIIRS), |
|
Elevation/Bathymetry |
Cr, M, T |
ERS-1 and 2 (radar altimeter), Envisat(RA-2), GRACE, ICESAT(GLAS), JASON-1, TERRA(ASTER), TOPEX(POSEIDON), CRYOSAT-2, OMST(CNES) |
|
Ice Thickness (sea ice and land ice) |
Cr, M |
AQUA(AMSR-E), DMSP F8-F17 (SSM/I, SSMI/S), Envisat(RA-2), ERS-1and 2(radar altimeter), ICESAT(GLAS), Seawinds-II(QuikSCAT), TERRA(ASTER), CRYOSAT-2 |
|
Ice Extent and Concentration (including snow) |
Co, Cr, M, T |
Landsat 3-5(TM), Nimbus-5(ESMR), Nimbus-7(SMMR), ADEOS(NSCAT), AQUA(MODIS, AMSR-E), DMSP F8-F17(SSM/I, SSMI/S), Envisat(MWR), ERS-1 and 2(ESCAT), Landsat 7(ETM), NOAA 7-17(AVHRR), Seasat-A(SASS), Seawinds-II(QuikSCAT), TERRA(MODIS, MISR), NPOESS (VIIRS) |
|
Precipitation |
F, M, T |
CLOUDSAT, GPM (to 65 degrees N) |
|
Clouds |
A |
AQUA(MODIS, CERES, AIRS), EARTHPROBE(TOMS), Envisat(GOME, MERES), Envison(MIPAS), ERS-2(GOME), NOAA 6-12,14(TOVS), TERRA(MODIS, CERES), CALIPSO, CLOUDSAT(CPR) |
|
Pressure (atmospheric) |
A |
NOAA-6, 7, 9-12(TOVS), TIMED(SABER), UARS(HALOE), NPOESS(CrIS) |
|
Radiation |
A, Cr, M, T |
AQUA(MODIS, CERES), IMAGE(FUV), Landsat 3-5, 7, NOAA1-17(AVHRR), SDO(SOLSTICE), SOHO, TERRA(MODIS, CERES, MISR), TIMED(SEE), UARS(ACRIM), METOP(AVHRR), NPOESS(VIIRS) |
|
Salinity |
M |
Aquarius |
|
Snow Depth |
Cr |
Nimbus-7(SMMR), AQUA(AMSR-E), DMSP F8-F17(SSM/I, SSMI/S) |
|
Soil Moisture |
T |
AQUA(AMSR-E), Envisat(MWR) |
|
Temperature (atmosphere) |
A, Cr, SP, T |
AIM, AQUA(MSU, AMSU, AIRS), AURA(HIDRLS), DMSP(SSMT-1 and SSMT-2), Envisat(MWR, GOMOS), Envison(MIPAS), ERS-2(GOME), NOAA11-17(TOVS), ODIN, SAGE, TIMED(SABER, TIDI, GUVI), TOMS, UARS(MLS, HRDI), DMSP(SSMI/S), METOP(HIRS, AMSU-A, IASI, GRAS), NPOESS(CrIS) |
|
Temperature (skin) |
Cr, M, T |
AQUA(MODIS, CERES), Envisat(AATSR), ERS-1 and 2 (ATSR), Landsat 5-7, NOAA1-17(THIR, AVHRR), TERRA(MODIS, CERES), METOP(AVHRR), NPOESS(VIIRS) |
|
Velocity (wind, ocean circulation, ice) |
A, Cr, M |
Geosat, GO ES 3, Seasat, Envisat(ASAR, RA-2), ERS-1 and 2, JASON-1, POLARMETRICSAR, RADARSAT1-2(SAR), Seawinds(QuikSCAT), TIMED(TIDI), TOPEX(POSEIDON), UARS(HRDI, WINDII), METOP(ASCAT), OSTM (CNES, Jason-2) |
|
Water Vapor |
A |
AQUA(AIRS/VTPR), Envisat(MWR, MERES, GOMOS), Envison(MIPAS), ERS1-2(GOME), NOAA-6-7, 10, 12-17(TOVS), ODIN, SAGE I-III, TOMS, UARS, CLOUDSAT(CPR), METOP(HIRS, MHS, IASI), NPOESS(CrIS), OMST(AMR) |
|
Freshwater Flux |
Cr, F, M, T |
None |
|
Lake Level |
T |
None |
|
Sea Level |
Co, F, M |
Envisat(RA-2), JASON-1, TOPEX(POSEIDON), OMST(CNES) |
|
Aerosol Concentration (stratospheric) |
A |
Nimbus-7(SAM II), AEM-B(SAGE I), AURA, ERBS(SAGE II), METEOR-M(SAGE III), NPOESS(APS) |
|
Land Cover |
T |
ALOS, AQUA(MODIS), EO-1 Hyperion, IRS-P5/P6(CARTOSAT-1 and 2), JERS-1, NOAA 1-17(AVHRR), TERRA(MODIS, ASTER), TOPSAT, EROS B/C, METOP(AVHRR), TerraSAR-X |
|
Key Variable |
Domaina |
Satellite(Instrument) |
|
Biogeochemical Variables |
||
|
Trace Gasses (e.g., CH4, O3, ClO) |
A |
Nimbus-7(LIMS, TOMS), AEM-B(SAGE I), AQUA(AIRS/VTPR), AURA, EARTHPROBE(TOMS), Envisat(GOMOS, MIPAS), Envison(MIPAS), ERBS(SAGE II), ERS-2(GOME), Meteor-3M(SAGE III), NOAA 6-12, 14(TOVS), OSIRIS(ODIN), TIMED(SABER), UARS(HALOE), CALIPSO, METOP(GOME-2), NPOESS(OMPS) |
|
Biodiversity |
T |
None |
|
Biomass |
|
None |
|
Carbon Concentration (CH4, C02, VOCs) |
A |
Nimbus-7(SAMS), AURA(HIDRLS, TES), TERRA(MOPITT), UARS(HALOE, ISAMS) |
|
Nutrient Concentration |
|
None |
|
Contaminant Concentration |
|
TERRA(MOPITT) |
|
Dissolved Oxygen Concentration |
A, M |
None |
|
Phenology |
A, Co, Cr, HD, M, T |
Nimbus 7(CZCS), AQUA(MODIS), Envisat(MERIS), IKONOS, Landsat 5-7, NOAA 1-17(AVHRR), QUICKBIRD, SeaWifs(CZCS), SPOT-5, TERRA(MODIS, ASTER), METOP(AVHRR), NPOESS(VIIRS) |
|
Upper Atmosphere |
A |
AURA(HIDRLS), UARS(WINDII, PEM, ISAMS) |
|
Human Dimensions Variables |
||
|
Economic Indicators |
HD |
CORONAS, IKONOS, Landsat, QUICKBIRD |
|
NOTE: Italics denote expired missions and bold denotes planned missions. The list is linked to the key variables listed in Table 2.1. It is evident that satellite data are more prevalent for physical variables than biogeochemical and human. Each satellite platform is listed with any relevant sensor, if known, in parentheses. Acronyms are defined in Appendix C. aA = atmosphere, Co = coastal, Cr = cryosphere, F = freshwater, HD = human dimensions, M = marine, SP = space physics, T = terrestrial. |
||
ANNEX TABLE 3A.4 Examples of Arctic Data Centers, Archives, and Portals
|
Acronym |
Domaina |
Acronym Definitionb |
Data Products |
Country |
More Information/URL |
|
Operational Data Centers |
|||||
|
ADIS |
A, Cr, F, M, T |
ACSYS Data and Information Service |
Over 1,400 datasets relating to the atmosphere, hydrosphere, ocean, sea ice, cryosphere, modelling, biosphere, ecology, and land |
Norway |
|
|
AMAP |
A, F, HD, M, T |
Arctic Monitoring and Assessment Programme |
Contaminants (atmospheric, hydrosphere, terrestrial), radioactivity, and human health |
Canada, Denmark/Greenland, Finland, Iceland, Norway, Russia, Sweden, USA |
|
|
APDA |
F, M, T |
Arctic Precipitation Data Archive |
Global precipitation data |
Germany |
http://www.dwd.de/en/FundE/Klima/KLIS/int/GPCC/Projects/APDA/ |
|
ARDB |
F, M, T |
Arctic Runoff Data Base |
Global river discharge data |
Germany |
|
|
CO-OPS |
M |
Center for Operational Oceanographic Products and Services |
Physical variables: tides, currents, and sea level |
USA |
|
|
DISC |
Cr |
Data and Information Service for CliC |
Metadata for cryospheric datasets |
Norway |
|
|
EOS |
A, Cr, F, M, T |
Earth Observing System |
Satellite data from polar-orbiting and low inclination satellites |
USA |
|
|
GINA |
A, Cr, F, M, T |
Geographic Information Network of Alaska |
Distributed data system for geospatial information (e.g., GIS) |
USA |
|
|
UNEP/GRID-Arendal |
HD |
United Nations Environmental Program |
Environmental cartographic products |
United Nations countries (Norway) |
|
|
ICES |
M |
International Council for Exploration of the Sea |
Marine ecosystems covering environment, oceanography, and fisheries |
19 nations |
|
|
NCDC |
A, Cr |
National Climatic Data Center |
Climatic data |
USA |
|
|
NGDC |
M, SP, T |
National Geophysical Data Center |
Sea floor, solid Earth, and solar geophysical data |
USA |
|
|
NILU |
A |
Norwegian Institute for Air Research |
Measurements from atmospheric research and monitoring programs |
Norway |
|
|
NODC |
Co, M |
National Oceanographic Data Center |
Global oceanographic and coastal data |
USA |
|
|
NSIDC |
A, Cr |
National Snow and Ice Data Center |
Snow and ice data from land, sea, air, space; holdings of NSF Arctic System Science (ARCSS) projects |
USA |
|
|
Acronym |
Domaina |
Acronym Definitionb |
Data Products |
Country |
More Information/URL |
|
NSSDC |
SP |
National Science Space Data Center |
Atmosphere, ionosphere, and magnetosphere parameters |
USA |
|
|
NWS |
A |
National Weather Service |
Radiosonde |
USA |
|
|
WDC |
MD |
World Data Center System |
List of and links to World Data Centers by subject (including Climate, Glaciology, Land Cover, Marine Environmental Sciences, Marine Geology and Geophysics, Oceanography, Paleoclimatology, Remotely Sensed Data, etc.) |
Russia, USA, UK |
|
|
Operational Data Archives |
|||||
|
AOOS |
M, Co |
Alaska Ocean Observing System |
Real-time and historic datasets on ocean and coastal variables |
USA |
|
|
AAGRUUK |
Co, M |
Arctic Archive for Geophysical Research: Unlocking Undersea Knowledge |
Bathymetry and geophysical data and maps for the Arctic Ocean basin |
USA |
|
|
CEDAR |
A, SP |
Coupling Energetics and Dynamics of Atmospheric Regions |
Atmosphere, ionosphere, and magnetosphere parameters |
USA |
|
|
CEON |
F, T |
Circumarctic Environmental Observatories Network |
Terrestrial and freshwater observations, data, and maps |
USA |
|
|
ENVINET |
A, M, T |
European Network for Arctic-Alpine Environmental Research |
Environmental data, primarily within atmospheric physics and chemistry and marine and terrestrial biology |
EU |
|
|
JOSS/UCAR |
M |
Joint Office for Science Support/University Corporation for Atmospheric Research |
Geophysical data for programs that JOSS has supported |
USA |
|
|
LTER |
A, F, M, T |
Long Term Ecological Research Network |
Ecological datasets |
USA |
|
|
TIMED |
A, SP |
Thermospheric, Ionospheric, Mesospheric Energetics and Dynamics |
Atmosphere and ionosphere parameters |
USA |
|
|
UNAVCO |
A |
University NAVSTAR Consortium |
GPS geodetic data for the measurement of crustal deformation |
USA |
|
|
Current and Planned Data Portals |
|||||
|
BAID-IMS |
A, F, HD, M, T |
Barrow Area Information Database and Internet Mapping Server |
Spatially relevent data for historical research and research infrastructure on the western north slope of Alaska |
USA |
|
|
CEON-IMS |
A, F, HD, T |
The Circumarctic Environmental Observatories Network Internet Map Server |
Distribution of network and partnered observation platforms north of 45 degrees |
USA/Internatonal |
|
|
Acronym |
Domaina |
Acronym Definitionb |
Data Products |
Country |
More Information/URL |
|
IPY DIS |
MD |
International Polar Year Data and Information Service |
Metadata catalog for all IPY projects and a provision of Web-based portals to global IPY data archives |
USA/Internatonal |
Proposed IPY 2007-2008 project |
|
Polar View |
C, M, T |
— |
Monitoring for oil spills, icebergs, sea ice floe edges, river ice, and glaciers, high-resolution ice charts, sea ice thickness charts, and met-ice-ocean regional forecasting |
Canada |
|
|
VGMO |
SP |
Virtual Global Magnetic Observatory |
Interfaces geomagnetic data repositories and performs online data acquisition and processing |
USA |
|
|
VSO |
SP |
Virtual Solar Observatory |
Database of solar data searchable by data source, instrument, or observed physical variable |
USA |
|
|
NOTE: Data centers and portals are mechanisms for archiving and sharing data, respectively. A data center is a central location where data are archived. The data can come from large programs or single investigators and are typically quality controlled to ensure a basic level of integrity. Data centers provide a mechanism for the long-term archiving of datasets. A data portal is different from a data center and provides a mechanism, typically through the Web, to support a distributed repository of data. Data holdings at data centers may be large, terabyte-sized datasets from a satellite program, observations from a single investigator in the field, historical or paleoclimate records from ice cores, or recorded history from an indigenous person. aA = atmosphere, Co = coastal, Cr = cryosphere, F = freshwater, HD = human dimensions, M = marine, SP = space physics, T = terrestrial. bA dash (—) means not applicable. |
|||||
ANNEX TABLE 3A.5 Examples of Coordinating Bodiesa
|
Acronym |
Domainb |
Acronym Definition |
What Is Measured/Products/Key Variables? |
Inception |
More Information/URL |
|
ArcticNet |
Co |
|
Climate change impacts in the coastal Canadian Arctic |
2004 |
|
|
CBMP |
Co, Cr, F, M, T |
Circumpolar Biodiversity Monitoring Program |
Biodiversity and identification of indicators of trends in habitat and biodiversity |
2005 |
An endorsed IPY project that includes the development of a data portal through the World Conservation Monitoring Centre; http://www.caff.is/sidur/uploads/Circumpolar%20Biodiversity.pdf |
|
CEON |
F, T |
Circumarctic Environmental Observatories Network |
Provides access to data and information, access to facilities, adequate coverage of standardized observations and regional observatories, up-scaling of site specific observations, parameterization and validation of models and remote sensing, proxies and reoccupation of abandoned sites, development and testing of methodologies and sensors, and development of ecological theory |
2004 |
|
|
CEOS |
MD |
Committee on Earth Observation Satellites |
Coordinates international civil spaceborne missions |
1984 |
|
|
CIFAR |
A, Cr, M, T |
Cooperative Institute For Arctic Research |
Atmospheric and climate research, climate modeling, UV and arctic haze, hydrographic and sea ice studies, marine ecosystems, tsunami research, contaminant effects, fisheries, oceanography, and data archiving and support |
1994 |
|
|
CliC |
Cr |
Climate and Cryosphere |
Monitoring of the entire cryosphere (i.e., snow cover, sea, lake, and river ice, glaciers, ice sheets, ice caps and ice shelves, and permafrost), climate-related processes involving the cryosphere, and the assessment of changes in the cryosphere as indicators of global climate change |
2000 |
CliC was originally established by WCRP; however, in 2004 SCAR became a co-sponsor of the project. http://clic.npolar.no |
|
CLIVAR |
A, M |
Climate Variability and Predictability |
Climate variability and predictability on seasonal, interannual, decadal, and centennial time scales and the response of the climate system to increases of radiatively active gases and aerosols |
|
|
|
COMAAR |
MD |
Consortium for Coordination of Observation and Monitoring of the Arctic for Assessment and Research |
Intended to provide a forum for observation and monitoring networks in the Arctic, to consider new observation and monitoring platforms, and to improve coordination |
Planned |
|
|
DAMOCLES |
Cr, M, T |
Developing Arctic Modeling and Observing Capabilities for Long-term Environmental Studies |
Sea ice cover and the regional and global impacts on the environment of human activities |
Planned for 2006 |
European marine parallel to SEARCH; http://www.seaice.dk/damocles/ |
|
ENVINET |
A, M, T |
European Network for Arctic-Alpine Multidisciplinary Research |
Coordination of research and monitoring infrastructures to focus on atmospheric physics and chemistry and the marine and terrestrial domains |
2000-2003 (not currently active) |
Involved 17 environmental research infrastructures in Europe and 3 international organizations; biologywww.envinet.npolar.no/ |
|
Acronym |
Domainb |
Acronym Definition |
What Is Measured/Products/Key Variables? |
Inception |
More Information/URL |
|
GCOS |
MD |
Global Climate Observing System |
Monitors of the climate system, detects and attributes climate change, assesses the impacts of climate variability and change, and supports research for modeling and prediction of the climate system |
1992 |
|
|
GEOSS |
MD |
Global Earth Observation System of Systems |
Will collect data, enhance data distribution, and provide models to obtain integrated water resource management, ocean and marine resource monitoring and management, weather and air quality monitoring, forecasting and advisories, biodiversity conservation, sustainable land use and management, public understanding of environmental factors affecting human health and well-being, better development of energy resources, and adaptation to climate variability and change |
Planned |
GEOSS will be a large national and international cooperative effort to bring together existing and new hardware and software, making it all compatible to supply data and information at no cost. This activity will identify key variables. http://earthobservations.org/docs/10-Year%20Plan%20Reference%20Document%20(GEO%201000R).pdf |
|
GOOS |
M |
Global Ocean Observing System |
Physical, chemical, and biological oceanography |
1991 |
This activity identifies key variables. http://www.wmo.ch/web/gcos/Second_Adequacy_Report.pdf (section 6.2) and http://www.wmo.ch/web/gcos/Implementation_Plan_(GCOS).pdf (Chapter 5) |
|
GTOS |
Co, T |
Global Terrestrial Observing System |
Terrestrial carbon observations, climate observations, land dynamics, and terrestrial coastal environments studies |
1996 |
|
|
IASC-WAG |
Cr |
International Arctic Science Committee-Working group on Arctic Glaciology |
Dynamics and mass balance of arctic glaciers and ice sheets in relation to sea level and climate change |
1992 |
Currently includes a proposed project, GLACIODYN, that will address glacier dynamics. http://www.phys.uu.nl/%7Ewwwimau/research/ice_climate/iasc_wag/ |
|
ICES |
M |
International Council for the Exploration of the Sea |
Coordinates and promotes marine research (e.g., climate, fisheries, and marine ecosystems) in the North Atlantic, including the Baltic Sea and North Sea |
1901 |
|
|
IGOS |
MD |
Integrated Global Observing Strategy |
Links research, long-term monitoring and operational programs, and data producers and users to determine observation gaps and to identify needed resources |
1998 |
|
|
INCHR |
HD |
International Network for Circumpolar Health Research |
Conducts, sponsors, and promotes research programs and projects investigating the patterns, determinants, and impact of health conditions among circumpolar peoples and the strategies for improving their health |
|
|
Acronym |
Domainb |
Acronym Definition |
What Is Measured/Products/Key Variables? |
Inception |
More Information/URL |
|
IOC |
M |
Intergovernmental Oceanographic Commission |
Coordinates GOOS by developing, promoting, and facilitating international oceanographic research programmes, by providing technical assistance relating to the systematic observations of the global ocean and its coastal zone, and by ensuring efficient handling and availability of ocean data |
1960 |
|
|
IPY IPO |
MD |
IPY International Program Office |
Provides support to the ICSU-WMO joint IPY committee for IPY’s central planning, coordination, and oversight |
2004 |
|
|
ISAC |
MD |
International Study of Arctic Change |
Aims to internationalize SEARCH for arctic climate change studies |
Planned |
The Science overview document (SOD) was completed in 2005. http://www.aosb.org/ISAC_SOD_Jan05.pdf |
|
MOSJ |
MD |
Miljøovervåking Svalbard og Jan Mayen |
Collects information from thematic monitoring programs, provides online quality assured data with metadata and interpretations, assess the state of the environment, gives recommendations for environmental management, and coordinates local environment monitoring |
|
|
|
SEARCH |
MD |
Study of Environmental Arctic Change |
Aims to understand the nature, extent, and future development of the system-scale change presently seen in the Arctic |
Planned |
This activity will identify key variables. http://www.arcus.org/search/resources/reportsandscienceplans.php |
|
WMO |
A, F, M |
World Meteorological Organization |
Facilitates free and unrestricted exchange of data and information, products, and services that are related to safety and security, economic welfare and environmental protection |
1950 |
WMO is a Specialized Agency of the United Nations. http://www.wmo.ch/index-en.html |
|
NOTE: These bodies coordinate and manage communication and cooperation among various mixes of regional or disciplinary networks or observatories to maintain consistency in observational methods, data management, report preparation, or asset sharing. Branches of a coordinating body share either a common research interest or specific resources and may not necessarily have a center for operations. aA dash (—) means not applicable. bA = atmosphere, Co = coastal, Cr = cryosphere, F = freshwater, HD = human dimensions, M = marine, SP = space physics, T = terrestrial. |
|||||
ANNEX TABLE 3A.6 Examples of Programs
|
Acronym |
Domaina |
Acronym Definition |
What Is Measured/Products/Key Variables? |
Inception |
More Information/URL |
|
Arctic-CHAMP |
F, T |
Arctic Community-wide Hydrological Analysis and Monitoring Program |
Natural variability, changes, stocks, and fluxes within the arctic hydrologic cycle and the direct impacts of variability and its feedbacks on biological and biogeochemical systems, the Earth system, and human society |
2000 |
|
|
ASOF |
M |
Arctic/Subarctic Ocean Fluxes |
Fluxes of heat, salt, and mass through subarctic seas and their variability, forcing, and effects |
1999 |
ASOF is a subprogram of International SEARCH. http://asof.npolar.no/ |
|
CASES |
Cr, M |
Canadian Arctic Shelf Exchange Study |
Ice growth, decay and transport, photosynthetic production, impacts of increased UV radiation on biological productivity, particulate matter and carbon fluxes, contaminant distribution, impacts of ice habitat reduction, and variations in ice cover |
2001 |
|
|
F-MAP |
M |
Future of Marine Animal Populations |
Census of marine life |
2002 |
|
|
GEOSS |
MD |
Global Earth Observation System of Systems |
Will seek advances in nine societal benefit areas: disasters, health, energy, climate, water, weather, ecosystems, agriculture, and biodiversity |
2003 |
|
|
GCTE |
T |
Global Change and Terrestrial Ecosystems |
Effects of changes in climate, atmospheric composition, and land use on terrestrial ecosystems, including agriculture, forestry, soils, and biodiversity, and how these effects lead to feedbacks to the atmosphere and the physical climate system |
1986 |
Core Project of the International Geosphere-Biosphere Programme (IGBP); http://www.gcte.org/ |
|
H-MAP |
M |
History of Marine Animal Populations |
Census of marine life |
2004 |
|
|
iAOOS |
A, Cr, M |
integrated Arctic Ocean Observing System |
Will predict the loss of perennial sea ice and the associated effects and controlling forces |
Planned for 2007-2008 |
IPY proposed programs can be explored at http://www.ipy.org/development/eoi/ |
|
IGBP |
M |
International Geosphere Biosphere Programme |
Develops international frameworks for collaborative research, forms research networks, promotes standardized methodologies, guides construction of global databases, undertakes model intercomparisons and comparisons with data, and facilitates patterns of resource allocation |
1986 |
|
|
IPY |
MD |
International Polar Year |
Large-scale environmental change assessments, observational network design, and human environmental dynamics research |
Planned for 2007-2008 |
Accepts Expressions of Intent (EoI) proposals from an international audience of scientists with the goal of fostering international collaboration. http://www.ipy.org/ |
|
Acronym |
Domaina |
Acronym Definition |
What Is Measured/Products/Key Variables? |
Inception |
More Information/URL |
|
JWACS |
M |
Joint Western Arctic Climate Study |
Physical, biochemical, and paleoceanography studies at the shelf-slope area from the Northwind Ridge to Banks Island |
2002 |
http://www.martechpolar.com/JWACS%202004/JWACS%202004%20Index.htm |
|
LAII |
A, Cr, T |
Land-Atmosphere-Ice Interactions |
Interactions between land, atmosphere, and ice in the Arctic |
1993 |
|
|
PARCA |
T |
Program for Regional Climate Assessment |
Climate (AWS), ice thickness, ice motion, and mass balance |
1991 |
Metadata available at NSIDC; http://cires.colorado.edu/science/pro/parca/ |
|
SBI |
M |
Western Arctic Shelf-Basin Interactions Project |
Physical and biological shelf and slope processes that influence the structure and functioning of the Arctic Ocean |
1999 |
|
|
SHEBA |
A, Cr, M |
Surface Heat Budget of the Arctic Ocean |
Surface heat budget of the Arctic Ocean |
1995-2002 (completed) |
|
|
SOOP |
M |
Ship of Opportunity Programme |
Fulfills upper ocean data requirements which have been established by GOOS and GCOS (e.g., TSG, XCTD, CTD, ADCP, pCO2, phytoplankton concentration) |
1999 |
|
|
WCRP-COPES |
MD |
World Climate Research Programme-Coordinated Observation and Prediction of the Earth System |
Will facilitate the prediction of climate system variability and change by building on existing and future WCRP projects |
Planned for 2005–2015 |
|
|
NOTE: This table includes goal-oriented programs that aim to advance arctic observations. The focus of these programs ranges from discipline-specific to multidisciplinary. A program is a cluster of projects or operations intended to meet clearly identified goals. Programs typically have criteria for participation and a defined course of action. Programs may either be narrowly focused or widely interdisciplinary, and either continuous or discontinuous in duration (e.g., operational programs or science programs, respectively). Projects within most programs are generally supported by the same funding agency. Only major programs active within the last 10 years and planned in the near future have been listed. Although certain satellite platforms, such as EOS Terra and Aqua, may fall under this definition of programs, satellite-based resources are included in a separate table (Annex Table 3A.3). aA = atmosphere, Co = coastal, Cr = cryosphere, F = freshwater, HD = human dimensions, M = marine, SP = space physics, T = terrestrial. |
|||||
ANNEX 3B
EXAMPLES OF MAJOR GLOBAL AND REGIONAL NETWORKS OF SIGNIFICANCE TO THE ARCTIC
ANNEX TABLE 3B.1 GCOS NETWORK
|
Network Name/URL |
Global Climate Observing System (GCOS) (http://www.wmo.ch/web/gcos/gcoshome.html). |
|
Existing or planned? |
Existing, with proposed enhancements. It does not gather data itself. Instead, it relies on other global networks for data. Existing atmospheric networks include GCOS Surface Network (GSN), atmospheric component of the composite surface observation system, including sea level pressure, GCOS Upper-Air Network (GUAN), Global Atmospheric Watch (GAW), global CO2 network, MSU-like radiance satellite observations, total solar irradiance and Earth radiation budget satellite observations. |
|
Foci |
Climate-related observations and information. The proposed system will “characterize the state of the climate system and its variability; monitor the forcing of climate; support the prediction and attribution of climate change; enable the characterization of extreme events.” |
|
Customers |
United Nations Framework Convention on Climate Change (UNFCCC) and intergovernmental organizations. |
|
Realm |
All realms: relies on surface and upper air networks for atmosphere; Global Ocean Observing System (GOOS) for ocean observations; and Global Terrestrial Observing System (GTOS) for terrestrial observations. |
|
Coverage |
Global. |
|
Spatial Density |
Depends strongly on variable; satellite measurements can have resolutions of ~10 km, while rawinsonde measurements are much more widely spaced (plans call for establishment of a high-quality reference network of about 30 precision rawinsonde stations distributed globally). |
|
Variables |
Atmospheric, oceanic, terrestrial. Atmospheric variables that are considered “essential climate variables” include surface variables (air temperature, precipitation, pressure, surface radiation budget, wind, and water vapor), upper-air variables (temperature, including MSU radiances, wind, water vapor, cloud properties, and Earth radiation budget, including solar irradiance), and composition variables (CO2, CH4, ozone, long-lived greenhouse gases, and aerosol properties). |
|
Duration of Record |
Started in 1992. However, measurements of some variables at some locations extend back farther in time. |
|
Frequency of sampling observations (in time) |
Varies by variable: essentially continuous for surface measurements at automated stations; 12-hourly for upper air (rawinsondes); less frequent for composition measurements. |
|
Time Scale of the phenomenon the network means to observe |
Seasonal to interannual and decadal variability. |
|
Accessibility of data |
GCOS Implementation Plan states: “International standards and procedures for the storage and exchange of meta-data need to be developed and implemented for many climate observing system components, including those of the operational satellite community.” GCOS Implementation Plan calls for the establishment of International Data Centers because “The flow of data to the user community and to International Data Centers is not adequate for many essential climate variables.” |
|
Data Management & Archiving Approach |
Global Observing Systems Information Center (GOSIC) is to provide portals for data from all participating networks and programs; not yet implemented (see preceding entry). Data management varies widely by system component and variable. A network for the archival of standard atmospheric measurements is in place, but generally not for oceanic and terrestrial variables. |
|
Compatibility & Integratability with sources of similar data outside network |
Intended, but has not yet been implemented/achieved. |
|
Staff |
The permanent staff dedicated to GCOS, based at their project office at World Meteorological Organization (WMO) Secretariat in Geneva, Switzerland, consists of a director and a secretary. The chair of the scientific committee donates a substantial portion of time to GCOS matters. |
|
Funding Sources |
The budget of the GCOS secretariat is about $100,000 per year. Co-sponsored by the WMO, the Intergovernmental Oceanographic Commission (IOC) of UNESCO, the United Nations Environment Programme (UNEP) and the International Council for Science (ICSU). |
|
Comments |
Participant in IGOS: Integrated Global Observing Strategy. |
ANNEX TABLE 3B.2 GOOS NETWORK
|
Network Name/URL |
Global Ocean Observing System (GOOS) (http://ioc.unesco.org/goos/). |
|
Existing or Planned? |
Component measurement systems exist to varying extents, but need augmentation. The Implementation Plan states: “Parties need to provide global coverage of the surface network by implementing and sustaining (a) the Global Sea Level Observing System (GLOSS) baseline network of tide gauges, (b) an enhanced drifting buoy array, (c) an enhanced (tropical) moored buoy array, (d) an enhanced Voluntary Observing Ships Climatology (VOSClim) network, and (e) a globally-distributed reference mooring network.” “Parties need to provide global coverage of the sub-surface network by implementing and sustaining (a) the Argo profiling float array, (b) the systematic sampling of the global ocean full-depth water column, (c) the Ship-of-Opportunity Expendable Bathythermograph (XBT) trans-oceanic sections, and (d) reference mooring networks.” Essential ocean satellite system activities include (a) sustained support for vector-wind (scatterometer), sea ice, sea surface temperature, and ocean-color measurements, and (b) continuous coverage from altimeters to provide high-precision and high-resolution sea-level measurements. The Implementation Plan states “The surface ocean network depends critically on the continuity of satellite observations, most of which are in research rather than operational status...” |
|
Foci |
Monitor ocean conditions including physics, chemistry, and living resources; operational monitoring and prediction of ocean conditions and ocean hazard warnings. Main foci include the Open Ocean Panel for Climate (OOPC), the Coastal Ocean Observations Panel (COOP), and a number of GOOS regional alliances. An arctic regional alliance has been proposed and may be implemented during the IPY. |
|
Customers |
IPCC (through GCOS), intergovernmental agencies, national agencies, a wide spectrum of individual users including the offshore and marine transport industry, coastal development insurance and management, and the ocean and climate research community. |
|
Realm |
Ocean and sea ice component of cryosphere. |
|
Coverage |
Global, but large gaps (see “existing/planned” entries above). |
|
Spatial Density |
Varies widely. Satellite measurements have resolutions of 10-100 km, while moorings are widely spaced and XBTs are highly irregular in time. |
|
Variables |
“Essential Climate Variables” for the ocean. The OOPC classifies these as surface variables (sea surface temperature, surface salinity, sea level, sea state, sea ice, current, ocean color for biological activity, and CO2 partial pressure) and subsurface variables (temperature, salinity, current, nutrients, carbon, ocean tracers, and phytoplankton). Coastal variables, from the COOP, are less well sampled and more regionally heterogeneous. |
|
Duration of Record |
Since 1991/1992; enhancements of system are ongoing. |
|
Frequency of sampling observations (in time) |
Highly variable—several times daily for some satellite-measured quantities and every several years for ship-based measurements. |
|
Time Scale of the phenomenon the network means to observe |
Seasonal to interannual and decadal for most variables; moorings and satellite observations can provide information on higher-frequency (e.g., eddy) variations, including sea state (waves). |
|
Accessibility of data |
Components of the GOOS that report in real time have data available via Joint WMO-IOC Technical Commission for Oceanography and Marine Meteorology in situ Observing Platform Support Centre JCOMMops (http://www.jcommops.org). Increased data availability and transparency is an issue of increasing importance as more satellite products enter the operational phase. |
|
Data Management & Archiving Approach |
Distributed. |
|
Compatibility & Integratability with sources of similar data outside network |
Addressed on a platform-specific basis. |
|
Staff |
Project office at UNESCO-IOC headquarters in Paris has a dedicated staff of approximately 10 people. |
|
Funding Sources |
Project office in Paris has an annual budget on the order of $300,000 per year, provided by IOC, WMO, UNEP, ICSU, Food and Agricultural Organization (FAO) (UN), National Oceanic and Atmospheric Administration (NOAA) (USA), Natural Environment Research Council (NERC) (UK). |
|
Gaps |
Major gaps exist in the Southern Ocean and Arctic, where most products (except sea ice) are in the development phase. |
|
Comments |
Participant in IGOS: Integrated Global Observing Strategy; Provides the ocean observations component for GCOS and the marine coastal component of GTOS; part of IGOS, which is the U.S. contribution to GOOS; and the Alaska Ocean Observing System (AOOS) is the U.S. arctic contribution to Integrated Ocean Observing System (IOOS). The regional coastal ocean observing systems that are part of IOOS (such as AOOS) are also supposed to be part of Coastal GOOS (C-GOOS. |
ANNEX TABLE 3B.3 GTOS NETWORK
|
Network Name/URL |
Global Terrestrial Observing System (GTOS) (http://www.fao.org/gtos/). |
|
Existing or Planned? |
Existing in rudimentary form; “The climate observing system in the Terrestrial Domain remains the least well-developed component of the global system” (GCOS Implementation Plan). |
|
Foci |
Detect environmental change; provide for sustainable development. |
|
Customers |
Researchers, policy makers. |
|
Realm |
Terrestrial. |
|
Coverage |
Global. |
|
Spatial Density |
Varies widely. Satellite products are global at potentially 1-10 km resolution, while in-situ measurements are much more widely spaced, especially in areas of permafrost, ice sheets, and glaciers. |
|
Variables |
“Essential Climate Variables” listed in the GCOS Implementation Plan include: river discharge, ground water, ground water extraction rates and usage, lake levels, snow extent and duration, snow depth, glacier/ice cap inventory and mass balance, glacier length, ice sheet mass balance and extent, permafrost extent, soil temperature profiles and active layer thickness, albedo, land cover, above-ground biomass, photosyntheticly active radiation (PAR), leaf area index (LAI), and fire disturbance (burnt area, date and location of active fire, burn efficiency). Priority terrestrial satellite products include: daily global albedo, LAI and fraction of absorbed photosynthetically active radiation (FAPAR) products, snow cover (both hemispheres), digital elevation maps of ice sheet surfaces, full glacier inventory from current spaceborne cryosphere missions, and land-cover characterization datasets. |
|
Duration of Record |
Began nominally in 1996, but the system is still in the early phases of development. |
|
Frequency of sampling observations (in time) |
Varies widely. Satellite products are global at potentially 1-10 km resolution, while in-situ measurements are much more widely spaced, especially in areas of permafrost, ice sheets, and glaciers. |
|
Time Scale of the phenomenon the network means to observe |
Varies widely. Satellite measurements can be several times daily, in situ measurements can be essentially continuous for some measurements (e.g., recording thermistors, stream flow rates), but infrequent for observations requiring human intervention. |
|
Accessibility of data |
Free access, but some data holders may charge for access. |
|
Data Management & Archiving Approach |
The Terrestrial Ecosystems Monitoring Sites database is an international directory of sites (called T.Sites) and networks that carry out long-term terrestrial monitoring and research activities. The database is maintained and facilitated by GTOS; however GTOS is not the owner of the data. There is a GTOS Data and Information Management Plan. |
|
Compatibility & Integratability with sources of similar data outside network |
GTOS Implementation Plan: “Parties are urged to develop a global network of at least 30 reference sites (collocated with atmospheric sites if possible) to monitor key biomes.” |
|
Staff |
The main office with a staff of five is hosted by FAO in Rome. |
|
Funding Sources |
Project office budget on the order of $300,000 per year, provided by FAO, WMO, UNEP, UNESCO, and ICSU. |
|
Gaps |
Present coverage of the permafrost measurement network is highly irregular spatially; many satellite products are still in an algorithm-development phase. |
|
Comments |
Participant in IGOS: Integrated Global Observing Strategy. |
ANNEX TABLE 3B.4 SEARCH DMO
|
Network Name |
Study of Environmental Arctic Change (SEARCH) Distributed Marine Observatories (DMO). |
|
Existing or Planned? |
Planned but with 30 percent in place. |
|
Foci |
Track, understand, and respond to decadal-scale (3-100 yrs), pan-arctic change. |
|
Customers |
Science community and society. |
|
Realm |
Ocean. |
|
Coverage |
Pan-arctic. |
|
Spatial Density |
On the order of 200 km except where denser sampling is required to resolve major features, e.g., boundary currents. |
|
Variables |
In-situ standard physical and biological measurements plus remote sensing. |
|
Duration of Record |
Since 2002 in some cases. |
|
Frequency of sampling observations (in time) |
Approximately hourly (e.g., time series) to annual (e.g., repeat surveys). |
|
Time Scale of the phenomenon the network means to observe |
Decadal. |
|
Accessibility of data |
Freely accessible. |
|
Data Management & Archiving Approach |
Compatible as possible. |
|
Compatibility & Integratability with sources of similar data outside network |
Distributed at present but more central data management is planned. |
|
Staff |
No significant dedicated staff at present. |
|
Funding Sources |
National Science Foundation (NSF), NOAA, National Aeronautics and Space Administration (NASA). |
|
Gaps |
About 70 percent of the moorings and automated drifting stations are not established. A similar percentage of the repeat sections are not being repeated on a regular basis. Biological sampling from the automated drifting and moored platforms is just beginning as new sensors become available. |
ANNEX TABLE 3B.5 SEARCH DQU
|
Network Name |
SEARCH Detecting and Quantifying Unaami (DQU). |
|
Existing or Planned? |
Planned but with many elements in place. |
|
Foci |
Track, understand, and respond to decadal-scale (3-100 yrs), pan-Arctic change. |
|
Customers |
Science community and society. |
|
Realm |
Paleo: terrestrial, marine, and atmospheric. |
|
Coverage |
Pan-arctic. |
|
Spatial Density |
100s of proxy paleo sites and sites with historical records. |
|
Variables |
Historical physical records plus paleo (e.g., lake and marine sediments, ice cores, tree rings). |
|
Duration of Record |
— |
|
Frequency of sampling observations (in time) |
N/A. |
|
Time Scale of the phenomenon the network means to observe |
Decadal. |
|
Accessibility of data |
Freely accessible. |
|
Data Management & Archiving Approach |
As compatible as possible. Proxy issues are critical. |
|
Compatibility & Integratability with sources of similar data outside network |
Distributed at present but more central data management is planned. |
|
Staff |
No dedicated staff at present. |
|
Funding Sources |
NSF, NOAA, NASA. |
|
Gaps |
— |
ANNEX TABLE 3B.6 SEARCH DTO
|
Network Name |
SEARCH Distributed Terrestrial Observatories (DTO). |
|
Existing or Planned? |
Planned but with many elements in place. |
|
Foci |
Track, understand, and respond to decadal-scale (3-100 yrs), pan-arctic change. |
|
Customers |
Science community and society. |
|
Realm |
Terrestrial. |
|
Coverage |
Pan-arctic. |
|
Spatial Density |
On the order of 6 Intensive Sites in representative regions (tundra, taiga forest, etc.) around the Arctic plus larger numbers of Intermediate Sites, and Extensive Sites. |
|
Variables |
Intensive Sites: complete set of physical and ecological measurements. Intermediate Sites: range of physical and ecological measurements. Extensive Sites: sites with specialized measurements (e.g., borehole temperatures, river gauging stations). Remote Sensing: for surface properties (e.g., snow cover, NDVI). |
|
Duration of Record |
Since 2002 in some cases. |
|
Frequency of sampling observations (in time) |
Approximately hourly (e.g., time series) to annual (e.g., repeat surveys). |
|
Time Scale of the phenomenon the network means to observe |
Decadal. |
|
Accessibility of data |
Freely accessible. |
|
Data Management & Archiving Approach |
As compatible as possible. |
|
Compatibility & Integratability with sources of similar data outside network |
Distributed at present but more central data management is planned. |
|
Staff |
No significant dedicated staff at present. |
|
Funding Sources |
NSF, NOAA, NASA. |
|
Gaps |
Of the Intensive Sites, the Abisko site is likely the closest to the right combination of colocated intensive physical and ecological observations. The Bonanza Creek-Toolik Lake-Barrow triumvirate is ripe to form an Intensive Site or Sites. Svalbard is also close to this status. Resolute and Cherski probably need considerable work. Thus, with respect to the Intensive Sites, coverage is approximately half complete. Also, some Intermediate Sites such as Eureka and Zackenberg might easily be upgraded to Intensive. A key element remaining is standardization of key measurements. Intermediate and Extensive Sites need further development in size, and a better job needs done to bring their information together, as the Circumarctic Environmental Observatories Network (CEON) is doing. A disciplinary gap in the SEARCH Implementation Strategy is glacier mass balance. There is evidence that glacier mass balance is undergoing significant decadal change, and station, such as Summit will need to be included in the DTO observation set. |
ANNEX TABLE 3B.7 SEARCH LAO
|
Network Name |
SEARCH Large-scale Atmospheric Observatories (LAO). |
|
Existing or Planned? |
Planned but with many elements in place. |
|
Foci |
Track, understand, and respond to decadal-scale (3-100 yrs), pan-arctic change. |
|
Customers |
Science community and society. |
|
Realm |
Atmospheric. |
|
Coverage |
Pan-arctic. |
|
Spatial Density |
On the order of 6 shore-based major observatories around the Arctic, observations at DMO and DTO sites, and remote sensing. |
|
Variables |
Complete set of atmospheric measurements extending from the surface to the top of the atmosphere. |
|
Duration of Record |
Since 2002 in some cases. |
|
Frequency of sampling observations (in time) |
Approximately hourly (e.g., time series) to annual (e.g., repeat surveys). |
|
Time Scale of the phenomenon the network means to observe |
Decadal. |
|
Accessibility of data |
Freely accessible. |
|
Data Management & Archiving Approach |
As compatible as possible. |
|
Compatibility & Integratability with sources of similar data outside network |
Distributed at present but more central data management is planned. |
|
Staff |
No significant dedicated staff at present. |
|
Funding Sources |
NSF, NOAA, NASA. |
|
Gaps |
One of the major atmospheric observatories is in place at Barrow and arguably Abisko and Svalbard have the required capability. Efforts are under way to upgrade to such a station at Eureka, Nunavut, Canada (rather than at Alert as suggested in the Implementation Strategy). There is also work at an early stage to develop the station at Tiksi in Russia. The less intensive sites shared with DMO and DTO have corresponding gaps in coverage (i.e., probably about 70 percent). |
ANNEX TABLE 3B.8 SEARCH SEI
|
Network Name |
SEARCH Social and Economic Interactions (SEI). |
|
Existing or Planned? |
Planned but with some in place. |
|
Foci |
Track, understand, and respond to decadal-scale (3-100 yrs), pan-arctic change. |
|
Customers |
Science community and society. |
|
Realm |
Social/human dimension. |
|
Coverage |
Pan-arctic. |
|
Spatial Density, Duration of Record, Sampling Frequency |
N/A. |
|
Variables |
Records of harvests, erosion and flooding, resource use, transportation, commercial fishing, livelihood strategies, and quality of life. |
|
Time Scale of the phenomenon the network means to observe |
Decadal. |
|
Accessibility of data |
Freely accessible. A goal is to establish Community/Industry Data Networks. |
|
Data Management & Archiving Approach |
As compatible as possible. |
|
Compatibility & Integratability with sources of similar data outside network |
Distributed at present but more central data management is planned. |
|
Staff |
No significant dedicated staff at present. |
|
Funding Sources |
NSF, NOAA, NASA. |
|
Gaps |
Uncertain at this time. |
ANNEX TABLE 3B.9 SCANNET
|
Network Name |
Scandinavian/North European Network of Terrestrial Field Bases (SCANNET). |
|
Existing or Planned? |
Existing. |
|
Foci |
Understanding many aspects of the natural environment. |
|
Customers |
Researchers, local authorities, national weather canters, etc. |
|
Realm |
Terrestrial, atmosphere, hydrosphere, cryosphere. |
|
Coverage |
Western north Atlantic, including Greenland (west, southeast, and northeast), Svalbard, Finland (subarctic sites), Sweden (subarctic site), Norway (alpine), Scotland (alpine), Faroe Islands, and Iceland. |
|
Spatial Density |
Differs according to location and variable. Often there is a major site and sample plots within the vicinity (10s of meters to kilometers). |
|
Variables |
Several thousand across the network including meteorological, ecological, atmospheric, contaminants. |
|
Duration of Record |
The network started in 2000 and persists. The earliest monitoring started in 1904. |
|
Frequency of sampling observations (in time) |
Differs according to variable from continuous to annual. |
|
Time Scale of the phenomenon the network means to observe |
Continuous to decadal according to variable. |
|
Accessibility of data |
A meta-database is on the SCANNET Web site with links to data owners. Some data are freely available on the Web site or from the owners. Other data have restrictions. |
|
Data Management & Archiving Approach |
Distributed. Few standardized formats exist because of different sites’ histories. |
|
Compatibility & Integratability with sources of similar data outside network |
Differs according to variable but there is usually compatibility with similar data outside the network. |
|
Staff |
The network has a part-time secretary and coordinator. Some network partners have dedicated staff to contribute to making data accessible. All monitoring is handled by staff at the sites that participate in the network but do not get their salaries from the network. |
|
Funding Sources |
The European Union funded the network with a small but important contribution from NSF to link SCANNET to CEON. The monitoring activities are funded from various sources at each site. |
|
Gaps |
There are many gaps, although the geographical coverage is good within its area. Freshwater ecology is missing at many sites. Carbon emissions are not measured routinely at the sites. Parameters of the landscape (e.g., vegetation, albedo, LAI, insect damage, thermokarst) that could be monitored routinely from satellites are poorly represented. Only a small fraction of the biota is monitored at most sites. |
|
Comments |
The success of SCANNET is due to the network’s working nature, in which most of the participating sites had a discrete work package and funding sources. The sites therefore gained resources in addition to providing information. A lesson learned is that it takes resources to participate in networks, even if the input is brief. This need for resources, even if small and token in nature, needs to be considered. |
ANNEX TABLE 3B.10 ArcticNet
|
Network Name |
ArcticNet. |
|
Existing or Planned? |
Existing. Funded for 2003 to 2010. |
|
Foci |
Measurement and monitoring of environmental change in the Canadian Coastal Arctic. |
|
Customers |
Governments at the federal, provincial, and territorial level, northern peoples, science and policy makers, international policy and science. |
|
Realm |
Marine, sea ice, atmospheric, ecological, terrestrial, human dimensions, and most importantly the interconnections of the coastal marine system. |
|
Coverage |
Canadian Coastal Arctic and marine waters. |
|
Spatial Density |
Variable. Sampling typically in the km range and upwards. |
|
Variables |
All aspects of the physical and biological systems operating within the study region from the bottom of the ocean to the top of the atmosphere; many social-related issues which pertain to environmental change in the Arctic. |
|
Duration of Record |
With North Water Polynya (NOW) and Canadian Arctic Shelf Exchange Study (CASES) projects, the record for many observations goes back to the early 1990s. The Integrated Regional Impact Studies (IRISs) of ArcticNet will operate for a maximum of 14 years (2003-2017). |
|
Frequency of sampling observations (in time) |
15-minute averages through to annual and interdecadal. |
|
Time Scale of the phenomenon the network means to observe |
Contemporary observations coupled to traditional knowledge studies of Inuit to paleoclimate investigations spanning the last millennium. |
|
Accessibility of data |
All data will be inventoried in the Canadian Cryospheric Information Network (CCIN) housed at the University of Waterloo. Data will be proprietary for use by student and network investigators for a period of two years after which they become public domain. This is negotiable in terms of the AON under mutually agreeable terms. |
|
Data Management & Archiving Approach |
ArcticNet will archive data within the CCIN using standardized metadata forms and is fully compatible with other database clearing houses such as National Snow and Ice Data Center (NSIDC). |
|
Compatibility & Integratability with sources of similar data outside network |
ArcticNet produces a wide range of data types. Automated ‘observatories’ are now located in various places within the ArcticNet sampling domain. These numerical data are typical of automated observatories. The ship cruises aboard the Amundsen collect similar types of data including standardized physical variables spanning a wide range of ocean-sea ice-atmosphere process relationships. Traditional knowledge data are also being collected as are social, economic, and health survey information; these variables are more diverse in form and interoperability. |
|
Staff |
ArcticNet has over 100 network investigators and several hundred students, technicians, community volunteers, and associates. |
|
Funding Sources |
ArcticNet has core funding of $45 million over the first cycle of operations (7 years). This funding levers another $150 million in contributed funding from various partners for things such as equipment, instrumentation, access to the Amundsen, staff, field program, etc. |
|
Gaps |
ArcticNet does not deal with northern terrestrial ecosystem issues unless they can be considered coastal. All of theme 2 deals with coastal terrestrial processes with a particular bias on freshwater in these terrestrial areas. There is only limited paleoenvironmental work within the Network. Gaps in data management exist for traditional knowledge information. |
|
Comments |
Details are available in the full ArcticNet proposal, in annual reports to ArcticNet, and from the ArcticNet Web site (http://www.arcticnet.ulaval.ca). |
ANNEX TABLE 3B.11 GEOSS (Global Earth Observation System of Systems)
|
Network Name |
GEOSS (Global Earth Observation System of Systems). |
|
Existing or Planned? |
Planned. The Earth Observation Summit on July 31, 2003 was the official launch date for the GEOSS concept. The original group was co-chaired by the U.S., the European Commission, Japan, and South Africa. The final plan was presented at the Earth Observation Summit III in February 2005. In the U.S. over the past few decades, federal agencies have been working with local, state, national, and international partners to strengthen cooperation in Earth observations. Building on this previous work, the U.S. Interagency Working Group on Earth Observations considered the management, planning, and resource allocation strategy for a U.S. Integrated Earth Observing System—the U.S. contribution to GEOSS. The outcome of this is the U.S. framework for participating in GEOSS. The U.S. framework will be built on new and existing Earth observation systems and capabilities, and will be developed to meet both national and international societal, scientific, and economic imperatives. |
|
Foci |
GEOSS is a planned observational system of systems that is to be implemented over a 10-year period by developed and developing nations. The focus of GEOSS is to unify data collection networks on a global basis to develop a comprehensive, coordinated, and sustained Earth observation network that will produce and better manage information about the environment. Emphases are on enhancing data collection capacity, improved data dissemination, coordination of existing data sources, greater interoperability and connectivity among individual component observing systems, and filling gaps. The 10-year implementation plan was approved by representatives of 61 nations at a meeting in Brussels in February 2005. Ultimately, GEOSS will help countries to identify and address global environmental and economic challenges—such as climate change and natural disasters - by creating a single, comprehensive, and sustained Earth observation system. |
|
Customers |
Stakeholders are defined on a broad basis to include nearly everyone using or benefiting from Earth observation data systems. For decision makers, there is a specific focus on transferring data to developing countries. |
|
Realm |
All earth science data, including in situ data, such as data collected from gauges, sensors, buoys, weather stations, airborne and satellite systems monitoring. |
|
Coverage |
Global. Earth surface, atmosphere, and ocean processes on a global basis. |
|
Spatial Density |
Varied. |
|
Variables |
The goals set for this system were developed during the First Earth Observation Summit (Washington, DC, July, 2003) and the subsequent activities of the ad-hoc Group on Earth Observations, which originated from needs identified for better coordination of earth observational activities discussed at the World Summit on Sustainable Development (Johannesburg, September, 2002) and the G8 Evian meeting (June, 2003). Building on efforts from existing international programs, GEOSS will seek advances initially in nine societal benefit areas: disasters, health, energy, climate, water, weather, ecosystems, agriculture, and biodiversity. Specifically, these advances will (1) improve weather forecasting, (2) reduce loss of life and property from disasters, (3) protect and monitor our ocean resource, (4) understand, assess, predict, mitigate and adapt to climate variability and change, (5) support sustainable agriculture and forestry and combat land degradation, (6) understand the effect of environmental factors on human health and well-being, (7) develop the capacity to make ecological forecasts, (8) protect and monitor water resources, and (9) monitor and manage energy resources. |
|
Duration of Record, Sampling Frequency, Time Scale, Staff |
— |
|
Compatibility & Integratability/Accessibility/Data Management Approach |
GEOSS will consist of existing and future Earth observation systems across the processing cycle from primary observation to information production. The Earth observation systems that participate in GEOSS will retain their existing mandates and governance arrangements. Through GEOSS, they will share observations and products with the system as a whole and take steps to ensure that shared observations and products are accessible, comparable, and understandable, by supporting common standards and adaptation to user needs. GEOSS will abide by interface standards for the data systems that are shared so that the products are more compatible with those from other systems and of use to a wide community. In meeting its needs, it will work towards maintenance of data requirements, data description, and exchange standards. Data will be interfaced through interoperability specifications established by open and international standards and adhered to by all contributing systems. Clearly defined formats will be set for both data and metadata, and quality indications to enable search and retrieval. GEOSS will not attempt to incorporate all Earth observing systems into a single, centrally controlled system. Instead, its intent is to improve the data supply to users. It will not try to annex existing observation and data distribution systems into a new international organization. Access to data and information will be accomplished through various service interfaces to be designed. The actual mechanisms may include many varieties of communication modes, with a primary emphasis on the Internet, but ranging from very low technology approaches to highly specialized technologies. Side note: The U.S. Integrated Earth Observation System will provide full and open access to all data in accordance with the Office of Management and Budget (OMB) Circular A-130 (and at little cost). |
|
Funding Sources |
An ad hoc working group led by the U.S., European Commission, Japan, and South Africa spearheaded this system. In the United States, the Environmental Protection Agency (EPA) is playing a lead role with NOAA and other agencies participating in the United States Interagency Working Group on Earth Observations (http://iwgeo.ssc.nasa.gov/). A secretariat for GEOSS has been established at the WMO in Geneva. As a contribution to GEOSS, NOAA announced in January, 2005 that it will spend $37.5 million over the next two years deploying 32 advanced sensor buoys in the Pacific and Indian oceans for early warming of potentially catastrophic ocean events. The United Nations also plans to spend about 10 percent of its tsunami aid donations on warning systems. |
|
Gaps |
— |
|
Comments |
Membership in Group on Earth Observations (GEO) is open to all member states of the United Nations. GEO also welcomes as Participating Organizations intergovernmental, international, and regional organizations with a mandate in Earth observation or related activities, subject to approval by Members. A list of the current participating members can be found at (http://earthobservations.org). |
ANNEX TABLE 3B.12 AMAP
|
Network Name/URL |
Arctic Monitoring and Assessment Programme (AMAP) (http://www.amap.no/). |
|
Existing or Planned? |
Existing. |
|
Foci |
Monitoring and assessment activities: temporal and spatial trend studies focusing on priority contaminant issues and climate/ultraviolet (UV)/ozone issues, monitoring of human health and biological effects, the collection of information on contaminant types and sources, and the assessment of the combined effects of climate and contaminants. |
|
Customers |
Science community and society. AMAP reports to and is directed by the Arctic Council, an intergovernmental, Ministerial forum with membership that includes the eight Arctic rim countries, indigenous peoples organizations, observing countries, and observing organizations. It is founded in the programs and organizations that were established as part of the Arctic Environmental Protection Strategy (AEPS). |
|
Realm |
Atmosphere, marine, terrestrial/freshwater, biological, social/human dimension. |
|
Coverage |
Pan-arctic. |
|
Spatial Density |
Within the AMAP-defined Arctic, 10 “key areas” have been identified: (1) Northern Alaska/North Slope, (2) lower Mackenzie River and Delta, (3) Canadian Arctic Islands and Arctic Archipelago, (4) Baffin Island and West Greenland, (5) Svalbard and East Greenland, (6) Kola Peninsula and Northern Fennoscandia, (7) Novaya Zemlya, Kara, and Pechora Seas, and Mouth of Pechora River, (8) Taymir Peninsula/Norilsk, (9) Mouth of Lena River, and (10) Chukotsky Peninsula. These are the target areas for integrated, multicompartmental monitoring efforts. Other areas are covered, but normally with less intense activity. |
|
Variables |
Persistent organic pollutants (POPs), heavy metals (e.g., mercury, cadmium, and lead), radioactivity, acidification and arctic haze, petroleum-based hydrocarbons, environmental consequences and biological effects resulting from climate change, stratospheric ozone depletion and biological and human health effects due to increased UV, human health effects due to pollution and climate change, and combined effects of pollutants and other stressors on ecosystems. |
|
Duration of Record |
Since AMAP’s establishment in 1991, a series of assessments has been produced that draws on (1) data already published in scientific literature, (2) data obtained from AMAP’s monitoring program, and (3) traditional knowledge. Although most observations are recent (i.e., within the last 30 years), some parts of the assessments (e.g., assessment of long-term trends) use observations dating back to the early 1900s, and environmental archives that extend back even further. |
|
Frequency of sampling observations (in time) |
Differs according to variable and assessment project. |
|
Time Scale of the phenomenon the network means to observe |
Decadal (but with many observations based on daily to annual sampling, therefore, it also covers seasonal phenomena, etc.). |
|
Accessibility of data |
As much as possible, data are compiled within AMAP Thematic Data Centers (TDCs) from which they are made available to scientists engaged in AMAP assessments under strict conditions that protect the rights of data originators. |
|
Data Management & Archiving Approach |
Most data are either archived or planned to be archived at one of the AMAP TDCs (atmospheric contaminants data at the Norwegian Institute for Air Research (NILU), marine contaminants data at the International Council for the Exploration of the Sea (ICES), freshwater and terrestrial contaminants data at the University of Alaska, Fairbanks (UAF) - UAF Syncon Database, radioactivity data at the Norwegian Radiation Protection Authority (NRPA), and human health data at the AMAP Secretariat). One of the main objectives of this data handling strategy is to ensure long-term access to data that contribute to the AMAP assessments. |
|
Compatibility & Integratability with sources of similar data outside network |
AMAP TDCs provide a means to ensure that data are treated in a consistent manner and undergo uniform statistical analysis, etc., including application of objective quality assurance procedures. |
|
Staff |
The AMAP Secretariat (comprising the Executive Secretary and Administrative Assistant) is located in Oslo, Norway; two Deputy Executive Secretaries work remotely from Rotterdam, Netherlands and Moscow, Russia. |
|
Funding Sources |
The AMAP Secretariat is funded by Norway, with additional support from several of the Arctic countries and organizations such as the Nordic Council of Ministers. These sources also provide most of the funding for core AMAP activities such as production of assessments and operation of TDCs, etc. AMAP monitoring work is based largely on ongoing national and international monitoring and research programs; a part of the Arctic countries national programs are identified as their AMAP ‘national implementation plan.’ |
|
Gaps |
Other Arctic Council groups (see below) address a number of work areas that are therefore not covered by AMAP (sustainable development, biodiversity, etc.); however, there is a degree of overlap with most groups (in particular concerning assessment of issues such as climate change, etc.) and mechanisms are in place to coordinate activities within the respective groups. Geographical gaps in monitoring coverage exist, in particular in parts of the territories of the Russian Federation and the central Arctic Ocean where financial and logistical problems impose obvious constraints, however AMAP is continually working to try to overcome these limitations. |
|
Comments |
AMAP is one of five Working Groups of the Arctic Council. The four others include The Sustainable Development Working Group (SDWG), Protection of the Arctic Marine Environment (PAME), Conservation of Arctic Flora and Fauna (CAFF), and Emergency, Prevention, Preparedness and Response (EPPR). |
ANNEX TABLE 3B.13 Earth Observing System (EOS) Terra and Aqua
|
Network Name/URL |
Earth Observing System (EOS) Terra (EOS AM) and Aqua (EOS PM) (http://eospso.gsfc.nasa.gov/ http://terra.nasa.gov/index.php, http://aqua.nasa.gov/index.php). |
|
Existing or Planned? |
Existing. The Terra platform was launched December 18, 1999 and Aqua was launched May 4, 2002. |
|
Foci |
Terra’s mission is to improve understanding of the movements of carbon and energy throughout the Earth’s climate system. Aqua’s mission is to collect observations related to the Earth’s water cycle and other elements of the Earth’s climate system. Aqua was the first member launched of a group of satellites termed the Afternoon Constellation, or sometimes the A-Train. The second member to be launched was Aura, in July 2004, and the third member was PARASOL, in December 2004. Upcoming are CloudSat and CALIPSO in 2006 and OCO in the more distant future. Once completed, the A-Train will be led by OCO, followed by Aqua, then CloudSat, CALIPSO, PARASOL, and, in the rear, Aura. |
|
Customers |
Scientists, educators, general public, and policy makers. |
|
Realm |
Atmosphere, ocean, terrestrial, and cryosphere. |
|
Coverage |
Global. |
|
Spatial Density |
Variable, spatial resolution varies from 15 m to 57 km. Except in the very near vicinity of the poles (a few degrees latitude), the spatial density of the data collection is greatest in the polar regions. Coverage from some instruments in the polar regions is limited however, such as observations of carbon monoxide and methane. Furthermore, accuracy of some of the derived data products, such as sea surface temperature measurements, which are complicated by the presence of sea ice, or surface albedo, remain inadequate for many climate studies. |
|
Variables |
Terra collects data on land, ocean and air temperature, land and ocean reflectivity (albedo), radiative fluxes, atmospheric water vapor, aerosols, CO and CH4, precipitation, clouds, soil moisture, surface elevation, vegetation cover on land (including NDVI, LAI, FPAR [fraction of photosynthetically active radiation], net photosynthesis), phytoplankton and dissolved organic matters in the ocean, snow and ice extent. Aqua collects data related to the Earth’s hydrological cycle, including evaporation from the oceans, water vapor in the atmosphere, clouds, precipitation, soil moisture, sea ice, land ice, and snow cover on the land and seasonal ice. Additional variables also being measured by Aqua include snow water equivalent, snow and ice extent, radiative energy fluxes, aerosols, vegetation cover on the land (including NDVI, LAI, FPAR, net photosynthesis), phytoplankton and dissolved organic matter in the oceans, and air, land, and water temperatures, and surface reflectance. |
|
Duration of Record |
Since December 18, 1999 for Terra and May 4, 2002 for Aqua. |
|
Frequency of sampling observations (in time) |
Dependent upon instrument. For example, the MODIS instrument sees the entire surface of the Earth every 1-2 days (the poles more frequently than the equator), MISR sees the entire Earth every 9 days, with repeat coverage between 2 and 9 days depending on latitude, whereas ASTER will take 5 years to see the entire surface. |
|
Time Scale of the phenomenon the network means to observe |
Seasonal to interannual and decadal for most variables. |
|
Accessibility of data |
Accessible through several NASA Distributive Active Archive Centers (DAAC), such as the National Snow and Ice Data Center (NSIDC) DAAC, Langley DAAC, Land Processes DAAC, Goddard Earth Sciences DAAC. |
|
Data Management & Archiving Approach |
Distributed. The EOS Data and Information System (EOSDIS) provides the total ground system for processing, archiving, and distributing science and engineering data from all the EOS spacecraft. However, the data are held at four different DAACs. Data are stored in standardized formats. |
|
Compatibility & Integratability with sources of similar data outside network |
Addressed on a platform specific basis. |
|
Staff |
Operated by staff at the DAACs. |
|
Funding Sources |
NASA. |
|
Gaps |
Carbon monoxide and methane measurements are only available from 65°S to 65°N. Aerosol measurements are not accurate over snow- and ice-covered surfaces. No rainfall or precipitation is measured in the polar regions. No daily snow and ice albedo products exist. No information is collected below the surface such as in the oceans, including temperature under sea ice. Accuracy of vegetation indices such as NDVI, LAI, and FPAR degrade when snow covers the vegetation. Gaps also exist in the near vicinity of the pole. |
|
Comments |
There is a lack of hemispheric-wide grids of variables. For example, if a user wants to look at surface temperature in the Arctic over oceans and land, they must order the SST product from the ocean group, the land surface temperature from the land group, and the sea ice surface temperature product from the cryosphere group. In addition, using data from multiple sensors for improved products still has not been done. Many improved data products as well as value-added products could be generated from the wealth of data acquired by the EOS platforms. |
ANNEX 3C
EXAMPLES OF DATA CAPTURE AND ACCESSIBILITY WITHIN NETWORKS AND PLATFORMS: TEMPERATURE AND CRYOSPHERIC VARIABLES
The Committee selected two foci—temperature and the cryosphere—to illustrate the variety of measurement approaches and data accessibility for the Arctic. These two parameters are used here for illustrative purposes only and are not meant to be a comprehensive review of all the methods available in accessing these data. These parameters were chosen because they are critical variables for detecting change in the Arctic (Chapter 2).
Temperature
Temperature is a key variable that is monitored in its own right and also as a driving variable of processes that are the focal points of various networks and platforms. Temperature measurements are therefore either explicitly represented in environmental monitoring databases, or are less visible among data that underpin the primary target of the network, for example, active layer dynamics. Temperature is measured and derived in many ways, including by direct measurements, remotely located sensors, proxies, and local and traditional knowledge.
Direct measurements are made routinely (Earth surface, soil, cryosphere, ocean) and during campaigns (atmosphere, ocean, land surface, soil). A range of standardized (e.g., IABP, ITEX—see Annex Table 3C.1) and individualistic measurements are made throughout the Arctic, although weather stations that measure temperature are being discontinued—particularly in the Russian Arctic. Accessibility of data is varied: data from campaigns or short-term projects are numerous but generally difficult to access, even in summarized, published form, as they are often “hidden” in publications and reports where they provide background to or support the primary aims of the study. Networks that monitor temperatures of lakes, ponds, and rivers were not found. Soil temperatures from the ground surface down to 3.6 m have been routinely measured at the Russian meteorological stations and available from the local and centralized data archives. However, the Committee did not assess the quality of these and this could be different for different stations. Also, the number of such stations in the Arctic declined substantially in recent years and access to these data has become more difficult. The technology for direct measurements of temperature is advanced and cheap (for example, battery operated, self-networking electronic equipment), and it is generally lack of organization, networking, or funding that are the main constraints on more comprehensive data capture and archiving.
Data derived from remotely located sensors are becoming increasingly important as weather stations decrease in numbers and geographical coverage. For example, the Advanced Very High Resolution Radiometer Polar Pathfinder Product provides twice daily 5-km gridded skin temperature observations from July 1981 through December 2000. Spatial coverage extends from 48.4 degrees to 90 degrees north latitude. There are also some gridded observations available at 1.25 km from August 1993 through December 1998. Users can also get observations for other years at whatever grid resolution they want through a National Snow and Ice Data Center Web interface tool. Surface temperature is also available from the Moderate Resolution Imaging Spectroradiometer (MODIS). The data collection began with the Terra satellite platform in December 1999 and continues today with both Terra and Aqua. There are a number of MODIS temperature products that must be accessed through different MODIS teams. These products include temperature over sea ice, land surface, and sea surface.
Proxy temperature records can be obtained from several sources. These records are usually used to provide descriptions of past environments but could be used more extensively to provide better geographical coverage of recent past environments. Ice and lake core records provide proxy temperatures for many thousands of years with varied resolution, but can be annual. Tree-ring data provide proxies for temperatures for the last 7,500 years with annual resolution for the subarctic of Finland and Sweden. Diatoms, chironomids, pollen, and macrofossils provide temperature proxies for at least the last 10,000 years. The resolution of these proxies varies, but can be annual. Each proxy, particularly the biological proxies, has individual biases in the relationship between a measured variable (e.g., growth) and derived temperature. For example, tree rings correlate better with temperature in areas with greater soil moisture than in drier, continental areas.
The Arctic possesses a particularly rich archive of temperature proxies. However, much of this archive is threatened by climatic warming and drainage of peatlands, and a concerted effort is needed to preserve cores from disappearing archives.
Local and traditional knowledge on weather exists throughout the Arctic, presumably because of its importance in determining the abundance and behavior of natural biological resources and the possibilities and timing for travel. Although uncertainties are difficult to assess, important knowledge about the climate and environment exists. In terms of temperature, local and traditional knowledge provide important observations in time and space. For example, elders have knowledge about past temperature trends based on direct observations or changes in activities. An example is elder Barnabus Peryouar from Baker Lake, Nunavut, who has said that kerosene used to freeze during the winter in the early 1940s (Fox, 2002). This kind of knowledge can provide a proxy for past temperatures.
Cryosphere
The cryosphere is represented by many variables that respond to changes in drivers such as temperature. The major domains are sea ice, lake and river ice, glaciers and ice caps, and terrestrial and marine permafrost.7
Sea ice. Measurements include thickness, extent, concentration, velocity, duration, timing of formation and thaw, and albedo. Apart from thickness, most of these variables are derived from satellite images. Thickness is derived from both upward (submarine-based) and downward (satellite-based) radar. Historical records for some areas such as harbors and sounds are often available from local sources and local traditional knowledge.
Lake and river ice. Major measurements include thickness, extent, duration, timing of formation and thaw, and date of ice-dam collapse. Geographical coverage is variable and often extremely localized to individual lakes and rivers: the Committee could not find specific networks of monitoring activities. Records sometimes extend back over 100 years although much older data exist for some rivers and lakes. For example Magnuson et al. (2000) demonstrated that the freeze date of the Mackenzie River, Canada has moved forwards 6 days per 100 years, while lakes in Finland show earlier breakup from 8-9 days per 100 years over the past 160 years.
Glaciers and ice caps. The main variables measured are extent, thickness, velocity, and mass balance. In some areas, systematic scientific monitoring (e.g., for mass balance) has been in progress for about 50 years (e.g., at Storglaciären in northern Sweden). However, data from old photographs, paintings, and drawings that have been available locally for at least 200 years, and the dating of moraines by various techniques, extend information on glacier dynamics even further back in time. Recently, remote sensing has provided a plethora of relevant data, such as ice extent, velocity, and elevation. International coordinating efforts exist or are planned to monitor and assess mass balance and glacier dynamics, such as MAGICS (Mass balance of Arctic Glaciers and Ice sheets in relation to Climate and Sea level changes) (see Table 3C.2) and the proposed GLACIODYN program.
Terrestrial and marine permafrost. The monitoring of permafrost distribution and dynamics, mostly on land, is well-coordinated within the International Permafrost Association (IPA). Measurements and observations include mapping various categories of permafrost (continuous, discontinuous, sporadic), measuring temperatures of permafrost in bore holes (Thermal State of Permafrost [TSP] network), and measuring the depth of the active layer above the permafrost (the Circumpolar Active Layer Monitoring [CALM] network). No systematic monitoring of permafrost under continental shelves has been identified, although this would be important in connection with the possible future destabilization of methane hydrates. Relevant data are probably possessed by oil companies, but are not readily accessible. Data for terrestrial permafrost are available on the IPA Web site and they are periodically assessed. The main limitation in such an assessment for the Russian Arctic stems from the lack of regularity in temperature measurements in most of the Russian permafrost boreholes.
ANNEX TABLE 3C.1 Examples of Temperature Networks and Platforms
|
Network/Platform |
Acronym Definitiona |
Geographical Coverage |
Temporal Coverage |
Sensor Type |
Sensor Location |
Data Availability |
Web Site |
|
|
Period |
Frequency |
|||||||
|
Abisko (Platform) |
|
Torneträsk catchment (100 km2); main meteorological station + periodic measurements at satellite locations throughout the catchment |
1913 - present |
10 minutes - 12 hours |
Automatic station, standard manual station, and thermohygrograph |
2 m above surface |
Available on request, some available on the Web site |
|
|
5 days |
Mercury thermometers |
5-150 cm below ground surface |
||||||
|
CEON (Network) |
Circumarctic Environmental Observatories Network |
Pan-arctic, comprised of partnered networks and observatory platforms |
Real time |
Mostly real time |
WMO climate stations |
Mostly 2 m above ground surface |
Link to real time weather on Web site, no database |
|
|
GSN (Network); Operated by WMOb members |
GCOS (Global Climate Observing System) Surface Network |
Pan-arctic |
1997 - present |
Real time |
Meteorological surface reporting stations |
2 m above surface |
Available through the US National Climatic Data Center |
http://www.wmo.int/web/www/Earthwatch/wmo-gcos-fsn-guan.html |
|
GUAN (Network); through US NCDC’s CARDS;c part of WMO’s 800 radiosonde stations |
GCOS Upper Air Network |
About 10 platforms in the Arctic (terrestrial) that have long records and are good representatives for radiosonde measurements |
Various (starting 1950-1990) |
12 hours |
Thermometers on radiosondes |
In troposphere up to 5 hPa |
Available on the CARDS Web site |
|
|
IABP (Network); part of the WMO World Weather Watch Programme |
International Arctic Buoy Programme |
Arctic Ocean; 25 buoys |
1979 - present |
12 minutes |
Thermometers on drifting buoys |
Surface air and ocean water |
Available on IABP Web site and through National Snow and Ice Data Center (NSIDC) |
|
|
IPA/CALM (Network) |
International Permafrost Association/Circumpolar Active Layer Monitoring |
Pan-arctic; more than 100 platforms |
Various (starting 1990 and forward) |
Hourly |
Thermistors on dataloggers |
Permanently installed devices in bore holes and frost and thaw tubes |
Summaries for many of the CALM sites are available through the NSIDC |
|
|
Network/Platform |
Acronym Definitiona |
Geographical Coverage |
Temporal Coverage |
Sensor Type |
Sensor Location |
Data Availability |
Web Site |
|
|
Period |
Frequency |
|||||||
|
ITEX (Network) |
The International Tundra Experiment |
Pan-arctic; 28 platforms |
Various (starting 1991 and forward) |
Hourly-daily |
Automatic station, standard manual station, and thermohygrograph |
2 m above surface and down to 0.5 m below ground surface |
Summaries in published papers |
|
|
SCANNET (Network) |
Scandinavian/North European network of terrestrial field bases |
North Atlantic region (Finland to Iceland; Scotland to Svalbard) |
Various (starting 1913 to 2000) |
Hourly-daily |
Standard automatic and manual stations |
2 m above ground and 0-11.3 m below ground surface |
Available on request; some available on the Web site |
|
|
aA dash (—) means not applicable. bWorld Meteorological Organization (WMO). cComprehensive Aerological Reference Data Set (CARDS). |
||||||||
ANNEX TABLE 3C.2 Examples of Networks and Programs for Cryospheric Parameters
|
Network/Program |
Acronym Definition |
Geographical Coverage |
Temporal Coverage |
Main Variables |
Sensor Type |
Sensor Location |
Data Availability |
Web Site |
|
|
Period |
Frequencya |
||||||||
|
GLIMS |
Global Land Ice Measurements from Space |
Global |
1999-present |
Annually |
Ice margins and surface feature velocities |
Radiometers measuring visible, near infrared, and shortwave radiation |
Radarsat, Landsat 7, and EOS Terra |
Satellite images and processed maps can be found at the Web site |
|
|
IABP (Network); part of the World Weather Watch Programme (WMO) |
International Arctic Buoy Programme |
Arctic Ocean; 25 buoys |
1979-present |
— |
Sea ice growth/melt, ice temperature, and ice motion |
Anemometers, pressure sensors, pressure transducers, and thermistors |
Surface air and ocean water |
Available on IABP Web site and through the NSIDC |
|
|
IASC WAG; includes the MAGICS projectb |
International Arctic Science Committee Working Group on Arctic Glaciology |
Pan-arctic; 28 glaciers and ice caps |
Various (starting in 1950) |
Biannually |
Glacier mass balance |
Ablation stakes, snow pits, photography, optical and microwave satellite sensors, and gauging stations |
Glacier surface, glacial runoff waters, aircrafts, and satellites |
Summaries available on Web site |
www.phys.uu.nl/~wwwimau/research/ice_climate/iasc_wag/home.html |
|
IPA/CALM (Network) |
International Permafrost Association/Circumpolar Active Layer Monitoring |
Pan-arctic; more than 100 platforms |
Various (starting in 1990) |
Annually |
Active layer, and permafrost temperature |
Frost or thaw tubes, small diameter metal rods, and dataloggers |
Permanently installed devices in bore holes and frost and thaw tubes |
Summaries for many of the CALM sites are available through the National Snow and Ice Data Center |
|
|
WGMS |
World Glacier Monitoring Service |
Global |
Various (starting in 1894) |
— |
Glacier mass balance, extent, and perennial surface ice distribution |
Ablation stakes, snow pits, photography, optical and microwave satellite sensors |
Glacier surface, aircraft, satellites |
Available through the World Glacier Inventory (WGI) at the NSIDC |
|
|
aA dash (—) means undetermined. bMass balance of Arctic Glaciers and Ice sheets in relation to Climate and Sea level changes (MAGICS). |
|||||||||


