
2
Measuring Content Using Input-Output Tables
MEASURING THE EXTENT TO WHICH the United States is integrated with the global economy through imports and exports is conceptually straightforward when finished goods are exchanged for finished goods, but measurement is more difficult when imported intermediate inputs and raw materials are used to produce final goods that are later exported. Figure 2-1 illustrates the case in which Country 1 produces an intermediate good and exports it to the United States, where it is combined with two intermediate domestic goods along with capital and labor to produce a final good or a further processed good. Figure 2-2 illustrates the case in which the United States produces an intermediate good and exports it to Country 1 for further processing and it is then exported back to the United States as a final good. In both cases, the intermediate good flows back and forth across the border, the second time as part of the finished item.
Currently, the United States records the gross value of exports and makes no adjustment for the fact that some part of the value of exports may have been produced in a foreign country. Likewise, the country currently records the gross value of imports and makes no adjustment for the fact that some of those imports include parts made in the United States. The request to the committee to consider the “content” question in effect is calling for a new way to do the accounting, in which a portion of U.S. exports is attributed to foreign production and a portion of U.S. imports is attributed to U.S. production.
The U.S. national income accounts routinely deal with the double
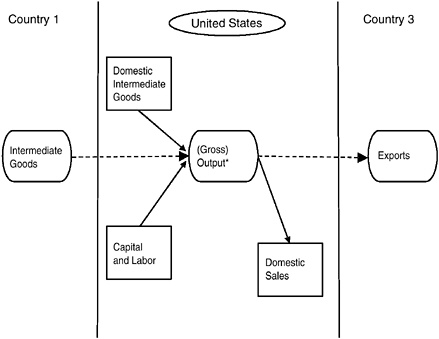
FIGURE 2-1 Illustration of imported intermediate goods as part of U.S. exports.
* Final good or further processed good.
SOURCE: Adapted from Hummels, Ishii, and Yi (2001).
counting of domestic output that internal supply chains might create by using a strictly value-added approach. For example, the contribution of the U.S. auto sector to gross domestic product (GDP) is counted as value added, exclusive of the value of the steel and plastics that are made by other domestic sectors. Current accounting for trade does not use a value-added approach to the measurement of exports and imports.
To understand how the accounting is currently done and how it might be done more accurately, consider an example in which $1,000 of parts are made in the United States and then shipped to Mexico for assembly before returning to the United States as $1,500 of final goods. There are two ways this sequence of transactions might be recorded. Current accounting methods would record U.S. exports as $1,000 and U.S. imports as $1,500, with a trade deficit of $500. The $1,000 contribution to GDP from this transaction would then be recorded as sales to consumers ($1,500) plus exports ($1,000) minus imports ($1,500), that is, $1,000 of value added. An alter-
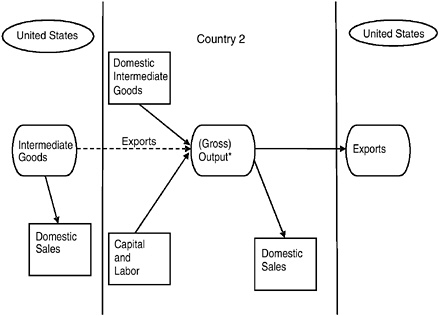
FIGURE 2-2 Illustration of exported U.S. intermediate goods that are subsequently imported back to the United States as a part of final goods.
* Final good or further processed good.
SOURCE: Adapted from Hummels, Ishii, and Yi (2001).
native external accounting would remove the “revolving door trade” by recording no exports and only $500 of imports.
Both accounting systems yield the same number for GDP and for net exports. The difference is in the volume of trade. The traditional accounting approach gives the impression that the United States is trading exports for imports, while the more accurate accounting approach shows the $500 payment for the assembly services provided by Mexico, with no offsetting export payment.
These two accounting systems have very different implications for determining the U.S. terms of trade. In the traditional approach, this transaction affects both the import price and the export price. The price is the amount of money for which goods and services are bought and sold. The price of parts is included in the export price index with a value weight of $1,000, and the price of finished goods is included in the import price index with a value weight of $1,500. This seems to show that the United States is exchanging parts for finished goods. The more accurate alternative approach records a value-added import price equal to the price of finished goods minus the price of parts times the value share of parts in final output.
Another example illustrates accounting for the foreign content of U.S. exports. Suppose that $1,000 of parts are made in Mexico, shipped to the United States for assembly, and then exported to third countries as $1,500 of final goods. Current accounting methods would record U.S. exports as $1,500 and U.S. imports as $1,000, with a trade surplus of $500 and GDP of $500. An alternative external accounting would remove the revolving door trade by eliminating the $1,000 foreign content of U.S. exports and by reducing imports by a like amount. As above, both accounting systems yield the same numbers for GDP and for net exports. The difference is in the volume of trade. The traditional accounting gives the impression that the United States is trading exports for imports, while the more accurate accounting indicates that the $500 in exports has no offsetting import amount.
In these simple examples of the foreign content of U.S. exports and the U.S. content of U.S. imports, no one currently directly keeps track of supply chains inside and outside the United States and these simple adjustments to exports and imports cannot be done.
ESTIMATING THE IMPORTS EMBODIED IN EXPORTS
One of the committee’s central tasks was to determine if there are ways to measure the foreign content of U.S. exports. For example, in the agricultural sector, we were asked to seek an answer to the question: How much of the $19.6 billion of exports of agricultural goods in 1998 reflects value-added originating on U.S. farms and other sectors of the U.S. economy versus value-added originating in other countries—such as imports of cattle feed from Canada that help to grow cattle for export to Mexico?
The task for this study asks whether one can directly measure the U.S. content of imports and the foreign content of exports. The example of trying to measure the value of exported cattle due to the cattle having consumed foreign feed shows easily the difficulty with this kind of direct measurement in one particular instance. Also, for the information to be complete one would have to know not only how much feed of foreign origin the cattle consumed, but also if any of that feed happened to contain product from another country or countries.
It is clear, therefore, that at the point of export, there is no way by inspection of cattle to determine how much of the feed the cattle consumed was imported from Canada or other countries. In order to obtain a measurement of the foreign content of U.S. agricultural and other exports, one would need to find a way to trace imports through the economy and
ultimately to the point of export or to final domestic usage. An alternative to tracing every detail of the supply chain from imports to exports would be to “tag” imports, electronically or chemically, so that the imported value added would be evident when the export is inspected at the point of exit. Clearly tracking exports and imports on this scale would be an impractical task.
What might be possible would be for the federal government to carry out a series of case studies on particular items of significant interest or of importance, for instance, to national security. One could imagine the government requesting, for instance, an aircraft manufacturer to report on the country of origin of all the inputs into a commercial aircraft. However, even in this case, accurate data would require foreign-owned offshore companies to report any inputs to these parts that originated in third countries. The complexity of such measurements increases significantly quite quickly.
CONCLUSION: It is impractical to directly measure the foreign content of U.S. exports and the U.S. content of imports to the United States.
An alternative to these rather fanciful ideas about how to measure directly the foreign content of U.S. exports is to use U.S. input-output tables to form a proxy measurement.1 The following content analysis has been developed by the committee having examined the reported analysis by Hummels, Ishii, and Yi (2001).2
Using a Use Table
A U.S. 1998 “use table” is reproduced in Table 2-1 (Parts A and B).3 Each column of this table records the purchases of commodities by a sector of the economy. Thus, agricultural businesses purchased $69 billion of ag-
|
1 |
The Industry Economics Division (IED) of BEA prepares input-output accounts. For more information, see BEA’s Industry Economic Accounts Information Guide, available: http://www.bea.gov/bea/dn2/iedguide.htm#IO [accessed January 2006]. |
|
2 |
For information on firm-level import and export data for the United States, see Bernard, Jensen, and Schott (2005). |
|
3 |
In illustrating the calculations reported herein, the committee chose to use a 1998 data set—a decision that also facilitated comparison with content measurements reported elsewhere for a similar time period (discussed below). |
ricultural products, $368 million of minerals, and so on. The data in the table rows indicate that agricultural businesses sold $69 billion to other farmers, $78 million to miners, and so on. The Bureau of Economic Analysis (BEA) also produces a “make table” with rows corresponding to industries and columns to commodities. A make table indicates the commodities produced by each industry.
The direct requirements matrix in Table 2-2 is found by multiplying the normalized make matrix times the normalized use matrix. The data in this table represent the intermediate input fraction of the value of total output for each sector (column). This table should be read by column.
The destination shares matrix reported in Table 2-3 is found by dividing each row of the use matrix by the value of output. This represents the fraction of total output that is shipped to each sector. This table should be read by row.
These data tables can be used to answer the content question though there are several very restrictive assumptions necessary to do so.
Step One: Make an Input-Output Table with Import Rows
An input-output table has no rows for imported inputs as distinct from U.S. output. Therefore, the table does not reveal how much of those $23 billion of imports of agricultural goods and how much of other imports were used as intermediate inputs and how those intermediate imports were allocated across sectors. The first step is to create a use matrix like Table 2-1 that includes rows that represent imported intermediate goods. This is done by dividing the total intermediate inputs reported in Table 2-1 into domestic and imported inputs.
One can create the import rows for the input-output matrix using the destination matrix (Table 2-3) with an assumption of input similarity. That is:
Assumption 1–Import Similarity: Within the product categories of the input-output table, the mixes of imports and U.S.-made goods are the same and therefore have the same destinations.
Applying this assumption, Table 2-3 shows that if 51.6 percent of the gross output of agriculture is shipped to manufacturing for further processing, then 51.6 percent of agricultural imports are also shipped to manufacturing. Similarly, if 38.2 percent of the gross output of the minerals sector
TABLE 2-1 The Use of Commodities by Industries, 1998 (in millions of dollars) Part A: Industries
|
Commodities |
Industriesa |
|||
|
Agriculture |
Mining |
Construction |
Manufacturing |
|
|
Agricultural products |
68,682 |
78 |
5,860 |
144,622 |
|
Minerals |
368 |
31,478 |
7,368 |
81,722 |
|
Construction |
3,369 |
4,693 |
895 |
28,756 |
|
Manufactured products |
49,395 |
14,510 |
299,429 |
1,380,590 |
|
Transportation, communication, and utilities |
12,625 |
12,652 |
24,847 |
179,922 |
|
Trade |
13,948 |
3,498 |
81,671 |
230,668 |
|
Finance, insurance, and real estate |
20,647 |
33,253 |
16,485 |
71,167 |
|
Services |
8,998 |
5,851 |
103,708 |
240,141 |
|
Other |
166 |
29 |
1,076 |
13,826 |
|
Noncomparable imports |
64 |
1,872 |
|
22,929 |
|
Total intermediate inputs |
178,262 |
107,913 |
541,338 |
2,394,342 |
|
Value added |
105,028 |
39,826 |
464,841 |
1,559,242 |
|
Total industry output |
283,290 |
147,738 |
1,006,179 |
3,953,584 |
|
aThe input-output (I-O) accounts use two classification systems, one for industries and another for commodities, but both systems generally use the same I-O numbers and titles. |
||||
goes to the transportation, communications and utilities sector, then so does 38.2 percent of the minerals inputs.
With this assumption the destination matrix in Table 2-3 can be used to estimate the imports of intermediate inputs and their allocations across sectors. Returning to the example of the agricultural sector, the input-output table indicates that of a total agricultural output of $281 billion,
|
Transportation, Communication, and Utilities |
Trade |
Finance, Insurance, and Real Estate |
Services |
Otherb |
|
154 |
1,816 |
11,476 |
12,310 |
567 |
|
52,354 |
31 |
6 |
32 |
3,061 |
|
47,369 |
12,694 |
66,515 |
28,785 |
25,895 |
|
70,485 |
68,005 |
19,318 |
340,944 |
17,593 |
|
200,933 |
68,214 |
52,626 |
120,762 |
22,872 |
|
15,081 |
32,685 |
4,925 |
68,036 |
2,646 |
|
40,283 |
108,418 |
445,679 |
243,750 |
7,945 |
|
144,495 |
219,223 |
191,363 |
530,971 |
13,585 |
|
3,306 |
11,226 |
28,196 |
24,713 |
3,034 |
|
21,939 |
7,722 |
8,553 |
5,189 |
1,144 |
|
596,399 |
530,035 |
828,656 |
1,375492 |
98,341 |
|
653,908 |
1,022,277 |
1,718,897 |
2,104,140 |
1,113,367 |
|
1,250,307 |
1,552,311 |
2,547,553 |
3,479,631 |
1,211,707 |
|
b“Other” consists of government enterprises, general government industry, household industry, and the inventory valuation adjustment. SOURCE: Planting and Kuhbach (2001). |
||||
24.5 percent was sold to other farmers (69/281) and 51.6 percent (145/ 281) to manufacturers. Applying the same ratio to $23 billion of total agricultural imports, we estimate $5.7 billion of agricultural intermediate imports sold to farmers and $12.1 billion to manufacturers. Similar calculations for the other sectors lead to the imported inputs by sector of use that are reported in Table 2-4.
TABLE 2-1 The Use of Commodities by Industries, 1998 (in millions of dollars) Part B: Final Uses
|
Commodities |
Total Intermediate Use |
Final Uses (GDP) |
||
|
Personal Consumption Expenditures |
Gross Private Fixed Expenditures |
Changes in Business Inventories |
||
|
Agricultural products |
24,564 |
34,596 |
|
1,236 |
|
Minerals |
176,417 |
105 |
956 |
387 |
|
Construction |
218,971 |
|
577,089 |
|
|
Manufactured products |
2,260,269 |
1,078,057 |
587,174 |
41,694 |
|
Transportation, communication, and utilities |
695,452 |
437,478 |
17,996 |
1,250 |
|
Trade |
453,157 |
873,411 |
112,475 |
5,127 |
|
Finance, insurance, and real estate |
987,627 |
1,369,009 |
51,135 |
|
|
Services |
1,458,335 |
2,010,510 |
166,967 |
25 |
|
Other |
85,574 |
5,119 |
−48,174 |
23,409 |
|
Noncomparable imports |
69,413 |
47,744 |
|
|
|
Total intermediate inputs |
6,650,777 |
|
|
|
|
Value addedd |
|
|||
|
Total industry outputc |
|
5,856,029 |
1,465,618 |
73,127 |
|
cMay not sum to totals due to rounding. dConsists of compensation of employees, indirect business tax and nontax liability, and other value added. “Other value added” consists of the following components of gross domestic income: consumption of fixed capital, net interest, proprietors’ income, corporate profits, rental income of persons, business transfer payments, and subsidies less current surplus of government enterprises. |
||||
The entries in Table 2-4 can be used as the import rows of a new input-output use table. The domestic rows are the same as in Table 2-1, except that imported intermediates are subtracted to reflect the fact that some of the inputs comes from imports. Dividing each column of the resulting matrix by total output produces the input-output requirements matrix reported in Table 2-5. The two parts of this matrix (the domestic part at the
|
Exports of Goods and Services |
Imports of Goods and Services |
Government Consumption Expenditures and Gross Investment |
GDPc |
Total Commodity Outputc |
|
19,563 |
−23,438 |
2,984 |
34,940 |
280,503 |
|
6,961 |
−47,469 |
-180 |
−39,241 |
137,176 |
|
78 |
|
210,040 |
787,208 |
1,006,179 |
|
523,300 |
−828,893 |
210,188 |
1,611,520 |
3,871,789 |
|
70,106 |
−15,367 |
74,784 |
586,248 |
1,281,700 |
|
70,298 |
19,586 |
22,215 |
1,103,110 |
1,556,267 |
|
73,154 |
−9,896 |
37,315 |
1,520,718 |
2,508,344 |
|
38,456 |
−8,322 |
6,745 |
2,214,382 |
3,672,717 |
|
93,720 |
−5,783 |
963,760 |
1,032,052 |
1,117,626 |
|
|
−127,801 |
10,644 |
-69,413 |
|
|
|
|
|
8,781,523 |
|
|
895,637 |
−1,047,382 |
1,538,494 |
|
15,432,301 |
top and the import part at the bottom) add up to the totals reported in Table 2-2.
Step Two: Estimate the Direct Imports Used to Produce Exports
Estimating the inputs used directly to produce exports can then be carried out with the addition of an input-output requirements matrix such
TABLE 2-2 U.S. Input-Output Requirements (in percent)
as shown in Table 2-5. However, another problem arises—the imported input requirements in Table 2-4 are the total inputs used by each sector, including those inputs used to produce consumption and investment goods, as well as exports. To apply the intermediate import fractions in Table 2-5 to exports alone requires another similarity assumption. That is:
Assumption 2–Export Similarity: Within the product categories of the input-output table, the mixes of exports and U.S.-made goods are the same and therefore have the same input requirements.
This assumption means that if it takes 4 cents of manufactured intermediate inputs to produce $1 of agricultural output, it takes the same amount to produce $1 of agricultural exports. Applying this assumption allows one to consider exports as being indistinguishable from production generally. With this assumption the imported intermediate fractions in Table 2-5 can then be used to find the intermediate imports embodied in U.S. exports.
Take the example of the agricultural sector. U.S. agricultural exports totaling $19.6 billion require 2 percent or $0.4 billion of imported agricultural goods. By the same kind of calculation, $523 billion of exports of manufactures require $1.6 billion of agricultural inputs. Adding up the agricultural intermediate imports used in all sectors produces the total of $2,046 million reported in the “Direct Imports” column in Table 2-6. For manufacturing, the fraction was 8.2 percent. Therefore 10.5 percent of the value of agricultural exports is of foreign origin. These calculations can be repeated sector by sector as reported in Table 2-6. Summing over all sectors results in a figure of 5.7 percent for the U.S. export value overall in 1998 that originated from foreign production.
Before moving on to the computation of the foreign content of U.S. exports with these data, it is necessary to make the assumption that the imported inputs do not embody any U.S. content. If they did, only part of the imports embodied in exports would have originated in foreign locations.
Assumption 3–Import Content: The U.S. imports do not embody any U.S. value added.
TABLE 2-3 Destinations of Sales (in percent)
TABLE 2-4 Imports Used to Produce U.S. Output
|
TCU |
Trade |
FIRE |
Services |
Other |
Total Intermediate Outputs |
|
0.1 |
0.6 |
4.1 |
4.4 |
0.2 |
87.5 |
|
38.2 |
0.0 |
0.0 |
0.0 |
2.2 |
128.6 |
|
4.7 |
1.3 |
6.6 |
2.9 |
2.6 |
21.8 |
|
1.8 |
1.8 |
0.5 |
8.8 |
0.5 |
58.4 |
|
15.7 |
5.3 |
4.1 |
9.4 |
1.8 |
54.3 |
|
1.0 |
2.1 |
0.3 |
4.4 |
0.2 |
29.1 |
|
1.6 |
4.3 |
17.8 |
9.7 |
0.3 |
39.4 |
|
3.9 |
6.0 |
5.2 |
14.5 |
0.4 |
39.7 |
|
0.3 |
1.0 |
2.5 |
2.2 |
0.3 |
7.7 |
|
TCU |
Trade |
FIRE |
Services |
Other |
Total Intermediate Inputs |
|
13 |
152 |
959 |
1,029 |
47 |
20,519 |
|
18,117 |
11 |
2 |
11 |
1,059 |
61,048 |
|
0 |
0 |
0 |
0 |
0 |
0 |
|
15,090 |
14,559 |
4,136 |
72,991 |
3,766 |
483,890 |
|
2,409 |
818 |
631 |
1,448 |
274 |
8,338 |
|
190 |
411 |
62 |
856 |
33 |
5,703 |
|
159 |
428 |
1,758 |
962 |
31 |
3,896 |
|
327 |
497 |
434 |
1,203 |
31 |
3,304 |
|
17 |
58 |
146 |
128 |
16 |
443 |
TABLE 2-5 Input-Output Requirements Matrix (in percent)
|
|
Agricultural |
Minerals |
Construction |
Manufacturers |
TCU |
Trade |
FIRE |
Services |
Other |
|
Domestica |
|
||||||||
|
Agricultural products |
22.2 |
0.0 |
0.5 |
3.4 |
0.0 |
0.1 |
0.4 |
0.3 |
0.0 |
|
Minerals |
0.1 |
13.9 |
0.5 |
1.4 |
2.7 |
0.0 |
0.0 |
0.0 |
0.2 |
|
Construction |
1.2 |
3.2 |
0.1 |
0.7 |
3.8 |
0.8 |
2.6 |
0.8 |
2.1 |
|
Manufactured products |
13.7 |
7.7 |
23.4 |
27.4 |
4.4 |
3.4 |
0.6 |
7.7 |
1.1 |
|
TCU |
4.4 |
8.5 |
2.4 |
4.5 |
15.9 |
4.3 |
2.0 |
3.4 |
1.9 |
|
Trade |
4.9 |
2.3 |
8.0 |
5.8 |
1.2 |
2.1 |
0.2 |
1.9 |
0.2 |
|
FIRE |
7.3 |
22.4 |
1.6 |
1.8 |
3.2 |
7.0 |
17.4 |
7.0 |
0.7 |
|
Services |
3.2 |
4.0 |
10.3 |
6.1 |
11.5 |
41.1 |
7.5 |
15.2 |
1.1 |
|
Other |
0.1 |
0.0 |
0.1 |
0.3 |
0.3 |
0.7 |
1.1 |
0.7 |
0.2 |
|
Noncomparable imports |
0.0 |
1.3 |
0.0 |
0.6 |
1.8 |
0.5 |
0.3 |
0.1 |
0.1 |
|
Imported |
|
||||||||
|
Agricultural products |
2.0 |
0.0 |
0.0 |
0.3 |
0.0 |
0.0 |
0.0 |
0.0 |
0.0 |
|
Minerals |
0.0 |
7.4 |
0.3 |
0.7 |
1.4 |
0.0 |
0.0 |
0.0 |
0.1 |
|
Construction |
0.0 |
0.0 |
0.0 |
0.0 |
0.0 |
0.0 |
0.0 |
0.0 |
0.0 |
|
Manufactured products |
3.7 |
2.1 |
6.4 |
7.5 |
1.2 |
0.9 |
0.2 |
2.1 |
0.3 |
|
TCU |
0.1 |
0.1 |
0.0 |
0.1 |
0.2 |
0.1 |
0.0 |
0.0 |
0.0 |
|
Trade |
0.1 |
0.0 |
0.1 |
0.1 |
0.0 |
0.0 |
0.0 |
0.0 |
0.0 |
|
FIRE |
0.0 |
0.1 |
0.0 |
0.0 |
0.0 |
0.0 |
0.1 |
0.0 |
0.0 |
|
Services |
0.0 |
0.0 |
0.0 |
0.0 |
0.0 |
0.0 |
0.0 |
0.0 |
0.0 |
|
Other |
0.0 |
0.0 |
0.0 |
0.0 |
0.0 |
0.0 |
0.0 |
0.0 |
0.0 |
|
aRows are imports. NOTE: TCU = transportation, communications, and utilities; FIRE = finance, insurance, and real estate. |
|||||||||
Step Three: Estimate the Indirect Imports Used to Produce Exports
Yet another assumption and other calculations are needed. Because it takes domestically made intermediate goods as well as imported intermediates to produce exports, the linkages between sectors need to be considered. Those domestically made intermediate goods in turn require intermediate imports. When calculating the foreign content of exports, these “second-stage” imports need to be added to the imports directly embodied in the exports.
To produce those domestically made intermediates may also need other domestically made intermediates, which in turn may require imported inputs. Once again, these “third-stage” imports need to be added to the second- and first-stage imports embodied in exports. And so on and so on. All the stages are added together to get to the direct plus indirect imports embodied in exports.
This is not a description simply of accounting numbers. This is a model of how the economy actually works, with products passed back and forth between sectors. Clearly, to do such an accounting would be completely impractical. Instead, another assumption is required:
Assumption 4–“But-for” Modeling: The input-output requirements table is not merely a set of accounting numbers but also describes how the economy produces value added. Equivalently, one can assume that the economy can be divided into two distinct and wholly separate parts—one that produces exports only and the other that produces goods for domestic final sales—and that these two parts have the same input-output structure.
With this assumption one can estimate the imports needed at each production stage and can compute the direct and indirect imports embodied in exports reported in Table 2-6. The direct plus indirect imports amount to 9.5 percent of total exports, and 13.2 percent of manufactures, about two thirds higher than the direct-only fractions, 5.7 percent overall, and 8.2 percent manufacturing.
Similar results are available from calculations by Hummels, Ishii, and Yi (2001). Table 2-7 shows sector-by-sector data from the 1997 input-output tables that result in an aggregated 12 percent foreign share of U.S. exports. The share for the United States in 1972, by comparison, was 0.059 and, in 1985, it was 0.093. Table 2-8 shows the calculations for other coun-
TABLE 2-6 U.S. Export and Import Value Embodied in Exports, 1998
|
Product |
Total Imports |
Intermediate Imports |
Percent |
Total Exports |
Direct Importsa |
Percent |
Direct Plus Indirect Importsa |
Percent |
|
Agricultural products |
23,438 |
20,519 |
87.5 |
19,563 |
2,046 |
10.5 |
3,738 |
19.1 |
|
Minerals |
47,469 |
61,049 |
128.6 |
6,961 |
5,364 |
77.1 |
9,791 |
140.7 |
|
Construction |
0 |
0 |
0.0 |
78 |
0 |
0.0 |
0 |
0.0 |
|
Manufactured products |
828,893 |
483,890 |
58.4 |
523,300 |
42,725 |
8.2 |
69,307 |
13.2 |
|
TCU |
15,367 |
8,338 |
54.3 |
70,106 |
531 |
0.8 |
975 |
1.4 |
|
Trade |
19,586 |
5,703 |
29.1 |
70,298 |
442 |
0.6 |
742 |
1.1 |
|
FIRE |
9,896 |
3,896 |
39.4 |
73,154 |
141 |
0.2 |
302 |
0.4 |
|
Services |
8,322 |
3,304 |
39.7 |
38,456 |
143 |
0.4 |
284 |
0.7 |
|
Other |
5,783 |
443 |
7.7 |
93,720 |
20 |
0.0 |
37 |
0.0 |
|
Total |
958,754 |
587,143 |
61.2 |
895,636 |
51,411 |
5.7 |
85,175 |
9.5 |
|
aImport value embodied in exports. NOTE: TCU = transportation, communications, and utilities; FIRE = finance, insurance, and real estate. |
||||||||
tries.4 While the data in Table 2-8 are outdated, they remain illustrative of the point that in comparison with the five countries, excluding Japan, the U.S. import share of exports is low.
ACCURACY AND VALIDITY OF THE CONTENT CALCULATIONS
The accuracy of these direct and indirect imports embodied in exports depends on the validity of the similarity assumptions that underlie the calculations. The assumption of similarity of imports and exports with domestic production within the product categories is obviously incorrect if product categories are highly aggregated. After all, the gains from trade come from differences in the mixes of imports, exports, and domestic production.
The results in Table 2-6 are based on a 9-commodity breakdown, but there is also an input/output table with 91 commodities. These more detailed categories allow one to explore the validity and the effect of the similarity assumption for the 9-product analysis. Table 2-9 reports the ratios of imports and exports to total output within manufacturing for the more detailed product categories, sorted by the import column. If the similarity assumptions do apply in manufacturing, the ratios would all be the same up and down the columns: the import-to-output ratio would not depend on the manufacturing subsector, and the export-to-output ratio would not depend on the subsector. The assumptions are rather seriously violated. The import-to-output ratio varies from a low of 1 percent for newspapers and periodicals to a high of 223 percent for footwear. The export-to-output ratio varies from a low of 2 percent for metal containers to a high of 45 percent for aircraft and parts.
These differences in trade ratios across categories reflect two forces that influence trade and that make the similarity assumptions doubtful: (1) low-value-to-weight, time-sensitive products are not shipped long distances, and (2) the United States is more competitive in some sectors (like aircraft) than in others (like apparel and footwear).
TABLE 2-7 Sector-by-Sector Examples of the Foreign Content of U.S. Exports, 1997
|
Industry |
VS (Share of Exports) |
|
Agriculture, hunting, forestry, and fishing |
0.073 |
|
Mining and quarrying |
0.11 |
|
Food products, beverages, and tobacco |
0.074 |
|
Textiles, textile products, leather, and footwear |
0.16 |
|
Wood and products of wood and cork |
0.12 |
|
Pulp, paper, paper products, printing, and publishing |
0.061 |
|
Coke, refined petroleum products, and nuclear fuel |
0.27 |
|
Chemicals, excluding pharmaceuticals |
0.10 |
|
Pharmaceuticals |
0.061 |
|
Rubber and plastics products |
0.088 |
|
Other nonmetallic mineral products |
0.065 |
|
Iron and steel |
0.086 |
|
Nonferrous metals |
0.12 |
|
Fabricated metal products, except machinery and equipment |
0.095 |
|
Machinery and equipment, n.e.c.a |
0.093 |
|
Office, accounting, and computing machinery |
0.25 |
|
Electrical machinery and apparatus, n.e.c.a |
0.099 |
|
Radio, television, and communication equipment |
0.15 |
|
Medical, precision, and optical instruments |
0.086 |
|
Motor vehicles, trailers, and semitrailers |
0.18 |
|
Aircraft and spacecraft |
0.12 |
|
Iron and steel |
0.086 |
|
aNot elsewhere classified. SOURCE: Kei-Mu Yi (personal communication). |
|
TABLE 2-8 Comparison of the Foreign Content Share by Country
|
Country |
VS (Share of Exports) |
|
Canada (1990) |
0.27 |
|
France (1995) |
0.27 |
|
Germany (1995) |
0.22 |
|
Italy (1992) |
0.22 |
|
United Kingdom (1998) |
0.27 |
|
Japan (1997) |
0.11 |
|
SOURCE: Kei-Mu Yi (personal communication). |
|
To explore whether this really matters, the imports embodied in exports can be measured using the 91-product input-output analysis. Results for this 91-product analysis are reported in Table 2-10. In this table, direct imported inputs comprise 6.7 percent of exports, and direct and indirect comprise 10.4 percent, compared with the 5.7 percent and 9.5 percent numbers for the 9-product analysis. In other words, the greater disaggregation of the input-output table results in small increases in the content estimates.
Although 91 is greater than 9, the similarity assumption is surely violated within each and every one of these 91-product categories. For furniture and paper and drugs, for example, the same two forces are going to drive differences in the mixes of imports, exports and U.S. production—high-value-added-to-weight and time-insensitive products are overrepresented in exports and imports compared with domestic production, and the mix of imports and exports reflects comparative advantage.
It seems possible that the similarity assumptions are better satisfied if the data are disaggregated. So a possible conclusion from this analysis would be that there is a need to invest the resources to increase the number of products well beyond the current 91. There are three reasons that the committee did not reach this conclusion. First, the committee does not think there is any policy question or any scientifically interesting question that hinges on the differences in the estimate of the foreign content of U.S. exports between the results from the 9- and 91-product analysis, and we do not think the increase in accuracy in measurement afforded by a finer product categorization would be worth the cost. Second, finer granularity in measurement inevitably comes with greater measurement errors in the input-output matrix, and there is no assurance that more products necessarily improves the estimates of the import content of U.S. exports even though it may increase the appropriateness of the similarity assumption. Third, there is no assurance that the similarity assumptions actually apply with greater accuracy as the product categories are disaggregated.5
Consider now the fourth assumption. It is this last step, the calculation of direct plus indirect import content of exports, that is most troublesome
TABLE 2-9 Manufacturing Ratios of Imports and Exports to Output (in percent)
|
Products |
Import to Output |
Export to Output |
|
Newspapers and periodicals |
1.0 |
2.9 |
|
Paperboard containers and boxes |
1.4 |
3.2 |
|
Tobacco products |
2.2 |
9.6 |
|
Metal containers |
2.5 |
2.0 |
|
Other printing and publishing |
3.2 |
3.5 |
|
Paints and allied products |
4.0 |
6.7 |
|
Heating, plumbing, and fabricated structural metal products |
4.0 |
3.7 |
|
Screw machine products and stampings |
5.4 |
5.1 |
|
Food and kindred products |
6.6 |
5.1 |
|
Cleaning and toilet preparations |
7.3 |
9.1 |
|
Miscellaneous machinery, except electrical |
7.6 |
7.2 |
|
Petroleum refining and related products |
8.5 |
5.5 |
|
Service industry machinery |
10.9 |
13.0 |
|
Plastics and synthetic materials |
12.0 |
18.5 |
|
Miscellaneous textile goods and floor coverings |
12.2 |
9.5 |
|
Broad and narrow fabrics, yarn and thread mills |
12.4 |
8.7 |
|
Stone and clay products |
13.4 |
3.1 |
|
Other transportation equipment |
13.7 |
9.4 |
|
Rubber and miscellaneous plastics products |
14.0 |
7.5 |
|
Lumber and wood products |
14.1 |
4.1 |
|
Paper and allied products, except containers |
14.5 |
9.2 |
|
Agricultural fertilizers and chemicals |
15.4 |
18.8 |
|
Industrial and other chemicals |
16.6 |
17.4 |
|
Aircraft and parts |
17.0 |
45.0 |
|
Primary iron and steel manufacturing |
18.3 |
4.7 |
|
Glass and glass products |
18.5 |
10.1 |
|
Engines and turbines |
19.5 |
33.4 |
|
Scientific and controlling instruments |
19.6 |
23.1 |
|
Farm, construction, and mining machinery |
19.7 |
21.9 |
|
Miscellaneous fabricated textile products |
20.0 |
3.6 |
|
Other fabricated metal products |
21.8 |
11.5 |
|
Furniture and fixtures |
23.3 |
6.0 |
|
Primary nonferrous metals manufacturing |
25.2 |
11.0 |
|
Materials handling machinery and equipment |
26.1 |
15.4 |
|
Truck and bus bodies, trailers, and motor vehicle parts |
26.6 |
20.5 |
|
Metalworking machinery and equipment |
27.1 |
14.6 |
|
Special industry machinery and equipment |
28.4 |
25.8 |
|
Electrical industrial equipment and apparatus |
29.4 |
16.0 |
|
Electronic components and accessories |
30.7 |
30.2 |
|
Household appliances |
34.1 |
13.6 |
|
Products |
Import to Output |
Export to Output |
|
Electric lighting and wiring equipment |
34.5 |
18.5 |
|
General industrial machinery and equipment |
34.7 |
29.4 |
|
Drugs |
37.8 |
11.5 |
|
Motor vehicles (passenger cars and trucks) |
44.5 |
9.1 |
|
Ophthalmic and photographic equipment |
47.4 |
18.2 |
|
Audio, video, and communication equipment |
48.5 |
20.4 |
|
Miscellaneous electrical machinery and supplies |
49.3 |
26.0 |
|
Computer and office equipment |
76.3 |
36.5 |
|
Miscellaneous manufacturing |
77.0 |
11.9 |
|
Apparel |
101.8 |
12.5 |
|
Footwear, leather, and leather products |
223.4 |
22.3 |
and it raises the critical issue: What is the question that we are trying to answer? Consider some possible questions.
First, when one estimates that a certain fraction of U.S. exports originates overseas, is that computation intended to get at answering the question: What would U.S. imports have been if we had not engaged in any exporting? That cannot be a real question, since if the United States did not pay for its imports with exports, and there was a trade balance, then we would have to eliminate all of our imports, including intermediate imports embodied in exports, intermediate imports embodied in domestic production, and imports of final goods.
A second question might be: What would happen to U.S. GDP and U.S. employment, if the United States imposed barriers that prevented the imports of intermediate goods so that the value of our exports would originate 100 percent at home? Having estimated that that roughly 10 percent of export value originates in foreign locations, can the associated fraction of GDP and the corresponding jobs be recaptured by imposing barriers on the imports of intermediate goods? To be specific, consider the low-priced computers that the United States imports from Asia. The federal government could try to force computer production and other intermediate goods production to come back to the United States, but raising the price of intermediate imports with trade barriers would cause a shift to domestic inputs only if imports and domestic inputs are substitutes, and it would impair U.S. competitiveness by raising the cost of products made in the
TABLE 2-10 U.S. Imports, Exports, and Imports Embodied in Exports, 91 by 91 Input/Output Matrix, 1998
|
Product |
Total Imports |
Intermediate Imports |
Percent |
|
Livestock and livestock products |
2,519 |
2,461 |
97.7 |
|
Other agricultural products |
12,089 |
8,875 |
73.4 |
|
Forestry and fishery products |
8,931 |
10,364 |
116.0 |
|
Agricultural, forestry, and fishery service |
9 |
8 |
92.9 |
|
Metallic ores mining |
−1,248 |
−921 |
|
|
Coal mining |
326 |
309 |
94.7 |
|
Crude petroleum and natural gas |
61,648 |
96,294 |
156.2 |
|
Nonmetallic minerals mining |
1,201 |
1,233 |
102.6 |
|
New construction |
0 |
0 |
|
|
Maintenance and repair construction |
0 |
0 |
|
|
Ordnance and accessories |
922 |
7 |
0.8 |
|
Food and kindred products |
32,855 |
12,432 |
37.8 |
|
Tobacco products |
1,155 |
66 |
5.7 |
|
Broad and narrow fabrics, yarn and threads |
5,269 |
5,137 |
97.5 |
|
Miscellaneous textile goods and floor coverings |
2,790 |
1,608 |
57.6 |
|
Apparel |
66,035 |
15,334 |
23.2 |
|
Miscellaneous fabricated textile products |
5,923 |
3,057 |
51.6 |
|
Lumber and wood products |
18,124 |
17,527 |
96.7 |
|
Furniture and fixtures |
16,717 |
3,135 |
18.8 |
|
Paper and allied products, except containers |
17,063 |
14,293 |
83.8 |
|
Paperboard containers and boxes |
600 |
574 |
95.7 |
|
Newspapers and periodicals |
274 |
60 |
22.1 |
|
Other printing and publishing |
3,323 |
2,165 |
65.1 |
|
Industrial and other chemicals |
22,458 |
19,995 |
89.0 |
|
Agricultural fertilizers and chemicals |
3,358 |
2,664 |
79.3 |
|
Plastics and synthetic materials |
8,046 |
7,429 |
92.3 |
|
Drugs |
37,954 |
13,463 |
35.5 |
|
Cleaning and toilet preparations |
3,641 |
687 |
18.9 |
|
Paints and allied products |
743 |
641 |
86.3 |
|
Petroleum refining and related products |
14,581 |
8,194 |
56.2 |
|
Rubber and miscellaneous plastics products |
23,872 |
21,520 |
90.1 |
|
Footwear, leather, and leather products |
18,632 |
9,591 |
51.5 |
|
Glass and glass products |
4,333 |
4,124 |
95.2 |
|
Stone and clay products |
9,762 |
10,108 |
103.5 |
|
Primary iron and steel manufacturing |
17,372 |
19,575 |
112.7 |
|
Primary nonferrous metals manufacturing |
21,491 |
24,142 |
112.3 |
|
Metal containers |
325 |
323 |
99.4 |
|
Total Exports |
Direct Imports |
Percent |
Direct Plus Indirect Imports |
Percent |
|
907 |
112 |
12.4 |
173 |
19.0 |
|
14,581 |
353 |
2.4 |
721 |
4.9 |
|
2,263 |
437 |
19.3 |
849 |
37.5 |
|
38 |
0 |
1.3 |
1 |
2.1 |
|
1,023 |
−92 |
−9.0 |
−266 |
−26.0 |
|
1,396 |
6 |
0.4 |
26 |
1.9 |
|
3,223 |
4,039 |
125.3 |
10,639 |
330.1 |
|
677 |
54 |
7.9 |
117 |
17.3 |
|
0 |
0 |
|
0 |
|
|
69 |
0 |
0.0 |
0 |
0.0 |
|
2,373 |
1 |
0.0 |
1 |
0.0 |
|
25,446 |
339 |
1.3 |
592 |
2.3 |
|
4,943 |
6 |
0.1 |
7 |
0.1 |
|
3,696 |
470 |
12.7 |
688 |
18.6 |
|
2,171 |
122 |
5.6 |
186 |
8.6 |
|
8,085 |
1,596 |
19.7 |
1,701 |
21.0 |
|
1,076 |
237 |
22.0 |
279 |
25.9 |
|
5,224 |
494 |
9.5 |
1,151 |
22.0 |
|
4,283 |
240 |
5.6 |
268 |
6.2 |
|
10,864 |
666 |
6.1 |
1,400 |
12.9 |
|
1,363 |
45 |
3.3 |
71 |
5.2 |
|
768 |
2 |
0.2 |
4 |
0.5 |
|
3,608 |
59 |
1.6 |
154 |
4.3 |
|
23,496 |
2,331 |
9.9 |
4,360 |
18.6 |
|
4,113 |
280 |
6.8 |
471 |
11.4 |
|
12,452 |
711 |
5.7 |
1,404 |
11.3 |
|
11,534 |
463 |
4.0 |
518 |
4.5 |
|
4,528 |
44 |
1.0 |
70 |
1.5 |
|
1,266 |
36 |
2.8 |
60 |
4.7 |
|
9,467 |
564 |
6.0 |
1,021 |
10.8 |
|
12,703 |
1,898 |
14.9 |
2,827 |
22.3 |
|
1,858 |
1,351 |
72.7 |
1,085 |
58.4 |
|
2,375 |
299 |
12.6 |
502 |
21.1 |
|
2,250 |
196 |
8.7 |
454 |
20.2 |
|
4,480 |
2,230 |
49.8 |
4,088 |
91.2 |
|
9,345 |
3,248 |
34.8 |
5,900 |
63.1 |
|
258 |
20 |
7.6 |
32 |
12.3 |
|
Product |
Total Imports |
Intermediate Imports |
Percent |
|
Heating, plumbing, and fabricated structures |
3,213 |
2,956 |
92.0 |
|
Screw machine products and stampings |
3,019 |
2,883 |
95.5 |
|
Other fabricated metal products |
17,910 |
16,763 |
93.6 |
|
Engines and turbines |
5,586 |
3,616 |
64.7 |
|
Farm, construction, and mining machinery |
10,037 |
1,473 |
14.7 |
|
Materials handling machinery and equipment |
3,878 |
1,509 |
38.9 |
|
Metalworking machinery and equipment |
10,799 |
3,705 |
34.3 |
|
Special industry machinery and equipment |
9,731 |
1,722 |
17.7 |
|
General industrial machinery and equipment |
13,949 |
8,482 |
60.8 |
|
Miscellaneous machinery, except electric |
2,978 |
2,781 |
93.4 |
|
Computer and office equipment |
79,871 |
39,331 |
49.2 |
|
Service industry machinery |
4,255 |
2,585 |
60.8 |
|
Electrical industrial equipment and apparatus |
12,168 |
9,471 |
77.8 |
|
Household appliances |
7,666 |
1,488 |
19.4 |
|
Electric lighting and wiring equipment |
9,216 |
9,164 |
99.4 |
|
Audio, video, and communication equipment |
48,455 |
11,753 |
24.3 |
|
Electronic components and accessories |
46,361 |
45,470 |
98.1 |
|
Miscellaneous electrical machinery and supplies |
13,854 |
10,095 |
72.9 |
|
Motor vehicles (passenger cars and trucks) |
115,857 |
929 |
0.8 |
|
Truck and bus bodies, trailers, and motor parts |
39,406 |
35,542 |
90.2 |
|
Aircraft and parts |
21,650 |
5,280 |
24.4 |
|
Other transportation equipment |
6,644 |
717 |
10.8 |
|
Scientific and controlling instruments |
26,319 |
7,470 |
28.4 |
|
Ophthalmic and photographic equipment |
10,331 |
4,343 |
42.0 |
|
Miscellaneous manufacturing |
39,832 |
13,612 |
34.2 |
|
Railroads and related services; passenger round transportation |
208 |
105 |
50.5 |
|
Motor freight transportation and warehouse |
2,112 |
1,511 |
71.5 |
|
Water transportation |
−5,394 |
−2,185 |
|
|
Air transportation |
17,644 |
7,860 |
44.5 |
|
Pipelines, freight forwarders, and related services |
0 |
0 |
|
|
Communications, except radio and TV |
0 |
0 |
|
|
Radio and TV broadcasting |
0 |
0 |
|
|
Electric services (utilities) |
1,382 |
658 |
47.6 |
|
Gas production and distribution (utilities) |
0 |
0 |
|
|
Water and sanitary services |
0 |
0 |
|
|
Wholesale trade |
−19,182 |
−9,255 |
|
|
Retail trade |
0 |
0 |
|
|
Total Exports |
Direct Imports |
Percent |
Direct Plus Indirect Imports |
Percent |
|
2,903 |
132 |
4.5 |
206 |
7.1 |
|
2,847 |
400 |
14.1 |
523 |
18.4 |
|
9,485 |
1,773 |
18.7 |
2,797 |
29.5 |
|
9,559 |
461 |
4.8 |
584 |
6.1 |
|
11,176 |
92 |
0.8 |
163 |
1.5 |
|
2,289 |
50 |
2.2 |
106 |
4.6 |
|
5,830 |
510 |
8.7 |
862 |
14.8 |
|
8,830 |
216 |
2.5 |
311 |
3.5 |
|
11,804 |
1,116 |
9.5 |
1,642 |
13.9 |
|
2,817 |
439 |
15.6 |
647 |
23.0 |
|
38,203 |
5,436 |
14.2 |
6,787 |
17.8 |
|
5,087 |
99 |
1.9 |
148 |
2.9 |
|
6,610 |
1,260 |
19.1 |
1,733 |
26.2 |
|
3,060 |
11 |
0.3 |
41 |
1.3 |
|
4,960 |
299 |
6.0 |
513 |
10.3 |
|
20,372 |
1,690 |
8.3 |
2,093 |
10.3 |
|
45,480 |
10,080 |
22.2 |
13,099 |
28.8 |
|
7,320 |
941 |
12.9 |
1,311 |
17.9 |
|
23,589 |
125 |
0.5 |
160 |
0.7 |
|
30,438 |
2,871 |
9.4 |
3,664 |
12.0 |
|
57,158 |
2,100 |
3.7 |
2,553 |
4.5 |
|
4,565 |
60 |
1.3 |
96 |
2.1 |
|
30,992 |
953 |
3.1 |
1,205 |
3.9 |
|
3,976 |
163 |
4.1 |
316 |
8.0 |
|
6,165 |
590 |
9.6 |
936 |
15.2 |
|
4,820 |
6 |
0.1 |
12 |
0.3 |
|
15,214 |
93 |
0.6 |
189 |
1.2 |
|
9,951 |
−246 |
−2.5 |
−396 |
−4.0 |
|
29,665 |
654 |
2.2 |
1,047 |
3.5 |
|
3,135 |
0 |
0.0 |
0 |
0.0 |
|
5,597 |
0 |
0.0 |
0 |
0.0 |
|
0 |
0 |
|
0 |
|
|
503 |
37 |
7.3 |
71 |
14.2 |
|
423 |
0 |
0.0 |
0 |
0.0 |
|
67 |
0 |
0.0 |
0 |
0.0 |
|
71,417 |
−818 |
−1.1 |
−1,295 |
−1.8 |
|
33 |
0 |
0.0 |
0 |
0.0 |
United States with imported inputs. The consequent higher price of U.S. finished products would reduce U.S. exports and increase U.S. imports of finished goods, thus mitigating the intended protection of American manufacturing jobs.
Another question that might be raised concerns the effect of the external deficit on the level and structure of imports and exports of manufactures: If the external deficit causes depreciation of the value of the dollar, which stimulates U.S. exports, how much of the increased value of exports is offset by greater imports of intermediate inputs? This question also points to price changes that would change the input-output tables: the depreciation of the dollar would increase the price of imported intermediate goods and encourage a shift to U.S. suppliers. Thus, interventions in the markets for intermediate imports would produce a complicated set of reactions that cannot be predicted with an input-output framework that ignores alto-
|
Total Exports |
Direct Imports |
Percent |
Direct Plus Indirect Imports |
Percent |
|
32,803 |
17 |
0.1 |
31 |
0.1 |
|
2,081 |
16 |
0.8 |
37 |
1.8 |
|
0 |
0 |
|
0 |
|
|
37,992 |
0 |
0.0 |
0 |
0.0 |
|
124 |
0 |
0.0 |
0 |
0.0 |
|
83 |
0 |
0.0 |
0 |
0.0 |
|
6,543 |
20 |
0.3 |
41 |
0.6 |
|
11,979 |
58 |
0.5 |
122 |
1.0 |
|
10,011 |
130 |
1.3 |
263 |
2.6 |
|
770 |
67 |
8.7 |
108 |
14.1 |
|
755 |
0 |
0.0 |
0 |
0.0 |
|
1,760 |
0 |
0.0 |
0 |
0.0 |
|
11,416 |
3 |
0.0 |
6 |
0.0 |
|
225 |
0 |
0.0 |
0 |
0.0 |
|
544 |
1 |
0.2 |
2 |
0.4 |
|
270 |
0 |
0.0 |
0 |
0.0 |
|
0 |
0 |
|
0 |
|
|
811,895 |
54,766 |
6.7 |
84,285 |
10.4 |
gether the effects of prices on the choice of inputs by businesses and the choice of products by consumers.
To make these problems more clear it is useful to explain how indirect imports are computed. First, one has to find out the level of domestic output directly used to produce exports by multiplying the vector of exports by the domestic rows of the input/output requirements matrix in Table 2-7. This can be expressed as SDx where SD is the matrix of domestic input-output shares and x is the vector of export values. Then, one computes the level of imports needed to produce those inputs by multiplying this amount of domestic output by the import rows of the same matrix: SMSDx, where SM is the matrix of import shares. Continuing on, however, the domestic output SDx requires additional domestic output as inputs: SDSDx, which necessitates additional imports: SMSDSDx. And so on and so on. Adding all
these together, one obtains the direct and indirect imports embodied in exports as:
This calculation rests on three problematic assumptions: supply chain transformation, timing, and fixed shares. First, the calculation implicitly assumes that there is no transformation of the product at each stage of processing—the first-stage machinery produced within manufacturing and sold to farmers is indistinguishable from second-stage processed food that is also produced with manufacturing using first-stage inputs provided by agriculture. It is the assumption of no transformation that allows one to use the same input-output requirements matrix at every stage. Second, the calculation assumes that the passing of product back and forth among sectors occurs instantaneously or at least rapidly enough that almost all the passing back and forth can occur within the period of time to which the input-output table applies, typically a year. Third, the input-output fractions are treated as fixed “constants of nature” that are, in particular, not responsive to price changes.
Bidirectional or Unidirectional Supply Chains
It seems logical to assume that after each stage of processing products are changed and the destinations are changed. But the calculation of direct plus indirect inputs assumes that there is no change in the destinations matrix and no change in the input requirements matrix. With exports that require domestically produced inputs, what amount of imports are needed to produce those domestically produced products? The answer can be found by merely multiplying the domestically produced inputs by the import requirements matrix, as if these coefficients describe a production technology for transforming imported inputs and domestic inputs into output.
The repeated applicability of the same destination matrix would make more sense if the supply chains implicit in the input-output table were unidirectional rather than looping back and forth as they do because the input-output use matrix includes the sale of every sector to every other sector: for example, agriculture, manufacturing and finance all sell outputs to each other (see Figure 2-3).
Although these bidirectional sales clearly occur in an accounting sense, much of what appears to be bidirectional is an artifact of the product cat-
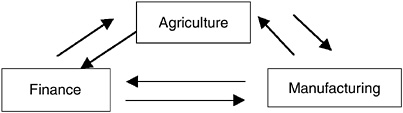
FIGURE 2-3 Illustration of how supply chains loop around because of bidirectional sales between each sector in the input-output data matrix.
egories. An alternative model would have a unidirectional supply chain that distinguishes, for example, tractors that are sold to agriculture from processed food sold to final consumers (see Figure 2-4).
Timing Issues
The timing of the imports to produce exports is another potentially important issue since supply chains can be stretched greatly over time. For example, U.S. exports of machinery may come back as finished goods imports years later, and U.S. imports of machinery may contribute to export value years later. An input-output table does not allow one to explore the
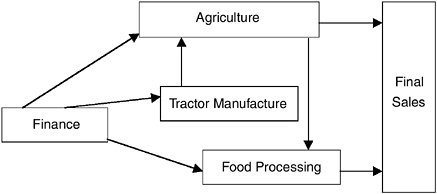
FIGURE 2-4 Illustration of a unidirectional supply chain that separates manufacturing into a sector that sells only to final consumers (processed food) and a sector that sells only to farmers (tractors).
timing issues, and the calculation of direct and indirect imported inputs implicitly assumes that all value added is created in the year to which the input-output table applies. If the supply chain is stretched over many years, the current values of the earliest inputs need to be adjusted upward (depending on the interest rate) to properly account for the “capital” value of those inputs. In addition, if a multiyear supply chain is experiencing significant changes, because of changes in the sources of capital equipment or because of business cycle swings of demand for capital equipment, the current input-output table may give a misleading picture of the part of the foreign content of U.S. exports that is due to input-output relationships in earlier years. Although there is no evidence regarding the importance of this timing issue, the study of global supply chains would ideally allow for the fact that supply chains are stretched over time as well as across country borders and the input-output table could be expanded to allow inputs distinguished by year of purchase.6
Price Data and Price Responses
Full understanding of global supply chains requires measurement of prices as a product is passed from one stage of processing to another. Any policy change will have price effects, and there is no way to know the response to that change without knowledge of prices and without studies of the responsiveness to price changes of final sales and production methods, including the choice of inputs and the geographical organization of supply chains.
Measuring Content for Services
Developments in information technologies, most notably the Internet, have led to several key conceptual challenges in tracking the international trade in services. First, information, software, or advice need not be relegated to a physical carrier medium in order to be traded. For example, software need not be put on a diskette or disk drive to be traded or used internationally. It can be transmitted electronically across international po-
litical boundaries. Second, the organization and codification of complex information can reduce the specific knowledge needed to use the information. For example, an on-screen menu system in a customer-service center is a tool that replicates expert knowledge so that people with less knowledge can use a system. Third, software programming technologies and management now divide software into stages of design, coding, integration of parts, fixing bugs, and customer interface with the final product.
By and large, the existing trade tracking and classification systems do not yet take account of these developments. For example, how can trade in services be tracked when the international trade does not involve a physical carrier medium for the service activity and the service activity is an intermediate and therefore separable from the ultimate consumer. The Internet and information technologies clearly allow there to be no physical trade by buyer or seller and many of the products are not “final.” Other classification issues arise in the context of trade in services. First, the classification may not be by activity, but by product. So software programming, for instance, could be scattered among a variety of products rather than be measured as a particular activity in its own right.
Second, it may be difficult to obtain data on digital transactions through surveys because corporations may keep data on activity by business line, not by international boundary or activity or cost. For example, there may be data on computer maintenance and repair that it is not separated from customer service costs. Or there may be data on customer service costs, but not where the service originates—Idaho or Ireland. Digitalization could mean that businesses may not know the residency of some activities, particularly final service sales. A business may collect data on overall management and telecommunications costs, but not separate them by business line, or it may separate them from the labor cost component of, say, customer service or programming. Although some of these questions are not new and have been addressed in the context of domestic data on services, the issues will become increasingly relevant to address in the context of collecting and constructing international data (see Fraumeni, 2000).
There is no accepted international statistical standard for the classification of many cross-border services. The lack of such a widely agreed upon and implemented system can lead to mismatches between data on imports to the United States with data gathered by foreign agencies on exports to the United States—making the use of such data for content analysis dubious at best.
CALCULATING THE U.S. CONTENT OF IMPORTS TO THE UNITED STATES
Measuring the U.S. content of imports to the United States is a more difficult problem than measuring the foreign content of U.S. exports because there is no consistent set of input-output tables for U.S. trading partners. Hummels, Isihii, and Yi (2001) have considered how to estimate the U.S. content of imports to the United States.
Consider the example of U.S.-manufactured electronic components that are exported to Korea for the assembly of personal computers that, in turn, are exported back to the United States as finished goods. Hummels, Isihii, and Yi (2001) denote the measurement of the value of exports that are embodied in a second country’s exports as VS1. In terms of this report, VS1 measures the value of the U.S. exports in the goods exported from a second country back to the United States. Figure 2-2 shows a schematic of measuring the U.S. content of imports VS1. VS1 is very difficult to measure because for each trading partner the value of U.S. exports to Country 2 that are used as inputs into producing that country’s exports to the United States needs to be calculated. There are no available data to aggregate the calculation of VS1 across all sectors.
CONCLUSION: The foreign content of U.S. product exports can be estimated by proxy and with some accuracy given available data and assumptions regarding the similarity of imported intermediate inputs (e.g., parts) and U.S.-produced intermediate inputs. The measurement of the U.S. content of U.S. imports of products cannot be done with confidence because there is no reliable way of tracking U.S. exports that are subsequently incorporated into imports in one form or another. For services, calculating such content is even more difficult because of data limitations, including different classification systems, incomplete coverage of international trade, and a key assumption (of similar domestic and international technology ratios) that is clearly not true.


