
Evaluation Activities of the American Cancer Society
Ralph Vogler
The American Cancer Society (ACS) has supported research since 1947, beginning with the efforts of Mary Lasker, who collected about $1 million. The ACS has now funded a total of $2.8 billion worth of research. The problem is that the outcome of this program has never really been evaluated, except to note that the ACS has supported 38 Nobel laureates sometime during their careers.
In 1995 a blue ribbon committee, composed of both academic and lay people, was formed to assess ACS funding. The committee elected to restrict funding for ACS grants to young investigators. From the committee’s consideration, three programs have emerged to fund young investigators. First, there are postdoctoral fellowships. In addition, a clinical research training grant was instituted as a consequence of the committee’s decision. Finally, the ACS continued to fund research program projects. This paper describes the evaluation activities for two programs instituted following the committee’s recommendations. These programs are the Clinical Research Training Programs and the research project grants.
EVALUATION OF THE CLINICAL RESEARCH TRAINING PROGRAM
Initial funding for this program began in 1996. The purpose of the program was to fund mentored preclinical and clinical research in the areas of epidemiological and health services research or health policy and
outcomes research for junior faculty within the first four years of their faculty appointments. The funding was for $150,000 per year for three years, and it was renewable for two additional years.
The objective of the review was to evaluate the impact of the program on clinical research, to assess the impact of funding on the professional careers of the applicants, and to identify issues that might provide guidance as to how the ACS might do these in the future. This was done by comparing funded applicants with the unfunded applications with regard to various things such as degrees, prior research experience, publications, institutions, current academic status, current research, and the number of publications.
A questionnaire was sent to those who had submitted applications prior to January 1, 2000. Many of them responded. Back in 1996, not too many of the investigators had e-mail addresses. So various search methods were used, looking at membership lists, professional organizations, university faculty listings, Medline, and sometimes telephoning. There were 204 individuals who had applied from 103 institutions. Interestingly, 20 institutions accounted for 45 percent of the applicants. Over a quarter of the applications (53) were funded. Eight renewals were submitted, and three were funded.
Table 1 demonstrates the number of applications that ACS receives each year and the funding rate through the years. The funding rate averages 25 percent and is fairly constant from year to year, although it may have increased in the past few years. Data from the last two years are not included.
Awards are funded through the recommendations of peer review committees. There is variability in funding rates by committee (see Table 2). For example, the Clinical Research in Cancer Control and Epidemi-
TABLE 2 Number of Successful and Unsuccessful Applications by Peer Review Committee
|
Committee |
Total |
Funded |
Percent |
|
CCE (EDT) |
163 |
46 |
28.2 |
|
LIB (LBC) |
11 |
3 |
27.3 |
|
CDD |
1 |
0 |
0 |
|
PBP (PBR) |
37 |
4 |
10.8 |
|
NOTE: Renewals included. |
|||
ology Committee, which had the most applications, funded 28 percent. The Leukemia, Immunology, and Blood Cell Development Committee funded 27 percent. The Psychosocial and Policy Committee funded only 10 percent.
Grant recipients were asked about their prior research experience. About one-quarter of those who did not receive funding had prior research experience, compared to 50 percent of those who were funded. Interestingly, the type of research experience they had did not seem to make a lot of difference in funding. Also, of those who were funded, 40 percent had three or more years of research experience before they applied for a grant.
The productivity of applicants was examined. Of those who were funded, 72 percent had prior publications, compared to 37 percent for those who did not receive funding. In addition, type of degree was examined. Researchers with M.D.-Ph.D. degrees were more likely to receive funding than those with Ph.D.s, who in turn were more likely than those with M.D.s to get funding (31, 25, and 21 percent, respectively).
The 122 applicants who applied prior to the year 2000, along with four renewals, were followed up. Follow-up information was obtained from 83 percent of the applicants through an e-mail survey. The response rate was the same for both funded and unfunded applicants. Of the 126 applicants, 32 had received funding and 94 had not. For those who received funding, 92 percent were known to have faculty appointments, while only 75 percent of unfunded applicants had faculty appointments. As seen in Table 3, most applicants were assistant professors, but there were three people who had advanced to professorship. This is not unexpected, as the awards were targeted toward young researchers.
The level and type of current research activities were similar for both funded and unfunded applicants, whether clinical, preclinical, or basic research. In addition, there was no difference in the productivity of suc-
TABLE 3 Faculty Rank of Funded and Unfunded Applicants
|
Rank |
Funded |
% |
Unfunded |
% |
|
Instructor |
0 |
0 |
1 |
1.1 |
|
Assistant professor |
22 |
68.7 |
53 |
58.9 |
|
Associate professor |
7 |
23.3 |
22 |
24.4 |
|
Professor |
1 |
3.0 |
2 |
2.2 |
|
None |
1 |
3.0 |
7 |
7.8 |
|
Unknown |
1 |
3.0 |
5 |
5.6 |
|
Total |
32 |
|
90 |
|
cessful and unsuccessful applicants. For both groups, clinical publications predominated.
Applicants were asked if they were still at the institutions where they trained or if they had moved to different institutions. Most applicants had remained at the institutions where they trained (73 percent); those who stayed were slightly more likely to have been funded.
In summary, this program, which was initiated in 1996, has had an average of 30 applicants per year, 25 percent of whom were funded. Prior research and publication experience enhanced funding chances. Most of the applicants remained in academic institutions and were involved primarily in clinical research, whether they were funded or not. It was concluded that prior research experience certainly enhances the chances for funding. Most applicants were highly motivated to seek academic careers regardless of whether they were funded. It is too early to evaluate whether the program identified issues that might be of guidance to future training efforts.
EVALUATION OF RESEARCH PROJECT GRANTS
In 1996 it was determined that the ACS would support independent investigators in their first faculty positions and within the first eight years of their faculty appointments. Analyses have just begun because ACS wanted to assess outcomes and needed to let some time pass from the initial awards. ACS wanted to determine whether support of these young investigators aided in the development of their academic careers.
A questionnaire was sent to each applicants who had submitted a research program grant in the spring of 1996. Those who were funded were compared those who were unfunded. Resubmissions of applications were allowed, and many people who were not funded initially got funded later. The funding rate is about 22 percent. Although this award is
TABLE 4 Numbers and Types of Grant Applications
|
Type of Application |
New |
Resubmission |
Renewal |
Resubmission Renewal |
Total |
|
Funded |
36 |
53 |
30 |
5 |
124 |
|
Unfunded |
108 |
174 |
39 |
25 |
436 |
|
Total |
144 |
227 |
69 |
30 |
560 |
|
Percentage funded |
25.0 |
23.4 |
43.5 |
16.7 |
22.1 |
targeted to new investigators, it was found that applicants had previously applied for funding but listed their applications as new. Table 4 shows the distributions of the applications, with renewals having a slightly higher funding rate.
The race/ethnicity of applicants also was examined. As seen in Figure 1, 73 percent of applicants were white, 20 percent were Asian, and 3 percent were African American, with a scattering of persons with other ethnic identities. The funding rate is 9 percent for whites, 10 percent for Asians, and 6 percent for Hispanics; no blacks or Native Americans were funded.
Finally, applicants’ degrees were examined. Although M.D.s comprised only 7 percent of applicants, they received 14 percent of the awards. Over 80 percent of applicants were Ph.D.s; they received only 10 percent of awards. Funding success was much lower for initial submissions, 6 or
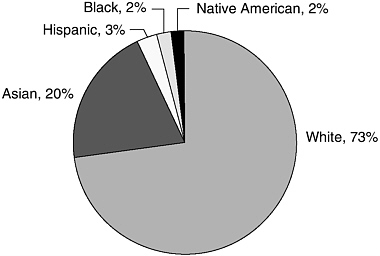
FIGURE 1 Race/ethnicity of applicants.
7 percent. For resubmission the success rate was considerably higher, near 20 percent.
For the first 100 questionnaires returned, 15 applicants were funded and 85 were unfunded. All of the funded recipients remained in academia, while about one-sixth of unsuccessful applicants had positions outside academia.
An assessment of research project grants has just begun. ACS will continue to analyze the data it currently has and will continue to send questionnaires to all applicants and to use other search methods to find missing addresses. ACS will also continue to compare the characteristics of applicants who received funding with those who did not to determine if the program has had an impact on career development.


