
E
Paying for Reliability in Deregulated Markets
Timothy Mount1
THE CHANGING REGULATORY STRUCTURE IN NEW YORK STATE
The problems faced by investors in the process of financing new power plants and transmission lines have changed over time depending on the regulatory structure and the economic climate, and these factors will probably continue to change in the future. Prior to the restructuring of electricity markets, under the system of regulated monopolies, inves-tor-owned utility companies were given a guaranteed rate of return, with a potential penalty if their investments were found to be imprudent. Once an expansion plan had been approved by a state public utility commission (PUC), it was relatively straightforward for investors to finance the capacity expansions, even for a capital-intensive project such as a nuclear plant, because the financial risk of an investment was relatively low under regulation. A key factor in determining how many plants were to be built was the utility’s forecast of future load and the acceptance of this forecast by the PUC. If the utilities’ forecasts of demand were consistently biased in the same direction, utilities could be caught with a deficit of capacity, as happened after World War II, or a surplus of capacity, as happened in the late 1980s.
The rate of growth of demand was consistently high after the post-war shortages, and the total demand doubled every 10 years in the United States until the early 1970s. After the oil embargo in 1973, the growth of demand was and has continued to be much lower than historical levels. Electricity demand grew at a 7.3 percent annual rate from 1960 to 1973, but slowed to 2.5 percent a year from 1973 to 1985 (Geddes, 1992). The utility industry was relatively slow to recognize and adopt lower forecasts of demand, and there was an extended public debate about how much the in-dustry’s forecasts of demand should be lowered in response to higher prices (Nelson and Peck, 1985). An additional rationalization for building nuclear power plants after the oil embargo was to substitute a domestic source of energy for imported oil. As a result, ambitious construction plans for nuclear power plants were continued in spite of growing evidence that the growth of demand would be lower than expected and that these projects would eventually lead to an excess of installed generating capacity (Schuler, 2001).2
Since the industry’s forecasts of demand had been approved by PUCs, consumers still had to pay for much of the excess capacity when installed capacity got ahead of demand (Zadlo et al., 1996).3 As a result, there was considerable soul-searching by regulators and criticism by the public about what had gone wrong with the regulatory process. Increases in prices led to further decreases in demand below projections (Zadlo et al., 1996). When the excess capacity and the high cost of new nuclear facilities (Potts, 2002)4 became apparent in the 1980s, many PUCs held prudency hearings (Geddes, 1992), and in some high-profile cases, such as those involving Nine Mile Point Unit 2, near Oswego, New York, and Seabrook Nuclear Power Plant in New Hampshire, stockholders were denied the full recovery of capital (Adams, 2005). In total, $19 billion of the accumulated costs of constructing new generating capacity was disallowed according to one estimate (Lyon and Mayo, 2000). Although $19 billion was a small amount compared with the total book
value of installed generating capacity, it was still large enough to send a message of dissatisfaction to investors. Since only a fraction of the total cost of building excess generating capacity was charged to stockholders, ratepayers were also adversely affected by paying higher rates; the primary cause of the problem was a failure by the industry and regulators to predict future levels of demand accurately.
The memory of excess generating capacity and unrealistic demand forecasts was part of the rationale for utility restructuring, based on the perception that the investment decisions made by regulated utilities were often economically inefficient (Rebellon, 2002). Regulated monopolies were thought by many people to imply high rates for customers owing to “overbuilding.” It was also thought that more competition would lower costs, encourage innovation, and attract new investment (Rebellon, 2002; Anderson, 2004; Higley, 2000; Potts, 2002).5,6 In addition, investment decisions in deregulated markets would be decentralized, and as a result, the responsibilities of regulators for selecting a particular forecast of demand and authorizing an expansion plan would be substantially reduced.7 Supporters of deregulation argued that market forces could be relied on to ensure that there would be enough installed generating capacity to meet the growth of demand.
Although it was not recognized at the time, the changing economic circumstances in the 1980s had already led most utilities to reduce their level of capital investment. Some analysts attributed the cause of this reduced investment to the “hammer” of the prudency reviews and the resulting regulatory disallowances (Geddes, 1992).8 Other analysts, however, concluded that the primary cause was the existence of excess generating capacity and the economic incentives to shift away from expensive nuclear power plants to less expensive natural gas turbines (Lyon and Mayo, 2000).
In the latter half of the 1970s, high oil prices, restrictions on the use of natural gas by utilities, and increasing environmental concerns about the adverse effects of air pollution were among the major reasons that utilities in New York State embraced nuclear power as an alternative to fossil-fuel sources of electricity. When high oil prices and cost overruns for constructing nuclear power plants drove electric rates steadily higher, the New York legislature responded by enacting a law in 1980 that required utilities to buy power from independent power producers (IPPs) for 6¢/kWh. Unfortunately, this law was enacted just before the price of oil dropped, and after additional supplies of natural gas became available after the oil industry was deregulated. Consequently, the actual cost of generating electricity from natural gas turbines, including the capital cost, was well below 6¢/kWh. Nevertheless, forecasters did not anticipate these changes in 1980, and therefore they expected higher prices for oil and natural gas in the 1980s.
The assumption underlying the “six-cent law” was that rising oil prices and the high construction costs of nuclear power plants would soon make 6¢/kWh a bargain for the buyers. In fact the opposite happened. Falling fuel prices, technological advances, and successful energy-efficiency investments created a surplus of generation that kept the cost of electricity well below 6¢/kWh, and the six-cent law created a substantial subsidy for IPPs and became a source of controversy for the public. The six-cent law was reinterpreted in 1987 to require an IPP to accept 6¢/kWh until such time as the front-end subsidy was paid back to customers, but projections indicated that wholesale prices of electricity would be so low that repayment would never occur. The overall outcome of the six-cent law was that thousands of megawatts of new contracts were made to buy electricity from IPPs at above-market prices. Most of this new capacity was built upstate, because construction costs were lower there than they were in the New York City region. The high cost of these contracts resulted in higher rates for customers. In the 1990s, regulators decided that the best strategy was to allow utilities to buy out the IPP contracts and treat the cost of doing this as a lump-sum loss.
Combining the effects of the high construction costs of the new nuclear power plants, the impact of the six-cent law, and the high property taxes in Long Island and New York City, electricity prices in New York State remained among the highest in the country, even though the amount of generation from oil-fired sources diminished to relative insignificance. Large customers in New York State—as in Cali-fornia and other high-cost states—became interested in self-generation and retail access as ways to “bypass” paying the high rates for electricity and, in some cases, as ways to shift production and jobs to regions with lower electricity prices. In 1994, California became the first state to announce the intention of permitting retail customers to choose their power suppliers. New York State announced its own plan for retail access one year later. This plan started by persuad-
ing the utilities to sell their generating capacity to merchant generators prior to the establishment of a new deregulated wholesale market for electricity in 1999.
The perceived failure of the traditional “regulatory com-pact” that occurred in many countries in the 1970s and 1980s was the primary motivating factor for “deregulating” the electric utility industry. This restructuring took place around the world beginning in the 1980s and accelerated in the 1990s (Anderson, 2004), and it generally involved unbundling assets (i.e., separating the ownership) for the generation, transmission, and distribution segments of the supply system. Customers were no longer restricted to buying electricity from a single utility. In the United States, “As of April 2004, twenty four states and the District of Columbia had enacted legislation or issued regulatory orders to permit retail access to competitive electricity suppliers; more recently, however, seven of these states delayed or suspended their plans for retail access, largely in response to the turmoil in California’s market” (Anderson, 2004).
In 1999, when the new wholesale market for electricity started to operate in New York State, the price of natural gas happened to be low. Entrepreneurs saw an opportunity to make money by building efficient combined-cycle turbines that would undercut the costs of older fossil-fuel power plants. Merchant facilities were built without guarantees of a regulatory rate of return, and these projects were still able to get financing from financial institutions. Given the econom-ics of the time, merchant plants were expected to earn for investors higher rates of return than the traditional regulated rates. Figure E-1 shows the dramatic increase in the construction of new generating capacity in North America that started in 2000. It looked at that time as though market forces would ensure that the amount of new generating capacity being built would be enough to keep up with the forecasted growth of demand (and the retirement of older power plants).
However, during the early 2000s, the underlying economic conditions changed. As a result, many merchant projects for natural gas turbines ended up in financial trouble that persists today. By 2003, cancellations of planned facilities accelerated (Horton, 2002), leading to concerns about capacity shortages in the near future (see Figure E-1). New York State is not the only region of the country that is facing the possibility of capacity shortages. All three of the northeastern control areas (New York, New England, and the mid-Atlantic control area known as Pennsylvania Jersey Mary-land [PJM]) are now struggling to create effective investment incentives for building new generating capacity. Some policy makers are calling for major changes in the current path of deregulation and less dependence on the merchant development paradigm (Adams, 2005).
Once again, the failure to forecast key economic variables accurately (in this case the prices of natural gas and electricity) has contributed to the financial problems faced by many owners of natural gas turbines. This time, however, the financial consequences of unprofitable merchant projects will be borne by the stockholders rather than by the ratepayers. Higher prices for natural gas in 2005, coupled with relatively low prices for electricity, have led to delays in the construction of new generating capacity in New York State. These delays have arisen in spite of the establishment of a new form of locational installed capacity (LICAP) auction, run by the New York Independent System Operator (NYISO). The major objectives for establishing this new LICAP auction were to supplement the income of generators
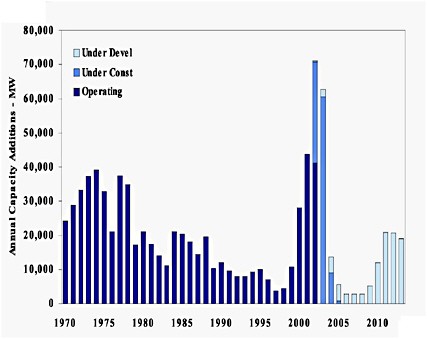
FIGURE E-1 North American additions in historical perspective. The current boom is modest relative to what happened in the 1970s.
SOURCE: Logan (2002).
when shortages of generating capacity are likely to occur, and to provide sufficient incentives to delay the retirement of existing generating capacity and to build new generating capacity.
Today, even with higher natural gas prices, natural gas turbines are still the preferred type of traditional generating capacity for providing an alternative to the nuclear units at New York’s Indian Point Energy Center. Although many utilities in the country are now planning to use coal instead of natural gas in new power plants, building a typical coal plant in the New York City region is unlikely to meet state environmental standards and unlikely to get widespread support from the public. Clearly, a nuclear power plant in this region is not a viable alternative.
To summarize, until a year ago most policy makers in New York State believed that market forces could be relied on to build enough new generating capacity to meet future levels of demand. Unfortunately, this level of optimism about market forces is no longer realistic under the present economic conditions. The increased uncertainty that now exists about the financial viability of building new generating capacity in New York State, particularly in the New York City region, makes the task of finding alternatives to Indian Point much more challenging for this Committee on Alternatives to Indian Point for Meeting Energy Needs. For example, the current projection made by NYISO of the reserve margin for capacity in New York State falls below the 18 percent level needed to maintain reliability standards by 2008 (NYISO, 2005a). This type of problem is occurring in other parts of the nation, and the North American Electric Reliability Council (NERC) has lowered the forecasts of installed generating capacity in the nation every year since 2002. The current projected summer capacity margin (summer capacity margin = installed capacity – summer peak load) is below 15 percent for the nation in 2008 and continues to decline to 10 percent by 2014, the last year forecasted (NERC, 2005, Fig. 7, p. 18).
The growing concerns about how to maintain the reliability of the electric supply system in New York State and the nation coincide with major changes in the regulatory structure of the industry. In particular, the Energy Policy Act of 2005 was signed into law in August 2005, giving greater authority over reliability to the Federal Energy Regulatory Commission (FERC). Prior to the enactment of this legislation, FERC was primarily an economic regulator of the wholesale transactions and tariffs on the bulk power system. The main implications of the Energy Policy Act of 2005 are to give FERC the authority to enforce reliability standards by imposing penalties on end users if the standards are violated. In addition, a new organization, the Electric Reliability Organization (ERO), will be given the authority to establish these reliability standards. At this time, it is not clear exactly how this new authority will be implemented by FERC. Nevertheless, these mandatory changes show that maintaining reliability is a major priority of federal policy makers, but state regulators will still have the main responsibility for determining how the new standards will be implemented (i.e., determining how much generating capacity is needed to meet the standard).
The sections below provide a more detailed explanation of the following questions: how regulators determine the amount of generating capacity needed to meet reliability standards, why the current regulatory practices have failed to ensure that future levels of generating capacity will be sufficient to meet these standards, and what can be done, given current circumstances, to meet future levels of demand and maintain the reliability of supply.
DETERMINING AND IMPLEMENTING THE RELIABILITY STANDARDS
In an electric supply system, the performance of the network and the level of reliability are shared by all users of the network. Reliability has the characteristics of a “public” good (e.g., all customers benefit from the level of reliability without “consuming” it). In contrast, real energy is a “pri-vate” good because the real energy used by one customer is no longer available to other customers. Markets can work well for private goods but tend to undersupply public goods, such as reliability (and oversupply public “bads” such as pollution). The reason this happens is that customers are generally unwilling to pay their fair share of a public good because it is possible to rely on others to provide it (i.e., they are “free riders”). Some form of regulatory intervention is needed to make a market for a public good or a public bad socially efficient.
If a public good or a public bad has a simple quantitative measure that can be assigned to individual entities in a market, it is feasible to internalize the benefit or the cost in a modified market. For example, the emissions of sulfur and nitrogen oxides from a fossil-fuel generator can be measured. Requiring every generator to purchase allowances for the quantities emitted makes pollution another production cost. Regulators determine a cap on the total number of allowances issued in a region, and this cap effectively limits the level of pollution. Independent (decentralized) decisions by individual generators in the market determine the pattern of emissions and the types of control mechanisms that are economically efficient. For example, the choice between purchasing low-sulfur coal and installing a scrubber is left to market forces in a “cap-and-trade” market for emission allowances. Unfortunately, when dealing with the reliability of an electric supply system, it is impractical to measure and assign reliability to individual entities on the network in the same way that emissions can be assigned to individual generators. This is particularly true for transmission lines that are needed to maintain supply when equipment failures occur. NERC uses the following two concepts to evaluate the reliability of the bulk electric supply system (NERC, 2005, p. 10):
-
Adequacy—The ability of the electric system to supply the aggregate electrical demand and energy requirements of customers at all times, taking into account scheduled and reasonably expected unscheduled outages of system elements.
-
Operating Reliability—The ability of the electric system to withstand sudden disturbances such as electric short circuits or unanticipated failure of system elements.
The desired level of reliability on a network should be specified by a regulatory agency, and under the Energy Policy Act of 2005, FERC will be responsible for enforcing a set of standards for reliability that are established by the ERO. State regulators will continue to be responsible for interpreting the standards to determine how they should be implemented. Before passage of the Energy Policy Act of 2005, the NERC standard of 1 day in 10 years for the loss-of-load expectation (LOLE) was generally accepted by regulators as the appropriate standard for the reliability of the bulk transmission system (i.e., this does not include outages of the local distribution systems caused, for example, by fall-ing tree limbs and ice storms). Nevertheless, it is still very difficult to allocate the responsibilities for maintaining this standard to individual owners of generating and transmission facilities because of the interdependencies that exist among components of a network. This fundamental problem has not stopped regulators from trying to do it.
The basic approach used by state regulators is to assume that setting reserve margins for generating capacity (i.e., setting a standard for “generation adequacy”) is an effective proxy for meeting the NERC reliability standard. This new proxy for reliability can now be viewed as the sum of its parts, like emissions from generators, and the task of maintaining reliability can be turned over to market forces once the regulators have set a reserve margin. In practice, it has been difficult, without regulatory intervention, to maintain a given standard for generation adequacy in many deregulated markets, particularly in the three deregulated markets in the Northeast. The underlying reasons for this difficulty are explained in the following sections. The main implication for this study is that even if Indian Point continues to operate at full capacity, there will still be problems with maintaining the reliability of supply that should be addressed immediately by regulators. Ignoring these problems would make it much more difficult to find viable ways to replace the generating capacity at Indian Point and maintain the reliability of supply in the New York City region.
Generation adequacy is clearly a necessary condition for the operating reliability of supply, but it is not a sufficient condition. Treating generation adequacy as the central issue for reliability downplays the importance of transmission services and distributed energy resources (DERs) for maintaining the reliability of supply. This issue has been discussed in the NERC (2005) report Long-Term Reliability Assessment. The executive summary of that report (NERC, 2005, p. 5) states:
Transmission Systems Will Be Operated at or Near Limits More Frequently. North American transmission systems are expected to meet reliability requirements in the near term. However, as customer demand increases and transmission systems experience increased power transfers, portions of these systems will be operated at or near their reliability limits more of the time. Under these conditions, coincident failures of generating units, transmission lines, or transform-ers, while improbable, can degrade bulk electric system reliability.
This general conclusion reflects the complicated state of the electric utility industry in North America at this point in time when different regions are in different stages of deregulating the industry. Deregulation implies moving away from the use of a relatively centralized planning process to determine the investments needed in generation and transmission in order to meet reliability standards in a given region and moving toward a more decentralized decision process and a greater reliance on market forces. However, there is a lot of uncertainty in the deregulated markets about the best way to maintain system reliability and provide the right incentives to get new generation and transmission built when and where it is needed. For example, in the New York City region, two out of three recent proposals for new merchant transmission lines have failed to secure financing. In addition, there is a considerable amount of ongoing uncertainty about whether or not some existing generating units will be retired and whether proposed new generating units will actually be built. Most of these decisions have been or will be determined by the financial conditions faced by the owners and the investors and their expectations about the profitability of future sales of electricity in the spot market.
Three issues relating to reliability are discussed in the following three sections. The next section explains why the amount of generating capacity needed to meet adequacy standards in New York City is relatively large. The section after that shows why the profitability of this capacity from earnings in the spot market is low and therefore why additional sources of income for generators are needed to maintain operating reliability. The section on “Filling the Financial Gap” discusses alternative ways of providing additional income for generators. The final section explains the potential limitations of the current approach adopted in New York State and the pressing need to find a more effective way to finance new generation and transmission capacity.
GENERATING CAPACITY FOR MEETING ADEQUACY STANDARDS IN NEW YORK CITY
New York City’s large size, commercial importance, and unique dependence on electricity for transportation implies
that unscheduled outages in New York City cause substantial financial losses for electricity customers. As a result, maintaining a high level of reliability for the city has always been, correctly, a major priority for system planners and regulators. This basic objective has not changed in the new deregulated market, but the financial consequences of maintaining reliability are no longer as straightforward as they were when electric utilities were fully regulated. Although financial problems of this type occur in all deregulated markets, the chosen approaches to solving the problems vary substantially from one region to another. Regulators in New York State have adopted a relatively innovative but untested way to address the problem. This approach is discussed in more detail in the following section.
The problem of maintaining reliability in New York City is exacerbated by the structure of the legacy transmission system. Since the geographic region supported by the New York Power Pool under regulation corresponded almost exactly with New York State, the supply of electricity to New York City was designed to depend heavily on transmission lines from the north through the Hudson Valley. Transmission links to adjoining power pools in the west/south and east (i.e., PJM and New England) were and continue to be relatively weak. Furthermore, the location of Long Island as an appendage to New York City adds to the concentration of load in the southeastern corner of the New York Control Area (NYCA). If the legacy transmission system had been developed at the regional level rather than at the state level, it is probable that the transmission links between New York City and New Jersey, for example, would be considerably stronger than they are now.
The overall implication of the size and location of New York City in the NYCA is that NYISO has supplemented the standard reliability criterion used by the New York State Reliability Council (NYSRC) to conform to the NERC standard for reliability. The Introduction to the current annual report by NYSRC summarizes the council’s responsibilities as follows (NYSRC, 2005, p. 1):
Section 3.03 of the New York State Reliability Council (NYSRC) Agreement states that the NYSRC shall establish the annual statewide Installed Capacity Requirements (ICR) for the New York Control Area (NYCA) consistent with North American Electric Reliability Council (NERC) and Northeast Power Coordinating Council (NPCC) standards. This report describes an engineering study conducted by the NYSRC for establishing the NYCA required installed reserve margin (IRM) for the period of May 2005 through April 2006 (Year 2005) in compliance with the NYSRC Agreement. The ICR relates to the IRM through the follow-ing equation:
ICR = (1 + IRM% / 100) × Forecasted NYCA Peak Load
NYISO will implement the statewide ICR as determined by NYSRC—in accordance with the NYSRC Reliability Rules and the “NYISO Installed Capacity” manual. NYISO translates the required IRM to an “unforced capacity” (UCAP) basis, in accordance with a 2001 NYISO filing to FERC.
In the same report (NYSRC, 2005, p. 3), the reliability criterion is defined as follows:
The acceptable LOLE reliability level used for establishing NYCA Installed Reserve Margin (IRM) requirements is dictated by the NYSRC Reliability Rules, wherein Rule A-R1 (Statewide Installed Reserve Margin Requirements) states:
The NYSRC shall establish the IRM requirement for the NYCA such that the probability (or risk) of disconnecting any firm load due to resource deficiencies shall be, on average, not more than once in ten years. Compliance with this criterion shall be evaluated probabilistically, such that the loss of load expectation (LOLE) of disconnecting firm load due to resource deficiencies shall be, on average, no more than 0.1 day per year. This evaluation shall make due allowance for demand uncertainty, scheduled outages and de-ratings, forced outages and deratings, assistance over interconnections with neighboring control areas, NYS Transmission System transfer capability, and capacity and/ or load relief from available operating procedures.
The underlying analysis of reliability in the NYSRC report (NYSRC, 2005, p. 2) is based on:
a probabilistic approach for determining the NYCA IRM requirements. This technique calculates the probabilities of generating unit outages, in conjunction with load and transmission representations, to determine the days per year of expected capacity shortages. The General Electric Multi-Area Reliability Simulation (MARS) is the primary analytical tool used for this probabilistic analysis. This program includes detailed load, generation, and transmission representation for eleven NYCA Zones—plus four external Control Areas (Outside World Areas) directly interconnected to the NYCA. MARS calculates “Loss of Load Expectation” (LOLE, expressed in days per year), to provide a consistent measure of system reliability.
The overall implication of the NYSRC report is to set the statewide IRM for 2005 to 2006 at 17.6 percent (NYSRC, 2005, p. 2). However, this criterion is found to be sensitive to the levels of installed generating capacity in New York City and Long Island, and as a result, NYISO does a supplementary analysis to determine the locational installed capacity (ICAP) requirements for these two regions, using the General Electric Multi-Area Reliability Simulation (MARS) model. Figure E-2 shows that the locational ICAP requirements are very stringent, particularly for Long Island, and it is not practical to meet the NERC standard for LOLE if the ICAP for Long Island falls below 97 percent of the peak load (NYISO, 2005a, p.8). The required levels of ICAP proposed by NYISO for 2005/2006 are 80 percent of peak load for New York City and 99 percent of peak load for Long Island (NYISO, 2005b, p. 10). These requirements are supplements to the NYSRC requirement of 118 percent of peak load for
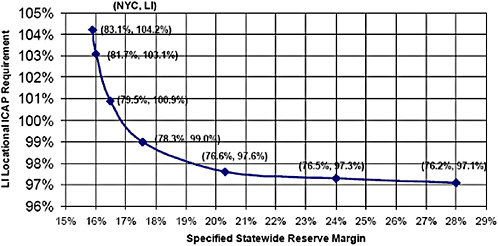
FIGURE E-2 Locational installed capacity requirements for Long Island and New York City for 2005-2006. SOURCE: NYSRC (2005).
the NYCA, and the capacity implications are summarized in Table E-1 (NYISO, 2005b, pp. 6 and 10).
The capacity requirements in Table E-1 are relatively stringent and imply that 38 percent of the total NYCA generating capacity must be located in New York City and Long Island. However, most of the inexpensive sources of generation in the NYCA (hydro, nuclear, and coal), are located upstate. The existing generating units in New York City and Long Island are relatively expensive to operate because they use oil or natural gas as a fuel. As a result, an economically efficient dispatch of generators in the NYCA loads the transmission capacity from upstate to New York City to the maximum allowed, and the capacity factors of the generating units in New York City and Long Island are relatively low. This implies that it may be difficult to maintain the desired level of reliability (i.e., “locational ICAP”) because the profitability of sales in the spot market is relatively low for many generating units in New York City and Long Island. The low profitability of these generating units is a major cause of the current uncertainty that exists about the timing of retirements and of new construction of generating units in New York City and Long Island. The issue of profitability of generating units in the New York City and Long Island regions is discussed in more detail in the next section.
THE HIGH COST OF RELIABILITY IN NEW YORK CITY AND LONG ISLAND
Effect of the Capacity Factor of Peaking Units on Cost
The standard rule for defining an economically efficient (competitive) market is that the market price paid by buyers to sellers should be equal to the highest marginal production cost. In a deregulated market for electricity, the competitive price is equal to the “short-run marginal cost” of production, defined as (the fuel cost plus the operating and maintenance cost) of the most expensive generating unit that is dispatched to meet the load in a region (under regulation, this measure corresponds to the system lambda for a merit order dispatch). In reality, most final customers in a deregulated market still pay a fixed price based on a regulated tariff rather than the spot price of electricity in the wholesale market. Generators,
TABLE E-1 Locational ICAP Requirements and Installed Capacity for NYCA in 2005-2006
|
Locality |
Forecasted Peak Load (MW) |
Locational ICAP (% of peak) |
Required Locational ICAP (MW) |
Actual ICAP (MW) |
Actual ICAP (% of peak) |
Ratio of Actual ICAP to Required |
|
New York City |
11,315 |
80 |
9,052 |
9,887 |
87 |
1.09 |
|
Long Island |
5,231 |
99 |
5,179 |
5,318 |
102 |
1.03 |
|
New York Control Area |
31,692 |
118 |
37,715 |
39,647 |
125 |
1.05 |
|
SOURCE: Derived from NYISO (2005b). |
||||||
on the other hand, are paid the spot price (or they are paid through forward contracts that reflect the expectations that traders had about future spot prices when the contracts were executed). Hence, an efficient market price covers the production costs of all units that are dispatched, but additional income to cover capital costs is only earned when the market price is higher than the marginal production cost of a generating unit. Generators that are only needed to meet peak loads on hot summer days are dispatched for relatively few hours in a year (i.e., they have very low “capacity factors”), and the ability of these units to earn sufficient income to cover capital costs is highly dependent on how often high prices above their production costs actually occur.
To understand how the capacity factor of a peaking unit affects the cost, define the average total cost as (production cost plus annualized capital cost)/megawatt-hour (MWh) generated. This definition measures the “long-run marginal production cost” conditional on the number of megawatt-hours generated. The average total cost is highly sensitive to the number of hours that a peaking unit is dispatched, and this relationship is illustrated in the following simple example. The production cost for a representative peaking unit is $60/MWh and the annualized capital cost is $85/kW.9 Using these component costs of generation, the average total cost can be written:
Average total cost = (60 + 85,000/number of hours dispatched)$/MWh
In Figure E-3, the average total costs for this representative peaking unit are shown in terms of the number of days that the unit is dispatched, assuming that it generates for 16 hours on each one of these days. The costs are shown for a range of 1 to 100 days, and the latter corresponds roughly to being dispatched every day during the summer (equivalent to an annual capacity factor of only 18 percent). The average total costs in Figure E-3 decrease rapidly from over $5,000/ MWh for 1 day to $113/MWh for 100 days. However, this latter cost would still be nearly twice as high as the competitive market price ($60/MWh) if this unit was the marginal generator. For peaking units, there is a fundamental inconsistency between the ability of generators to earn a fair rate of return on capital and the existence of economically efficient prices in the spot market. This problem is not new. There are extensive discussions in the regulatory literature about the financial implications of real-time pricing using the system lambda from a merit order dispatch to set the price.
Regulators have followed two very different approaches for dealing with this financial predicament in a deregulated market. One is to focus on the standard goal of short-run economic efficiency in the spot market and to provide some source of supplementary income for generators (the approach advocated in the northeastern states of the United States). The second is to allow high prices to occur (above the marginal production cost) and to focus on long-run economic efficiency by keeping the overall average spot price competitive (the approach followed in Australia and proposed in Texas). In the latter case, the basic rationale is that a few high spot prices will provide sufficient financial incentives to maintain generation adequacy. Experience in the Austra-lian market suggests that this rationale is correct, and average spot prices in Australia are low even though price spikes up to a cap of A$10,000/MWh (US$7,500/MWh) can and do occur (NEMMCO, 2005). In contrast, most deregulated markets in the United States set a price cap of $1,000/MWh in the spot market and have introduced ways to mitigate high spot prices, such as the Automatic Mitigation Procedures (AMP) used in the NYCA (NYISO, 2005c).
Before describing the changing behavior of spot prices in the NYCA, the question of whether or not high spot prices are economically justifiable should be addressed. Since most spot prices in the NYCA are well below $100/MWh and the highest marginal production cost for any generating unit is almost certainly less than $200/MWh, is it reasonable to allow prices to go above $5,000/MWh (the total cost of production from peaking capacity that is used for only 16 hours per year, corresponding to 1 day per year in Figure E-3)? The answer is yes, because the value of lost load (VOLL) when an unscheduled outage occurs is very high, particularly for a large urban complex like New York City. A recent study published by the Lawrence Berkeley National Laboratory (LBNL, 2004) concludes that the total cost of interruptions in electricity supply is $80 billion/year for the nation (LBNL, 2004, pp. xi-xii), and 72 percent of this total is borne by the commercial sector (plus 26 percent by the industrial sector and only 2 percent by the residential sector). The frequency of interruptions is found to be the most important determinant of the cost, because the cost of an interruption increases proportionally much less than the length of an interruption, and the cost of relatively short interruptions of only a few minutes is substantial.
The cost estimates in the LBNL (2004) report were developed from an earlier report on customer outage costs (Lawton et al., 2003), prepared for the U.S. Department of Energy’s (DOE’s) Office of Electric Transmission and Distribution. The results in the DOE report are based on a number of surveys of the outage costs for individual customers. For large commercial and industrial customers in different economic sectors, the average costs are reported for 1-hour outages in dollars per peak kilowatt (Lawton et al., 2003, Table 3-3, p. 13). These average costs range from negligible for the construction sector to $168/kW ($168,000/MWh for
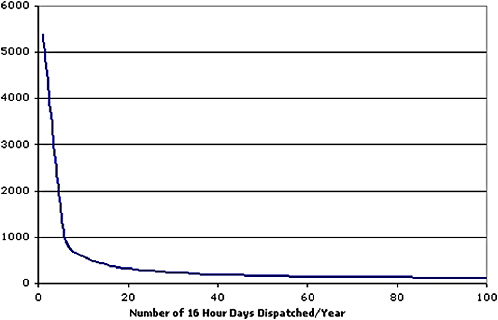
FIGURE E-3 Average total cost of production (in dollars per megawatt-hour generated) for a representative peaking unit.
a 1-hour outage) for the finance, insurance, and real estate sector, and the average cost for all sectors is $20/kW ($20,000/MWh for a 1-hour outage). Although there is much variability in the reported costs of an unscheduled outage, the overall conclusion is that the VOLL is much higher than $5,000/MWh, particularly for the finance, insurance, and real estate sector in New York City. It is interesting to note that the current NERC reliability standard of 1 day in 10 years corresponds to a VOLL of $33,333/MWh (5,000 × 16/2.4, based on the costs shown in Figure E-2), and this value is at the low end of the range of estimated values of VOLL in the DOE report.
The high level of the VOLL does not imply that all loads are equally valuable. Some types of load, such as water pumps and refrigerators, can be cut for short periods of time and cause minimal costs for customers. There are many realistic opportunities for customers to reduce load willingly when prices are high, and the main obstacles to realizing this are the lack of adequate metering and the fact that most customers still pay fixed regulated prices. Clearly, a truly efficient market would include price-responsive load, “smart” appliances, and a wide range of distributed energy resources on microgrids. Nevertheless, the VOLL is still a valid measure for an unscheduled outage, and as a result, having generating units available to meet unexpected contingencies is economically justifiable, even if these units are only dispatched for a few hours each year. The real problem for regulators is how to pay for these generating units with low capacity factors that are needed primarily to maintain operating reliability. This question is discussed in more detail in the next section, following a description of the behavior of spot prices in the NYCA after deregulation.
Spot Prices in the New York Control Area After Deregulation
Figure E-4 shows the daily spot prices in New York City after the market was first deregulated in the fall of 1999. The prices in Figure E-4 represent the zonal price for New York City in the balancing (real-time) market at 2:00 p.m. each day. During the first summer after deregulation, a number of price spikes occurred. This type of price behavior provided sufficient financial incentives for investors to initiate the licensing process for a number of new generating units. However, the summer of 2000 was exactly when the deregulated market in California became “dysfunctional,” leading eventually to an intervention in the California market by FERC in the fall. The response of regulators and politicians in the Northeast was to adopt measures to ensure that the problems experienced in California were not repeated in their own regions. High prices above the marginal production cost were treated as evidence of the exploitation of market power by
generators. (This is strictly correct in an economic sense given the standard textbook definition of a competitive market.) For example, the NYISO set a low price cap of $1,000/ MWh and eventually introduced Automatic Mitigation Procedures that made it harder for generators to justify submitting high offers above their true production costs into the spot market.
The presence of AMP, together with additional new generating capacity, more participation by loads, and other factors have resulted in fewer price spikes occurring after the summers of 2000 and 2001. This is clearly evident in Figure E-4, and the current price behavior in the spot market will probably continue. Although high price volatility is perfectly acceptable in Australia, it is highly unlikely that politicians in the Northeast, unlike Texas, will tolerate price spikes even if they actually result in lower average prices and better operating reliability. For the NYCA, this situation implies that many generating units needed for operating reliability in New York City and Long Island will not earn enough income above production costs to cover their capital costs. Given the current behavior of spot prices, additional financial incentives from other sources will be needed to maintain generation adequacy in the NYCA.
Concerns about maintaining generation adequacy are not limited to New York City or the NYCA. This problem is widespread. For example, the NERC report Long-Term Reliability Assessment (NERC, 2005, Fig. 7, p. 16) shows that the projected reserve margins published in 2001 for the na-tion were substantially higher than they had been a year earlier. However, the delays and cancellations in the construction of new generating units have resulted in lower projections published in the 2004 report that are actually lower than the corresponding low values in the 2000 report. The projections of summer capacity margins for 2005 are even lower, and fall below 15 percent by 2008 (NERC, 2005, Fig. 7, p. 18).
The changing behavior of spot prices experienced by generators in New York City since the deregulated wholesale market began is illustrated by the three average price-dura-tion curves shown in Figure E-5. The three curves are derived from the hourly zonal spot prices in New York City from May to April for 2000-2001, 2002-2003, and 2004-2005, corresponding to the standard time periods used by the NYSRC to determine the annual installed capacity requirements for the NYCA. The two curves for 2002-2003 and 2004-2005 are almost identical and consistently below the
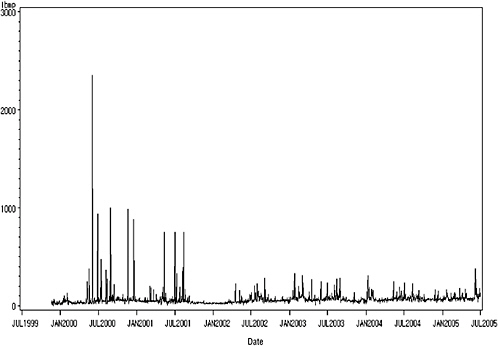
FIGURE E-4 Daily zonal spot prices ($/MWh), January 2000 to July 2005, for New York City in the balancing (real-time) market at 2:00 p.m. on the first day of each month shown. SOURCE: Derived from NYISO hourly spot prices, www.nyiso.com; accessed November 2005.
curve for 2000-2001 over the truncated range of hours shown in Figure E-5. An important additional point is that the effect of suppressing price spikes after 2000-2001 did not lower the annual average spot price. The annual average spot prices are $57.47/MWh, $59.81/MWh, and $67.96/MWh for 2000-2001, 2002-2003, and 2004-2005, respectively. The lowest average price occurred in 2000-2001, and the average price-duration curve for 2000-2001 eventually crosses the other two curves if the horizontal axis is extended beyond 1,000 hours. For example, comparing 2000-2001 and 2004-2005, the two curves cross at 3,042 hours (equivalent to a capacity factor of 35 percent), and for higher capacity factors, the prices are eventually $10/MWh lower in 2000-2001 than they are in 2004-2005. Although there is no guarantee that the relationship between average prices and price spikes will behave this way, there is also no reason to assume that higher or more frequent price spikes must lead to higher average prices.
Each average price-duration curve in Figure E-5 is computed by ranking the hourly spot prices from highest to lowest, and for any given number of hours N (the horizontal axis), the corresponding price in dollars per megawatt-hour (vertical axis) measures the average spot price for the N hours with the highest prices. In other words, this average price is the average revenue received by a generator from a generating unit in New York City if it was dispatched for the N hours with the highest spot prices in a year (note that this definition of a “duration curve” is not the same as the one used to derive a load duration curve, because the latter is simply a ranking of the hourly loads and it does not measure the average load for the N hours with the highest loads). For a generator in New York City, each average price-duration curve in Figure E-5 represents the average revenue curve that corresponds to the average total cost curve shown in Figure E-3.
It is clear from a comparison of Figures E-3 and E-5 that the shape of the average price-duration curve in 2000-2001 is much closer than the other two curves are to the shape of the average total cost curve in Figure E-2, particularly when the number of hours is close to zero. (Note that the horizontal axis in Figure E-2 corresponds to a range of 16 to 1,600 hours.) The basic reason for the change after 2000-2001 is that price spikes were higher and more frequent in 2000-2001. For generators in New York City, the revenues received from sales in the spot market in 2000-2001 were far more consistent with their average total costs than they have
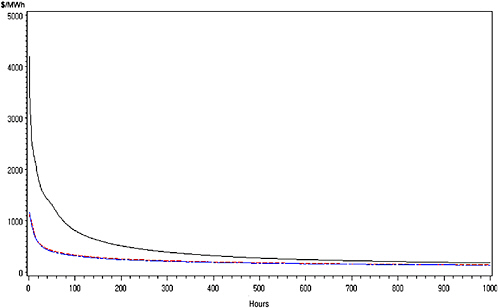
FIGURE E-5 Average price-duration curves in the balancing market for May-April in New York City (in dollars per megawatt-hour) for 2000-2001, 2002-2003, and 2004-2005. SOURCE: Derived from NYISO hourly spot prices, www.nyiso.com; accessed November 2005.
been in more recent years, when fewer price spikes occurred. To get more insight into the conclusions of this section, it is helpful to look at the annual capacity factors of the major generating units in New York City and Long Island. This information is presented in Table E-2, using 2004 data from the NYISO (2004) and covers roughly half of the generating capacity required in New York City and Long Island to meet reliability standards (see Table E-1).
The power plants shown in Table E-2 all have generating units with a total capacity greater than 80 MW, and most of the remaining generating units in New York City and Long Island are small turbines of various types that use natural gas or distillate oil as a fuel. Only 4 of the 13 power plants in Table E-2 have capacity factors above 50 percent. The two plants with the highest capacity factors (more than 85 percent) are relatively new combined-cycle generators (No. 8 and No. 10), the next highest (No. 11) is a relatively new cogeneration unit with a capacity factor of 74 percent, and the fourth highest (No. 5), with a capacity factor of 55 percent, is the only traditional steam turbine among the four. With one exception (No. 6), the other power plants in Table E-2 are relatively old steam turbines, and their capacity factors range from 9 percent to 41 percent. The low capacity factors of these plants confirm the fact that the production costs of traditional steam turbines that use natural gas or residual oil are substantially higher than the costs of the combined-cycle units (and purchases from upstate).
Since a large number of the installed generating units in New York City and Long Island are relatively old units, with high production costs and low capacity factors, there is a legitimate concern about the continued financial viability of these generating units and whether some of them will be retired in the near future. This concern has been exacerbated by the changes in the behavior of spot prices shown in Fig-ure E-5. Comparing the average price-duration curves in 2004-2005 and 2000-2001, the average price paid to generating units with high capacity factors (>>66 percent) increased by roughly $10/MWh. In contrast, the average price paid to generating units with low capacity factors (<<33 percent) fell dramatically, but these units (or their replacements) are still essential for maintaining the operational reliability of supply in New York City and Long Island. Nevertheless, the VOLL is very high (probably more than 100 times the average spot price), and it is still economically rational from the perspective of society as a whole to maintain a high level of operational reliability and to meet the NERC standards of limiting outages to less than 1 day in 10 years.
The underlying economic problem is that the spot prices in a strictly competitive market are not high enough to cover the total cost of the generating units with low capacity factors that are essential for maintaining operating reliability. In other words, the current financial incentives in a competitive market are insufficient to keep installed generating units with high production costs active in the market or to attract investors to build new generating units to replace them. Although current spot prices in 2004-2005 are probably closer to competitive levels than they were in 2000-2001, the textbook definition of a competitive market simply ignores the reliability of supply as an issue. The discussion in the next section explains how regulators have addressed this fundamental inconsistency between the market signals from a competitive spot market and the legitimate objective of
TABLE E-2 The Capacity Factors in 2003 of Major Generating Units in New York City and Long Island
|
Name |
Zone |
Unit and Fuel Typea |
Summer Capacity (MW) |
Generation (GWh) |
Capacity Factor (%)b |
|
LI |
ST FO6/NG |
1,765 |
4,751 |
31 |
|
LI |
ST NG/FO6 |
390 |
1,336 |
39 |
|
LI |
ST NG/FO6 |
107 |
264 |
28 |
|
LI |
ST NG |
238 |
545 |
26 |
|
LI |
ST NG/FO6 |
1,539 |
7,507 |
55 |
|
LI |
GT/FO2 |
245 |
306 |
14 |
|
LI |
ST FO6/NG |
385 |
1,399 |
41 |
|
LI |
CC NG/FO2 |
136 |
1,069 |
89 |
|
NYC |
ST FO6/NG |
304 |
543 |
20 |
|
NYC |
CC NG/FO2 |
262 |
1,983 |
86 |
|
NYC |
GT/NG |
661 |
4,286 |
74 |
|
NYC |
ST FO6/NG |
882 |
2,629 |
34 |
|
NYC |
ST NG/FO6 |
860 |
675 |
9 |
|
aST, steam turbine; CC, combined-cycle turbine; GT, combustion turbine; NG, natural gas; FO6, residual oil; FO2, distillate oil. bCapacity factor = 100 × generation/(365.25 × 24 × summer capacity/1,000). SOURCE: Derived from NYISO (2004a), Table III-2). |
|||||
maintaining operating reliability. In this discussion, it is important to distinguish the differences in the financial needs of the existing generating capacity with high production costs and low capacity factors from the needs of new generating capacity, such as combined-cycle units, with high capacity factors. Both types of capacity can contribute to maintaining operating reliability, but their financial needs are not the same, and it is unlikely that a single strategy will be the best solution for solving both problems.
FILLING THE FINANCIAL GAP TO MEET RELIABILITY STANDARDS
Before discussing the alternative ways of supplementing the earnings of generators from the spot market for electricity, it is important to reiterate the three major regulatory assumptions that underlie the need for additional income to maintain operating reliability in the NYCA. First, setting a level of generation adequacy for the NYCA is an acceptable proxy for meeting the NERC standards for reliability (see the section on “Determining and Implementing the Reliability Standards” above). Second, given the limitations of the legacy transmission system, the locational requirements for generation capacity in New York City and Long Island determined by the NYISO are also acceptable proxies for meeting the NERC standards (see the section above titled “Gen-erating Capacity”). Third, the political realities in the NYCA make it infeasible to adopt the Australian solution of allowing high price spikes in the spot market above short-run competitive prices (see the preceding section). By accepting these assumptions, the very real complications of determining how to plan for and maintain the reliability of supply have been reduced by the regulators to simply ensuring that requirements for generating capacity in New York City, Long Island, and the NYCA are met.
Clearly, this transformation of concerns about the reliability of supply to concerns about generation adequacy is more likely to be an economically efficient solution when the transmission system is relatively robust and the availability of generating capacity is the main limiting factor. This is no longer the case in the NYCA given the structure of the legacy transmission system and the size and location of New York City. Nevertheless, regulators have accepted the assumption that meeting capacity requirements in New York City, Long Island, and the NYCA is an effective strategy for meeting the NERC reliability standards. By focusing on generation adequacy, it is likely that the current regulatory practices followed in the NYCA, and the models used to determine the required levels of reserve margins for generating capacity, overlook the potential value of upgrades to the transmission system as a way to improve reliability.
By adopting the three assumptions stated above about reliability, state regulators have limited their primary concerns about the performance of the deregulated market to the dual objectives of maintaining (1) generation adequacy and (2) short-run competitive spot prices. Consequently, it is inevitable that the earnings from some generating units needed for operating reliability will be insufficient to make them financially viable. There are two distinctly different ways of addressing this problem. The first is to “correct” the prices in the spot market for all generating units by providing additional income from another source to cover the “missing” capital costs. The second is to use targeted contracts, such as Power Purchase Agreements (PPAs), to meet reliability standards with some but not all generating units. Regulators in New York State have chosen the first approach. Their basic rationale is that this strategy is consistent with regulatory theory and is economically fair both for the owners of installed generating capacity and for potential investors in new capacity. In contrast, contracts with some but not all generators are inherently discriminatory and may distort market behavior in an adverse way. These arguments are basically correct using standard textbook economics, but this fact still does not guarantee that the approach chosen by state regulators for maintaining reliability in the NYCA will be either effective or economically efficient. The characteristics of a market for electricity are not typical because, unlike storage alternatives for most commodities, the ways of storing electricity economically are very limited. As a result, the beneficial effects of having an inventory to cover shortages in the spot market are also very limited in electricity markets, and in general, the amount of generation must balance the level of load at all times.
Oren (2003) has given a persuasive account of the economic rationale for adopting the strategy chosen by regulators for the NYCA, and his justification is consistent with the analyses of real-time pricing in the regulatory literature. Short-run competitive spot prices imply that only the production costs of peaking units will be covered in the spot market. Consequently, the cost of capital for a peaking unit should be added to the competitive spot price for all generators to get the “correct” price (long-run marginal cost of production). A straightforward solution to this problem is to include an expensive source of energy with no capital costs in the portfolio of supply options. The obvious choice is to treat shedding load as a source of energy that is valued at the VOLL. Since the VOLL is very high, this strategy is equivalent to the Australian solution of allowing high price spikes. Joskow and Tirole (2003) have made the same argument as Oren (2003) in their analysis of how to make deregulated markets work better with fewer nonmarket interventions by regulators. They conclude that the current form of deregulated market will not lead to merchant investment in new generating capacity because (1) price caps are too low, and (2) most retail customers do not respond to high spot prices because they are still paying fixed regulated rates instead of the real-time spot prices.
If price spikes in the spot market are not politically ac-
ceptable, one approach is to cover the missing capital costs for peaking units in a separate market for generating capacity. This is the approach that has been proposed by regulators in the three northeastern power pools. At this time, the NYISO is the only one of the three to fully implement this type of capacity market. There is still a considerable amount of political opposition to the proposal in New England, and there is an ongoing debate about it among stakeholders in PJM. It is important to understand why there is so much controversy about the effectiveness of a capacity market as a way of providing the incentives needed to initiate merchant investment in new generating capacity.
Initially, the ICAP auction run by the NYISO was simply a market for availability, designed to ensure that enough installed generating capacity would be available to meet the projected loads in New York City, Long Island, and the NYCA. (It should be noted that the Australian market does not have markets for either capacity or reserves because the financial consequences for generators of missing a price spike are so severe if their units are unavailable.) In general, an ICAP auction does provide an additional source of revenue for generators that may be significant for the continued financial viability of some installed generating units with low capacity factors. For example, the existence of the ICAP auction may result in some units being available instead of unavailable, and it may also delay the retirement of some units. However, this extra revenue from the ICAP auction is really a bonus for other generating units, such as nuclear and hydro units, because they would be available anyway without the ICAP auction. Nevertheless, regulatory theory implies that all installed capacity should be eligible for participation in the auction, and this issue is not a major source of controversy among regulators. The controversy arises when the objectives of the ICAP auction are extended to deal with the investment needed for new generating capacity.
There are three major issues of contention about the effectiveness of extending the ICAP auction to new capacity. The first is the difficulty of increasing the time horizon far enough into the future to meet the needs of investors. The second is whether it is appropriate to pass the responsibility for maintaining generation adequacy on to load serving entities (LSEs), and, most importantly, the third is how to ensure that enough revenue is provided in the ICAP auction to make investment in new capacity financially attractive. These issues are discussed after the following description of how regulators expect the augmented capacity market to work in the NYCA.
The economic justification underlying the current structure of the capacity market in the NYCA was established by Reeder (2002), and a detailed description of this market is given in Chapter 5 of the NYISO “Installed Capacity Manual” (NYISO, 2004a). The basic structure of the market is that buyers (LSEs) submit bids to buy and generators submit offers to sell into a two-sided auction for generating capacity over a 6-month summer or winter period (a “capabil-ity period”). There is no guarantee in this type of auction that the quantity of capacity purchased will be sufficient to meet reliability standards, but regulators have imposed an obligation on the LSEs to purchase enough capacity to meet their load plus a reserve margin before the spot market for energy clears. This can be done through secondary trading in auc-tions for capacity over 1-month periods (i.e., making it possible to divide a 6-month strip into its 1-month components) or by bilateral contracts made over the counter between an LSE and a generator. LSEs can also meet some of their own capacity requirements if these sources are certified by the NYISO. The final monthly auction is the “spot” market for capacity that clears a few days before the month begins. The spot ICAP auction represents the last chance for LSEs to meet their capacity obligations without paying a penalty.
Initially, the ICAP auction in the NYCA was only designed to deal with the availability of generating capacity for a few months ahead. In contrast, an investor in a new generating unit probably needs to have a forward contract for energy for at least 10 years to get adequate financing. Hence, the first issue of contention about ICAP auctions is how to extend the auction farther into the future. Although regulators recognized this issue as an important objective, a major limitation is that LSEs are generally reluctant to commit to long-term contracts. The basic concern of LSEs is that it is difficult, given the regulatory push toward retail competition, for an individual LSE to predict how many customers it will have in the future, and therefore, how much capacity it needs to purchase. The compromise between the needs of LSEs and generators is to extend the ICAP auction from 1 to 3 years into the future. For an investor, the new auction does provide more information about the likely future levels of income from the capacity market, but a decision to build a new generating unit will still depend on getting a forward contract for a longer time period. Given the relatively short time horizon for contracts in the ICAP auction (and in existing forward markets for electricity, such as the New York Mercantile Exchange [NYMEx]), long-term bilateral contracts (i.e., PPAs) will still be needed to get new generating capacity built. Basically, it is unrealistic to expect ICAP auc-tions to solve the problem of the long time horizon needed for an investment in new generating capacity.
The second issue of contention is the current regulatory strategy of placing the responsibility for maintaining generation adequacy on LSEs. Since generation adequacy in a region is specified in terms of the projected load, the public-good characteristics of reliability are converted implicitly to a criterion based on a private good. Markets and decentralized decision making can work well for private goods, and as a result, regulators have decided to leave the responsibility for determining how to meet reliability standards, such as generation adequacy, to market forces. This decentralization is similar to the cap-and-trade strategy used in a market for
emissions. Regulators set the standards for generation adequacy for each LSE, but the decisions about how to meet these standards are left to the market. LSEs have to purchase enough capacity from generators, or provide it themselves, to meet their capacity obligations.
When levels of installed capacity are low relative to load, it will be harder for LSEs to find generators that are able to contract with them. Consequently, the price of purchasing capacity from generators will increase and may be very high indeed for an LSE that is short of capacity close to real time. Although an LSE is not obligated to have full capacity coverage until the final spot ICAP auction, it may be very risky to wait until the last minute to purchase the capacity needed to meet its capacity obligations. A retailer caught in this predicament might be tempted to drop customers rather than pay the high price required to get full capacity coverage. In this situation, an incumbent utility that still has the regulatory obligation of meeting load would be required to pick up the discarded customers and pay the high price for additional capacity. However, if there really is insufficient installed capacity to meet generation adequacy in the near future, it is unlikely that there would be enough time to build new capacity. Under the Energy Policy Act of 2005, NYISO would have to shed some load when capacity shortages occur to avoid paying penalties enforced by FERC. In other words, the market signals would come too late to ensure that adequacy standards were met without shedding load. This is a very serious deficiency of the ICAP auction, but regulators have anticipated this problem and introduced a “demand curve” into the capacity auction to address it.
The demand curve is designed to address the third issue of contention and to ensure that the revenue from the ICAP auction is sufficient to make a timely investment in new generating capacity financially viable. The proposed solution originates with the basic deficiency of a competitive market identified in the regulatory literature. The bids of LSEs in the spot ICAP auction are replaced by a specified demand curve (set by regulators). The spot ICAP auction is not like the balancing market for energy because it includes all existing contracts on the supply side of the auction. For each location, the demand curve is calibrated to the total capacity requirement for that location, and it ensures that the market price of capacity is equivalent to the capital cost of a peaking unit when the total supply of capacity falls to the amount needed for adequacy. The market price will be higher (lower) if the total capacity offered is lower (higher) than the required amount. There are additional features of the NYCA auction, such as how capacity is measured and whether the demand curve should have a kink in it, but the overall objective is clear. The market price of capacity in the spot ICAP auction should be equivalent to the capital cost of a peaking unit when the market is economically efficient (i.e., the total supply of capacity in the spot ICAP auction is just equal to the capacity needed for adequacy).
Incorporating a demand curve into the spot ICAP auction still does not solve the basic financial problem faced by an investor looking for a long-term contract. To address this problem, the parameters of the demand curves are set for the next 3 years. Even though the actual ICAP auctions are conducted a few months ahead in the same way as before, investors now know that the future ICAP auctions, up to 3 years ahead, will converge to the specified demand curves. In fact, the information provided by the modified ICAP auction is more valuable than this because the economic rationale for setting the demand curve is known. As long as the total capacity supplied in each spot ICAP auction is close to the capacity required for adequacy, a prospective investor will be able to recover the annualized capital cost of a peaking unit from the ICAP auction.
The main weakness of this argument is that it is difficult for anyone to predict future levels of available capacity because some of the capacity requirements may be self-supplied by LSEs and the retirement dates of generating units are considered to be private information in a deregulated market. The overall result of these uncertainties is that the projected levels of future reserve margins published annually by NYISO in Power Trends (NYISO, 2005d) and Load and Capacity Data (NYISO, 2004) are no longer as accurate as they were under traditional regulation. An investor cannot take the NYISO predictions at face value. Even if the exact specifications of the demand curve in the modified ICAP auction are known, there is still a substantial amount of uncertainty about the future market price of capacity due to the uncertainty about future levels of installed capacity. Although the demand curve does provide more security about the future revenue stream from a capacity market (by reducing the price volatility and mitigating the boom-or-bust cycles that typically occur in an ICAP auction), there is still a lot of risk for investment decisions. For any investor, having a demand curve in the spot ICAP auction does not provide an effective substitute for having a long-term PPA. The demand curve may be an effective way of keeping some generating units with low capacity factors in the energy market, but it is unlikely to be an effective way of getting new generating units built when and where they are needed.
A more pragmatic criticism of the ICAP auction is that the higher payments to generators for capacity do not place any obligations on the generators to build new capacity. When the spot prices are consistent with short-run competitive behavior, generators do need to earn additional income to initiate an investment in new capacity. However, paying this extra income to all generators for installed capacity in the ICAP auction is expensive, and it still does not guarantee that generation adequacy will be maintained. The obvious solution proposed by most critics of ICAP auctions is to issue PPAs when projected future levels of capacity fall short of the required standards. If this were done, there would be contracts to build capacity when and where it was needed, but it might be necessary to pay the investors a substantial premium above the expected income that could be earned in
the energy, reserve, and capacity markets. Issuing a PPA in this way no longer would be a decentralized decision based on market forces. Some regulatory authority must make the initial decision about the size and location of the PPAs. Once this has been done, the responsibility for implementing and paying for the PPAs can be allocated to the LSEs. In essence, the locational-capacity obligations set by regulators for LSEs in the existing ICAP market would be supplemented by obligations for acquiring new capacity when projected levels of installed capacity do not meet the levels of generation adequacy needed to maintain reliability.
Critics of the critics of ICAP auctions argue that issuing PPAs would put the market on a slippery slope back to regulation. When a premium is paid in a PPA, it is equivalent to putting a financial squeeze on the owners of installed capacity. As a result, some generating units may be retired prematurely, increasing the need for new capacity or some form of PPA to keep installed capacity in the market. In other words, once decisions about building new capacity were centralized, many generators would want to get special deals. To avoid an undermining of the implicit fairness of the ICAP auction, it would be necessary for regulators to set rules for determining (1) when to issue PPAs for new capacity and (2) which installed generating units would be eligible for a PPA. For example, the rules could require initiating PPAs (1) for new capacity when the reserve margin forecasted by the NYISO fell below a specified amount on a specified future date, and (2) for installed capacity when the capacity factor of a unit fell below a specified level and the unit was still needed for reliability. Contracts of this type for Reliability-Must-Run (RMR) units are common in the industry now, and the only real change required would be to specify an explicit set of rules for how and when new PPA or RMR contracts would be authorized by the regulators.
The uncertainty that exists about how reliability standards will be maintained in deregulated markets has contributed to a substantial level of “regulatory risk” faced by investors. Regulatory risk implies that high rates of return on capital will be required for merchant investments in deregulated markets if there is a lack of clarity about existing rules and the possibility of future rule changes. This situation constitutes a major impediment to investment in new capacity that was not present when the rate of return was guaranteed under regulation. For an investor in the NYISO market, having a PPA would be a good substitute for a regulated rate of return if the possibility of a default was minimal. Since the time horizon in the ICAP auction is too short to commit to building new capacity, an investor will still want to have a PPA with some credit-worthy buyer. However, an inherent characteristic of transferring the responsibility for generation adequacy from regulators to decentralized decisions by LSEs would be to require that investors contract with LSEs. The reluctance of most LSEs in the New York Control Area to make long-term contracts is justifiable and reflects the real uncertainty that they face about future market conditions. Hence, the risk premium for making a PPA with an LSE will be substantial and the resulting cost of capital will be high. Under these conditions, a large part of the regulatory risk is caused by the uncertainty that exists about how defaults will be treated if, for example, a retailer holding a PPA files for bankruptcy.
One way to reduce the regulatory risk of a PPA between an investor and an LSE is to have the contract backed by regulators. This situation is, however, essentially equivalent to having the PPA initiated by the regulators in the first place. To avoid getting too much capacity built, a PPA would have to be certified as necessary for generation adequacy. The decision about how much new capacity should be built would no longer be left to decentralized market forces. The overall conclusion is that the NYISO ICAP auction does not provide a secure enough source of extra income far enough into the future to meet the needs of investors. In addition, it places no obligations on generators to spend the extra income on building new capacity. The threat that LSEs will have to pay penalties if they fall short of their capacity obligations is unlikely to be effective. As long as spot prices remain at short-run competitive levels in the electricity market, it will be difficult and expensive to get LSEs to bear the financial risk of building new capacity without some form of regulatory backing. The evidence presented in the next section about how standards of generation adequacy are being met in the NYCA suggests that this conclusion is correct. Most of the existing proposals to build new generating units were initiated when price spikes occurred in the energy market (2000-2001), and many of these projects have been postponed now that electricity prices are more competitive.
CURRENT PROSPECTS FOR MAINTAINING GENERATION ADEQUACY IN THE NEW YORK CONTROL AREA
The financing of new generation and transmission facilities in the NYCA—regardless of whether it is needed to accommodate the retirement of existing facilities, the projected growth of load, or the intentional shutdown of Indian Point Units 2 and 3 before the end of their current licenses—must be understood within a broad context associated with the current hybrid mix of competitive markets and regulatory interventions. Under this mix, projects to build new generation and transmission facilities are no longer preapproved by the New York Public Service Commission (NYPSC), nor is there an implicit guarantee to investors that all prudent production costs and capital costs will be recovered from customers. Although market forces have been able to maintain levels of generation adequacy with relatively little regulatory intervention in Australia, for example, this is not the case in the NYCA.
The previous section above explains why the successful efforts of regulators to ensure that the spot prices of electricity meet short-run standards of economic efficiency have un-
dermined the financial viability of generating units that are needed for reliability but have low capacity factors. This policy has made the current shape of the price-duration curve much flatter than it was in 2000-2001 (see Figure E-5), and as a result, has reduced the earnings of generating units with low capacity factors (peaking units) relative to units with high capacity factors (baseload units). The flattening of the price-duration curve, coupled with the current uncertainty about the future prices of fossil fuels such as natural gas, has led to delays in the construction of new generating facilities that have already received licenses to build in the NYCA.
Fortunately, the deteriorating outlook for attaining the required levels of generation adequacy for meeting the NERC standards for reliability in the NYCA after 2008 has been recognized in the new Comprehensive Reliability Planning Process (CRPP). This planning process was initiated in 2005, and there is still enough time for regulators to find solutions for meeting reliability standards in the NYCA. However, at this particular time, potential solutions are still being discussed, and no specific solution has been chosen. This situation makes the task of this committee more difficult because it is necessary to propose a realistic plan for building new generating facilities to meet reliability standards before the alternatives to Indian Point can be evaluated. A detailed discussion of the scenarios specified by the committee and the corresponding results are presented in Chapter 5 of this report.
The change in the outlook for meeting reliability standards in the NYCA is best summarized by the drop in projected reserve margins for generating capacity from the forecast made in 2004 to that in 2005, shown in Figure E-6. In NYISO’s 2004 report, the reserve margin in 2008 was expected to be over 40 percent, but in the 2005 report, the current projection for 2008 is less than the 18 percent needed to meet the NERC reliability standards.
The drop in the projected reserve margins shown in Fig-ure E-6 was caused by delays in the construction of new generating units that had already received construction licenses. The lists of new generating units that correspond to the two projections of reserve margins in Figure E-6 are shown in Tables E-3 and E-4 for 2004 and 2005, respectively. The two lists are essentially the same, but the “Pro-posed In-Service” dates are quite different. In 2004 (Table E-3), 2,038 MW were under construction; 3,120 MW were
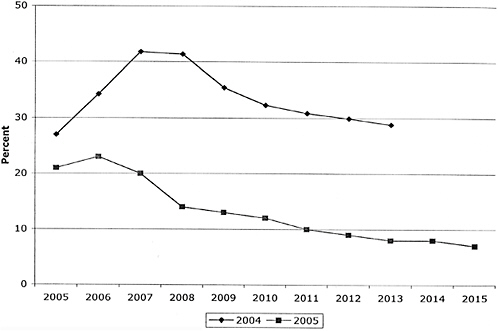
FIGURE E-6 Projections made in 2004 and 2005 of the summer reserve margin for generating capacity in the New York Control Area. SOURCE: Projections made in 2004 from Table V-2, “Load and Capacity Schedule” in NYISO (2004b); those made in 2005 from Table 7.1, “Load and Capacity Table,” in NYISO (2005d).
TABLE E-3 New Generating Units Proposed for the NYCA in 2004
|
|
|
SOURCE: NYISO (2004b). |
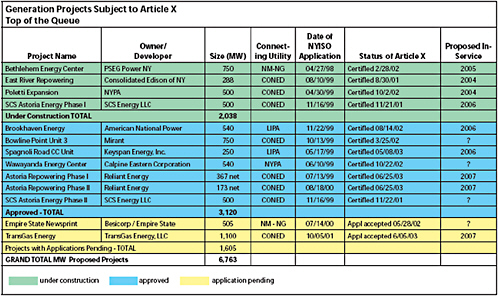
approved; and 1,605 MW had applications pending, for a total of 6,763 MW. In 2005 (Table E-4), the amount of capacity under construction was still 2,038 MW, but none of the other nine projects had proposed in-service dates. In 2004, five of the nine projects had proposed in-service dates no later than 2007, and the dates for the other four units were uncertain. The important implication is that it is no longer realistic under current economic conditions to assume that a generating unit will be built after regulators have approved a license for construction. This was typically not the case under regulation.
The importance of reliability has also been recognized in the Energy Policy Act of 2005, and the major effect of this legislation is to give FERC the overall authority to enforce reliability standards throughout the Eastern and Western In-ter-Connections. Although it is still too early to know how this new authority will be implemented by FERC, it is clear that the threat of paying penalties will be a tangible reason for regulators in New York State to make sure that reliability standards are met. In addition, if the required levels of generation adequacy are not maintained, the possibility that some load will have to be shed to maintain adequate capacity margins will be unpopular with politicians and the public. Hence, it is highly likely that state regulators will deal with the current problem of inadequate generating capacity in the NYCA.
When the uncertainty about the retirement dates of existing generating units is combined with the uncertainty about whether new generating units will be built, the task faced by state regulators, ensuring that there is enough installed generating capacity to meet FERC’s reliability standards, is very challenging. Nevertheless, reliability standards must be met because, as explained in the section on “The High Cost of Reliability,” above, the cost of blackouts in a dense urban area like New York City is very high. (The value of lost load is over $10,000/MWh compared with typical spot prices of less than $100/MWh.) It is also clear that the regulatory practices in the NYCA existing prior to the CRPP and the Energy Policy Act of 2005 were not entirely satisfactory. During public meetings held by this committee, it was unclear what responsibilities the different regulatory organizations had for ensuring that reliability standards in the NYCA are met. Both the New York Public Service Commission and the Northeast Power Coordinating Council (NPCC) are required to confirm that NYISO’s plan for meeting projected levels of load will meet reliability standards. However, the main problem identified by the Indian Point committee was that there were no standard procedures for determining how deficiencies in a plan would be corrected. According to Michael Forte, Chief Engineer for Planning at Consolidated Edison, addressing the committee, “Reliability trumps economics,” and in his view a transmission provider such as Consolidated Edison
TABLE E-4 New Generating Units Proposed for the NYCA in 2005
|
|
|
SOURCE: NYISO (2005d). |
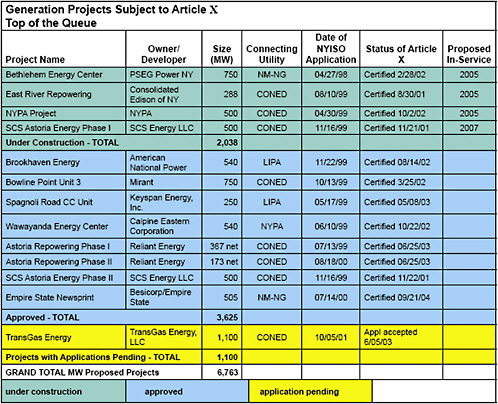
must focus on reliability. However, Howard Tarler (NYPSC) stated that load serving entities and energy service companies are responsible for maintaining the levels of generating adequacy needed for reliability. Until the lower projections of capacity margins were published in the CRPP report in September 2005, it seems that most state regulators believed that the existing regulatory practices were working well and that reliability standards would continue to be met.
Merchant generation and transmission projects are difficult to finance under current economic conditions. According to the chairman of the NYPSC, “Merchant transmission projects are currently experiencing financing difficulties due to uncertainty about cost recovery by non-utility providers” (Flynn, 2005). Carl Seligson, a Wall Street financier, made the same point in his presentation of March 15, 2005, to the committee when referring to his “three Rs rule”: Risk Requires Return! He also stated that a better way to finance utility projects is to follow the practices currently used in Iowa State.10 Under this scheme, regulators and investors agree in advance of the construction on an explicit set of rules for recovering costs from each new project. This is a transparent process that reduces the financial risk for investors and lowers capital costs. The process is consistent with issuing a Power Purchase Agreement for a new generating facility that has regulatory backing, and could include per-formance-based rates of return. In contrast, there is a perception among some investors that state regulators in the NYCA may change the rules for a standard PPA that is initiated as a
bilateral contract, and in particular, may try to recover “prof-its” from incumbent utilities holding a PPA for a successful contract but provide no compensation for “losses.” To the extent that this perception is correct, the possible asymmetry in the treatment of profits and losses increases the regulatory risk faced by investors.
In summary, getting sufficient financing for the capital-intensive investments in a new generation or transmission facilities needed to maintain the reliability of supply in the NYCA requires state regulators to address the following issues:
-
Long-term PPAs and other contracts need a projected revenue-stream that will cover the production costs and support the recovery of the initial capital cost with a reasonable rate of return.
-
A regulatory commitment is needed to establish and abide by explicit rules governing long-term PPAs and other contracts.
-
Credit-worthy counterparties are needed for investors initiating long-term PPAs and other contracts to build new facilities, or as an alternative, some regulatory backup to deal with defaults on contracts.
-
Increased regulatory consistency is needed for expediting the siting and licensing of new facilities at the state and local level. (Note that the Article X law, which facilitated this process, expired in 2002. A variation of the Article X law was introduced in the New York State Legislature in 2005 but was never enacted.)
-
More emphasis is needed on the importance of upgrading transmission facilities (current regulatory practices and the models used for analysis treat generation adequacy as the main issue for maintaining reliability and do not address transmission adequacy effectively).
-
Appropriate roles should be established for the New York Power Authority and the Long Island Power Authority to determine the best way for these authorities to help maintain reliability standards. (These two public authorities control substantial amounts of generation and transmission capacity in New York City and Long Island. In the past, these authorities have been used to intervene in the market by, for example, installing 500 MW of peaking capacity in New York City. These types of decisions are not part of the standard planning process in the NYCA, and as a result, they create an additional source of regulatory risk for investors.)
REFERENCES
Adams, K. (Maine Public Utilities Commission, Augusta). 2005. Personal communication.
Anderson. 2004. “Analyzing Strategic Interaction in Multi-settlement Electricity Markets: A Closed-loop Supply Function Equilibrium Model.” Ph.D. Thesis, Harvard University, Cambridge, Mass.
Flynn, William. 2005. Remarks to the Regulatory Research Associates. Available at http://www3.dps.state.ny.us/pscweb/WebFileRoom.nsf/ Web/E91F23D5E60C38BB85256FF50046489B/$File/RRA _Presentation_April_26_2005.pdf?OpenElement. Accessed May 2006.
Geddes, R.R. 1992. “A Historical Perspective on Electric Utility Regula-tion.” The Cato Review of Business and Government. Available at https://www.cato.org/pubs/regulation/reg15n1-geddes.html.
Higley, C. 2000. “Disastrous Deregulation.” Public Citizen. Washington, D.C.
Horton, W.J. 2002. “Generation Market Slams on Brakes.” Engineering News-Record, September 16. See http://www.enr.com.
Joskow, Paul, and Jean Tirole. 2003. Reliability and Competitive Electricity Market. Working Paper 129, University of California Energy Institute. April.
Lawton, Leora, Michael Sullivan, Kent Van Liere, Joseph Eto, and Aaron Katz. 2003. A Framework and Review of Customer Outage Costs: Integration and Analysis of Electric Utility Outage Cost Surveys. November.
LBNL (Lawrence Berkeley National Laboratory). 2004. Understanding the Cost of Power Interruptions to U.S. Electricity Customers. Prepared by Kristina Hamachi LaCommare and Joseph H. Eto. Berkeley, Calif. Sep-tember.
Logan, D.M. 2002. “Generation and Transmission Industry Trends.” Presentation at the IEEE Summer Power Meeting, Chicago, July 24, 2002.
Lyon, T.P., and J.W. Mayo. 2000. “Regulatory Opportunism and Investment Behavior: Evidence from the U.S. Electric Utility Industry.” Kelley School of Business, Indiana University, and McDonough School of Business, Georgetown University.
Nelson, C.R., and S.C. Peck. 1985. “The NERC Fan: A Retrospective Analysis of the NERC Summary Forecasts.” Journal of Business and Economic Statistics, Vol. 3, No. 3 (July), pp. 179-187.
NEMMCO (National Electricity Market Management Company). 2005. 2005 Annual Report. Melbourne, Australia: NEMMCO. See http:// www.nemmco.com.au/nemgeneral/000-0205.pdf.
NERC (North American Electric Reliability Council). 2005. Long-Term Reliability Assessment. Princeton, N.J.
NYISO (New York Independent System Operator). 2004a. 2004 Load and Capacity Data. Revision 5.1.1, August 24, 2004. Schenectady, N.Y.
NYISO. 2004b. Power Trends 2004. Schenectady, N.Y. April.
NYISO. 2005a. Comprehensive Reliability Planning Process. Draft Reliability Needs Assessment. Schenectady, N.Y. September 1.
NYISO. 2005b. Locational Installed Capacity Requirements Study, Covering the NYCA for the 2005-2006 Capability Year. Schenectady, N.Y.
NYISO. 2005c. “Attachment H of the FERC Electric Tariff Market Power Mitigation Measures.” Schenectady, N.Y. February.
NYISO. 2005d. Power Trends 2005. Schenectady, N.Y. April.
NYSRC (New York State Reliability Council). 2005. NYCA Installed Capacity Requirements for the Period May 2005 Through April 2006. Albany, N.Y.
Oren, Shmuel S. 2003. Ensuring Generation in Competitive Electricity Markets. Working Paper 007, University of California Energy Institute. June.
Potts, J. 2002. “Power Loss” (a review of The Origins of Deregulation and Restructuring in the American Electric Utility System, by Richard F. Hirsh). Harvard Law Review 26(1):269-280.
Rebellon, P. 2002. “Deregulated Electricity Markets—An Introduction.” Presentation to the IEEE Hamilton Section, Hamilton, Ontario, June 28, 2002.
Reeder, Mark. 2002. Government Intervention into Wholesale Electric Markets to Assure Generation Adequacy. Albany, N.Y.: New York State Department of Public Service. November.
Schuler, R.E. 2001. “Electricity and Ancillary Services Markets in New York State: Market Power in Theory and Practice.” Proceedings of the 34th Hawaii International Conference on System Sciences 2:2028.
Zadlo, K., B. Teeters, and R. Kumar. 1996. “An Overview of the History of Electric Generation Expansion in the United States.” Plenary Session, 28th Annual North American Power Symposium, Massachusetts Insti-tute of Technology, Cambridge, Mass., November 10-12, 1996.


