
G
Demand-Side Measures
Marilyn A. Brown, Benjamin Sovacool, and Dan E. Arvizu1
As indicated in Chapter 2, “Demand-Side Options,” this appendix provides the following additional detail and analysis for the estimates presented in the chapter:
-
Appendix G-1, “Demand Reduction,” provides data derived from the New York State Energy Research and Development Authority detailing estimates of the economic potential for energy-efficiency improvements that would exist by 2007 and 2012 in the residential and commercial sectors of New York City.
-
Appendix G-2, “Estimating the Potential for Energy-Efficiency Improvements,” presents details of the committee’s estimation of the peak-load reduction in the New York City area (Zones I, J, and K) that might realistically be achieved as a result of energy-efficiency programs in the Indian Point region.
-
Appendix G-3, “Estimating Demand-Response Potential,” provides details of the committee’s estimation of the potential for demand-response programs to reduce peak demand in the Indian Point service area (in Zones I, J, and K) in 2007, 2010, and 2015.
-
Appendix G-4, “Estimating Photovoltaics for Demand Reduction,” presents the analysis for the accelerated photovoltaic-deployment scenario, with estimates of potential peak reduction from photovoltaics in Zones I, J, and K in 2007 through 2015, developed by the committee.
APPENDIX G-1
DEMAND REDUCTION
TABLE G-1-1 Economic Potential: Annual Savings (in megawatt-hours) for Top Eight Residential Energy-Efficiency Measures—Zones J and K, 2007, 2012, and 2022
TABLE G-1-2 Economic Potential: Annual Savings (in megawatt-hours) for Top Ten Commercial Energy-Efficiency Measures—Existing Construction End Use in Zones J and K, 2007-2022
APPENDIX G-2
ESTIMATING THE POTENTIAL FOR ENERGY-EFFICIENCY IMPROVEMENTS
Appendix G-2 presents the committee’s analytical process for determining potential for efficiency improvements in the New York City area (Zones I, J, and K). It also reviews the results of several other studies of energy such potential.
Statewide data were available for this potential (NYSERDA, 2003), but those data are not at the level of detail that allows judgments about the subregion addressed here. Thus, the starting point was an estimate for New York City that was derived from state data (Plunkett and Gupta, 2004). That analysis determined that New York City (Zone J) could benefit from a maximum achievable potential for improvement of 502 MW for 2007, at an avoided levelized cost of 3.3 cents per kWh (¢/kWh).
Using data on the economic potential for the residential sector and the commercial-buildings energy efficiency (in MWh) from NYSERDA (2003), it can be estimated that Zone K has 0.451 of the maximum achievable potential of Zone J. Therefore, the Zone K potential would be 226 MW. Assuming the southern part of Westchester County (Zone I) has half the maximum achievable potential of Zone K, its potential in 2007 would be 113 MW. Thus, the maximum achievable potential across all three zones would be 842 MW by 2007.
The data for residential and commercial economic potential in the appendix in NYSERDA’s 2003 report includes estimates for Zones J and K for 2007, 2012, and 2022. Plotting these estimates, one can interpolate the “missing years” of 2008, 2010, 2013, and 2015. Assuming a linear relationship, the maximum achievable potential for Zone J, starting with 502 MW in 2007, would be 529 MW in 2008, 563 MW in 2010, 624 MW in 2013, and 658 MW in 2015 (as shown in Table 2-4 of this report).
Assuming the same relationship between Zone J and Zone K (Zone K is 0.451 the size of Zone J), the potential for Zone K would be 239 MW in 2008, 253 MW in 2010, 281 MW in 2013, and 297 MW in 2015. Assuming that Zone I is half the size of Zone K, the potential for Zone I would be 119 MW in 2008, 127 MW in 2010, 140 MW in 2013, and 148 MW in 2015 (see Table 2-4).
Corroboration by Other City, Utility, State, and National Studies
A preponderance of evidence from multiple studies—undertaken with differing scales of analysis, sponsors, types of efficiency measures, time periods, and methods of evaluation—demonstrates that there is an immense amount of cost-effective potential for energy-efficiency improvements. The following subsections describe some of the “best practices” from around the United States.
Urban Initiatives
In Sacramento, California, the Sacramento Municipal Utility District Residential Peak Corps Program was implemented in early 1979 to demonstrate the effectiveness of demand-side management in anticipation of the retirement of the Rancho Seco Nuclear Plant. The Peak Corps Program was intended to address summer peaking for cooling, when temperatures often climb above 100°F. The implementation of the program was aimed at the residential sector and emphasized only dual-relay alternating current (AC) cycles (which cycle the central air conditioners participating in the program 10 to 16 days per summer for durations up to 4 hours). Participating consumers could then save $20 per month off their electricity bill. The Peak Corps Program was promoted in two ways: (1) through direct mail, radio, and print advertising and (2) by Sacramento Municipal Utility District Rule 15, which requires that all new homes with central air conditioners participate in the program. As of 1994, the program cost approximately $3 million per year, involved 96,130 customers, and displaced a total of 12.1 MW of peak capacity (Sacramento Municipal Utility District, 1994).
A City of Toledo, Ohio, Municipal Energy Management Program implemented a three-phase plan to (1) retrofit lighting and ballast systems in buildings, (2) extensively retrofit 30 energy-intensive buildings, and (3) force energy efficient technologies in the construction of 20 new city buildings. These three phases alone (at a cost of $9.2 million) have saved $23 million since 1986 and displaced over 380 MWh per year (Ohio Department of Development, 2004).
Similarly, the School District of Philadelphia—the fifth largest in the country and home to 258 schools spread over 282 buildings—spends $32 million annually on energy. To conserve electricity, the school district implemented a remarkable efficiency program in 1983 that cost nothing. The program focused on no-cost measures, such as end-user habits like turning lights off and turning the heat down, and then used the savings to invest in capital improvements such as lighting retrofits, better controls, and weatherization. For the 1993-1994 school year, the school district saved over 15.8 GWh at an avoided cost of $8.5 million, representing a 25 percent reduction in the district’s energy costs and making monies available for investment in other efficiency measures (School District of Philadelphia, 1995).
Perhaps the best-known city-level efficiency program is Seattle City Light’s Electric and Multi-family Program, which targeted low-income residences for weatherization and ran for a very long time, from 1981 to 1997. During that time, the program weatherized 15,109 low-income houses (or a participation rate of almost 40 percent) by mandating
more efficient ceilings, under-floors, heating ducts, water heaters, and insulation. From 1991 to 1997, the program provided an annual energy saving of around 2,644 MWh (or peak capacity savings of 4.53 MW) at a cost of $2.75 million (or $607/kW for peak reduction) (Seattle City Light, 1992).
Utility Initiatives
Moving to the slightly larger scale of analysis, a Southern California Edison Low Income Lighting Program for residences provided compact fluorescent lighting to low-income houses. Under the program, the utility pays for the full cost of lamps and pays community organizations to implement the program. Started in 1986, by 1991 it had saved over 3 MW of capacity at a cost of only $4.2 million (or $1,400/kW for peak reduction) (Southern California Edison, 1992).
The Utilities Small Commercial and Industrial Program of New England Electricity System targeted consumers with power needs under 50 kW. The program—aimed at improving lighting, heating, ventilation, and air-condition (HVAC), and water-heating systems—provides the full cost for the implementation of these technologies. Started in 1990, the program saves an average of 18 MWh per year (or a peak-capacity savings of 7.98 MW during the summer) at a cost of $9.1 million (or $1,140/kW for peak reduction) (New England Electricity System, 1992).
Analogously, Northeast Utilities’ Lighting Catalog Program provides energy-efficient lighting through a utility-run catalog at below wholesale cost. The program simply developed a small catalog of 38 efficient lighting technologies and circulated it to residential consumers, who can then order through a toll free number. Over 100,000 catalogs were ordered in the first 6 months, and the program has so far saved over 8.24 GWh at a low cost of $1.7 million.
A 2005 report of the Regulatory Assistance Project evaluated the New England region’s 2002 efficiency program investments and savings. The report concluded that utilities in New England spent $241 million of system benefit funds on efficiency to save 10,036 GWh assuming a cost of 2.5¢/kWh (Sedano and Murray, 2005).
A 1993 Boston Edison energy-efficiency program aimed at commercial and industrial energy users has attempted to conserve electricity among consumers with needs greater than 150 kW. Targeting a wide battery of technologies— commercial and industrial lighting, HVAC, motors, refrigeration, industrial processes, and energy-management systems—Boston Edison’s program provided rebates after confirmed retrofittings and distributed quarterly checks to noninstitutional customers. An independent evaluation by Cambridge Systematics, Inc., found that the program saved 22,027 MWh, or 6.35 MW of capacity, during 1992 and 1993 at a cost of roughly $14 million (or $2,200/kW of capacity avoided) (Boston Edison Company, 1994).
A 2005 study conducted by the Northwest Power and Conservation Council (NPCC) calls on utilities to invest approximately $1.4 billion in 42 energy-efficiency technologies (including commercial lighting, boilers, HVAC systems, water heaters, and refrigerators). The Council argues that these measures could reduce electricity costs by over $2 billion between 2005 and 2009. The study also found that simple efficiency measures could displace 700 MW of power by 2009 (at $2,000/kW of capacity avoided) and 2,500 MW by 2025 (at $56/kW of capacity avoided) (Northwest Power and Conservation Council, 2005).
State Initiatives
A 2002 report on energy-efficiency potential in California suggested that immense potential remains for the installation of compact fluorescent lighting systems, new variable-speed-drive chillers, energy-management control systems, industrial compression systems, and the like throughout California (Rufo and Coito, 2002). The study concluded that the economic potential for energy-efficiency measures was approximately 10,000 MW for peak-demand savings. It also found that programmable efficiency savings could reach 5,900 MW if funding for existing efficiency programs in California were tripled. These findings are tentatively supported by another study, sponsored by the California Energy Commission (2003), which found that implementing efficiency measures in technologies such as air conditioning, clothes washing, lighting, pool pumps, and refrigerators could achieve a reduction of at least an additional 1,700 MW of peak electricity demand, with energy savings of 6,000 GWh of electricity and 100 million therms of natural gas by 2008.
Finally, a 2003 study sponsored by the Natural Resources Defense Council and the Silicon Valley Manufacturing Group concluded that investments in energy-efficiency made after the 2001 power crisis in California displaced more than 1,000 MW of anticipated capacity. The same study emphasized that, over the next decade, California could realistically and cost-effectively reduce its electricity needs by 5,900 MW, or the equivalent of $12 billion in savings. In other words, California residents and businesses have demonstrated “some of the best possible ways to protect the economy and the environment” through energy-efficiency programs (Bachrach et al., 2003, p. iv).
A 2004 report of the New Jersey Board of Public Utilities estimated that nine energy-efficiency programs (residential HVAC reimbursements, residential construction standards, residential ENERGY STAR standards, appliance cycling, a residential low-income program, refrigerator turn-in, commercial construction standards, the retrofitting of schools, and combined heat and power tax incentives) have cost the state $41 million per year but have saved 108,583 MWh annually.
In Vermont, the Vermont Department of Public Service
(1998) estimates that from 1991 to 1997, Vermont electric utilities spent $75 million on efficiency measures to reduce electricity use by 249 GWh (or 4.7 percent), and have displaced peak demand of 56 MW at the low utility cost of 2.4 ¢/kWh (discounted over the lifetime of the installed measures). That represents $1,350/kW of peak capacity reduction. The findings of the study are backed by another 2003 Vermont Department of Public Service evaluation of statewide residential and commercial energy-efficiency measures. The 2003 study found that product efficiency standards, state building codes, and energy-efficiency program offerings through system benefit funds had saved the state 48,494 MWh from March 2000 to March 2002.
A similar study, undertaken by the North Carolina Energy Policy Council (2004), surveyed the impacts of the State Energy Office’s energy savings using an energy economic model. The study analyzed the 2002 savings in energy efficiency of five measures—public education, demonstration projects, research and development on efficient technologies, grants for equipment installation, and low-interest revolving loans—and concluded that these programs will save 862 GWh between 2001 and 2010, the equivalent annual savings of 105 GWh.
In Oregon, the Energy Trust of Oregon (2003) analyzed more than 154 energy-efficiency technologies in the residential, commercial, industrial, and agricultural sectors. The study estimated total savings of 7 million MW from 2003-2013. Over 70 percent of this potential is concentrated in commercial and residential sectors, with the largest gains coming from more energy-efficient computers and electronics, light-emitting diode (LED) lights, and wastewater treatment. For example, the study found that 162 MW could be saved from the use of more efficient computers and electronics.
Perhaps one of the most innovative techniques for achieving energy efficiency comes from new legislative requirements enacted in Texas. Texas is the first state to promulgate energy-efficiency portfolio standards for its distribution utilities, thereby mandating reductions in load growth. In 1999, the Texas legislature restructured the state’s electric utility industry and in the same bill required that its distribution utilities meet 10 percent of its projected load growth through a portfolio of energy-efficiency programs. The projects are self-selected based on Standard Offer and Market Transformation programs approved by the Public Utility Commission. In the deregulated sector of Texas, which is about 70 percent of total load, the distribution/wires companies can choose to implement Standard Offer contracts with an energy-efficiency service provider (EESP). The EESP receives a standard payment based on the amount of energy and peak demand savings attributed to end-use customer sites where the measures are implemented. The Standard Offer or incentive payment is 50 percent of the avoided cost (for the next gas-fired power plant and associated energy costs) for residential and 35 percent of the avoided cost for commercial energy-efficiency measures. Funds for achieving the energy-efficiency goal will be included in each service area’s transmission and distribution rates (Public Utility Commission of Texas, 2000a, 2000b).
National Initiatives
Findings comparable to those described above exist even at the national level. Researchers from five national laboratories conducted a study, entitled Scenarios for a Clean Energy Future that assessed how energy-efficient and clean-energy technologies could address key energy and environmental challenges facing the United States. A particular focus of this study was the energy, environmental, and economic impacts of different public policies and programs. Hundreds of technologies and approximately 50 policies were analyzed. The study concluded that policies exist that can significantly reduce inefficiencies in energy production and end-use systems at essentially no net cost to the U.S. economy. The most advanced scenario found that policies implemented in 2000 could bring U.S. electricity consumption back to 1990 levels by the year 2010. The study also concluded that, over time, energy bill savings in these scenarios can pay for the investments needed to achieve the reported reductions in energy use (Brown et al., 2001).
A national assessment of state initiatives (Prindle et al., 2003) sponsored by the American Council for an Energy-Efficient Economy estimated the annual energy savings for seven different types of “efficiency policy categories”: appliance and equipment standards, building energy codes, combined heat and power, facility management, tax incentives, transportation, and utility programs. The report concluded that “an average size state could save almost 400 trillion British thermal units annually in the year 2020 through aggressive implementation of energy efficiency policies” (Prindle et al., 2003, p. v). The largest two areas of potential, after transportation, were the combined heat and power category and utility programs like systems benefit funds and energy efficiency portfolio standards.
A rigorous analysis of state energy-efficiency programs undertaken by the Oak Ridge National Laboratory (Schweitzer and Tonn, 2005) attempted to quantify the nationwide energy and cost savings associated with a variety of state efficiency activities performed during 2002 under the State Energy Program. The study focused on 18 project areas, including retrofits, energy audits, codes and standards, loans and grants, and tax credits. The responding states and territories spent more than $540 million on these energy-efficiency programs in 2002 to achieve an estimated nationwide saving of 47.6 trillion source Btu and cost savings exceeding $333 million. Most interestingly, the largest estimated energy savings resulted from workshops and training, codes and standards, energy audits, retrofits, and technical assistance.
References
Bachrach, Devra, Matt Ardema, and Alex Leupp. 2003. “Energy Efficiency Leadership in California: Preventing the Next Crisis.” Report to the Natural Resources Defense Council and the Silicon Valley Manufacturing Group, April.
Boston Edison Company. 1994. “Large Commercial and Industrial Retrofit Program.” Results Center Profile No. 116.
Brown, Marilyn A., Mark D. Levine, Walter Short, and Jonathan G. Koomey. 2001. “Scenarios for a Clean Energy Future.” in Energy Policy, 29(14):179-1196.
California Energy Commission. 2003. Accessing the Energy Savings Potential in California’s Existing Buildings. Interim Report to the Legislature in Response to AB 549. November.
Energy Trust of Oregon. 2003. “Energy Efficiency and Conservation Measure Resource Assessment for the Residential, Commercial, Industrial, and Agricultural Sectors.” January.
New England Electric System. 1992. Small Commercial and Industrial Efficiency Program. The Results Center Profile Number 1.
North Carolina Energy Policy Council. 2004. Clean Energy Funding for North Carolina: An Impact Analysis of State Energy Office Programs. September, Appalachian State University Energy Center.
Northwest Power and Conservation Council. 2005. The Fifth Northwest Electric Power and Conservation Plan.
NYSERDA (New York State Energy Research and Development Authority). 2003. Energy Efficiency and Renewable Energy Resource Development Potential in New York State. Final Report. NYSERDA, Albany, N.Y.
Ohio Department of Development. 2004. Energy Efficiency Success Story: City of Toledo. Office of Energy Efficiency, Community Development Division. Toledo, Oh.
Plunkett, John and Ashok Gupta. 2004. State of New York Public Service Commission: Proceeding on the Motion of the Commission as to the Rates, Charges, Rules and Regulations of Consolidated Edison Company of New York, Inc. for Electric Service. December 15.
Prindle, William, et al. 2003. Energy Efficiency’s Next Generation: Innovation at the State Level. Report for the American Council for an Energy-Efficient Economy. November.
Public Utility Commission of Texas. 2000a. “Substantive Rule, Chapter 25. Electric., Preamble Proposal for Adoption at 2/24/00, (02/23/00)” Available at http://www.puc.state.tx.us/rules/rulemake/21074/022300pre.pdf. Accessed December 12, 2005.
Public Utility Commission of Texas. 2000b. “Energy Efficiency Programs Project #21074” Available at http://www.puc.state.tx.us/rules/rulemake/21074/21074.cfm. Accessed December 12, 2005.
Rufo, Michael and Fred Coito. 2002. California’s Secret Energy Surplus: The Potential for Energy Efficiency. September 23.
Sacramento Municipal Utility District. 1994. Residential Peak Corps Program. Results Center Profile No. 83. November.
School District of Philadelphia. 1995. Save Energy Campaign. Results Center Profile No. 114. September.
Schweitzer, Martin and Bruce E. Tonn. 2005. An Evaluation of State Energy Program Accomplishments: 2002 Program Year. Department of Energy. June.
Seattle City Light. 1992. Low Income Electric Program. Results Center Profile No. 20. March.
Sedano, Richard and Catherine Murray. 2005. Electric Energy Efficiency and Renewable Energy in New England: An Assessment of Existing Policies and Prospects for the Future. May.
Vermont Department of Public Service, 1998. Vermont Electric Utility Demand Side Management Accomplishments: History and Current Trends. September.
APPENDIX G-3
ESTIMATING DEMAND-RESPONSE POTENTIAL
The estimated potential for demand-response programs to reduce peak demand in the Indian Point area is based on the experience to date with three NYSERDA programs that avoided a total of 700 MW of peak demand in the state of New York in 2004.
The first step in the estimating process involved apportioning the 700 MW of peak reduction to Zones I, J, and K. Table 4.1 of the Comprehensive Reliability Planning Process Draft Reliability Needs Assessment (NYISO, 2005) was used as the basis for the apportionment. It provides the approximate summer peak loads by zone in New York State, but aggregates three zones (G, H, and I) into the “Lower Hudson Valley.” After apportioning that value to Zone I, it is estimated that Zones I, J, and K have 17,697 MW of peak load, or 55 percent of the statewide total (31,770 MW). Thus, it can be estimated that Zones I, J, and K could account for 55 percent of the 700 MW of peak reduction from demand-response programs in 2004, or 385 MW.
The second step in the estimating process involves adjusting the 385 MW to reflect what might be achieved if the three 2004 demand-response programs of NYSERDA were doubled in budget. The committee assumed diminishing returns, such that a doubling of budget delivers an increment of only 50 percent. This brings the estimated potential for expanded summer peak reduction to approximately 200 MW. It is assumed that these load reductions could be achieved by the year 2010, since demand reductions can be achieved quickly.
As with efficiency, it takes time to expand demand-response program activities, to attract more program participants, and to purchase and install new demand-response equipment. Therefore, it is assumed that only 50 MW of additional peak reduction could be achieved in 2007, increasing to 200 MW by 2010. It is also assumed that the project increases in potential for the years 2013 (275 MW) and 2015 (300 MW).
Reference
NYISO. 2005. Comprehensive Reliability Planning Process and Draft Reliability Needs Assessment. September 1.
APPENDIX G-4
ESTIMATING PHOTOVOLTAICS FOR DEMAND REDUCTION
Current and Projected Costs
Table G-4-1 presents an overview of the current and projected cost of electricity from photovoltaic technology through the year 2016. The two key markets for photovoltaics (PV) are assumed to be distributed residential systems and distributed commercial systems. Thus, the high and low ranges are based on current and projected costs in these two market segments. As shown in the table, the levelized cost of energy from PV is projected to drop from the current 23 to 38¢/kWh to 12 to 20¢/kWh in 2016.
It is important to note that the costs shown in the table are those experienced by the end user—that is, they should be compared with retail rather than wholesale electricity rates. In addition, since the production from PV is nearly coincident with peak demand in New York State,1 a strong argument can be made for valuing PV in a planning context at a rate higher than the average retail rate in New York. For example, Perez et al. (2004a) used average NYISO day ahead hourly wholesale price of electricity data in the metropolitan New York City and Long Island during 2002 to estimate the “solar-weighted wholesale price” (weighted by PV output as a proportion of the total output). Using these data, they concluded that combining PV with a limited amount of load management (to enable PV to claim a capacity value close to 100 percent) would have increased the value (i.e., the systemwide cost savings) of residential PV during 2002 from 15¢/kWh (the average retail rate in that year) to 21.3¢/kWh in NYC and from 12¢/kWh (the average retail rate in that year) to 20.3¢/kWh on Long-Island. As shown in Table G-4-2, if PV system owners could capture this value through interconnection rules, rate-structures, etc., then PV technology could become a rapidly expanding and self-sustaining industry in New York State during the next decade.
Accelerated Photovoltaic Technology Deployment Scenario for the New York City Area
The rapid growth in the global PV market during the past decade was driven largely by government subsidy programs, particularly in Japan, Germany, and a few states in the United States (including California and New York). New York State provides a variety of incentives, in the forms of loans, grants, and tax credits for the installation and use of PV systems by residential and business customers.2 The projection discussed here also will not be achieved without subsidies, but they will be phased out over 10 to 15 years. By about 2018, the technology should be cost-effective without subsidies, and New York will have a substantial energy contribution from a source with attractive environmental and security attributes.
The existing subsidy programs for PV systems in New York are well subscribed, indicating that accelerated PV deployment is quite possible. Current installed system prices are about $8/W in New York State, with a $4/W buy-down, leaving a final cost to the consumer of about $4/W. If financed over the life of a system (30 years) at a 6 percent interest rate (~4 percent real interest rate after tax benefits) the levelized cost of energy from such a PV system would be about 13.5¢/kWh. With current average residential electricity prices above 20¢/kWh in New York City, an investment in a PV system could look attractive to many consumers.
The accelerated deployment scenarios considered in the present study is modeled on a Japanese program, which provided a declining subsidy to residential PV systems over the past decade. Residential PV installations expanded in Japan from roughly 2 MW in 1994 to 800 MW in 2004 (Ikki, 2005). In its accelerated scenario, the committee contemplated a growth rate of roughly one-half that experienced in Japan to compensate for the difference in circumstances from the Japanese conditions to those in New York. The average price of residential PV systems installed in Japan in 2004 was $6.2/W—that is, about 25 percent lower than in New York today. This cost differential is a reflection of the difference between a well-functioning and an emerging market for PV systems. PV modules and inverters are commodities whose prices are largely driven by international markets; however, labor and balance of system cost (which typically account for 30 to 40 percent of total system cost) are driven by local policies and market development.
Figure G-4-1 shows an accelerated market-development path for the New York City area. This scenario is not a model result, but an estimate of what could be achieved under the following assumptions:
-
The estimated technical potential for rooftop installations in the New York City area (Hudson Valley, New York City, and Long Island) in 2025 is 18-20 GW (NYSERDA, 2003; Navigant Consulting, 2004).
-
The cost projection is in line with what the DOE Solar Energy Technology Program and the U.S. PV industry believes will be achieved over the next 10 to 15 years in the
TABLE G-4-1 Current and Projected Distributed PV Cost
TABLE G-4-2 Accelerated PV Deployment Scenario for the New York City Area
-
United States (DOE, 2004; SEIA, 2004). In other words, it is an aggressive but plausible projection.
-
The average annual growth rate was set in 5-year intervals as follows: 40 percent between 2006 and 2010, 25 percent between 2011 and 2015, and 15 percent between 2016 and 2020. These rates are well below (roughly one-half) the rates achieved in the Japanese program.
-
A declining subsidy is implemented, set at 50 percent in 2006, declining linearly to 35 percent in 2011, 15 percent in 2016, and 0 percent in 2019. The combination of a declining subsidy and declining costs maintains an installed system cost to consumers below $4/W throughout the scenario.
-
A clear, long-term commitment to growing the PV industry in the New York City area is made. Accelerated de-
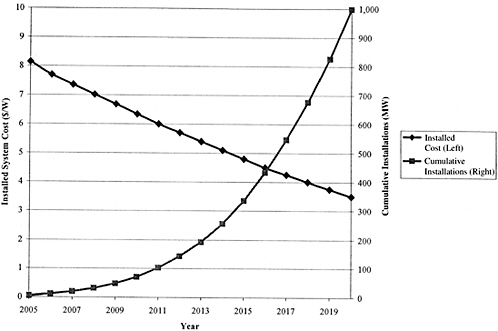
FIGURE G-4-1 Accelerated PV market development path for the New York City area.
-
ployment will require the availability of reputable installers, which in turn depends on a clear, long-term policy commitment. Setting up a new business (getting certified, training staff, and so on) requires a substantial investment of resources. Entrepreneurs need to believe they will be able to recoup this investment over time. Policy uncertainty, in this context, creates a substantial barrier to building a viable local PV distribution, installation, and maintenance industry.
-
Achieving the high growth rates envisioned during the 2006-2015 period will require investing additional resources (on the order of $10 million per year) in programs aimed at helping entrepreneurs establish PV businesses and boosting public awareness of PV in the New York City area.
Additional detail for this scenario is shown in Table G-4-2. This scenario envisions creating a self-sustaining PV market in New York City area by 2019. Under this scenario about 1 GW of PV systems would be installed in the New York City area by 2020. Achieving this goal would require a total public investment of roughly $420 million (discounted to present value at 7 percent) between 2006 and 2018, thus equivalent to a present value cost of roughly $420/KW installed.
Under an aggressive but plausible accelerated PV deployment scenario, about 335 MW of PV systems could be installed in the New York City area by 2015 (generating roughly 500 GWh of electricity per year). Assuming a capacity factor of 0.75 relative to peak load (to account for the slight non-coincidence of peak load and PV output, and the inevitable outages of some PV systems), this level of PV installations could offset about 250 MW (12 percent of Indian Point’s capacity) during peak periods and about 3 percent of Indian Point’s annual electricity output. The rate of installation could continue to grow for many years even without public subsidy after 2018.
REFERENCES
DOE (Department of Energy). 2004. Solar Energy Technologies Program, Multi-Year Technical Plan 2003-2007 and Beyond. Report DOE/GO-102004-1775. Office of Energy Efficiency and Renewable Energy, U.S. Department of Energy, Washington, D.C.
Ikki, Osamu. 2005. PV Activities in Japan. RTS Corporation, Tokyo, Japan. May.
Letendre, Steven, et al. 2003. “Solar and Power Markets: Peak Power Prices and PV Availability for the Summer of 2002.” Paper presented at ASES 2003, Austin, Tex., June.
Margolis, Robert M., and Frances Wood. 2004. “The Role for Solar in the Long-Term Outlook of Electric Power Generation in the U.S.” Paper presented at the IAEE North American Conference in Washington, D.C., July 8-10.
Navigant Consulting. 2004. PV Grid Connected Market Potential in 2010 under a Cost Breakthrough Scenario. Report to The Energy Foundation. Available at www.navigantconsulting.com. Accessed November 10, 2005.
NYSERDA (New York State Energy Research and Development Authority). 2003. Energy Efficiency and Renewable Energy Resource Development Potential in New York State. New York State Energy Research and Development Authority, Albany, New York. Available at www.nyserda.org. Accessed November 10, 2005.
Perez, Richard, et al. 2004a. “Quantifying Residential PV Economics in the US—Payback vs Cash flow Determination of Fair Energy Value.” Solar Energy 77: 363-366.
Perez, Richard, et al. 2004b. “Solar Energy Security.” REFocus July/ August: 24-29.
SEIA (Solar Energy Industries Association). 2004. Our Solar Power Future: The U.S. Photovoltaic Industry Roadmap Through 2030 and Beyond. Solar Energy Industries Association, Washington, D.C.


