
2
Demand-Side Options
DEMAND GROWTH IN THE INDIAN POINT SERVICE AREA
The New York Independent System Operator (NYISO) prepares compilations of historic electricity usage patterns and forecasts future electricity demand in New York State. Table 2-1 shows annual power consumption for selected years between 1993 and 2015 by region, in and around New York City and in the state, and Table 2-2 shows peak power requirements for the same years and areas. These consumption estimates are “weather-normalized” to enable comparisons across a typical year of weather (e.g., electricity use during years with particularly cold winters or hot summers was reduced to reflect what would have occurred during years with more typical numbers of heating and cooling degree-days).
Electricity use in the New York Control Area (NYCA) as a whole grew at about 1 percent annually between 1993 and 2004 as shown in Table 2-1. Demand in western New York and the Upper Hudson Valley actually dropped during that period. All of New York’s demand growth has been down-state, with Long Island growing at 2.2 percent annually, New York City—even with the events of September 11, 2001—at 2.1 percent, and Zones H and I (most of the Lower Hudson Valley) at a rate of 1.4 percent.1 This growth seems to be driven in part by a continuing expansion of the strong service sector (including government, education, and health care) that characterizes much of the downstate region. The manufacturing that once anchored the upstate economy has been in decline since the 1970s.
Summer peaks (Table 2-2), due largely to air conditioning, have grown more rapidly than has annual electricity use (Table 2-1), with Long Island seeing the highest growth in the state, followed by New York City and then the Lower Hudson Valley.
NYISO forecasts that the current growth rate in annual electricity use (though not that of peak-load growth) will continue out to 2015 in the Lower Hudson Valley, but with some slowing in New York City and Long Island (due to more limited opportunities for commercial and industrial expansion and greater investment in demand-management programs by Consolidated Edison). Consumption and peak load are forecast to grow at an approximately equal pace on Long Island and in New York City. Peak load is expected to grow slightly faster than consumption in the Lower Hudson Valley.
The projections of electricity demand in Tables 2-1 and 2-2 are predicated on the assumption that electricity prices will continue their historical decline, as shown in Figure 2-1. This assumption in turn depends on assumptions of fuel prices, generating mix, capital costs, and other factors. NYISO’s demand forecasts are based on the relative trend in Figure 2-1, which was derived from analyses by the Energy Information Administration (EIA) for the Mid-Atlantic region (Energy Information Administration, 2006).
Such projections are highly uncertain for several reasons, most prominently:
-
Natural gas, which is the source of a large and increasing share of New York’s electric generation, has shown large swings in price in recent years. Some of this has been temporary, for example owing to shortages in supply because of damage to equipment in the Gulf of Mexico region during the hurricanes of 2004 and 2005. More worrisome, however, has been the declining productivity of U.S. gas fields. The EIA expects gas prices to remain relatively stable over the next 10 years (Energy Information Administration, 2006). That may be the case, but probably only if imports of liquefied natural gas (LNG) are significantly increased. The only proposed LNG terminal in the state of New York, in Long Island Sound, faces vigorous opposition, as do other pro-
TABLE 2-1 Weather-Normalized Annual Electricity Use, Past and Forecast, in Gigawatt-Hours per Year, for Three New York Regions and Statewide, Selected Years from 1993 Through 2015
|
Year |
Lower Hudson Valley: NYCA Zones G, H, Ia |
New York City: NYCA Zone J |
Long Island: NYCA Zone K |
New York State: NYCA |
|
1993 |
16,411 |
41,828 |
17,667 |
144,471 |
|
1997 |
16,206 |
44,676 |
18,185 |
148,008 |
|
2001 |
17,207 |
49,912 |
20,728 |
155,523 |
|
2005 |
19,625 |
52,836 |
23,178 |
164,050 |
|
2009 |
20,775 |
56,345 |
25,258 |
174,290 |
|
2013 |
22,610 |
58,949 |
26,598 |
180,710 |
|
2015 |
23,608 |
59,717 |
26,961 |
182,880 |
|
Growth per year: |
|
|
|
|
|
1993-2004 |
1.421% |
2.071% |
2.222% |
1.004% |
|
2004-2015 |
1.913% |
1.194% |
1.659% |
1.151% |
|
aNYCA, New York Control Area; Zone G, Hudson Valley; Zone H, Northern Westchester County; Zone I, rest of Westchester County. SOURCE: Adapted from NYISO (2005a), p. 25. |
||||
TABLE 2-2 Weather-Normalized Summer Peak Power, Past and Forecast, in Megawatts, for Three New York Regions and Statewide, Selected Years from 1993 Through 2015
|
Year |
Lower Hudson Valley: NYCA Zones G, H, Ia |
New York City: NYCA Zone J |
Long Island: NYCA Zone K |
New York State: NYCA |
|
1993 |
3,337 |
8,365 |
3,595 |
27,000 |
|
1997 |
3,650 |
9,609 |
4,273 |
28,400 |
|
2001 |
4,421 |
10,424 |
4,901 |
30,780 |
|
2005 |
4,410 |
11,315 |
5,230 |
31,960 |
|
2009 |
4,849 |
11,965 |
5,580 |
33,770 |
|
2013 |
5,331 |
12,426 |
5,981 |
35,180 |
|
2015 |
5,590 |
12,648 |
6,112 |
35,670 |
|
Growth per year: |
|
|
|
|
|
1993-2004 |
2.365% |
2.610% |
3.270% |
1.382% |
|
2004-2015 |
2.380% |
1.190% |
1.618% |
1.166% |
|
aNYCA, New York Control Area; Zone G, Hudson Valley; Zone H, Northern Westchester County; Zone I, rest of Westchester County. SOURCE: Adapted from NYISO (2005a), p. 26. |
||||
-
posed projects. Natural gas is discussed further in Chapter 3. If these supplies do not materialize, prices will rise and electricity costs will follow.
-
Even if the costs of production can be defined well, the wholesale price is a function of the auctions that NYISO conducts to procure supplies, as discussed in Chapters 1, 4, and 5. Price can be either above or below historic levels, depending on how many bidders are participating. The long-term impact of the New York process on prices to consumers is still uncertain.
Overall, if the price decline projected to start in 2006 does not occur, demand will be lower.
NYISO’s new capacity-forecasting program is more rigorous than in the past, but even the best demand forecasts are not destiny. They are simply estimates, based on guesses about a host of parameters, which may prove to be too high or too low. Price increases, economic downturns, changes in fuel prices and availability, policy changes, and technological advance have all contributed to surprises in years past. Both in the 1970s and in late 1980s, serious power shortages were forecast for New York unless particular power plants
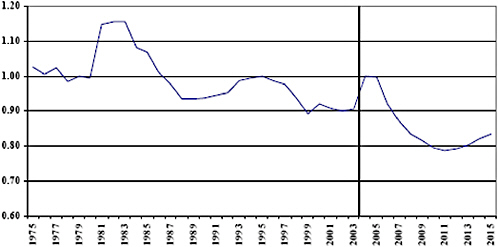
FIGURE 2-1 Past and projected trends in real residential electricity price in New York State relative to 1980. SOURCE: NYISO (2005a).
were built. Not all were, but no shortages occurred, and the demand for energy services was unfailingly met. The 1980s saga of Long Island’s Shoreham nuclear plant, which was eventually closed before it produced any electricity, is one example. It is no criticism of the NYISO forecasts to observe that they do not reflect the full range of possibilities that could come into being if circumstances so required (such as an emergency shutdown of the Indian Point Energy Center or of another large generating source) or if state policies emphasized energy efficiency on the same scale as in California, as discussed later in this chapter.
The range of policy options available to power system operators and regulators has grown wider in recent years. It now includes energy efficiency, load management, integrated resource planning, and performance-based rate making with incentives for cost-effective energy efficiency.
New York State’s spending on efficiency in the electric sector declined significantly in the mid-1990s, falling from a peak of some $300 million per year in the early 1990s to a low of some $50 million per year in 1996. The state’s only performance-based rate-making plan based on capping revenues2 lapsed in 1997. The New York State Energy Research and Development Authority (NYSERDA) now spends about $150 million annually on energy efficiency programs, discussed below (NYSERDA, 2005b). Comparing trends in consumption and peak load between 1993 and 1997 with those between 1997 and 2001 (Tables 2-1 and 2-2) suggests that the demand-side management (DSM) program cutbacks may have allowed demand to grow faster than it would have with stronger programs.
POTENTIAL OF DEMAND-SIDE OPTIONS
The impacts of current and planned programs for reducing electricity consumption and peak electrical loads could be among the most cost-effective replacements for the energy provided by the Indian Point Energy Center. This section describes promising demand-side control options, including estimates of their achievable potential and barriers to their implementation. The focus is on the ability of demand-side options to reduce on-peak requirements of consumers for electricity. While Indian Point is a baseload plant, the biggest challenge to replacing its capacity occurs during summer and winter peaks when regional generating resources and transmission capacity are most constrained— hence the focus on demand-side options that could displace peak loads. The ability of energy efficiency to reduce megawatt-hours of electricity consumption and levels of consumer bills in the residential and commercial sectors is highlighted in Appendix G-1 (“Demand Reduction”).
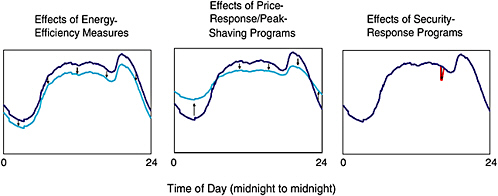
FIGURE 2-2 Effects of demand-reduction programs on daily power demand. SOURCE: Adapted from Kirby et al. (2005); Gillingham et al. (2004).
Definition of Demand-Side Options and Measures of Potential
Demand-Side Options
This chapter considers two types of demand-side options:
-
Energy efficiency programs (principally in the commercial and residential sectors) and demand-response (DR) programs (including permanent and “callable” resources), and
-
Distributed generation (DG), which is generally not dispatchable and thus not included in most electrical system reliability analyses. DG includes combined heat and power (CHP) systems and distributed photovoltaics (PV).
Energy Efficiency and Demand-Response Programs. Energy efficiency programs allow users to perform the same functions that they normally would, but with less energy consumption. When applied to electricity uses, improved efficiency reduces demand throughout the day, often with the greatest effect during peak demand. The left panel of Figure 2-2 shows a typical daily cycle of demand, low at night, rising during the day, and peaking during the late afternoon. The lower curve shows demand with improved efficiency of use. Energy-efficiency improvements can be expensive, but once implemented they can save energy for many years. Reductions in peak-power requirements can also contribute to system stability in the event of sudden disturbances such as a loss of system components or short circuits.3 Furthermore, reducing peak demand means that gen erating capacity and reserve margins can both be reduced. Thus, investments in reducing peak demand through energy efficiency measures can have a value of 118 percent of the actual reduction in avoiding the addition of new capacity.4
Energy-efficiency mechanisms can include mandatory efficiency standards for buildings and appliances; targeted financial incentives and assistance; codes; information and education programs; and research on energy-efficient technologies (Silva, 2001, pp. 96-104; Brown et al., 2005, pp. 45-60). They can take place in a variety of program areas, including residential lighting; single-family weatherization; nonresidential heating, ventilating, and air conditioning (HVAC); and new construction (National Energy Efficiency Best Practices Study, 2004). Stimulating greater investments in energy-efficiency measures is complex, however, since it involves multiple actors and agents, including varied consumers, vendors, independently owned utilities, unaffiliated distribution companies, and federal, state, and local agencies (Harrington and Murray, 2003).
One well-documented stimulant for energy efficiency is that of increased electricity prices. Most models of electricity markets incorporate an estimate of the price elasticity of demand for electricity. Consistent with past research, one recent study of price response based on 119 customers from New York State (Goldman et al., 2005) confirms that customers’ price response is generally modest. In particular, the surveyed customers had an average price elasticity of 0.11, which means that their combined ratio of peak to off-peak electricity usage declines by 11 percent in response to a doubling of peak prices (relative to off-peak prices). Thus, price
increases in the event of more-constrained supplies could produce a measurable reduction in demand, but the overall effect would be modest in magnitude. While long-term price elasticities of demand are likely to be larger, their impact would occur outside the time frame of interest for this report.
Demand-response programs focus on consumers’ actions to change the utility’s load profile. These programs are not aimed at saving energy so much as at shifting the time at which it is demanded, as shown in the middle set of curves in Figure 2-2 (Gillingham et al., 2004). Price-response programs move consumption from day to night or curtail discretionary usage. Peak-shaving programs focus on reducing peaks on high-load days by requiring greater response during peak hours. These programs allow utilities to better match electrical demand with their generating and transmission capacity. By changing the load curve for utilities, system reliability can be enhanced and new power plant construction can be avoided or delayed. Overall costs are reduced because peak power is more expensive than average costs.
Demand-response programs allow consumers to respond to electricity prices directly, offering mechanisms to help manage the electricity load in times of peak electricity demand in order to improve market efficiency, increase reliability, and relieve grid congestion. Significant consumer benefits can also accrue from real-time demand-response programs, chiefly in the form of cost savings due to lower peak electricity prices, less opportunity for market manipulation by electricity providers, and additional financial incentives to induce consumer participation in these programs.
Security-response programs enable utilities to drop loads in response to electric system contingencies. These programs can be implemented quickly and inexpensively, usually with the agreement of large users of electricity, who receive lower rates in return for relying on interruptible power. These programs have no impact on the load except during peak periods, as shown in the right-hand panel of Figure 2-2.
Distributed Generation. Distributed generation is the production of electricity at or close to its point of use. DG technologies include internal combustion engines, fuel cells, gas turbines and microturbines, Stirling engines, hydro, and microhydro applications, photovoltaics, wind energy, solar energy, and waste and biomass fuel sources. DG is usually installed on the customer side of the meter and is not dispatchable by the utility. DG ranges in size from a few kilowatts (kW) to 20 or even 50 megawatts (MW). Recent manufacturer interest and sales growth have been particularly strong in the 50 kW to 5 MW range. An objective has also been to move away from traditional diesel generators, up to now a common but relatively “dirty” source of distributed generation.
Combined heat and power, a subset of DG, generally involves reciprocating engines or turbines to drive electric generators, with the waste heat captured and used for other purposes. Typically, CHP systems generate hot water or steam from the recovered waste heat and use it for process or space heating. The heat can also be directed to an absorption chiller where it can provide process or space cooling. CHP systems may offer economic benefits, security, and reliability.
Siting generation close to its point of use, as with CHP systems, enables greater use of a device’s overall energy output. Historically the average efficiency of central-station power plant systems in the United States has been approximately 33 percent, and until quite recently had remained virtually unchanged for 40 years. This means that about two-thirds of the energy in the fuel cannot be converted to electricity at most power plants in the United States and is released to the environment as low-temperature heat. CHP systems, by capturing and converting waste heat, achieve effective electrical efficiencies of 50 to 80 percent. Furthermore, centrally located facilities typically lose 5 to 8 percent of their rated output through transmission and distribution losses.5 CHP systems, by being at or near the point of use, avoid most of these losses.
The improvement in efficiency provided by combined heat and power reduces emissions of carbon dioxide and usually other air pollutants. Since CHP requires less fuel for a given energy output, it reduces the demand for key fuels such as natural gas, coal, and uranium.6 CHP can help reduce congestion on the electric grid by removing or reducing load in areas of high demand and can also help decrease the impact of grid power outages. NYSERDA comments that “energy savings [from CHP systems] represent a social benefit in lowering the pressure on fuel and electricity supply and infrastructure, thereby providing lower prices for all consumers.”7 Mayor Michael Bloomberg’s New York City Energy Task Force, in considering options to reduce electrical capacity problems in the city, concluded that “distributed resources can reduce or reshape electric system load and thereby mitigate the need for increased generation and/or transmission resources. . . . With appropriate policies and incentives, distributed resources are often the most readily available, cost-effective, and underutilized clean energy resources that can potentially reduce or defer the amount of required new electric supply from generation and transmission systems. While it can take many years to plan, design and build electric generation plants, most distributed resources can be deployed within a year.”8 A dispersed network of DG units is also less vulnerable to terrorism, whether from direct attacks or computer hacking, than a single large power station.
|
5 |
Available at http://www.epa.gov/chp/what_is_chp/why_epa_supports_ chp.htm. Accessed October 3, 2005. |
|
6 |
Available at http://www.epa.gov/chp/what_is_chp/benefits.htm. Accessed October 3, 2005. |
|
7 |
Available at http://www.nyserda.org/programs/pdfs/CHPFinalReport 2002WEB.pdf. Accessed October 3, 2005. |
|
8 |
Available at http://www.nyc.gov/html/om/pdf/energy_task_force.pdf. Accessed October 3, 2005. |
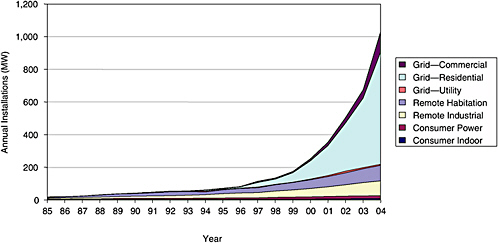
FIGURE 2-3 Global photovoltaic market evolution, by market segment, 1985 to 2004 (42 percent average annual growth). SOURCE: Personal communication from Paula Mints, Senior Photovoltaic Analyst, Strategies Unlimited, Mountain View, Calif., February 11, 2005.
Photovoltaic (PV) technology generates electricity from sunlight in a system with no moving parts. PV units can be mounted on rooftops and left largely untended. This DG option, when installed for the end user, competes against retail, not wholesale, electricity rates. Since its production profile is nearly coincident with the summer peak demand, it can contribute significantly to grid stability, reliability, and security. Thus, from a planning perspective PV should be valued at a rate closer to the peak power rate than the average retail rate.9 The cost of PV-generated electricity is expected to decline considerably over the next decade, falling from a current cost of 20 to 40 cents per kilowatt-hour (¢/ kWh) to a projected cost of 10 to 20 ¢/kWh by 2016, less than the retail price of electricity in New York City (USDOE, 2004; Margolis and Wood, 2004; SEIA, 2004).10 Thus, PV may be in the economic interests of New York customers sooner than others in sunnier parts of the country.
Growth of the global PV market from 1999 to 2004 has averaged 42 percent annually (see Figure 2-3). Large-scale production will contribute greatly to continuing cost declines. As shown in Figure 2-3, the fastest growth was in the grid-connected residential and commercial segments.
Measures of Potential
When evaluating the potential for additional demand-side options to be deployed in future years, four types of estimates are generally used.
-
Technical potential refers to the complete penetration of all applications that are technically feasible.
-
Economic potential is defined as that portion of the technical potential that is judged cost-effective.
-
Maximum achievable potential is defined as the amount of economic potential achievable over time under the most aggressive program scenario possible. It takes into account administrative and program costs as well as market barriers that prevent 100 percent market penetration.
-
Program potential is the amount of penetration that would occur in response to specific program funding measures (Rufo and Coito, 2002; NYSERDA, 2003).
Current Programs Operating in the Indian Point Territory
When assessing the additional potential for demand-side options in the Indian Point service territory, it is necessary to
TABLE 2-3 Current Photovoltaic (PV)-Related Policies in New York State
characterize the programs that are currently in place and the results achieved to date. NYSERDA is spending a total of $1.2 billion (or $175 million annually over a 7-year period) in public and private funds in the state of New York (NYSERDA, 2005a, p. ES-7). NYSERDA estimates that its programs have reduced peak demand by 860 MW and reduced electricity consumption by 1,400 gigawatt-hours (GWh) annually. At a delivered price of about $0.03/kWh, NYSERDA estimates that the technical potential for its efficiency programs in New York State is 20,000 GWh and a cumulative 3,800 MW reduction of peak load by 2012, with corresponding forecasts for 2022 of 41,000 GWh and 7,400 MW.11
New York State’s 2002 State Energy Plan sets forth “the goal of becoming a national leader in the deployment of distributed generation technology” and recommends that the state “should take all reasonable steps necessary to facilitate the interconnection of DG and CHP resources into the electricity system and increase the use of DG and CHP resources in the State.”12
Progress has been made on several fronts over the past several years in advancing combined heat and power systems in the United States. The Bush administration promoted CHP in its National Energy Plan, and the Energy Policy Act of 2005 directs states to consider adopting interconnection standards for CHP and to promote the development of CHP technologies. National model emissions regulations are under development by several organizations, and the Federal Energy Regulatory Commission (FERC) has issued small-generator interconnection standards as well as a model state rule.
Many states and regions are conducting their own rule-making processes on interconnection policies, emissions barriers, and tax issues for CHP. Most relevantly, the New York Public Service Commission has both reduced the standby electricity rate charges for CHP and set up an attractive natural gas rate structure for CHP. Both of these actions apply in the Consolidated Edison service territory. New York State, through NYSERDA, also has the largest incentive program for CHP in the nation.
New York also has enacted policies aimed at encouraging the adoption of photovoltaic technology, as shown in Table 2-3. The result is a comprehensive set of incentives for residents and businesses to install PV. The incentives take the form of tax exemptions and credits, loan subsidies, rebates (administered by the Long Island Power Authority and NYSERDA), and standard interconnection and metering rules that are exceeded in the Northeast only by New Jersey.
New York’s existing rebate or “buy-down” program is administered by NYSERDA. It is called New York Energy $mart and includes customers of all major investor-owned utilities. New York Energy $mart provides customers who purchase and install PV systems with a $4 per watt rebate. This incentive, in combination with state tax credits and exemptions, has resulted in the installation of more than 1.5 MW by the summer of 2005. The program currently has $12 million allocated to its PV incentive program, of which about $6.5 million has been reserved as installer/customer incentives. The remaining funding should take the program through 2006.
The following subsections describe the energy-efficiency, demand-response, and distributed-generation programs that are in operation or planned for implementation in the near future by the three major power providers in downstate New York: Consolidated Edison (ConEd), the New York Power Authority (NYPA), and the Long Island Power Authority (LIPA).
|
11 |
Paul A. DeCotis, NYSERDA, 2005. “New York State’s Public Benefits Energy Efficiency Programs,” presentation to the National Research Council Committee on Alternatives to Indian Point for Meeting Energy Needs, Washington, D.C., June 1, p. 5. |
|
12 |
Available at http://www.nyserda.org/sep/sepsection1-3.pdf. Accessed October 3, 2005. |
Consolidated Edison
Consolidated Edison has established demand-management subsidy programs as follows (Plunkett and Gupta, 2004):
-
Overarching goal: Reduce projected peak-load growth by 535 MW through demand management.
-
NYSERDA Systems Benefit Charge (SBC) II programs: 250 MW (80 MW permanent) in ConEd service territory (already accomplished).
-
NYSERDA SBC III programs: 300 MW (120 MW permanent) in ConEd service territory.
-
“Incremental” programs to provide 300 MW of peak-load reduction, including the following:
-
ConEd: up to 150 MW in constrained networks.
-
NYSERDA: up to 150 MW throughout ConEd’s service territory (after accomplishing the 550 MW in SBC II and III). Budget is $112 million.
-
The following measures are being emphasized in NYSERDA’s incremental programs:
-
Energy efficiency (goal of 68 MW)—Commercial and Industrial Performance Program (CIPP), New Construction, Smart Equipment Choices, Energy $mart Loan Fund, Building Performance Program, Flexible Technical Assistance.
-
Load management (goal of 55 MW)—Peak Load Reduction and Aggregated Load Reduction programs.
-
Distributed generation (goal of 27 MW)—Clean DG Incentives Program for engines and microturbines.
New York Power Authority
The following energy services programs are operated or planned by the New York Power Authority:
-
NYPA has committed $100 million a year for energy-efficiency projects through performance contracting with its private- and public-sector customers.
-
Cumulative reductions for 1987 through 2004 were 900 GWh and 194 MW.
-
Cumulative estimated emissions reductions were approximately 491,000 tons of CO2; 1,350 tons of SO2; and 675 tons of NOx.
-
-
NYPA materials state that 1,200 energy-efficiency projects have taken place at approximately 2,200 public buildings across New York State.
-
Measures through NYPA’s energy services programs are primarily lighting, motors, and HVAC and limited to a maximum payback period of 10 years.
NYPA also has established three renewable resources projects, including the following:
-
Nine fuel cell installations totaling 2.4 MW using waste gas produced from sewage plants.
-
18 rooftop photovoltaic systems with a combined capacity of 570 kW.
-
As of December 31, 2004, 4 million electric-drive vehicle miles for hybrid-electric transit buses, all-electric school buses, station commuter cars, electric delivery trucks, electric low-speed vehicles, and other technologies.
Long Island Power Authority
Beginning in May 1999, LIPA committed $355 million over 10 years for energy-efficiency projects, clean distributed generation, and renewable technologies. Through the end of 2004, LIPA had spent approximately $170 million, or approximately $34 million a year. This Clean Energy Initiative is estimated by LIPA to have had the following impacts:
-
Annual savings are estimated at 330 GWh, with 326 MW of permanent demand reductions and 145 MW of curtailable demand reduction.
-
Annual emissions reductions are approximately 1,400 tons of SO2; 500 tons of NOx; and 355,000 tons of CO2.
-
Through the first 5 years of deployment, cumulative emissions reductions are estimated at 1.3 million tons of CO2; 1,900 tons of NOx; and 5,000 tons of SO2.
-
LIPA estimates that approximately 3,500 “secondary” jobs have been created as a result of the program.
The Clean Energy Initiative includes the following kinds of programs:
-
Residential—lighting and appliances, HVAC, and the Residential Energy Affordability Program (REAP), which provides free installation of efficiency measures and education for low-income households. In addition, LIPA launched the Solar Pioneer Program for photovoltaics in 1999, offering customers a substantial rebate. The rebate’s budget is tied to LIPA’s 5-year Clean Energy Initiative, with funding totaling $37 million annually (covering multiple technologies). The Clean Energy Initiative is expected to receive funding through 2008. To date, 511 rebates have been disbursed for PV systems totaling more than 2.63 MW installed on Long Island. LIPA’s rebate is currently set at $4/W.
-
Commercial and industrial—commercial construction and peak reduction programs.
-
General—the Customer-Driven Efficiency Program, providing custom assistance for residential and commercial customers; LIPAedge, a direct load-control program.
-
Research and development—wind power, fuel cells, electric vehicles, hybrid-electric buses, tidal power, wave power, geothermal, and various electrotechnologies.
-
New York ENERGY STAR Labeled Homes Program— introduced by LIPA with NYSERDA in July 2004.
The Potential for Additional Energy-Efficiency Improvements
The preceding review shows that New York State is reaping substantial gains from its programs for reducing electricity consumption. In fact, NYISO projects that the growth rate of consumption for the New York City area will be lower than in the recent past, in part because of these activities by NYSERDA, ConEd, NYPA, and LIPA. This subsection estimates the potential for further gains if these programs are expanded.
Targets for Additional Energy-Efficiency Improvements
One study (NYSERDA, 2003) estimates the potential for energy-efficiency improvements in New York State and provides details for Zones J (New York City) and K (Long Island outside of New York City). The study focuses on 3 years—2007, 2012, and 2022—and analyzes residential, commercial, and industrial sectors separately. The study is based on detailed information about technologies (e.g., 87 technologies or technology bundles for commercial buildings). It concludes that most of the economic potential for energy-efficiency improvements is concentrated in the commercial and residential sectors and not in the industrial sector.
For instance, NYSERDA (2003) forecasts that 3,726 GWh of economic potential would exist by 2007 in the residential sector of New York City, and that this would grow to 4,461 GWh by 2012. The residential efficiency measures that hold the most promise include the following:
-
Lighting—compact fluorescent lightbulbs, fluorescent light fixtures, outdoor light controls, light-emitting diode (LED) nightlights, ceiling fans with fluorescent lights, multifamily common areas with specular reflectors, motion sensors, and LED exit signs;
-
Cooling—efficient central air conditioners, air source heat pumps, ground source heat pumps, duct sealing, duct insulation, room air conditioners, humidifiers, new-construction HVAC systems;
-
Refrigerators—upgrades to more efficient refrigerators, removal of second refrigerators or freezers;
-
Electronics—computer monitors and central processing units (CPUs), laser printers, fax machines, exhaust fans, power supply, waterbed mattress pads, and waterbed replacement; efficient clothes washers; efficient televisions, VCRs, and DVD players;
-
Space heating—efficient furnace fans, programmable thermostats, ENERGY STAR windows, blower door guided air-sealing, attic insulation, wall insulation, foundation insulation, heating controls, heat-recovery ventilators, and improved baseboard systems; and
-
Domestic hot water—upgrade of heat-pump water heaters, upgrade of efficient well pumps, wastewater heat recovery, hot-water conservation measures, desuperheater off-ground source heat pumps.
In the commercial sector of New York City, NYSERDA (2003) forecast that 12,567 GWh of economic potential would exist by 2007 and that this would grow to 13,712 GWh by 2012. The commercial efficiency measures that hold the most promise include these:
-
Indoor lighting—lamp ballasts, fixtures, specular reflectors, compact fluorescent lightbulbs, high-efficiency metal halides, occupancy sensors controls, daylight dimming, LED exit signs;
-
Refrigeration—high-efficiency vending machines, vending misers, high-efficiency refrigerators, high-efficiency reach-in coolers, high-efficiency ice makers, walk-in refrigeration retrofit package, heat pump water heater;
-
Cooling—high-efficiency air conditioning, high-efficiency heat pumps, high-efficiency chillers, optimized HVAC systems, optimized chiller distribution and control systems, water source heat pump, ground source heat pump, emergency control, dual enthalpy control, high-efficiency stove hoods, high-performance glazing;
-
Ventilation—emergency management system control, premium efficiency motor, variable-frequency drive;
-
Office equipment—high-efficiency CPUs, high-efficiency monitors, low-mass copiers, high-efficiency fax machines, high-efficiency printers, high-efficiency internal power supplies;
-
Whole-building controls—retrocommissioing, commissioning, integrated building design, high-efficiency transformers;
-
Water heating—high-efficiency tank-type water heater, point-of-use water heater, booster water heater, heat pump water heater;
-
Outdoor lighting—LED traffic lights, LED pedestrian signs, pulse-start metal halides, compact fluorescent bulbs, improved exterior lighting design;
-
Space heating—high-efficiency heat pumps, water source heat pumps, ground source heat pumps, optimized HVAC systems, optimized chiller control systems, emergency management control systems, high-efficiency stove hood, high-performance glazing; and
-
Miscellaneous—high-efficiency clothes washers, water and wastewater optimization.
A more detailed account of the potential for these measures appears in Appendix G-1.
NYSERDA’s $175 million New York Energy $mart Program (funded by New York’s Systems Benefit Charge program, through a surcharge to each consumer’s bill) has shown that efficiency programs can be successful. A 2004 evaluation of New York Energy $mart concluded that five efficiency programs have saved around 1,000 GWh from 2003 through 2004. The same review concluded that full
implementation of New York Energy $mart is expected to achieve 2,700 GWh in the next 2 years.
These programs already are accounted for in the NYISO demand projections. Expanding current programs and creating new ones could achieve further gains in efficiency. If Indian Point is to be closed, that is one of the replacement options that can be considered.
Potential for Peak-Demand Reduction
Energy-efficiency programs can save considerable electricity, and the NYSERDA (2003) study documented that a great many improvements are available at modest cost. However, not all improvements will save at the same moment. The key consideration in the possible replacement of Indian Point is that of maintaining reliability during periods of peak load. By lowering overall demand, energy-efficiency programs also reduce peak demand, but not by the total of all the improvements.
The committee estimated the peak-load reduction that might realistically be achieved as a result of efficiency programs in the Indian Point region, as shown in Table 2-4. Details of the estimation are provided in Appendix G-2, “Estimating the Potential for Energy-Efficiency Improvements.”
It is unlikely that programs can be put in place with sufficient resources to deliver all of the maximum achievable potential. The program potential is estimated at half the
TABLE 2-4 Committee Estimation of the Potential of Energy-Efficiency Programs in New York Control Area Zones I, J, and K, Selected Years Between 2007 and 2015 (MW)
|
|
Reductions in Year |
||||
|
Maximum Achievable Potential |
2007 |
2008 |
2010 |
2013 |
2015 |
|
Zone I (Westchester County) |
113 |
119 |
127 |
140 |
148 |
|
Zone J (New York City) |
502 |
529 |
563 |
624 |
658 |
|
Zone K (Long Island outside of New York City) |
226 |
239 |
253 |
285 |
297 |
|
Total maximum achievable potential |
842 |
887 |
943 |
1,046 |
1,103 |
|
Total program potential (50% of achievable) |
420 |
440 |
470 |
520 |
550 |
|
Phased-in programmable potential |
100 |
200 |
450 |
525a |
575a |
|
NOTE: Details of the estimation are provided in Appendix G-2, “Estimating the Potential for Energy-Efficiency Improvements.” aNote that the “phased-in programmable” estimates exceed the “total program potential” in these years. This reflects the fact that more efficiency investments are cost-effective with the increased price of fuels today, and this is likely to be the case well into the future. These figures are based on historic (and low, by today’s standards) Energy Information Administration price forecasts to calculate cost-effective energy efficiency. SOURCE: Derived from NYSERDA (2003). |
|||||
achievable potential. This factor is intended to introduce additional conservatism into estimates of the potential for energy efficiency. It is consistent with the estimate of Rufo and Coito (2002, Table 3-3) of the lower bound for advanced efficiency in California at one-half the higher bound for maximum achievable efficiency. The application of this factor results in estimates for program potential that grow from a reduction of 420 MW in 2007 to a reduction of 550 MW in 2015.
Two final adjustments are shown in the bottom line of Table 2-4. First, some lead time is required to phase in and establish new programs and expand existing activities. Programs established or expanded in 2006 will have very limited effect in 2007. Therefore, the program potential of 420 MW in 2007 is reduced to a phased-in programmable potential of 100 MW. The phased-in programmable potential is assumed to grow rapidly to 450 MW in 2010 and to reach the level of the full program potential of 550 MW by 2015. In addition, the committee expects that high fuel prices will increase the incentive to improve efficiency. Therefore the estimated phased-in programmable potential in 2015 is increased to 575 MW.
The estimates in Table 2-4 are consistent with those of other studies. The New York Energy $mart review noted above expected a reduction of peak demand of 880 MW within 2 years (statewide) as a result of program activities. A study presented to the New York State Public Service Commission concluded that the achievable potential for efficiency measures in New York City was 283 MW for residential and 1,392 MW for commercial buildings over 10 years (Plunkett and Gupta, 2004).
Finally, a study of the energy-efficiency potential in the New York City area, sponsored by the Pace Law School Energy Project and the Natural Resources Defense Council, concluded that savings of 1,163 MW to 3,032 MW peak demand could be achieved by aggressive energy-efficiency programs within 2 years (Komanoff, 2002).13 To accomplish such reductions, the study suggested applying the rapid “crash efficiency” techniques—targeting the deployment of more efficient lighting, air conditioners, and appliance standards—employed by the state of California after its energy crisis in 2001. The extreme conditions associated with California’s 2001 programs are not the context within which options for Indian Point are being evaluated, but they do illustrate a higher bound of possibilities if energy efficiency were to become a political rallying cry in New York City.
The Potential for Future Demand Response
Several of NYSERDA’s existing programs illustrate the ability of demand-response programs to reduce peak electri-
cal loads for costs per kilowatt that are far lower than the cost of installing new peak capacity. Three of these programs alone have already avoided the need for over 700 MW of peak capacity:
-
Peak Load Reduction Program: avoids the need for between 355 and 375 MW,
-
Enabling Technology for Price Sensitive Load Management Program: avoids the need for 308 MW, and
-
Keep Cool Program: avoids the need for between 38 and 45 MW.
NYSERDA divides its efficiency programs into three types: business/institutional (which include the Commercial and Industrial Performance Program, New Construction Program, and Peak Load Reduction Program); residential (which includes the Keep Cool Program); and low-income (which includes the Low-Income Assisted Multi-Family Program).14
In the studies referred to here, the prices reflect capacity costs and expenses for the downstate and urban areas. The analyses use avoided costs based on wholesale-electricity bid prices (rather than production costs), and they use energy-efficiency load profiles to differentiate savings by time of day (NYSERDA, 2004b, p. 1).
The studies evaluating NYSERDA programs also distinguish between proposed megawatts (demand target), enabled megawatts (coincident demand reduction), pledged mega-watts (based on self-reporting), and delivered megawatts (averaged hourly reduction). Most of the estimates below (unless otherwise noted) refer to pledged megawatts. When some of the evaluations listed the delivered megawatts, they were typically only half the pledged rate. On the other hand, the estimated cost per megawatt of demand reduction is generally much lower than that of new supply options.
Peak Load Reduction Program
The Peak Load Reduction Program (PLRP), created in 2000, uses four different program segments:
-
Permanent demand-reduction efforts, which result in reduced demand through the installation of peak-demand-reduction equipment;
-
Load curtailment and shifting, through enrollment in the NYISO demand-response program;
-
Dispatchable emergency generator initiatives, which allow owners of backup generators to remove their load from the grid in response to NYISO requests; and
-
Interval meters, which reduce peak demand at the site of consumption.
The program avoids between 355 and 375 MW of peak demand. However, 340 MW of this is “callable,” and only about 15 to 20 MW are permanent. Participants that are callable receive annual capacity payments and are required to perform when called. The program costs around $42.7 million over 8 years, or approximately $120/kW of peak-load reduction.
Enabling Technologies Program
The Enabling Technologies Program (ETP), created in 2000, supports innovative technologies that enhance load serving entities (LSEs), curtailment service providers (CSPs), and NYISO. It directs customers to reduce load in response to emergency or market-based price signals. The technologies used include advanced meters, transaction-management software, and networking and communication solutions. As of 2003, the ETP has saved 308 enabled peak MW. The program costs around $34.4 million per 8 years, or approximately $110/kW of peak-load reduction.15
Together, the PLRP and ETP saved 174 MW in 2001, 311 MW in 2002, and 288 MW in 2003.16
Keep Cool Program
The Keep Cool Program was started in 2001 and ended in 2003. It encouraged the replacement of old, inefficient air conditioners with new ENERGY STAR-rated room air conditioners and through-the-wall units. The program has two main components: it includes rebates and incentives for customers, and it uses a significant marketing campaign that encourages customers to shift appliance use to nonpeak periods. As a result of the wide scope of its multimedia marketing program, the Keep Cool Program resulted in about 361,000 units being replaced, of which 141,000 units were given incentives through the program.
The program is estimated to have avoided approximately 41 MW of peak demand in every year of the program. The program costs around $19.9 million over 8 years, or approximately $490/kW of peak-load reduction.17
In conclusion, these three programs document the potential for NYSERDA demand programs to cost-effectively reduce peak loads.
Estimating the Potential for Demand Reduction
The committee estimated the potential for demand-
|
14 |
For more on these programs, see the useful tables in “New York Energy $mart Program Cost-Effectiveness Assessment” (NYSERDA, 2004b, p. 2-3). |
|
15 |
An updated program evaluation report (Heschong Mahone Group, 2005) evaluated the Peak Load Reduction and Enabling Technologies Programs together. It estimates peak reductions of 178 MW (p. 25), costs of $28.8 million (Table 3-9, p. 24), for a cost per peak reduction of $163/kW. |
|
16 |
See NYSERDA (2004b, p. 34). |
|
17 |
An updated program evaluation report (Heschong Mahone Group, 2005) estimates peak reductions of 19.7 MW (Table 3-1, p. 16), costs of $18.4 million (Table 1-3, p. 4), for a cost per peak reduction of $934/kW. |
response programs to reduce peak demand in the Indian Point service area, as shown in Table 2-5. Details of the estimation are provided in Appendix G-3, “Estimating Demand-Response Potential.”
In total, energy-efficiency and demand-response programs in Zones I, J, and K are estimated to be able to deliver peak-demand reductions of 150 MW in 2007, rising to 650 MW in 2010, and 875 MW in 2015 (see Tables 2-4 and 2-5).
The Potential for Expanded Combined Heat and Power
Many studies have assessed the potential for combined heat and power in New York State, with some looking more specifically at opportunities within the Consolidated Edison service territory and/or the relevant New York Control Area load zones in the vicinity of Indian Point.
A 2002 study in New York State (NYSERDA, 2002) noted that there are approximately 5,000 MW of CHP already installed in the state; it assessed the “technical potential” for additional CHP, that is, “the remaining market size constrained only by technological limits.” Technical potential does not consider other factors such as capital availability, natural gas availability, and variations in consumption within customer application and size class. The report looked only at CHP, not at other DG technologies that do not involve heat production. It identifies nearly 8,500 MW of technical potential for new CHP in New York at 26,000 sites. Close to 74 percent of remaining capacity is below 5 MW and is primarily at commercial and institutional facilities.
The largest proportion of this capacity is in the ConEd service territory. NYSERDA (2002) identified almost 3,000 MW of technical potential among its customers, the largest opportunities being office buildings, hotels and motels, apartments, schools, and colleges and universities. The report also identified about 300 MW of CHP technical potential among ConEd industrial customers, the largest opportunities being chemical and food plants and textile and paper manufacturers.
TABLE 2-5 Committee Estimation of Potential Peak Reduction from Demand-Response Programs in New York Control Area Zones I, J, and K, Selected Years Between 2007 and 2015 (MW)
|
|
Reductions in Year |
||||
|
|
2007 |
2008 |
2010 |
2013 |
2015 |
|
Demand-response programs |
50 |
100 |
200 |
275 |
300 |
|
NOTE: Zone I, southern part of Westchester County; Zone J, New York City; Zone K, Long Island outside of New York City. Details of the estimation are provided in Appendix G-3, “Estimating Demand-Response Potential.” |
|||||
The NYSERDA (2002) study stressed that the actual market penetration of CHP will depend on several factors, including the economic advantage of CHP over separately purchased fuel and power, the sites with economic potential, and the speed with which the market can ramp up in the development of new projects. The study developed base case and accelerated case models for CHP market penetration; the models differed in terms of assumptions about power costs, standby rates, technology advances, CHP policy changes including tax incentives, and customer awareness and adoption rates. In the base case, an additional 764 MW of CHP is projected to be installed in New York State by 2012. Nearly 70 percent of this capacity (or 535 MW) is projected to be in the downstate region that includes Indian Point. In the accelerated case, cumulative market penetration reaches nearly 2,200 MW statewide. About 60 percent (1,320 MW) of the penetration is projected in the downstate region in 2012.
Using a trajectory of market expansion for CHP similar to that for energy-efficiency and demand-response programs, the base case estimate of 535 MW in 2012 could be phased in to the marketplace as estimated by the committee and presented in Table 2-6.
The Potential for Expanded Distributed Photovoltaics
Photovoltaics can provide high-value peak-time power in a distributed fashion and with minimal environmental emissions. Thus, PV could contribute significantly to grid stability, reliability, and security (Perez et al., 2004). Rapidly declining PV costs could make this technology a significant contender for replacement power within the time frame of this study even though PV is an intermittent source of electricity. Throughout the 2006-2015 period, installations would have to be subsidized, but the end result could be an important new energy source with many desirable attributes and a thriving industry.
TABLE 2-6 Committee Estimation of Potential Peak Reduction from Combined Heat and Power in New York Control Area Zones I, J, and K, Selected Years Between 2007 and 2015 (MW)
|
|
Reductions in Year |
||||
|
|
2007 |
2008 |
2010 |
2013 |
2015 |
|
Combined heat and power |
100 |
200 |
450 |
550 |
600 |
|
NOTE: Zone I, southern part of Westchester County; Zone J, New York City; Zone K, Long Island outside of New York City. Details of the estimation are provided in Appendix G-3, “Estimating Demand-Response Potential.” SOURCE: Derived from NYSERDA (2002). |
|||||
Unlike the options discussed above, projections of PV installations on the scale envisioned here cannot be based on current prices or U.S. programs and progress. Rather, the accelerated PV-deployment scenario described here is modeled on the Japanese program that provided a declining subsidy to residential PV systems over the past decade. Residential PV installations expanded in Japan from roughly 2 MW in 1994 to 800 MW in 2004 (Ikki, 2005). Results are presented in Table 2-7; the analysis is in Appendix D-7, “Distributed Photovoltaics to Offset Demand for Electricity,” and Appendix G-4, “Estimating Photovoltaics for Demand Reduction.” (The analysis of PV potential is based on solar insolation data from the National Solar Radiation Data Base of the U.S. Department of Energy’s National Renewable Energy Laboratory [NREL]. This database has data from seven sites in New York State, including one site in New York City.) It might also be noted that, in January 2006, California announced a solar initiative with a goal of 3,000 MW of photovoltaics by 2017 (California PUC, 2006).
Summary
Additional cost-effective demand-side investments in energy efficiency, demand response, and combined heat and power facilities can significantly offset peak demand, as presented in Tables 2-4 though 2-6. These new initiatives (beyond those currently anticipated) could reduce peak demand by 1 GW or more by 2010 and 1.5 GW by 2015. If the cost of
TABLE 2-7 Committee Estimation of Potential Peak Reduction from Photovoltaics in New York Control Area Zones I, J, and K, Selected Years Between 2007 and 2015
|
|
Achieved in Year |
||||
|
|
2007 |
2008 |
2010 |
2013 |
2015 |
|
Installed system cost ($/W) |
7.36 |
7.02 |
6.34 |
5.40 |
4.80 |
|
Subsidy rate (%) |
47 |
44 |
38 |
27 |
19 (declining to 0 in 2019) |
|
Annual subsidy (million $) |
29 |
36 |
56 |
74 |
72 (declining to 0 in 2019) |
|
Annual installations (MW) |
8.4 |
11.8 |
23.0 |
50.4 |
78.8 |
|
Cumulative installations (MW) |
18.6 |
30.4 |
69.9 |
192.9 |
334.7 |
|
Reduction in peak demand (MW) |
14 |
23 |
52 |
144 |
250 |
|
NOTE: Zone I, southern part of Westchester County; Zone J, New York City; Zone K, Long Island outside of New York City. Details of the estimation are provided in Appendix D-7, “Distributed Photovoltaics to Offset Demand for Electricity,” and Appendix G-4, “Estimating Photovoltaics for Demand Reduction.” |
|||||
distributed photovoltaics can be brought to near-competitive levels over the next decade (see Table 2-7), demand-side measures could contribute 1.7 GW by 2015, thus approaching the capacity of Indian Point (about 2 GW).
The effectiveness of demand-side options in downstate New York, to date, has been variable owing to numerous obstacles to deployment, and forecasted program performance is always uncertain. However, there is a growing body of evidence from New York (through NYSERDA), California, and other states and communities that demand-side options can be implemented swiftly and cost-effectively. Conclusions for each of the four demand-side opportunities are summarized in Figure 2-4.
Energy efficiency programs offer significant potential for peak-demand reduction. Based on prior assessments of hundreds of energy-efficiency measures for residential and commercial buildings, it is estimated that 100 MW of additional peak reduction could be achieved in 2007 if new and expanded programs were to begin in January 2006. This economic and programmable potential is assumed to grow to 450 MW in 2010 and to reach 575 MW by 2015 (Table 2-4).
The estimated potential for demand-response programs to reduce peak demand in the Indian Point service territory is based on the experience to date with three NYSERDA programs that avoided the need for 715 MW of peak demand in the state of New York in 2004. Evaluations of the recent performance of these programs suggest that they offer a highly cost-effective mechanism for reducing peak demand. Assuming that a doubling of program budgets could expand the demand reduction by 50 percent, the committee estimates that the Indian Point service territory has the potential for
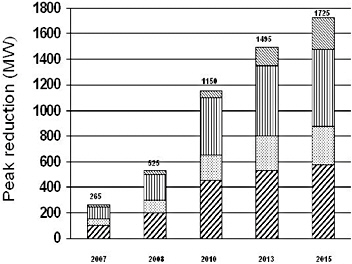
FIGURE 2-4 Phased-in programmable potential for expanded demand-side options in the Indian Point service territory (in mega-watts of peak reduction). Heavily hatched bars, energy-efficiency programs; dotted bars, demand-response programs; vertically striped bars, distributed heat and power; and lightly hatched bars, distributed photovoltaics.
expanded summer peak reductions of approximately 200 MW in 2010 and 300 MW in 2015 (Table 2-5).
The actual market penetration of combined heat and power will depend on several factors including fuel prices, standby rates, and the speed with which the market can ramp up its production and services. Under the assumption of accelerated deployment policies, the phase-in programmable potential for expanded CHP is estimated to grow from 100 MW in 2007 to 450 MW in 2010 and 600 MW in 2015 (Table 2-6).
Under an aggressive deployment scenario, it is estimated that 70 MW of distributed photovoltaics could be installed in the Indian Point service territory by 2010, and 335 MW by 2015 (Table 2-7). Realizing this accelerated scenario would require reductions in the cost of PV systems and a long-term commitment to expanding New York’s existing PV programs. Such an initiative could establish a self-sustaining PV market in New York, resulting in the continued growth in PV distributed power well beyond the time horizon of this study.
It should be noted that the discussion in this chapter has been relevant to the summer peak only. The New York Control Area also has a winter peak that is about 80 percent of the summer peak. Some of the efficiency measures (e.g., air conditioners) discussed here will not apply in the winter, and PV will contribute little or nothing to the winter peak. The committee did not have the time or resources to examine the winter peak, but this analysis should be performed before it can be fully concluded that demand-side measures would play a large role in replacing the electric power from Indian Point. This analysis also should include a full assessment of the availability of natural gas to enable expanded CHP use in winter (curtailments of gas deliveries to electric generators already occur in the heating season) and the somewhat higher efficiency of many generators and transmission lines in cold weather.
Impediments to Demand-Side Programs
If demand-side programs are so cost-effective, why are they not in more widespread use? If individuals or businesses can make money from energy efficiency, why don’t they all just do so? If electricity providers can reduce demand more cheaply than they can deliver new energy supplies, why isn’t energy efficiency a larger part of their services? These questions can be answered in large part by describing the range of obstacles that prevent the full exploitation of energy efficiency, including misplaced incentives, distortions of fiscal and regulatory policies, electricity pricing policies, insufficient and incorrect information, and others as discussed below. These are the targets that policies would have to address if demand-side options are to play their full role.
As suggested in that long list, the impediments to energy efficiency are numerous and variable. They depend on the characteristics of a region, the technology, and the supply infrastructure. At the outset, misplaced incentives inhibit energy-efficient investments whenever an “intermediary” has the authority to act on behalf of a consumer, but does not fully reflect the consumer’s best interests. The landlord-tenant relationship is a classic example of misplaced incentives. Decisions about the energy features of a building (e.g., whether to install high-efficiency windows and lighting) are often made by people who will not be responsible for the energy bills. For example, landlords often buy the air conditioning equipment and major appliances, while the tenant pays the electricity bill. As a result, the landlord is not generally rewarded for investing in energy efficiency. Conversely, when the landlord pays the utility bills, the tenants are typically not motivated to use energy wisely. As a result, tenants have no incentive to install efficient measures benefiting the landlord, and the landlord has little incentive to invest in measures that benefit the tenant (Ottinger and Williams, 2002). About 90 percent of all households in multifamily buildings are renters, which makes misplaced incentives a major obstacle to energy efficiency in urban housing markets such as New York City.
Distortionary fiscal and regulatory policies can also restrain the use of efficient energy technologies. A range of these obstacles was recently identified in an analysis of projects aimed at installing distributed generation, which is modular electric power located close to the energy consumer; it includes photovoltaics, diesel generators, gas turbines, and fuel cells. Regulatory barriers to these new technologies include state-to-state variations in environmental permitting requirements that result in significant burdens to project developers. Utilities also set high uplift charges (a fee that taxes the amount of revenue gained from selling electricity) and demand fees (a charge that penalizes customers for displacing demand from utilities) that discourage the use of distributed power systems (Allen, 2002). A recent study by the NREL found a variety of “extraneous” charges associated with the use of dispersed renewable technologies (Alderfer and Starrs, 2000). The senior editor of Public Utilities Fortnightly described such charges as “a major obstacle to the development of a competitive electricity market” (Stavros, 1999, p. 37).
Electricity pricing policies can also prevent markets from operating efficiently and subdue incentives for energy efficiency. The price of electricity in most retail markets today is not based on time of use. It therefore does not reflect the real-time costs of electricity production, which can vary by a factor of ten within a single day. Because most customers buy electricity as they always have—under time-invariant prices that are set months or years ahead of actual use— consumers are not responsive to the price volatility of wholesale electricity. Time-of-use pricing would encourage customers to use energy more efficiently during high-price periods. These market failures can be exacerbated by competitive wholesale markets, since generators have no incentive to promote efficiency or load management because they
profit handsomely from high peak prices. Under current rate designs, LSEs also profit from throughput, finding their profits mitigated by energy efficiency programs. In this way, current market structures “actually block price signals from reaching service providers” (Cowart, 2001, p. vii).
In sum, because of these market barriers, neither electricity generators, transmission companies, nor consumers see the real value of efficiency. Without better price signals, it is challenging for the providers of energy-efficient products and services to transform consumer markets; as a result, incentives such as rebates and tax credits for improved end-use technologies are needed above and beyond those that already exist.
Furthermore, insufficient and incorrect information can also be a major obstacle to energy efficiency. Reliable information about product price and quality allows firms to identify the least costly means of production and gives consumers the option of selecting goods and services that best suit their needs. Yet information about energy-efficient options is often incomplete, unavailable, expensive, and difficult to obtain. With such information deficiencies, investments in energy efficiency are hindered. It is difficult to learn about the performance and costs of energy-efficient technologies and practices because the benefits are often not directly observable. For example, residential consumers get a monthly electricity bill that provides no breakdown of individual end uses, making it difficult to assess the benefits of efficient appliances, televisions, and other products. The complexity of design, construction, and operation of commercial buildings makes it difficult to characterize the extent to which a particular building is energy efficient.
While there are tools such as ENERGY STAR branding, studies have shown that many consumers do not understand them. Further compounding the problem of measuring gains from efficiency concerns the notion of “take-back.” When a device has a gain in energy efficiency, consumers have additional resources to spend or save. Some of these resources may be spent on additional energy-consuming activities, which means that the full potential for energy savings does not materialize. Blumstein (1993, p. 970) noted “that low-income programs have a higher than average ‘take-back’ effect (the participants take back some of the energy saved by taking other actions to increase their comfort).” Based on a recent review of a wide range of markets (Geller and Attali, 2005, Table 1), the take-back, or rebound, effect would appear to be relatively small, generally ranging from 10 to 20 percent.
Decision-making complexities are another source of imperfect information that can confound consumers and inhibit “rational” decision making. Even while recognizing the importance of life-cycle calculations, consumers often fall back to simpler first-cost rules of thumb. While some energy-efficient products can compete on a first-cost basis, many of them cannot. Properly trading off energy savings versus higher purchase prices involves comparing the time-discounted value of the energy savings with the present cost of the equipment—a calculation that can be difficult for purchasers to understand and compute. This is one of the reasons builders generally minimize first costs, believing (probably correctly) that the higher cost of more efficient equipment will not be capitalized into a higher resale value for the building. Moreover, the decentralized nature of the construction industry—home to more than 100,000 builders in the United States—usually means that those engaged in building design and construction have little interaction with one another. The result is lack of information awareness among builders, consumers, and specialists in the building process (Alliance to Save Energy, 2005; Loper et al., 2005). The complexity of the building market is accompanied by confusing and uncoordinated institutional arrangements, with different government agencies sometimes in charge of regulating, implementing, and enforcing the same statute. For example, 18 states have adopted the International Energy Conservation Code of 2003, while 9 states have energy codes that are more than a decade old or follow no energy code at all.
Energy efficiency is not a major concern for most consumers because energy costs are not high relative to the cost of many other goods and services. In addition, the negative externalities associated with the U.S. energy system are not well understood by the public. The result is that the public places a low priority on energy issues and energy-efficiency opportunities, which in turn reduces producers’ interest in providing energy-efficient products. In most cases, energy is a small part of the cost of owning and operating a building or a factory. Of course, there are exceptions. For low-income families, the cost of utilities to heat, cool, and provide other energy services in their homes can be a very significant part of their income—averaging 15 percent compared with 4 percent for the typical U.S. citizen. For energy-intensive industries such as aluminum and steel, energy can represent 10 to 25 percent of their production costs. Many companies in these more energy-intensive firms have decided to incorporate energy management as a key corporate strategy.
Since energy costs are typically small on an individual basis, it is easy (and rational) for consumers to ignore them in the face of information-gathering and transaction costs (Harrington and Murray, 2003, p. 3). However, the potential energy savings can be important when summed across all consumers. A little work to influence the source of mass-produced products can pay off in significant efficiency improvements and emissions reductions that rapidly propagate through the economy owing to falling production costs as market shares increase.
Energy prices, as a component of the profitability of an investment, are also subject to large fluctuations. The uncertainty about future energy prices, especially in the short term, seems to be an important barrier. Such uncertainties often lead to higher perceived risks and therefore to more stringent investment criteria and a higher hurdle rate. An important
reason for high hurdle rates is capital availability. Capital rationing is often used within firms as an allocation means for investments, leading to hurdle rates that are much higher than the cost of capital, especially for small projects.
Lack of availability of energy-efficient technologies is also often a problem. For example, the purchase of heat-pump water heaters and ground-coupled heat pumps has been handicapped by limited access to equipment suppliers, installers, and repair technicians (Brown et al., 1991; Optimal Energy and the State Grid Corporation DSM Instruction Center, 2005). The problem of access is exacerbated in the case of heating equipment and appliances; because they are often bought on an emergency basis, choices are limited to available stock. Retrofitting can also be expensive, time consuming, and intrusive for home owners and commercial enterprises, especially for businesses that cannot afford the “downtime” needed for installation. Building stock also turns over very slowly, suggesting that inefficient structures remain in use for decades (Ferguson and White, 2003, pp. 15-16).
Finally, managerial and commercial attitudes impede the use of energy-efficient technologies. In the manufacturing sector, energy-efficiency investments are hindered by a preference for investments that increase output compared with investments that reduce operating costs (Hirst and Brown, 1990; Alliance to Save Energy, 1983; Sassone and Martucci, 1984). Similarly, electric utilities believe that they possess the duty and obligation to serve customers’ needs. Electric utility regulations have been built on ancient common law duty, known as the “duty to serve” the customer, applied to public utilities such as ferries, flour mills, and railroads. In the words of James Rossi, professor of law at Florida State University, “In the public utility context the duty to serve requires service where it is not ordinarily considered profitable.” As one utility executive exclaimed in a recent editorial, “We can’t hide behind restructuring and deregulation. Even with unbundled generation, the obligation to serve the load remains” (Lovins et al., 2002, p. 88). Thus, the belief among utility managers and policy makers persists that they need only provide the energy that the customer requires, rather than reforming their customers’ consumption requirements through energy-efficiency measures.
Collectively, these social, economic, and cultural impediments greatly inhibit the use of demand-side options. Aggressive policy measures are required to overcome them.
REFERENCES
Alderfer, R. Brent, and Thomas J. Starrs. 2000. Making Connections: Case Studies of Interconnection Barriers and Their Impact on Distributed Power Projects. National Renewable Energy Laboratory (NREL)/SR-200-28053. Golden, Colo.: NREL.
Allen, Anthony. 2002. “The Legal Impediments to Distributed Generation.” Energy Law Journal 23: 505-523.
Alliance to Save Energy. 1983. Industrial Investment in Energy Efficiency: Opportunities, Management Practices, and Tax Incentives. Washington, D.C.: Alliance to Save Energy.
—. 2005. Blueprint for Energy-Efficiency Acceleration Strategies for Buildings in the Western Hemisphere. Washington, D.C.: Alliance to Save Energy, June 14.
Blumstein, Carl. 1993. “The Cost of Energy Efficiency.” Science 261(5124, August 20): 969-971.
Brown, M.A., L.G. Berry, and R. Goel. 1991. “Guidelines for Successfully Transferring Government-Sponsored Innovations.” Research Policy 20(2): 121-143.
Brown, Marilyn A., Frank Southworth, and Therese K. Stovall. 2005. “Towards a Climate-Friendly Built Environment.” Pew Center on Global Climate Change, June. Available at http://www.pewclimate.org/. Accessed April 21, 2006.
California PUC (California Public Utility Commission). 2006. California Solar Incentive Program. Available at http://www.cpuc.ca.gov/static/ energy/solar/. Accessed April 21, 2006.
Cowart, Richard. 2001. Efficient Reliability: The Critical Role of Demand-Side Resources in Power Systems and Markets. Report to the National Association of Regulatory Utility Commissioners. Regulatory Assistance Project. June.
Energy Information Administration. 2006. Annual Energy Outlook 2006. Available at http://www.eia.doe.gov/oiaf/aeo/index.html. Accessed April 21, 2006.
Ferguson, Richard, and V. John White. 2003. “Risky Diet: 2003.” In Natural Gas: The Next Energy Crisis. Los Angeles: Center for Energy Efficiency and Renewable Technologies. September.
Geller, H., and S. Attali. 2005. “The Experience with Energy Efficiency Policies: Learning from the Critics.” International Energy Agency. Available at www.iea.org/textbase/papers/2005/efficiency_policies.pdf. Accessed April 21, 2006.
Gillingham, K., R. Newell, and K. Palmer. 2004. Retrospective Review of Demand-Side Energy Efficiency Policies. Washington, D.C.: National Commission on Energy Policy.
Goldman, C., N. Hopper, R. Bharvirkar, B. Neenan, R. Boisvert, P. Cappers, D. Pratt, and K. Butkins. 2005. Customer Strategies for Responding to Day-Ahead Market Hourly Electricity Pricing. LBNL-57128. Berkeley, Calif.: Lawrence Berkeley National Laboratory.
Harrington, Cheryl, and Catherine Murray. 2003. “Who Should Deliver Ratepayer Funded Energy Efficiency?” Regulatory Assistance Project Survey and Discussion Paper. Montpelier, Vermont. May.
Heschong Mahone Group. 2005. “New York Energy Smart Program Cost-Effectiveness Assessment.” Prepared for New York State Energy Research and Development Authority. June.
Hirst, E., and M.A. Brown. 1990. “Closing the Efficiency Gap: Barriers to the Efficient Use of Energy.” Resources, Conservation and Recycling 3: 267-281.
Ikki, Osamu. 2005. PV Activities in Japan. Tokyo, Japan: RTS Corporation. May.
Kirby, Brendan, Chuck Goldman, Grayson Hefner, and Michael Kintner-Meyer. 2005. Load Participation in Reserves Markets: Experiences in U.S. and Internationally. October.
Komanoff, Charles. 2002. “Securing Power Through Energy Conservation and Efficiency in New York: Profiting from California’s Experience.” Pp. 1-22 in Report for the Pace Law School Energy Project and the Natural Resources Defense Council. May.
Loper, J., L. Ungar, D. Weitz, and H. Misuriello. 2005. Building on Success: Policies to Reduce Energy Waste in Buildings. Report to the Alliance to Save Energy. Washington, D.C. July.
Lovins, Amory, et al. 2002. Small Is Profitable: The Hidden Benefits of Making Electrical Resources the Right Size. Snowmass, Colo.: Rocky Mountain Institute.
Margolis, Robert M., and Frances Wood. 2004. “The Role for Solar in the Long-Term Outlook of Electric Power Generation in the U.S.” Paper presented at the IAEE North American Conference in Washington, D.C., July.
National Energy Efficiency Best Practices Study. 2004. Best Practices Benchmarking for Energy Efficiency Programs. Crosscutting Best Practices and Project Summary, December.
NYISO (New York Independent System Operator). 2005a. Comprehensive Reliability Planning Process Supporting Document and Appendices for the Reliability Needs Assessment. Albany, N.Y. December 21.
—. 2005b. Comprehensive Reliability Planning Process and Draft Reliability Needs Assessment. Albany, N.Y. September 1.
NYSERDA (New York State Energy Research and Development Authority). 2002. Combined Heat and Power, Market Potential for New York State.
—. 2003. Energy Efficiency and Renewable Energy Resource Development Potential in New York State. Final Report. August.
—. 2004a. New York Smart Program Evaluation and Status Report. Final Report: Executive Summary, May.
—. 2004b. New York Energy $mart Program Cost-Effectiveness Assessment. Submitted by Heschong Mahone Group. December.
—. 2005a. 2004 Annual Report.
—. 2005b. Financial Statements. March 31. Available at www.nyserda.org/ publications/financials05.pdf. Accessed April 21, 2006.
Optimal Energy and the State Grid Corporation DSM Instruction Center. 2005. “DSM Strategic Plan for Jiangsu Province.” Final Draft Report, February 11.
Ottinger, Richard L., and Rebecca Williams. 2002. “2002 Energy Law Symposium: Renewable Energy Sources for Development.” Environmental Law 32: 331-362.
Perez, Richard, et al. 2004. “Solar Energy Security.” REFocus (July/ August): 24-29.
Plunkett, John, and Ashok Gupta. 2004. “State of New York Public Service Commission: Proceeding on the Motion of the Commission as to the Rates, Charges, Rules and Regulations of Consolidated Edison Company of New York, Inc. for Electric Service.” December 15.
Rufo, Michael, and Fred Coito. 2002. “California’s Secret Energy Surplus: The Potential for Energy Efficiency.” San Francisco: The Energy Foundation. September 23. Available at http://www.ef.org/news_reports.cfm ?program=viewall&sort=creationdate. Accessed April 21, 2006.
Sassone, P.G., and M.V. Martucci. 1984. “Industrial Energy Conservation: The Reasons Behind the Decisions.” Energy 9: 427-437.
SEIA (Solar Energy Industries Association). 2004. Our Solar Power Future: The U.S. Photovoltaic Industry Roadmap Through 2030 and Beyond. Washington, D.C.: Solar Energy Industries Association.
Silva, Patricio. 2001. “National Energy Policy: Conservation and Energy Efficiency.” Hearing Before the Subcommittee on Energy and Air Quality of the House Committee on Energy and Commerce, June 22. Washington, D.C.: Government Printing Office.
Stavros, Richard. 1999. “Distributed Generation: Last Big Battle for State Regulators?” Public Utilities Fortnightly 137(October 15): 34-43.
USDOE (U.S. Department of Energy). 2004. Solar Energy Technologies Program, Multi-year Technical Plan 2003-2007 and Beyond. Report DOE/GO-102004-1775. Washington, D.C.: Office of Energy Efficiency and Renewable Energy, U.S. Department of Energy.


