
11
Large-Scale Multiproxy Reconstruction Techniques
Using proxy evidence to study past climates helps us put the 20th century warming into a broader context, as well as to better understand the climate system and improve projections of future climate. The proxy climate records described in Chapters 3–8, which have been assembled and refined over a period of many decades, have been used to examine diverse aspects of climate history. Many of these studies have combined information from different proxy types to take advantage of the strengths of, and minimize the limitations of, individual proxies. In the late 1990s, scientists began to use this methodology for the specific purpose of estimating the variations in temperature over the last millennium, averaged at large (global and hemispheric) geographic scales. These large-scale multiproxy-based surface temperature reconstructions offer a quantitative assessment of large-scale surface temperature variations. They generally fall into two categories: those that combine multiple records of the same type of proxy (e.g., tree rings from various locations) and those that combine different types of records (e.g., tree rings together with documentary evidence, sediment records, etc.). Large-scale surface temperature reconstructions based on multiproxy techniques often have a time resolution as fine as decades or individual years; they also enable researchers to estimate the statistical uncertainties associated with the reconstruction technique, as described in Chapter 9. To improve spatial coverage, some reconstructions include proxies that may be more sensitive to precipitation than to temperature, in which case statistical techniques are used to infer the temperature signal, exploiting the spatial relationship between temperature and precipitation.
There are two general approaches that are commonly used to perform the calibration, validation, and reconstruction steps for large-scale surface temperature reconstructions. In the first approach, proxies are calibrated against time series of the dominant patterns of spatial variability in the instrumental temperature record and the results are combined to obtain a time series of large-scale mean surface temperature. In the second approach, the individual proxy data are first composited, and this composite series is then calibrated directly against the time series of large-scale temperature variations.
Both the number and the quality of the proxy records available for surface temperature
reconstructions decrease dramatically from century-to-century moving backward in time (see, e.g., Figure O-2). At present, fewer than 30 annually resolved proxy time series extend further back than A.D. 1000; relatively few of these are from the Southern Hemisphere and even fewer are from the tropics. Although fewer sites are required for defining long-term (e.g., century-to-century) variations in hemispheric mean temperature than for short-term (e.g., year-to-year) variations (see Chapter 2), the coarse spatial sampling limits our confidence in hemispheric mean or global mean temperature estimates prior to A.D. 1600 and makes it very difficult to generate meaningful quantitative estimates of global temperature variations prior to about A.D. 900. Moreover, the instrumental record is shorter than some of the features of interest in the preindustrial period (i.e., the extended period of sporadic warmth from A.D. 800 to 1300 and the subsequent Little Ice Age), so there are very few statistically independent pieces of information in the instrumental record for calibrating and validating long-term temperature reconstructions.
EVOLUTION OF MULTIPROXY RECONSTRUCTION TECHNIQUES
The first systematic, statistically based synthesis of multiple climate proxies was carried out in 1998 by Michael Mann, Raymond Bradley, and Malcolm Hughes (Mann et al. 1998); their study focused on temperature for the last 600 years in the Northern Hemisphere. The analysis was later extended to cover the last 1,000 years (Mann et al. 1999), and the results were incorporated into the 2001 report of the Intergovernmental Panel on Climate Change (IPCC 2001). Later, Mann and Jones (2003b) extended the multiproxy reconstruction further back to cover the last 1,800 years (see Figure 10-4). On the basis of these reconstructions, it was concluded that temperatures gradually dropped from a relative maximum at about A.D. 1000 to a minimum at about 1850 and then increased sharply through the 20th century. The graph illustrating the trend, often called the hockey stick curve (reproduced in Figure O-4), received wide attention because it was interpreted by some people as definitive evidence of human-induced global warming. The ensuing debate in the scientific literature continues even as this report goes to press (von Storch et al. 2006, Wahl et al. 2006).
The Mann et al. large-scale surface temperature reconstructions were the first to include explicit statistical error bars, which provide an indication of the confidence that can be placed in the results. In the Mann et al. work, the error bars were relatively small back to about A.D. 1600, but much larger for A.D. 1000–1600. The lower precision during earlier times is caused primarily by the limited availability of annually resolved paleoclimate data: That is, the farther back in time, the harder it is to find evidence that provides reliable annual information. For the period before about A.D. 900, annual data series are very few in number, and the non-annually resolved data used in reconstructions introduce additional uncertainties.
Since the late 1990s, a number of alternative reconstructions have been generated using different statistical methods and proxy datasets (Esper et al. 2002a,b, 2003; Cook et al. 2004; Moberg et al. 2005b; Rutherford et al. 2005; Hegerl et al. 2006; D’Arrigo et al. 2006; Wahl and Amman in press). Figure 11-1 shows the results of several of these efforts, some of which are described in additional detail in the next section.
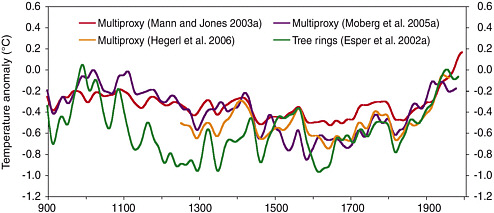
FIGURE 11-1 Four different large-scale multiproxy- and tree-ring-based surface temperature reconstructions, shown for the period A.D. 900–2005. See Figure O-5 for additional information on each data series.
Criticisms and Advances of Reconstruction Techniques
There have been criticisms of the techniques used to create large-scale surface temperature reconstructions and, in particular, of the work done by Mann et al. (e.g., Zorita and von Storch 2005; McIntyre and McKitrick 2003, 2005a,b; von Storch et al. 2004; Moberg et al. 2005b). One criticism is related to the question of whether century-to-century climate variations are underestimated in proxy records that have strong year-to-year variability and consist of segments that have been spliced together to obtain a chronology longer than any of the segments. Several research groups have developed reconstruction methods to address this problem. For instance, Esper et al. (2002a) developed a tree-ring-based reconstruction that attempts to remove the bias by using improved statistical methods explicitly designed to preserve low-frequency variability. Moberg et al. (2005b) separated annual records (tree rings) from smoother (non-annual) records (such as ice borehole temperatures and sediment based records) by using wavelet analysis. These studies indicate that the true amplitude of temperature variations over the last 1,000–2,000 years may have been roughly twice as large as was previously proposed (see Figure 11-1), although their results differ in geographic emphasis and in the details of the time sequence of the temperature changes. Von Storch et al. (2004) used a long-term climate model simulation to produce artificial proxy data and then compared reconstructions of hemispheric mean temperature with varying degrees of noise contamination; they found that the full amplitude of century-to-century variations were underestimated to an increasing degree as the noise level was increased. Thus, the reconstruction of century-long trends has substantial uncertainty when it is based on data that exhibit year-to-year variability.
A second area of criticism focuses on statistical validation and robustness. McIntyre and McKitrick (2003, 2005a,b) question the choice and application of statistical meth-
ods, notably principal component analysis; the metric used in the validation step of the reconstruction exercise; and the selection of proxies, especially the bristlecone pine data used in some of the original temperature reconstruction studies. These and other criticisms, explored briefly in the remainder of this chapter, raised concerns that led to new research and ongoing efforts to improve how surface temperature reconstructions are performed.
As part of their statistical methods, Mann et al. used a type of principal component analysis that tends to bias the shape of the reconstructions. A description of this effect is given in Chapter 9. In practice, this method, though not recommended, does not appear to unduly influence reconstructions of hemispheric mean temperature; reconstructions performed without using principal component analysis are qualitatively similar to the original curves presented by Mann et al. (Crowley and Lowery 2000, Huybers 2005, D’Arrigo et al. 2006, Hegerl et al. 2006, Wahl and Ammann in press). The more important aspect of this criticism is the issue of robustness with respect to the choice of proxies used in the reconstruction. For periods prior to the 16th century, the Mann et al. (1999) reconstruction that uses this particular principal component analysis technique is strongly dependent on data from the Great Basin region in the western United States. Such issues of robustness need to be taken into account in estimates of statistical uncertainties.
Huybers (2005) and Bürger and Cubasch (2005) raise an additional concern that must be considered carefully in future research: There are many choices to be made in the statistical analysis of proxy data, and these choices influence the conclusions. Huybers (2005) recommends that to avoid ambiguity simple averages should be used rather than principal components when estimating spatial means. Bürger and Cubasch (2005) use several dozen statistical methods to generate examples of reconstructions; these reconstructions differ substantially even though they are based on the same data. Many of these issues can be decided by using the validation data to select among competing models and focusing on the prediction intervals associated with a reconstruction (see Chapter 9). When the prediction intervals are taken into account, the differences among competing reconstructions may be deemed small relative to the large uncertainty of each individual estimate.
Regarding metrics used in the validation step in the reconstruction exercise, two issues have been raised (McIntyre and McKitrick 2003, 2005a,b). One is that the choice of “significance level” for the reduction of error (RE) validation statistic is not appropriate. The other is that different statistics, specifically the coefficient of efficiency (CE) and the squared correlation (r2), should have been used (the various validation statistics are discussed in Chapter 9). Some of these criticisms are more relevant than others, but taken together, they are an important aspect of a more general finding of this committee, which is that uncertainties of the published reconstructions have been underestimated. Methods for evaluation of uncertainties are discussed in Chapter 9.
Several recent research efforts have explored how the selection of proxies affects surface temperature reconstructions. Osborn and Briffa (2006) used an alterative approach based on 14 proxy records, most of which extend back to A.D. 800, taken from sites widely dispersed throughout the Northern Hemisphere. Instead of reconstructing temperatures, they chose proxy records that correlated well with local thermometers over the last 150 years (regardless of whether they show warming), smoothed and standardized each record to have zero mean and unit standard deviation, and analyzed
the excursions of the smoothed time series above or below selected thresholds (± 1 or 2 standard deviations). The authors showed that the excursions on the warm side were largest in the 20th century and that the deviation index produced graphs similar to those from other research (Figure 11-2). Osborn and Briffa’s method shifts the focus of the argument from the statistical methods used to reconstruct temperature time series to the selection of proxy and site. The degree of spatial coherence shown by Osborn
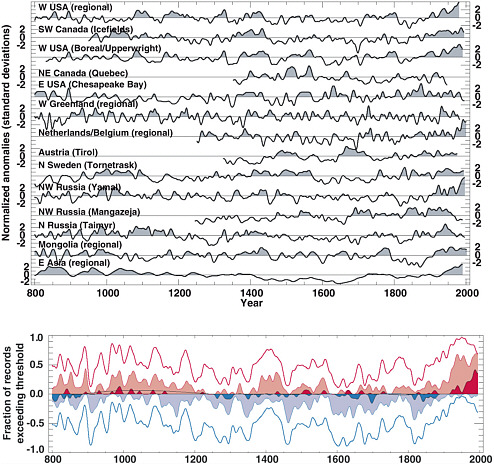
FIGURE 11-2 Upper panel: Fourteen temperature-related proxy records selected on the basis of their correlation with the instrumental record, as described by Osborn and Briffa (2006), filtered to remove variations on timescales less than 20 years and then normalized to have zero mean and unit standard deviation during the period A.D. 800–1995. Lower panel: Fraction of records available in each year that have normalized values greater than zero (red line), greater than 1 (light red shading), greater than 2 (dark red shading), less than zero (blue line), less than –1 (light blue shading), and less than –2 (dark blue shading), with the latter three series multiplied by –1 before plotting. SOURCE: Osborn and Briffa (2006).
and Briffa (2006), together with other reconstructions, provide supporting evidence for the statement that the warming during the late 20th century is more spatially coherent than during previous warm episodes back to at least A.D. 900 (see also Bradley et al. 2003).
The basic conclusion of Mann et al. (1998, 1999) was that the late 20th century warmth in the Northern Hemisphere was unprecedented during at least the last 1,000 years. This conclusion has subsequently been supported by an array of evidence that includes the additional large-scale surface temperature reconstructions and documentation of the spatial coherence of recent warming described above (Cook et al. 2004, Moberg et al. 2005b, Rutherford et al. 2005, D’Arrigo et al. 2006, Osborn and Briffa 2006, Wahl and Ammann in press) and also the pronounced changes in a variety of local proxy indicators described in previous chapters (e.g., Thompson et al. in press).
Based on the analyses presented in the original papers by Mann et al. and this newer supporting evidence, the committee finds it plausible that the Northern Hemisphere was warmer during the last few decades of the 20th century than during any comparable period over the preceding millennium. The substantial uncertainties currently present in the quantitative assessment of large-scale surface temperature changes prior to about A.D. 1600 lower our confidence in this conclusion compared to the high level of confidence we place in the Little Ice Age cooling and 20th century warming. Even less confidence can be placed in the original conclusions by Mann et al. (1999) that “the 1990s are likely the warmest decade, and 1998 the warmest year, in at least a millennium” because the uncertainties inherent in temperature reconstructions for individual years and decades are larger than those for longer time periods, and because not all of the available proxies record temperature information on such short timescales. However, the methods in use are evolving and are expected to improve.
STRENGTHS AND LIMITATIONS OF LARGE-SCALE SURFACE TEMPERATURE RECONSTRUCTIONS
The committee identified the following key strengths of large-scale surface temperature reconstructions:
-
Large-scale surface temperature reconstructions are based on proxy records that are meaningful recorders of environmental variables. The connections between proxy records and environmental variables are well justified in terms of physical, chemical, and biological processes.
-
Tree rings, the dominant data source in many reconstructions, are derived from regional networks with extensive replication, and they are a good indicator of environmental variables at the regional scale. Regional tree ring series are highly correlated with measures of temperature and drought. These connections have a convincing biophysical basis related to tree physiology and growing-season climate. Temperature dominates in some environments and precipitation in others, as is consistent with ecological expectations of limits to growth (Fritts 1976).
-
The same general temperature trends emerge from different reconstructions. Some reconstructions focus on temperature-dependent trees and use wood density measures (Briffa et al. 2002), others focus on temperature-dependent trees and use ring widths (D’Arrigo et al. 2006), and still others incorporate extensive data from precipitation-dependent trees and ice cores and use climate field correlations to derive
-
temperature (Rutherford et al. 2005). One reconstruction does not use tree ring networks at all for century-scale and longer changes, but instead relies on a combination of geochemical and sedimentary proxies (Moberg et al. 2005b).
-
Temperature records from about A.D. 1600 to the present derived from large-scale surface temperature reconstructions are consistent with other sources of temperature information for the period, including borehole temperatures and glacier length records.
-
Prior to about 1600, information is sparser and the pattern of change is not necessarily synchronous, but periods of medieval warmth are seen in a number of diverse records, including historical information from Europe and Asia; cave deposits; marine and lake sediments; and ice cores from Greenland, Ellesmere Island, Tibet, and the equatorial Andes.
Many challenges remain as research progresses to use large-scale surface temperature reconstructions to learn about climate history (Hughes 2002, Rutherford et al. 2005, D’Arrigo et al. 2006). There are two major structural challenges. First, the amount of high-quality proxy data available for analysis decreases markedly as one moves back in time. The great richness of tree ring network data available for 1700, for example, is largely depleted by A.D. 1000. Large-scale temperature reconstructions should always be viewed as having a “murky” early period and a later period of relative clarity. The boundary between murkiness and clarity is not precise but is nominally around A.D. 1600. Second, the finite length (about 150 years) of the instrumental temperature record available for calibration of large-scale temperature estimates places limits on efforts to demonstrate the accuracy of temperature reconstructions. Further research should be aimed at providing independent checks on reconstructions using borehole temperatures, glacier length records, and other proxies.
The role of statistical methods is not trivial. Each individual proxy provides a record of environmental change, but the process of combining these environmental signals into a large-scale spatially averaged temperature requires statistical evaluation. Even if a single proxy is a perfect recorder of the local environment, the question remains of whether the local environments are adequately or representatively sampling the large-scale temperature field. In addition, most proxy records lack the annual chronological precision found in tree ring data; the typical dating error might be 1–5 percent of the age of the sample for annually layered records such as lake varves and 5–10 percent for radiometrically dated records spanning the last 2,000 years.
The committee identified the following limitations of large-scale surface temperature reconstructions that would benefit from further research:
-
There are very few degrees of freedom in validations of the reconstructed temperature averaged over periods of decades and longer. The RE validation metric used by Mann et al. (1998, 1999) is a minimum requirement, but the committee questions whether any single statistic can provide a definitive indication of the uncertainty inherent in the reconstruction. Demonstrating performance for the higher-frequency component (e.g., by calculating the CE statistic) would increase confidence but still would not fully address the issue of evaluating the reconstruction’s ability to capture temperature variations on decadal-to-centennial timescales.
-
Using proxies sensitive to hydrologic variables (including moisture-sensitive trees and isotopes in tropical ice cores and speleothems) to take advantage of observed
-
correlations with surface temperature could lead to problems and should be done only if the proxy–temperature relationship has climatological justification.
-
The observed discrepancy between some tree ring variables that are thought to be sensitive to temperature and the temperature changes observed in the late 20th century (Jacoby and D’Arrigo 1995, Briffa et al. 1998) reduces confidence that the correlation between these proxies and temperature has been consistent over time. Future work is needed to understand the cause of this “divergence,” which for now is considered unique to the 20th century and to areas north of 55°N (Cook et al. 2004).
-
For tree ring chronologies, the process of removing biological trends from ring-width data potentially obscures information on long-term changes in climate.
-
Temperature reconstructions for periods before about A.D. 1600 are based on proxies from a limited number of geographic regions, and some reconstructions are not robust with respect to the removal of proxy records from individual regions (see, e.g., Wahl and Ammann in press). Because the data are so limited, different large-scale reconstructions are sometimes based on the same datasets and thus cannot be considered as completely independent.
-
Reconstructions of low-frequency variations in the temperature record that make use of proxies other than tree rings (Moberg et al. 2005b) are limited by the small number of available records, by dating uncertainties, and by the sensitivity of many proxies to hydrologic variables as well as to temperature. These data gaps highlight the need for continued coordinated efforts to collect proxy data over broad geographic regions.
Specifically concerning the reconstructed temperature variability over short time periods (year-to-decade scale), the committee identified the following as limitations that would benefit from further research:
-
Large-scale surface temperature reconstructions demonstrate very limited statistical skill (e.g., using the CE statistic) for proxy sets before the 19th century (Rutherford et al. 2005, Wahl and Ammann in press). Published information, although limited, also suggests that these statistics are sensitive to the inclusion of small subsets of the data. Some of the more regionally focused reconstructions (D’Arrigo et al. 2006) have better demonstrated skill back to the 16th century or so, and possibly earlier. To improve the skill of reconstructions, more data need to be collected and possibly new assimilation methods developed.
-
Accurately inferring the absolute values of temperature for single years and decades from proxies sensitive to variability at this timescale requires accurate reconstruction of the longer term mean.
OVERALL FINDINGS AND CONCLUSIONS
Based on its deliberations and the materials presented in Chapters 1–11 and elsewhere, the committee draws the following overall conclusions regarding large-scale surface temperature reconstructions for the last 2,000 years:
-
The instrumentally measured warming of about 0.6°C during the 20th century is also reflected in borehole temperature measurements, the retreat of glaciers, and other observational evidence, and can be simulated with climate models.
-
Large-scale surface temperature reconstructions yield a generally consistent picture of temperature trends during the preceding millennium, including relatively warm conditions centered around A.D. 1000 (identified by some as the “Medieval Warm Period”) and a relatively cold period (or “Little Ice Age”) centered around 1700. The existence of a Little Ice Age from roughly 1500 to 1850 is supported by a wide variety of evidence including ice cores, tree rings, borehole temperatures, glacier length records, and historical documents. Evidence for regional warmth during medieval times can be found in a diverse but more limited set of records including ice cores, tree rings, marine sediments, and historical sources from Europe and Asia, but the exact timing and duration of warm periods may have varied from region to region, and the magnitude and geographic extent of the warmth are uncertain.
-
It can be said with a high level of confidence that global mean surface temperature was higher during the last few decades of the 20th century than during any comparable period during the preceding four centuries. This statement is justified by the consistency of the evidence from a wide variety of geographically diverse proxies.
-
Less confidence can be placed in large-scale surface temperature reconstructions for the period from A.D. 900 to 1600. Presently available proxy evidence indicates that temperatures at many, but not all, individual locations were higher during the past 25 years than during any period of comparable length since A.D. 900. The uncertainties associated with reconstructing hemispheric mean or global mean temperatures from these data increase substantially backward in time through this period and are not yet fully quantified.
-
Very little confidence can be assigned to statements concerning the hemispheric mean or global mean surface temperature prior to about A.D. 900 because of sparse data coverage and because the uncertainties associated with proxy data and the methods used to analyze and combine them are larger than during more recent time periods.
WHAT COMMENTS CAN BE MADE ON THE VALUE OF EXCHANGING INFORMATION AND DATA?
The collection, compilation, and calibration of paleoclimatic data represent a substantial investment of time and resources, often by large teams of researchers. The committee recognizes that access to research data is a complicated, discipline-dependent issue and that access to computer models and methods is especially challenging because intellectual property rights must be considered. Our view is that all research benefits from full and open access to published datasets and that a clear explanation of analytical methods is mandatory. Peers should have access to the information needed to reproduce published results, so that increased confidence in the outcome of the study can be generated inside and outside the scientific community. Other committees and organizations have produced an extensive body of literature on the importance of open access to scientific data and on the related guidelines for data archiving and data access (e.g., NRC 1995). Paleoclimate research would benefit if individual researchers, professional societies, journal editors, and funding agencies continued to improve their efforts to ensure that these existing open-access practices are followed.
Tree ring researchers have recognized the importance of data archiving since 1974, when the International Tree Ring Data Bank was established to serve as a permanent repository for tree ring data (measurements, chronologies, and derived reconstructions). Its holdings are available online via the World Data Center for Paleoclimatol-
ogy, as are a number of other proxy data from ice cores, corals, boreholes, lake and ocean sediments, caves, and biological indicators. As proxy datasets become increasingly available on the Web, all researchers are given the opportunity to analyze data, test methods, and provide their own interpretation of the existing evidence via recognized, peer-reviewed scientific outlets.
WHAT MIGHT BE DONE TO IMPROVE OUR UNDERSTANDING OF CLIMATE VARIATIONS OVER THE LAST 2,000 YEARS?
Surface temperature reconstructions have the potential to further improve our knowledge of temperature variations over the last 2,000 years, particularly if additional proxy evidence can be identified and obtained. Additional proxy data that record decadal-to-centennial climate changes, especially for the period A.D. 1–1600, would be particularly valuable. New data from the Southern Hemisphere, the tropics, and the oceans would improve our confidence in global temperature reconstructions, while additional data from regions that have already been sampled would help reduce the uncertainties associated with current reconstructions. In addition, many existing proxy records were collected decades ago and need to be updated in order to perform more reliable comparisons with instrumental records. Better data coverage would also make it possible to test whether or not past temperature changes had the same pattern as the warming during the last century. New methods, or more careful use of existing ones, may also help circumvent some of the existing limitations of large-scale surface temperature reconstructions based on multiple proxies. Each individual proxy provides a record of environmental change, but the process of combining these signals into a spatially averaged temperature signal requires careful statistical evaluation. It might be possible to circumvent some of the limitations associated with these reconstructions by employing a number of complementary strategies in analyzing the proxy data, including using them to constrain climate models, and by attempting to calibrate the proxy data against climatic variables in different ways.
Finally, some of the most important consequences of climate change are linked to changes in precipitation, especially the frequency and intensity of droughts and floods, as opposed to just temperature alone. Changes in regional circulation patterns, snowfall, hurricane activity, and other climate elements over time are also of interest. Hence, it would be valuable to see both regional and large-scale reconstructions of changes in precipitation and other climate variables over the last 2,000 years, to complement those made for temperature. Efforts to improve the reliability of surface temperature reconstructions also need to be complemented by efforts to improve our understanding of the forcings that have contributed to climate variability over the past 2,000 years. When analyzed in conjunction with historical and archeological evidence, paleoclimatic reconstructions can also tell us how past societies adapted to climate changes.


