
2
General Considerations of Uncertainty and Variability, Selection of Dose Metric, and Dose-Response Modeling
Health risk assessments now typically include discussion of variability (real differences) and uncertainty (fundamental lack of knowledge) and often use probabilistic risk assessment methods to characterize variability and uncertainty in the estimates of risks. Prior National Research Council (NRC) reports and U.S. Environmental Protection Agency (EPA) documents make clear the need for these characterizations; for example, they emphasize that
uncertainty forces decision-makers to judge how probable it is that risks will be overestimated or underestimated for every member of the exposed population, whereas variability forces them to cope with the certainty that different individuals will be subjected to risks both above and below any reference point one chooses (NRC 1994, p. 237)
and that
[i]n successive versions of its cancer guidelines, EPA expressed increasing emphasis on a full examination of uncertainties, with the recognition that both qualitative and quantitative approaches to uncertainty assessment are important and can (applied appropriately) help clarify the nature of assessment findings. The use of sophisticated uncertainty tools also involves substantial issues of science and mathematics, as well as specialized issues such as the appropriate presentation and characterization of probabilistic estimates in the decision making context where appropriate. (EPA 2004a, p. 49)
Significant uncertainties remain in understanding human health risks from 2,3,7,8-tetrachlorodibenzo-p-dioxin (TCDD), other dioxins, and di-
oxin-like compounds (DLCs), in spite of very large investments in data collection and research.
Variability among members of the population is an important consideration in understanding risks. Variability results from the wide range of environmental sources and human interactions with them, as well as from physiological and genetic differences that might influence the relative susceptibility of humans and other species to adverse health effects from exposure. For example, sources of variability associated with human health outcomes include the inherent genetic diversity of human populations, which currently remain difficult to address quantitatively. Abundant evidence demonstrates complex gene-environment interactions for many complex human diseases, immune system dysfunction, and other disorders in which TCDD, other dioxins, and DLCs might be implicated.
Adding more complexity, the risks from TCDD, other dioxins and DLCs continue to change over time because of changing exposures, and understanding of the risks continues to evolve with the collection of more data. Any assessment reflects the snapshot of the information available at that time, and analysts should recognize that additional information might later reveal evidence that differs from prior assumptions.
One of the charges to the committee emphasized reviewing the Reassessment1 “to assess whether EPA’s risk estimates are scientifically robust and whether there is a clear delineation of all substantial uncertainties and variability.” Risk assessment in the case of TCDD, other dioxins, and DLCs represents a formidable task because of the size of the available database and the complexity of numerous issues. EPA collated and presented a massive database on TCDD, other dioxins, and DLCs, on which the committee commented specifically in the chapters that follow. This chapter identifies the major categories of decisions that analysts generally make when developing risk estimates in the context of the four traditional steps of risk assessment: hazard identification and classification, exposure assessment, dose-response assessment, and risk characterization (NRC 1983). The Reassessment deals with complexities in the risk assessment of TCDD, other dioxins and DLCs by making specific choices as described in this chapter, but EPA could alternatively use a probabilistic approach. Typically, risk assessments should address uncertainties that derive from conceptualizations and fundamental choices among competing options in a way that clearly identifies the quantitative impacts of alternatives. When there are two or more plausible interpretations, a risk assessment should make clear
that such alternatives give rise to uncertainty. To this end, a risk assessment should identify the key uncertainties (those that drive the risk estimates) and make clear how selection of specific alternative assumptions influences the risk assessment results.
In general, the choice of individual or population risk metric that is modeled influences the appropriate characterization of variability and uncertainty in risk (Thompson and Graham 1996). The Reassessment strives to present a comprehensive baseline risk assessment intended to cover all potential sources. This generic approach results in limited discussions of variability and uncertainty. The committee found that the lack of a specific context and absence of a focused exposure assessment that would link sources to potential health effects in individuals, or in the population, severely limited both EPA’s and the committee’s abilities to appropriately characterize variability and uncertainty in risk estimates related to exposure to TCDD, other dioxins, and DLCs.
HAZARD CLASSIFICATION
In the context of the Reassessment, EPA faced the decisions of assigning a hazard classification for TCDD, and for other dioxins and DLCs, including mixtures. Hazard classification typically focuses on characterizing the weight of the evidence with respect to potential health effects. For cancer risk, the cancer guidelines (EPA 2005a, also see Appendix B) outline specific criteria for classifying substances into the following categories:
-
Carcinogenic to humans
-
Likely to be carcinogenic to humans
-
Suggestive evidence of carcinogenic potential
-
Inadequate evidence to assess carcinogenic potential
-
Not likely to be carcinogenic to humans
The charge to the committee stated that it should address “the scientific evidence for classifying dioxin as a human carcinogen.”
The committee believes that the scientific evidence on cancer causation usually falls within a continuum, and classification often artificially places apparent bright lines (e.g., in distinguishing a “known human carcinogen” from a “likely human carcinogen”). In Chapter 5, the committee reviews and comments on EPA’s decisions with respect to its determinations of cancer classification.
With respect to noncancer end points, the committee notes that EPA does not use a rigorous approach for evaluating evidence from studies and the weight of their evidence in the Reassessment. The committee finds that EPA’s lack of systematic evaluation and classification of the noncancer
evidence left significant ambiguity about the basis for some of EPA’s decisions implied in the report (e.g., the decision not to identify a critical effect or to develop a reference dose [RfD]). The Reassessment provides an extensive catalog of studies but does not synthesize the significant insights or provide clear assessments of the key uncertainties in a way that allows the reader to determine the impact of various choices made.
In general, the use of a rigorous evaluation process for noncancer hazards would lead to improved characterization of noncancer risks. In the context of the Reassessment and any future iterations of this analysis, the committee suggests that EPA focus its efforts on improving its quantitative characterization of the risks, including noncancer risks, and not devote substantial effort to further carcinogen classification for TCDD, other dioxins, and DLCs, as discussed in Chapter 5.
EXPOSURE ASSESSMENT
EPA provided the committee with an updated exposure inventory (EPA 2005b), which provides an extensive review of the existing database of exposure data for TCDD, other dioxins, and DLCs. The review also provides a useful qualitative review of the level of confidence in the data for various sources, although the Reassessment does not quantitatively characterize the uncertainty associated with low-confidence data. Although the Reassessment (Part III, p. 4-6) specifically mentions the possibility of unknown sources causing underestimation of releases from contemporary sources, it does not attempt to correct the incomplete accounting of sources in historical data or adjust current data to address anticipated discoveries of other sources. Thus, EPA implicitly assumed that the exposure assessment sufficiently captures the exposure sources so that any additional new sources identified would not significantly alter its estimates. The committee discusses this choice in more detail in Chapter 4 and suggests additional analyses that might further explore the impacts of this assumption.
The updated exposure inventory devotes considerable attention to documenting how the nature and magnitude of dominant exposure sources changed over time. The substantial amount of new evidence of significant declines in measured concentrations of TCDD, other dioxins, and DLCs over the past several decades reflects EPA’s specific management efforts targeted at reducing exposure from some sources (e.g., pulp and paper mills, medical and municipal waste incineration, and ball clay2). Referring
specifically to TCDD, EPA notes that “dioxin levels in the environment have been declining since the 1970s…, and it is reasonable to expect that levels in food, human intake, and ultimately, human tissue have also declined over this period. The changes in tissue levels are likely to lag the decline seen in environmental levels, and the changes in tissue levels cannot be assumed to occur proportionally with declines in environmental levels” (Reassessment, Part III, p. 4-16). Changing concentrations in the environment over time provides another substantial uncertainty in risk assessment, because EPA must decide whether to use specific “snapshot-in-time” concentrations for risk assessment or whether to extrapolate or average such changing concentrations over time. Given the timing of the updated exposure inventory, it was not clear to the committee how EPA intends to use the updated inventory information in the context of estimating current exposures.
Another area of uncertainty lies in determining what constitutes background exposures in the general population. EPA carefully defines “background” in a prominent footnote (Reassessment, Part III, p. 1-1), and the committee concurs that this approach is appropriate and is clearly presented in the Reassessment. However, the uncertainty associated with potential discoveries of “new sources” will remain an issue that EPA may need to analyze further. For example, the Reassessment added a chapter on ball clays in the latest iteration.
Yet another area of uncertainty is determination of background levels when many samples lie below the analytical limit of detection. This issue arises in any exposure assessment, and several widely used options address it (e.g., assume all nondetects are true zeroes, assign a value of either 1/22 or 1 times the detection limit, or fit a distribution to the data). The committee noted that EPA did not pick a single consistent approach (see the note to the summary table at the bottom of Part III, p. 4-32) or provide a clear quantitative indication of the importance of the choice of strategy for dealing with nondetects, which creates inconsistencies in the Reassessment. The committee recommends that EPA clearly and quantitatively explore how different strategies for dealing with nondetects affect exposure assessment results, as discussed in Chapter 4. If these alternative approaches produce very different results, then EPA should further consider the implications of specific options.
Another major source of uncertainty stems from the selection of a dose metric. The Reassessment could provide exposure estimates for a wide range of dose metrics and averaging times to support the spectrum of possible dose-response assessment choices. This important issue is discussed in more detail below. The Reassessment also provides little insight about bioavailability, an issue that frequently falls between the domains of the exposure assessment and dose-response assessment.
Finally, the Reassessment provides very little information about the
amount of individual variability in exposure. EPA describes how average daily toxic equivalent quotient (TEQ) varies as a function of age (Reassessment, Part III, pp. 4-16, 4-17, and 4-35), although it does not provide a measure of the variability around these estimates (that is, the population distribution of exposures within each age group). EPA’s description may implicitly give the impression of very limited variability within the population, which may not be the case. However, the Reassessment provides some good examples of other parameters that may influence interindividual variability. For example, considering the variability in total fat consumption, the Reassessment suggests that TCDD intakes in the general population could extend to levels at least three times higher than the mean (Reassessment, Part III, p. 4-19). The exposure assessment also demonstrates that TCDD intake for children based on age-specific food consumption and average food concentrations exceeds adult intake estimates on a body-weight basis (although their intake on a mass basis is lower) (Reassessment, Part III, p. 4-35). These examples also illustrate the difficulties that arise in choosing an appropriate overall averaging time for exposure.
ASSESSMENT OF OTHER DIOXINS AND DLCS
The challenge of characterizing the risks from complex mixtures also leads to important choices. EPA’s use of a TEQ approach represents the prevailing strategy (in the United States and internationally). In Chapter 3, the committee provides an in-depth evaluation of EPA’s use of toxic equivalency factors (TEFs) and TEQs. This issue also represents an important area of uncertainty in the overall risk assessment. The Reassessment states that “despite the uncertainties in the TEF methodology, the use of this methodology decreases the overall uncertainty of the risk assessment” (Reassessment, Part III, p. 1-10). Although that may be true, EPA should quantitatively support the argument with some comparisons or data. The Reassessment also notes that “TEFs are the result of scientific judgment of a panel of experts who used all of the available data, and they are selected to account for uncertainties in the available data and to avoid underestimating risk. In this sense, they can be described as public-health conservative values” (Reassessment, Part III, p. 1-5). The committee recommends that EPA quantify the extent to which the TEF estimation process may be health protective. In addition, because TEFs continue to evolve (see Chapter 3), EPA must continue to choose which TEF values to use and which congeners to include. Such choices will influence exposure estimates as well as the uncertainties associated with those estimates.
The Reassessment acknowledges the difficulty of comparing different human-exposure data sets because some do not include coplanar polychlorinated biphenyls in the estimation of TEQ values. The Reassessment clearly
states that TCDD per se is not the main contributor to TEQ levels in human lipids (Part III, Table 4-5). The Reassessment uses the calculation of body burden at steady state, its associated assumptions given in the Reassessment (Part III, section 1.3), best estimates of current adult intakes, and the assumption of 25% body fat to calculate the TEQ concentration in human lipids. The resulting estimate is about one-half the level currently measured in human lipids. The Reassessment suggests that this discrepancy arises from the presence of an historical body burden and lipid concentration, but it does not consider other possibilities.
GENERAL ISSUES RELATED TO VARIABILITY AND UNCERTAINTY ASSOCIATED WITH SELECTION OF DOSE METRIC AND DOSE-RESPONSE MODELING
EPA makes a number of assumptions about the appropriate dose metric and mathematical functions to use in the Reassessment’s dose-response analysis (see “Selection of Dose Metric” and “Dose-Response Modeling” in this chapter for specific issues related to dose metric and dose-response modeling). The Reassessment does not adequately comment on the extent to which each of these assumptions could affect the resulting risk estimates.
EPA discussed various dose metrics and selected one particular metric based on its judgment. However, EPA did not quantitatively describe how this particular selection affected its estimates of exposure and therefore provided no overall quantitative perspective on the relative importance of the selection.
EPA faced numerous choices with respect to developing quantitative models for characterizing cancer risk from exposure to TCDD, other dioxins, and DLCs (summarized in Table 2-1) and for characterizing noncancer effects (summarized in Table 2-2). The Reassessment characterizes the risk of cancer at background and incremental intakes by using a cancer slope factor (CSF), and it recommends the use of a margin of exposure (MOE) for both noncancer and cancer end points (Reassessment, Part III, p. 6-12). The committee did not find EPA’s justification sufficient for why it used different methods to characterize risk for end points that have the same basic underlying mode of action. The committee noted that the Reassessment should also quantitatively characterize the impact of this choice.
The Reassessment concludes that setting an RfD is not appropriate because of the relatively high background levels compared with effect levels and suggests that setting an RfD provides little value for evaluating possible risk management options if average background exposure exceeds the RfD (Reassessment, Part III, p. 6-14). As discussed in Chapter 7, this decision conflicts with the choices made by other international regulatory bodies (e.g., European Scientific Committee on Food, Food and Agricultural Orga-
TABLE 2-1 Categories of Key Decisions EPA Faced in Characterizing Cancer Risk
|
Basis for Quantification |
Epidemiological Data Set |
Bioassay Data Set |
Dose-Response Model |
Dose Metric |
Point of Departure |
|
|
|
|
|
|
|
Abbreviations: ED, effective dose; LED, lower confidence limit on ED. |
|||||
TABLE 2-2 Categories of Key Decisions EPA Faced in Characterizing Noncancer Risk
|
Basis for Quantification |
Epidemiological Data Set |
Bioassay Data Set |
POD |
Dose Metric |
Critical Effect Choice |
|
|
|
|
|
|
|
Additional Categories |
||||||
|
Exposure Route |
Exposure Time |
Type of Dosing |
DRD |
U.F. (Database) |
U.F. (Interspecies) |
U.F. (Intraspecies) |
|
|
|
|
|
|
|
|
Abbreviations: POD, point of departure; LOAEL, lowest-observed-adverse-effect level; NOAEL, no-observed-adverse-effect level; ED, effective dose; BMD, benchmark dose; BB, body burden; ADD, average daily dose; AUC, area under curve; DRD, develop reference dose; U.F., uncertainty factor. |
||||||
nization of the United Nations [FAO]/World Health Organization [WHO], and the Joint Expert Committee on Food Additives [JEFCA]). EPA’s decision not to specify an RfD in the Reassessment may have depended on the set of specific assumptions it selected, such as use of the 1% effective dose (ED01) as the point of departure (POD) for this calculation and the magnitude of the applicable uncertainty factors.
The Reassessment provides a thorough statement of the potential sources of uncertainty for consideration in noncancer risk assessment, many of which also apply in the context of cancer risk assessment:
Consideration should be given to a number of difficulties and uncertainties associated with comparing the same or different endpoints across species, such as differences in sensitivity of endpoints, times of exposure, exposure routes, and species and strains; the use of multiple or single doses; and variability between studies even for the same response. The estimated ED01s may be influenced by experimental design, suggesting caution should be used when comparing values from different designs. Caution should also be used when comparing studies that extrapolate ED01s outside the experimental range. Furthermore, it may be difficult to compare values across endpoints. For example, the human health risk for a 1% change of body weight may not be equivalent to a 1% change in enzyme activity. Similarly, a 1% change in response in a population for a dichotomous endpoint is different from a 1% change in a continuous endpoint, where the upper bound of possible values may be very large, leading to a proportional increase in what constitutes the 1% effect level. Finally, background exposures are often not considered in these calculations simply because they were not known. (Reassessment, Part III, p. 5-24)
The Reassessment used empirical, full dose-response modeling to estimate PODs, specifically an ED for cancer and noncancer. Historically, a POD for a noncancer end point was based on a no-observed-adverse-effect level (NOAEL) or a lowest-observed-adverse-effect-level (LOAEL), a practice inconsistent with cancer risk assessment. EPA now recommends the use of a benchmark dose (BMD) approach to derive a POD for noncancer end points. Although a lower confidence bound on an ED was cited in the literature to define a BMD, EPA’s BMD guidance document (EPA 2000b) defines the ED, BMD, and the lower one-sided confidence limit on the BMD (BMDL).3 This definition unified the determination of PODs for
cancer and noncancer end points. The modeling process generally involves two steps:
The first step is an analysis of dose and response in the range of observation of the experimental or epidemiologic studies. The modeling yields a POD near the lower end of the observed range, without significant extrapolation to lower doses. The second step is extrapolation to lower doses. The extrapolation approach considers what is known about the agent’s mode of action. Both linear and nonlinear approaches are available. (EPA 2005a)
This analysis requires making several key decisions, including primarily (1) determining appropriate types of studies (epidemiological, animal, both, and other), (2) choosing specific studies and subsets of data (e.g., species and gender), (3) choosing specific end points for dose-response modeling, (4) choosing a specific dose metric, (5) choosing model type and form, (6) selecting the benchmark response (BMR) and POD, and (7) characterizing uncertainty.
Current EPA practice generally relies on choosing to model a single data set, specifically the one that tends to show the most significant potential adverse effect. This choice can introduce substantial uncertainty into the risk estimation process, particularly in cases in which different data sets yield very different results. One way to avoid the uncertainty introduced by the selection of a single data set is to use multiple data sets. In particular, EPA could place some weight on each of a number of data sets. Chapters 5 and 6 review EPA’s data set choices made in the Reassessment.
GENERAL ISSUES RELATED TO RISK CHARACTERIZATION
Critical issues related to risk characterization (see Chapter 7) include the impact of decisions on the information communicated to risk managers about the magnitude of uncertainties associated with the data used to generate risk estimates. The impact of choices made in the risk assessment process can be characterized by quantifying the impact of plausible alternative assumptions at critical steps. The risk estimates can be most fully characterized by performing probabilistic analyses when possible and by presenting the range of possible risk estimates rather than by reporting the single point estimates. Risk characterization should provide useful information to risk managers to help them understand the variability and uncertainty in the risk estimates. As further discussed in Chapter 5, the committee understands that quantitatively addressing all sources of uncertainty in a risk assessment can impose an analytical burden, which may result in addressing some sources of uncertainty qualitatively. Quantifying the contribution of various assumptions to the overall uncertainty often proceeds
in an iterative manner. The process itself adds value by highlighting opportunities to collect valuable information, and NRC (1994) provides some guidance about at what point it makes sense to stop in the context of characterizing risks to inform risk management decisions.
The rationale and scientific basis for important decisions should be described in the Reassessment and the consequences of alternative assumptions explored. For dioxin, these issues are best illustrated in relation to the estimation of cancer risk. The choice of one possible approach, linear extrapolation from a POD, results in a CSF that could be used to estimate the lifetime cancer risk for the U.S. population. Assessing the same epidemiological data with a MOE approach would describe the data available to quantify the POD and exposure but would avoid the scientifically debatable need to generate a slope factor with its inherent uncertainties (see Chapter 5 for full discussion of these issues). For noncancer end points, the hazard characterization data are tabulated, but EPA makes little attempt to interpret or focus on critical effects or to define the strengths, weaknesses, and uncertainties associated with effects relevant to critical life stages such as in utero exposure (see Chapter 6 for full discussion of noncancer end points).
The reality that the risk assessment process for TCDD, other dioxins, and DLCs now extends over a period of 14 years, with multiple EPA reports and iterations of these reports, leads the committee to suggest that EPA should continue to treat the risk assessment as a process. In this context, EPA should expect to continue to iterate and improve on the assessment over time as new information becomes available. However, instead of producing and continuing to add to massive reports, EPA should consider a database structure that will allow it to focus its reports on syntheses of new information that drive the quantitative estimates of risk rather than on cataloging all information.
In addition, the committee expects that EPA could substantially improve its assessment process if it more rigorously evaluated the quality of each study in the database. As an example, Table 2-3 summarizes one approach used to describe the basic elements of conducting a systematic review of scientific evidence. Although EPA performed many of these steps in its evaluation of the epidemiological literature of carcinogenicity, it did not outline eligibility requirements or otherwise provide the criteria used to assess the methodological quality of other included studies. EPA could also substantially improve the clarity and presentation of the risk assessment process for TCDD, other dioxins, and DLCs by using a summary table or a simple summary graphical representation of the key data sets and assumptions (e.g., using trees like those shown by Evans et al. 1994a,b; Sangrujee et al. 2003).
TABLE 2-3 Components of a Systematic Review
|
|
SOURCE: Smyth 2000. |
SELECTION OF DOSE METRIC
Section 1.3 of the Reassessment Part III considers various dose metrics for understanding exposure and analyzing dose-response relationships, which apply to both cancer and noncancer effects. EPA highlights the need for a pragmatic approach that can be applied to issues of cross-species scaling and to different end points detected under different exposure scenarios. Risk assessments for most chemicals typically focus on the external dose or exposure expressed as mass of substance per kilogram of body weight per day, but many other options exist. The Reassessment discusses a number of different dose metrics that represent the internal dose, including estimates of area under the blood or plasma concentration–time curve (AUC), plasma or tissue concentrations, body burden, and function-related biomarkers of the internal dose such as aromatic hydrocarbon receptor (AHR) occupancy or changes in cytochromes P450A1/2 protein (CYP1A1/ 2) activity. The function-related biomarkers are intellectually appealing, especially for extrapolating from animal to human, because they would provide a means to address species differences in toxicokinetics and in the initial events reflecting tissue sensitivity. However, EPA concluded that insufficient data support the current use of function-related biomarkers in risk assessment.
The Reassessment (Part III, p. 1-17) suggests that, at the present time, body burden represents the most suitable dose metric for interspecies comparisons (similar to the approaches used by other recent evaluations of TCDD, other dioxins, and DLCs [SCF 2000, 2001; JECFA 2002]), while lifetime AUC may also be suitable for comparisons of different human exposures. EPA selected body burden for cross-species comparisons because, “assuming similar sensitivity between rats and humans at the tissue level, effective doses should be a function of tissue concentration,” and
“tissue concentrations of TCDD and related chemicals are directly related to the concentration of TCDD in the body” (Part III, p. 1-12).
Chapter 5 discusses the quantitative importance of this assumption in terms of cancer risk assessment and provides additional discussion of alternative dose metrics and the relative importance of the choice of dose metric on ultimate cancer risk projections.
The Reassessment states, “The steady-state concentration of TCDD in the body, or steady-state body burden, can be estimated in rats and humans using the following equation:
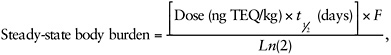
2-1
where Dose is the daily administered dose, F is the fraction absorbed, and t1/2 is the species-specific half-life of TCDD” (Reassessment, Part III, p. 1-12). Body burdens after shorter periods of administration (non-steady state) would require a different method of estimation.
The Reassessment does not quantitatively explore the impacts of this choice or the choices of various inputs in the equation (see below) used to estimate body burden at steady state. The summary table in the Reassessment (Part II, Table 1-6) gives limited data for the half-life estimates for TCDD. Estimates of elimination half-lives for various tissues in rats range from 11 to 53 days, with the best data coming from eight studies that used a radiolabeled compound and that reported a range of 12 to 31 days. EPA uses 25 days to calculate the body burden in rats at steady state. That appears appropriate to the committee, but this estimate is clearly uncertain. Similarly, the summary table in the Reassessment (Part II, Table 1-10) gives limited data on half-life for TCDD in humans. The table provides an estimate of 5.8 years based on fecal excretion and 9.7 years based on changes in adipose concentrations. Data from the Operation Ranch Hand Study indicated TCDD half-lives of 7.1 (Michalek et al. 1992) and 11.3 years (Wolfe et al. 1994), the most comprehensive recent analyses indicating a half-life of 7.6 years (95% confidence interval of 7.0 to 8.2 years) (Michalek and Tripathi 1999). The Reassessment (Part II, Table 1-13) reports a half-life of 7.2 years for the Flesch-Janys et al. (1996) study. An overall mean serum TCDD half-life of 8.2 years was reported in 27 victims of the accident in Seveso, Italy (Needham et al. 1994), although a recent study found substantial interindividual variability and concentration-dependent differences in TCDD half-life (Aylward et al. 2005). Overall the value of 2,593 days (or 7.1 years) used by EPA to calculate the body burden in adult humans at steady state appears reasonable and realistic. The Reassessment recognizes that TCDD half-life is shorter in neonates and infants. The
Reassessment notes that TCDD half-life varies with percent body fat and increases significantly with a high percent of body fat, suggesting that people with more body fat tend to eliminate TCDD more slowly. The half-life of TCDD shows a significant correlation with body weight (IOM 2000). These two pieces of data indicate that human variability in elimination is related to differences in the apparent volume of distribution as well as clearance (see below). The values for bioavailability used in the above equation are also somewhat uncertain. The summary table in the Reassessment (Part II, Table 1-1) gives only limited data for TCDD in rats showing a high bioavailability (70% and 84% in two studies using acetone, corn oil gavage). The text describes the absorption of 88% of TCDD in male Fischer 344 rats after oral exposure in Emulphor/95% ethanol/water (1:1:3). EPA assumed 50% absorption from the diet for rats, which appears reasonable because a range of 50% to 60% absorbed has been reported. The summary table in the Reassessment (Part II, Table 1-1) gives data from only one study for TCDD in a human given a single oral dose and gives a bioavailability of 87% (Poiger and Schlatter 1986). Other studies have determined the extent of absorption by mass balance (the amount ingested minus the amount eliminated in feces), but such measurements are likely to be unreliable in adults because elimination of unchanged TCDD in feces is an important route of elimination of absorbed TCDD in humans. Overall the value proposed and used by EPA to calculate the body burden in humans at steady state (80% absorption) appears reasonable, although the data are limited.
Equation 2-1 implicitly assumes that body burden represents a good surrogate for tissue concentration and that adverse effects correlate with steady-state body burden. This assumption represents a reasonable default because the body burden generally appears to be proportional to tissue concentration, with some caveats noted in Chapter 5, and the toxic effects of TCDD, other dioxins, and DLCs increase with increased tissue concentration. However, the use of body burden as a dose metric (or a dose metric based on tissue concentration) would not allow for species differences in inherent target organ sensitivity to the presence of the chemical. Species differences in target organ sensitivity could be taken into account by a full biologically based kinetic-dynamic model, but EPA appropriately concluded that the available models remain insufficiently well validated for risk assessment purposes. The committee did not discuss specific recommendations for EPA related to collecting data for refining current BBDR models or the regional induction models, but the committee encourages further development and use of these models as data become available to validate and further develop them.
The use of Equation 2-1 implies comparable steady-state tissue concentrations between species and between individuals simply on the basis of body burden. Assuming dose linearity, a twofold increase in body burden in
any individual will yield a twofold increase in the concentrations in all tissues, but the actual concentrations in any tissue will depend on the pattern and extent of tissue distribution of the total body burden.
Equation 2-1 implies that different half-life values between and within species will result in different body burdens for the same daily intake. However, the Reassessment does not explicitly characterize how different half-life value choices influence risk estimates. The half-life depends on two independent physiological variables: the clearance (CL), which reflects the volume of blood cleared per unit time, and the apparent volume of distribution (V), which reflects the apparent volume of blood that has to be cleared of chemical and which is determined by the extent of distribution to tissues (for the one-compartment model used by EPA, half-life = 0.693 × V/CL). The half-life, and therefore the estimated body burden at steady state, could differ between species or between individuals due to differences in clearance or in the extent of tissue distribution (V)—for example, due to differences in body fat content. Because half-life depends on both CL and V, and body fat content represents the major determinant of V for TCDD and other dioxins, a species with a proportionately higher body fat content would have a proportionately higher value of V, a proportionately longer half-life, and greater body burden at steady state for the same daily intake. For this reason, the blood concentration at steady state offers a better metric of the concentration available within tissues to produce an effect:
2-2
where concentration means the concentration per unit volume in blood or plasma, and CL is expressed as the volume of blood or plasma cleared of chemical per day.
This equation cannot be readily used because no data are available on CL for humans. (CL would be the sum of all processes that remove the compound from the body, which in the case of TCDD would largely relate to diffusion into fecal lipids, whereas for lower chlorinated congeners, the value of CL would also reflect metabolism.)
The Reassessment (Part III, section 1.3.2) considers the possibility of using AUC as a dose metric, especially for the purpose of estimating cancer risk. However, EPA questions the use of AUC because animal studies show more altered hepatic foci after a single high dose than after repeated low-dose exposures giving the same AUC and because of challenges in determining the appropriate averaging time (e.g., the whole lifetime or some discrete window of susceptibility). The Reassessment notes that species life-span differences imply a time-based correction to AUC across species, the correction making AUC equivalent to average steady-state concentration. EPA
could convert the AUC over any period to an average concentration by dividing by the time period. The AUC for a dose interval at steady state is directly proportional to the daily dose and bioavailability divided by CL because AUCdose interval at steady state = (dose × bioavailability)/CL. The apparent volume of distribution does not influence blood or plasma AUC for a dose interval at steady state, unlike body burden. The blood or plasma concentrations would not vary greatly during a dose interval (day) because of the long half-life of TCDD in both rodents and humans, and therefore the average blood or plasma concentration could be used. The criticism of using AUC in the Reassessment (whether it should be the peak AUC or the average AUC related to the toxic effect) is inappropriate because it applies equally well to the body burden metric used by EPA.
The Reassessment (Part III, section 1.3.3) considers the use of plasma or tissue concentrations as a dose metric and states that few such data exist for the chronic and subchronic animal studies, whereas human exposure data depend predominantly on such measurements. The human data expressed on a lipid-adjusted basis complicate interspecies comparisons with rodent plasma data, and few data are available to quantify tissue concentrations during toxicity studies in animals. If possible, direct comparisons of the concentrations in the lipid fraction of human blood and rodent blood would provide the most secure comparison of internal dose if such data became available in the future. Tissue concentration data for animals and humans could be developed with physiologically based pharmacokinetic (PBPK) models, based on the proportion of body fat and data on organ blood flows and partition coefficients. Differentiation of free compound from lipid-bound compound within a PBPK model could provide the most relevant dose metric for dose-response assessment.
The approximately 100-fold difference between rats and humans in TCDD half-life combined with Equation 2-1 suggests that a 100-fold lower daily intake in humans yields a total body burden equal to that in rats (assuming the same bioavailability). This observation raises a key question not considered adequately in the Reassessment: Would similar total body burdens in rats and humans result in similar target organ concentrations? Similar tissue concentrations in both species would occur if the pattern of distribution of the body burden were the same in both species. However, the extent of hepatic sequestration (higher in rats, see Reassessment, Part II, Tables 1-4 and 1-5) and the proportion of body fat (10% of body weight in rats according to Geyer et al. [1990] and about 25% in humans—see Reassessment, Part III, p. 17) both show important differences between rats and humans. The significance of the different body composition can be illustrated by considering the TCDD concentrations in rats and humans that would be associated with a total body burden of 200 ng/kg of body weight (calculated from the intake and half-life), assuming a body fat/blood
concentration ratio of 100:1 at equilibrium for both rats and humans, and that body fat is 10% of body mass in rats and 25% of body mass in humans. For rats, the fraction of the body burden of TCDD in fat would be proportional to 100 × 0.1 (10), and the fraction of the body burden of TCDD in nonfat tissues would be proportional to 1 × 0.9 (0.9). Hence, a total of 183.5 ng of TCDD would be in fat, and 16.5 ng would be in nonfat. The total concentrations are 1,835 ng/kg in fat and 18.3 ng/kg in nonfat tissues. In humans, TCDD in fat would be proportional to 100 × 0.25 (25), and the amount of TCDD in nonfat tissue would be proportional to 1 × 0.75 (0.75). Therefore, for a body burden of 200 ng/kg of body weight, the total TCDD in fat would be 194.2 ng, giving a TCDD concentration of 776.7 ng/kg, and the total in nonfat tissue would be 5.8 ng, giving a concentration of 7.8 ng/kg. Consequently, for the same total body burden, the TCDD and other dioxins concentrations in the tissues of humans are about two to three times lower than those in rats.
The higher hepatic uptake in rats compared with humans means that, for the same total body burden, there would be a greater proportion of TCDD in the livers of rats. The Reassessment applies the same body burden correction factor between rats and humans for liver cancer and for nonhepatic effects. The proportionately higher concentrations in the livers of rats compared with humans means that a proportionately higher daily intake would be necessary in humans to produce a comparable hepatic concentration. The difference in hepatic concentration based on the use of body burden as a dose metric for extrapolation of data on liver cancer in rodent bioassays to humans would represent an assumption that makes the resulting risk estimate conservative, although the implications of this assumption are not described in the Reassessment. In addition, the Reassessment does not consider alternative assumptions. Because of the difference in the percent of body fat, the same overall TCDD body burden generally corresponds to lower tissue concentrations in humans, a factor that makes extrapolation of data for all effects (including hepatic effects) more conservative. The Reassessment does not address this factor.
The tissue distribution of the body burden in studies that used single doses or short periods of treatment will not correspond to the steady-state pattern. Before completion of the distribution phase, there will be higher concentrations in well-perfused tissues and lower concentrations in adipose tissue. JECFA (2002) allowed for such nonequilibrium distribution in its recent evaluation of the in utero effects produced in rats shortly after a single dose of TCDD. The EPA Reassessment did not consider this approach in the body burden calculations for the same studies.
The Reassessment does not adequately consider the use of a PBPK model to define species differences in tissue distribution in relation to total body burden for either cancer or noncancer end points. Kim et al. (2002)
compared the body burdens associated with different levels of biochemical responses calculated using a simple kinetic approach and using the body burden derived from a PBPK model. The results indicated that the simple kinetic method, which was similar to that used by EPA, and the PBPK model gave quantitatively different results. The differences were not consistent across the biochemical end points studied, suggesting that the response model used was influencing the magnitude of the difference. Nevertheless, this study supports the conclusion by the committee that the Reassessment should use a simple PBPK model to address some of the uncertainties inherent in the use of species differences in body burden as a measure of species differences in target organ exposure. Generic PBPK models and PBPK models developed specifically for TCDD and its congeners incorporate about 7% of the body weight present as adipose tissue in rats and about 15% in humans (Gerlowski and Jain 1983; Wang et al. 1997; Maruyama et al. 2002, 2003; Emond et al. 2004). Simple PBPK models of TCDD biodisposition at steady state could be used to convert the estimated body burden into an appropriate species-related difference in steady-state tissue concentrations; the magnitude of the resulting species difference could then be introduced as a correction factor in the equation used by EPA to calculate body burden from intake, half-life, and bioavailability. The same PBPK model might also be used to explore the influence of human variability in body composition on the elimination half-life and therefore the body burden at steady state. The Reassessment did not consider this approach or quantify its impact, despite its recognition of tissue concentration as the best dose metric.
DOSE-RESPONSE MODELING
Background
A critical element to consider when assessing human variability in response to a toxic substance is the nature of the dose-response relationship, and how it is modeled mathematically. As described in major textbooks in toxicology (e.g., Eaton and Klaassen 2001), analysts model two fundamental types of dose-response relationships. The graded (continuous), individual dose response characterizes the nature and magnitude of an individual’s response to a toxic substance as the dose goes from a small, ineffectual dose to a larger, toxic dose, potentially causing death. The nature of the response may differ qualitatively, depending on the dose and duration of exposure. For any given individual and specific, defined effect, a “threshold dose,” may exist, which is defined as the dose below which the individual does not respond. The dose corresponding to that threshold may differ across individuals. For the purposes of risk assessment and public health protection, however, analysts typically use the second type of dose-
response relationship, called the “quantal dose-response relationship,” for a population of exposed individuals. The quantal dose response describes the relationship between exposure and the proportion of the population that will exhibit a health effect (that is, a separate relationship for each adverse end point).
In the case of TCDD, other dioxins, and DLCs, it is important to assess the population-based dose-response relationship for cancer, birth defects, immunotoxic effects, and so forth. For each end point of interest, individuals in a population (e.g., rats and mice in laboratory studies and humans in epidemiological studies) are identified as either responders or nonresponders at defined doses (quantal responses). The cumulative quantal dose-response relationship for the population is then determined from the distribution of responses in the population across a defined range of doses. The term threshold is often used to describe the dose below which no response occurs for the graded (continuous) dose-response relationship or the dose below which the probability of anyone in the population responding approaches zero for the cumulative quantal dose-response relationship. A common but scientifically unachievable goal in risk assessment is to identify a threshold dose that protects everyone in the population. The term offers some value in recognizing that for the vast majority of dose-response relationships (either individual or population) some doses may exist below which no measurable responses occur (in an individual or a population). However, the term threshold remains subject to many vagaries of interpretation, and the committee prefers to express ranges of dose in terms of MOEs. MOEs are usually defined as the ratio of the highest dose (daily exposure) to an agent presumably without adverse impact on the human population (the so-called reference dose; Faustman and Omenn 2001) to the estimated daily human dose that might occur, determined from analysis of actual exposure scenarios.
Because of inherent biological differences between individuals, as well as the probabilistic nature of many toxic responses, distributions in responses in a population will always exist (that is, not everyone responds the same way to the same dose). In human populations, differences arise from genetic diversity, differences in age, gender, nutritional status, diseases, and other concomitant exposures, which can modify the response of an individual to a toxic substance. However, such contributors to human variability are presumably represented in the data sets obtained in human population-based studies (epidemiological studies), although any one study generally cannot capture the full range of possible individual variability in response. A second major challenge in establishing population-based dose-response relationships in epidemiological studies arises from the frequently poor quality of exposure (dose) information. Although well-designed occupational and environmental epidemiological studies can yield useful infor-
mation on human population variability, relatively little quantitative information is available about the potential impact on genetic polymorphisms in the human population that might give rise to differences in susceptibility to the toxic effects of TCDD, other dioxins, and DLCs. Chapters 5 and 7 provide more discussion about genetic, molecular, and biochemical mechanisms that might contribute to interindividual variation in response to TCDD, other dioxins, and DLCs.
With these caveats noted, risk assessors commonly take existing data sets (both animal and human) and attempt to develop mathematical models to characterize the shape of the dose-response relationships from the observed data.
Dose-response modeling is a process to formally quantify dose-related changes in the incidence or severity of an adverse effect. The scale of the response can be quantal (e.g., cancer incidence) or continuous (e.g., AHR-binding immune response). Analysts use mathematical functions (preferably with mechanistic parameters) to describe the dose-response relationship observed in the data. In the case of cancer or any quantal outcome, the dose-response model, R(dose), is the same as the probabilistic risk of the adverse outcome. With this dose-response model, or risk, R(dose), the EDα, at which there is a prespecified, small amount (typically 1 ~ 10%) of risk increase α above the background, can be estimated by the following equation of excess risk:
The risk increase α is called the effective dose level. Because R(dose) is a statistically estimated quantity (function), the resultant EDα is subject to data variation.
In the case of a continuous response (or more generally, a nonquantal response), EPA guidance documents discuss how the type of data and biological knowledge will determine appropriate methods using general approaches, but no single approach or model can be universally the “best.” Analysts first fit a dose-response model R(d) to the response data. They then take additional steps to formulate a measure of risk based on the model. Here, R(d) describes the mean response level of the toxicological outcome (e.g., cognitive function as measured in terms of IQ test score in the case of exposure to a neurotoxin). The Reassessment discusses several proposed approaches (Part II, pp. 15-16), all of which identify a dose associated with a specified level of response change relative to the control. For continuous responses, this task is complicated by the ambiguous separation between a “normal response” and an “adverse response.” In lieu of an obvious dividing line, EPA used the “dynamic range” approach (Murrell
et al. 1998), which defines EDα (EPA assigned an α value of 1%) as the dose satisfying the relationship,
where Rmax is the maximum range of total response, either theoretical or estimated under the maximum exposure condition. The main drawback of the approach used by EPA is that the response level associated with the EDα may not be clinically or toxicologically important. The NRC (2000) described an alternative approach in the context of its review of methylmercury toxicity, based on work by Crump (1984) and Gaylor and Slikker (1992). That approach first identifies an adverse response level, which demarcates normal and abnormal (or adverse) responses. For example, in the case of a neurotoxin, an IQ score of 70 points (two standard deviations [SDs] below the population mean of 100 points) could be designated the adverse response level because individuals with IQ scores below this level often require community support to live (WHO 1992, as cited in EPA 2005c). The EDα is then defined to be the neurotoxin dose that increases the background probability of an adverse response by α. Continuing the IQ example, the ED05 is the level of neurotoxin exposure that increases the background risk of having an IQ below 70 of 2.5% by an extra 5% (5%*97.5%=4.875%), to a total of 7.375%.
The Reassessment (Part II, p. 8-16) identifies difficulties with this approach. Although such an adverse response level might not always identify toxicologically meaningful events, it can identify unusual outcomes outside the normal range. The committee recognizes this challenge and understands that for some end points this may emerge as an insurmountable challenge. Nonetheless, because the EDα definition used by EPA is difficult to interpret toxicologically, EPA should strive to use the alternative approach described here whenever possible.
Historically, risk assessment of noncancer effects used a NOAEL or a LOAEL as the POD. The BMD approach (Crump 1984) eliminates some of the limitations of the NOAEL and LOAEL approach and makes the analysis of noncancer effects more consistent with that of cancer.
The primary objective of dose-response modeling is to define an ED toward the lower end of the experimental dose range where the model remains supported by adequate data. The ED can then be used as a POD for extrapolation toward an environmental background level or for safety assessment using the MOE approach.
The choice of model for dose-response assessment, choice of the POD, and extrapolation below the POD thus represent other key areas of uncertainty. The Reassessment quantified the cancer dose-response relationship
relying primarily on occupational cohort data. EPA also used selected animal bioassay data to confirm the plausibility of the resulting estimates. Specific issues related to choice of data set for cancer risk assessment are discussed in more detail in Chapter 5
Data Set Selection
Full dose-response modeling requires adequate dose-response data, and adequate selection criteria must be applied. EPA’s guidance document (EPA, 2000b, p. 14) states:
In general, studies with more dose groups and a graded monotonic response with dose will be more useful for BMD analysis.… Studies in which responses are only at the same level as background or at or near the maximal response level are not considered adequate for BMD analysis. It is preferable to have studies with one or more doses near the level of the BMR to give a better estimate of the BMD and, thus, a shorter confidence interval. Studies in which all dose levels show changes compared with control values (i.e., no NOAEL) are readily useable in BMD analyses, unless the lowest response level is much higher than that at the BMR.
Depending on whether the scale of the selected end point is quantal (dichotomous), continuous, or categorical, different statistical procedures and models are required for dose-response modeling.
EPA’s Reassessment selected a large body of published data sets, using the criteria of (1) a positive dose trend and (2) at least three dose groups in addition to a control (more specifically for noncancer data). In dose-response modeling of human cancer data, EPA further used cancer death incidence (time-to-event) data as the end point, which generally provides more information than mortality data by considering when a death occurred. (These studies are discussed in more detail in Chapter 5.)
Statistical Power and Precision
Although meeting those minimal selection criteria (discussed above) is critical, it does not guarantee adequate statistical power to ascertain the shape of the dose-response curve, and it does not account for the associated uncertainty. In the present context, statistical power refers to the general ability of an experiment, and its associated data set, to provide information needed to make a reliable inference, including testing positive dose effects and ascertaining a fitted dose-response model.
The Reassessment did not discuss the issue of statistical power, although the cancer guidelines (EPA 2005a, see also Appendix B) recommend assessing the statistical power of the studies used for dose-response assessment when possible. Even if a study possesses adequate statistical power to
confirm a positive overall dose response within the observed data range, the power might be inadequate to ascertain the shape of the dose-response curve below the POD level. The lack of statistical power at the lower end also represents a problem for both cancer and many of the noncancer data sets, contributing additional uncertainty to the POD.
Choice of the Dose-Response Model
The goal of mathematical modeling in determining a POD is to fit a model that describes the data set well, especially at the lower end of the observable dose-response range. Fitting such a model involves first selecting models for consideration, based on the characteristics of the data and experimental design, and then fitting the models using one of a few established methods. Then, an ED, along with its upper and lower confidence bounds, is calculated at the POD level. In the process, the analysis should evaluate model fitting, determine goodness-of-fit, and compare models to decide which one to use for obtaining the POD. For example, the BMD guidance document (EPA 2000b) recommends use of a P value of 0.1 as the reference critical value for goodness-of-fit (instead of the more conventional values of 0.05 and 0.01), examination of a graphical display of the model fit, and use of Akaike’s information criterion for comparison of models and selection of the model to use.
In the case of human cancer data, the Reassessment included fits of linear and nonlinear models to the data (see Chapter 5). With the rodent cancer data, EPA used a simple multistage model fitted with the BMD software program. For noncancer data, EPA used the Hill model as the default for continuous responses, with a power model as the alternative when the Hill model failed to fit the data computationally. (See Chapter 6 for additional discussion about specific noncancer end-point modeling.) EPA used the Weibull model as the default for quantal noncancer data. The committee commends EPA for using flexible mathematical models (e.g., the Hill and Weibull models) to account for both nonlinear and linear shapes of the dose response for noncancer effects. However, the committee recommends that EPA apply similar efforts in dose-response modeling of human cancer data (see Chapter 5).
The Reassessment did not conduct or report statistical tests of goodness-of-fit of the cancer risk models. Two reasons might explain the absence of these test results. First, EPA relied on the models reported in the original publications. For example, Steenland et al. (2001) fitted several models to the risk ratio for cancer death incidence, including a power and a piecewise linear model. The likelihood ratio test showed a statistically significant, positive dose response, but the graphical display clearly showed a potential lack of fit. It is important to note that a higher statistical signifi-
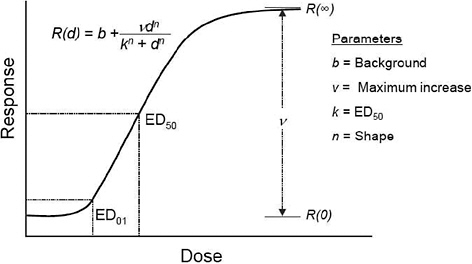
FIGURE 2-1 Vmax. As used in the BMD software for modeling dose-response data, the term Vmax refers to the modeled maximum percent response seen in the observed data set. SOURCE: N. Walker, NIEHS.
cance does not correspond to a higher degree of goodness-of-fit of the model to the data. The Reassessment did not distinguish statistical tests of significance from tests of goodness-of-fit. Second, EPA had access only to summary data taken from the published literature for dose-response modeling, not the raw data, and consequently may not have been able to conduct statistical tests for goodness-of-fit. Nonetheless, the committee recognizes that the critical choice of the dose-response model would benefit from as much information as possible.
In contrast, EPA adopted an ad hoc method to assess goodness-of-fit in dose-response modeling of noncancer end points. Specifically,
the model fits were evaluated with regard to the observed data. The goodness of the model fit was determined as ‘good’ if the model curve included nearly all of the data point means, ‘marginal’ if the model curve was within one standard deviation of the data point means, or ‘poor’ if model fit was not within one standard deviation of the means.
Furthermore,
for the Hill model fits, the Vmax [see Figure 2-1] estimates from ‘good’ and ‘marginal’ model fits were subjectively evaluated for stability and biological plausibility with regard to the observed data. This evaluation identified some potential problems with some of the Vmax estimates. In
some cases the error associated with the Vmax could not be calculated by the BMD software. In these cases if the Vmax model estimate was similar to the ‘observed Vmax’ (i.e. the difference between the highest dose response level and the control response level) then the Vmax estimate was considered biologically plausible and was used for the calculation of an ED01. Otherwise the ‘observed Vmax’ was used for calculation of the ED01. (Part II, p. 8-32)
This subjective approach to goodness-of-fit did not identify whether the lack of fit occurs at the higher or lower end of the observed dose-response range. Alternatively, the Reassessment could judge goodness-of-fit of an empirical dose-response model on mechanistic grounds.
Finally, a statistically well-fit model alone does not guarantee that the model approximates the true but unknown shape of the dose response, especially below the observed dose-response range. With limited data (e.g., about three dose groups for noncancer data) and limited statistical power, many of the data sets (including epidemiological studies) analyzed in the Reassessment do not provide sufficient information to confirm the true shape of the dose-response curve at the ED01 level. The committee emphasizes that this critical uncertainty about low-dose extrapolation remains one of the most significant uncertainties; at the same time, it represents an uncertainty that EPA probably will not resolve in the short term. When feasible, mechanistic and statistical information should be used to ascertain the shape of the dose-response curve at lower doses. Minimally, EPA should use rigorous statistical methods to assess model fitting to control and reduce the uncertainty of the POD caused by a poorly fitted model.
Choice of the POD Value
Selection of the ED (BMR) level is critically important in the calculation of an ED (BMD), and therefore, in the determination of a POD or calculation of a MOE. The current cancer guidelines (EPA 2005a, see also Appendix B) and the draft BMD guidance document (EPA 2000b) give detailed recommendations. For quantal data, an excess risk of 10% was chosen as the default level because 10% response is at or near the limit of sensitivity in most cancer bioassays and in some noncancer studies as well. If a study offers greater than usual sensitivity, then a lower level (e.g., 1%) can be used. EPA recommends the 1% BMR level for epidemiological studies primarily because the 1% level is typically within the observed range. In any case, according to the guidance document, the ED10 should be reported along with any other possible POD options. EPA’s BMD guidance document further recommends:
For continuous data, if there is an accepted level of change in the endpoint that is considered to be biologically significant then that amount of change is the BMR. Otherwise, if individual data are available and a decision can be made about what individual levels should be considered adverse, the data can be ‘dichotomized’ based on that cutoff value, and the BMR set as above for quantal data. Alternatively, in the absence of any other idea of what level of response to consider adverse, a change in the mean equal to one control standard deviation (SD) from the control mean can be used. The control SD can be computed including historical control data, but the control mean must be from data concurrent with the treatments being considered. Regardless of which method of defining the BMR is used for a continuous dataset, the effective dose corresponding to one control SD from the control mean response, as would be calculated for the latter definition, should always be presented for comparison purposes. (EPA 2000b, p. vii)
In EPA’s computation of ED01 for noncancer continuous end points, the 1% BMR level is defined as the change of response from the background level of the control group that was 1% of the maximum possible total response range. The choice of a 1% BMR level ignored EPA’s own guidance that “if there is an accepted level of change in the end point that is considered to be biologically significant then that amount of change is the BMR” (EPA 2000b, vii). The Reassessment also did not consider an alternative approach to dichotomize a continuous outcome into normal and extreme outcomes below a lower or above an upper percentile (Gaylor and Slikker 1990), an approach recommended in the BMD guidance document (EPA 2000b) and implemented in EPA’s BMD software program.
Because the shape of the dose-response is less certain at the lower end of the experimental range, the consequent uncertainty for the ED chosen in this range is important. This uncertainty is likely to be greater for the lower confidence bound of ED01 than on the central estimate of ED01 itself. The Reassessment appears to have largely ignored this issue.
As the starting point of extrapolation of risk to environmental exposure levels, the POD directly influences the risk estimate. The lack of fit of the model at the lower end of the dose-response curve leads to substantial extrapolation of the model toward the POD, and that can bias the ED or BMD estimates and widen their confidence intervals, adding substantially to the uncertainty of the estimate.4
Despite the Reassessment’s consideration of multiple options and the use of flexible model forms (such as the Hill model and the Weibull model) to test for nonlinear dose response, mechanistic knowledge gaps, data gaps, and model gaps remain. For example, many of the data sets of noncancer effects yielded a Hill coefficient greater than 1.5, indicating a plausible nonlinear dose response. However, those studies lacked adequate statistical power to estimate the Hill coefficient reliably, rendering the estimate statistically nonsignificant (that is, the confidence interval includes unity). This result represents a general data gap because the dose-response data required to establish a nonlinear dose-response form do not exist, a problem that becomes magnified in extending nonlinear models to the low-dose range. At present, mechanistic knowledge of both cancer and noncancer effects supports the plausibility of a nonlinear dose response at the lower range (see also Chapter 5), but no adequate data or widely accepted dose-response models describe the shape below a chosen POD at or below the 1% level. It is useful to differentiate the lack of data to confirm the shape of the dose-response curve below the POD from the lack of qualitative evidence of nonlinearity. On the whole, the committee concluded that the empirical evidence supports a nonlinear dose response below the ED01, while acknowledging that the possibility of a linear response cannot be completely ruled out. The Reassessment emphasizes the lack of such nonlinear models, hence its adoption of the approach of linear extrapolation below the POD level. Although this approach remains consistent with the cancer guidelines (EPA 2005a, see also Appendix B), EPA should acknowledge the qualitative evidence of a nonlinear dose response in a more balanced way, continue to fill in the quantitative data gaps, and look for opportunities to incorporate mechanistic information as it becomes available. The committee recommends adopting both linear and nonlinear methods of risk characterization to account for the uncertainty of dose-response relationship shape below ED01.
With respect to dose-response modeling, the committee recommends that the Reassessment explicitly acknowledge the lack of statistical power (precision) of the data to estimate the ED01 or test nonlinearity of the dose response below the POD level of choice (e.g., ED01).
The committee notes that the choice of the 1% response level as the POD substantially affects both the cancer and the noncancer analyses,
perhaps driving EPA’s decision not to develop an RfD. The committee recommends that the Reassessment use levels of change that represent clinical adverse effects to define the BMR level for noncancer continuous end points as the basis for an appropriate POD in the assessment of noncancer effects. The Reassessment should also explicitly address the importance of statistical assessment of model fit at the lower end and the difficulties in such assessments, particularly when using summary data from the literature instead of the raw data, although estimates of the impacts of different choices of models would provide valuable information about the role of this uncertainty in driving the risk estimates.
CONCLUSIONS AND RECOMENDATIONS
-
Although EPA qualitatively addressed many sources of uncertainty and variability, the Reassessment does not adequately address uncertainty and variability that result from the numerous decisions EPA made in deriving point estimates of cancer risk in the comprehensive risk assessment. In contrast, EPA used concerns about uncertainties and uncertainty factors as part of the justification for not setting an RfD for noncancer effects (see Chapter 7 for further discussion).
-
The Reassessment does not provide details about the magnitudes of the various uncertainties surrounding the decisions EPA makes in relation to dose metrics (e.g., the impact of species differences in percentage of body fat on the steady-state concentrations present in nonadipose tissues). The committee recommends that EPA use simple PBPK models to define the magnitude of any differences between humans and rodents in the relationship between total body burden at steady-state concentrations (as calculated from the intake, half-life, bioavailability) and tissue concentrations. The same model could be used to explore human variability in kinetics in relation to elimination half-life. EPA should modify the estimated human equivalent intakes when necessary. Many opportunities exist to further characterize sources of uncertainty and variability related to the dose metric choices, and the committee recommends that EPA provide a clear evaluation of the impacts of possible choices on the risk estimates.
-
The committee recommends that EPA make greater use of mechanistic information to assess the biological plausibility of different mathematical models, use more rigorous criteria (e.g., goodness-of-fit tests) and follow its own guidance (EPA 2000b) in deriving a POD, and clearly identify the BMR level of toxicological significance for noncancer end points. Many opportunities exist to further characterize sources of uncertainty and variability related to the POD and extrapolation choices, and the committee recommends that EPA provide a clear evaluation of the impacts of possible choices on the risk estimates.
-
The committee notes that EPA would substantially improve its transparency and management of the complexity of the risk assessment of TCDD, other dioxins, and DLCs by creating an ongoing process for clearly identifying and updating the key assumptions that support the quantitative risk assessment. This process would essentially require viewing the risk assessment as an ongoing and iterative effort in which EPA continues to create incentives to obtain and use better information when possible and appropriate.


