
7
Emissions, Air Quality, and Human Health
INTRODUCTION
In previous chapters, the committee presented multiple analytic approaches that could be used to evaluate the effects of the New Source Review (NSR) rule changes on pollutant emissions and on efficiency and other end points. A different set of analytic tools would be required to translate the emission changes into changes in air-pollutant concentrations and human health risks. In our interim report (NRC 2005), we briefly summarized the steps needed to estimate environmental and public-health effects, including a general discussion of the important components of atmospheric fate and transport models. In addition, the committee provided an overview of the health effects of the air pollutants potentially influenced by NSR, the attainment-nonattainment status of different geographic areas, and trends in emissions across time and economic sectors.
Given the findings from earlier chapters, the committee has two primary goals in this section. One is to update and expand on the information presented in the interim report, with more emphasis on how emissions subject to NSR might vary by state and region and how the effects associated with differences in the NSR rules might be related to the overall emissions of different criteria pollutants in these states; the purpose of this comparison is to provide insight into the economic sectors and geographic areas where the NSR rule changes could theoretically have an important influence on overall emissions. The second is to consider factors that might influence the relationship between emission and ambient concentrations and the relationship between ambient concentrations and health outcomes including a more
general discussion of atmospheric processes and an evaluation of source-receptor analyses incorporated into past regulatory-effect analyses; this will improve understanding of the geographic locations in which changes in emissions might be important from a public-health perspective. Descriptions of the collection and processing of data are incorporated by reference to our interim report.
REVIEW OF PAST FINDINGS
In our interim report, we examined the criteria pollutants—carbon monoxide (CO), nitrogen dioxide (NO2), sulfur dioxide (SO2), lead (Pb), ozone (O3), particulate matter (PM10 and PM2.5) that are regulated under the National Ambient Air Quality Standards (NAAQS) (Table 2-1) and to which NSR applies. It was found that NO2 and SO2 NAAQS have not been exceeded in any monitored part of the United States for more than 10 years, although some of these areas have not yet been designated as officially in attainment. CO exceedances were found at a few neighborhood-scale locations (Chow et al. 2002) near roadways and were clearly attributable to mobile-source emissions not subject to NSR. Pb nonattainment areas in Missouri and Montana are near lead-production facilities that are currently subject to emission-reduction efforts. High CO concentrations were usually exacerbated by local topographic and meteorologic characteristics. PM10 nonattainment areas were found mostly in the western states, in many cases owing to wintertime residential woodburning, fugitive dust, or nearby industrial sources (usually fugitive dust from material handling or uncontrolled ducted emissions). Exceptions were California’s South Coast Air Basin (Los Angeles area) and central valley, where fall and wintertime PM10 exceedances were driven by high PM2.5 nitrate and carbon components. Many of the PM10 nonattainment areas have implemented appropriate control measures, and PM10 levels have been reduced (EPA 2004h).
PM2.5 and O3 are the criteria pollutants with the most geographic areas in nonattainment. In addition, in summarizing the health effects of criteria air pollutants, we found the most substantial evidence of health effects in connection with current atmospheric concentrations of PM2.5 and O3. Thus, from a public-health perspective, PM2.5 and O3 have the most important effects attributed to changes in NSR.
Ambient O3 and much of the PM2.5 are not directly emitted but form through atmospheric reactions of directly emitted volatile organic compounds (VOCs), NOx (sum of nitric oxide [NO] and NO2, expressed as NO2 in emission inventories), and SO2 (Pandis 2004). Sulfates, nitrates, and some of the organic carbon found in PM2.5 are termed secondary aerosol, owing to their formation from emitted gases, as opposed to directly emitted PM,
which is termed primary aerosol. NSR changes that affect VOC, NOx, SO2, and primary PM emissions will affect O3 and PM2.5 NAAQS attainment.
Maps in the interim report showed that areas where the O3 NAAQS is exceeded include multiple counties in central and Southern California; Las Vegas, Nevada; Phoenix, Arizona; along the Colorado Front Range; the Houston, Dallas, and San Antonio areas in Texas; nearly the entire Midwest and Southeast; and the Washington-Boston corridor. It was noted that O3 concentrations can seldom, if ever, be reduced meaningfully by controlling single sources of precursors; reduction strategies need to encompass many sources of NOx and VOCs. Those groups of sources may be hundreds of kilometers from the locations where exceedances are measured and outside the jurisdictions of local air-quality authorities (Seinfeld 1988; Sillman 1993, 1999; NARSTO 2000; Placet et al. 2000; Russell and Dennis 2000; Solomon et al. 2000; Watson et al. 2001). The rate of O3 formation can be limited by the amounts of NOx or VOCs emitted, but the critical precursor to target to reduce O3 formation varies with time and location (e.g., Nobel et al. 2001; Fujita et al. 2003; Reynolds et al. 2003, 2004).
Our interim report showed that nonattainment areas for the annual average PM2.5 NAAQS are more numerous and are primarily in California and the eastern United States. In addition, many areas of the eastern United States have PM2.5 concentrations that approach the annual NAAQS of 15 µg/m3 and may exceed possible limits proposed for a revised 24-hour PM2.5 NAAQS (70 Fed. Reg. 944 [2005]). Where chemical measurements of PM2.5 sulfate (SO4), nitrate (NO3), organic material, elemental carbon, and crustal material were available during 2002, many of the urban sites experienced larger amounts of carbonaceous (organic material plus elemental carbon) PM2.5 than the nonurban sites, probably because primary emissions from traffic and fuel use were more abundant. An exception was a large nonurban (and urban) carbon fraction in the Pacific Northwest due to extensive wild-fires during the summer of 2002. Sulfate concentrations were much higher in the eastern United States than in the West and were similar at nearby urban and regional sites; this is consistent with a regional distribution. Nitrate constituted a larger fraction of PM2.5 in the West, especially in California. Our interim report showed that more than half the U.S. population lives in counties that exceed the O3, PM2.5, or PM10 NAAQS (EPA 2004i).
EMISSIONS
Our interim report explained how EPA prepares its national database of air emissions based on input from state and local air agencies, Indian tribes, and industry as the National Emissions Inventory (NEI) (EPA 2004j). The NEI categorizes emitters into the following:
-
Point sources that are large stationary emitters, such as electricity generators, refineries, and other industries, that can be identified by name and location. A major source emits a threshold amount (or more) of at least one criteria pollutant and must be inventoried and reported. Most of the sources with any criteria pollutant emission greater than 100 tons/year are subject to NSR when they are newly constructed or undergo modification.
-
Area sources that are small stationary emitters, such as residential heating, small generators, and small industries. This category also includes large but diffuse emitters such as wildfires and dust from agricultural tilling. These sources do not individually produce sufficient emissions to qualify as major sources. Most area sources are not subject to NSR.
-
Mobile sources that are not located at fixed points, such as on-road cars and trucks, as well as nonroad locomotives, ships, aircraft, construction equipment, farm equipment, and mobile generators. These are usually powered by gasoline and diesel engines and are regulated by different sectors by emission limits, fuel specifications, and inspection and maintenance programs. Mobile sources are not subject to NSR.
Whereas Chapter 3 examined permitting activity within various point-source categories, this chapter considers emissions from point sources that are possibly subject to NSR in a context of emissions from all emission sources. To expand on the information presented in our interim report, the committee examined data on the fraction of total emissions potentially subject to NSR within each state. This information can help determine geographic locations and pollutants for which NSR-eligible sources might contribute significantly to total emissions and potential exceedances of NAAQS in downwind states. Emissions are stratified by sector and state to provide further context about the sectors and locations that may contribute most substantially to ambient air pollution and related health effects. Data from our interim report about national regional emissions patterns and temporal trends in emissions are also included.
Our interim report noted the following limitations of the NEI, both in general and for the purpose of evaluating the effects of NSR changes on emissions:
-
NEI data are complete and validated for 1999. Emissions have probably changed in the last 6 years. Emission data for determining the effects of the NSR rule changes would therefore not be available for a number of years.
-
Data on point-source emissions are more accurate than data on mobile-source and area-source emissions because many of the former are derived from continuous emission monitors (CEMs) and nearly all reflect actual operating volumes and pollution-control efficiencies. Data for area and
-
mobile sources rely on surrogates of operating activities (such as statewide fuel consumption and vehicle-miles traveled) and generic emission factors that are derived from a small number of individual emitters, as opposed to the total.
-
The NEI does not contain information on which point sources are subject to NSR, which ones have obtained NSR permits, or the emission potential of sources subject to NSR. The year in which each point source began operating is not included with the emission information although such information on electricity-generating facilities is available elsewhere.
-
The NEI is updated every 3 years, and interpolations and corrections are made for trend analysis. It does not contain sufficient detail to examine how selection of different years for baseline averaging would affect the baseline. Although nationwide 2002 NEI emissions were available after our interim report, these had not been completely validated and it was not possible to obtain the industrial sector and spatial resolution needed for the analysis presented here.
-
Although there is a provision for specification of pollution-control equipment, the NEI contains little detail on where and when emission-reduction measures were implemented for individual sources.
Fraction of Total Emissions Potentially Subject to New Source Review
The fraction of emissions potentially subject to NSR was estimated from the NEI for each state by summing 1999 point source SO2, NOx, PM2.5, and VOC emissions from individual emitters with greater than and less than 100 tons/year. Emissions exceeding 100 tons/year were assumed to be subject to NSR, although several of the included sources may be subject to a ≥250 tons/year limit. This may underestimate emissions subject to NSR in that some sources receive permits for more than their actual emissions. This is offset by including some emissions from source categories subject to the ≥250 tons/year limit. Uncertainties due to those limitations are believed to be lower than other uncertainties in the total emission rates. Figure 7-1 shows how the fraction of NSR-eligible sources varies by state and for the entire United States.
The VOC fraction from point sources is small compared with total VOC emissions. Mobile and area sources dominate VOC emissions in all states. Only Alabama (6%), Arkansas (7%), Hawaii (9%), Kentucky (6%), Louisiana (12%), Tennessee (10%), Texas (6%), and Wyoming (9%) have fractions of NSR-eligible point-source emissions that exceed 5% of the total. NSR rule changes are unlikely to have a large effect (a fraction of <5%) on total VOC emissions in most states, although this does not necessarily imply that incremental benefits or adverse effects would not be obtained.
For primary PM2.5, 12% of total U.S. emissions could be from NSR-
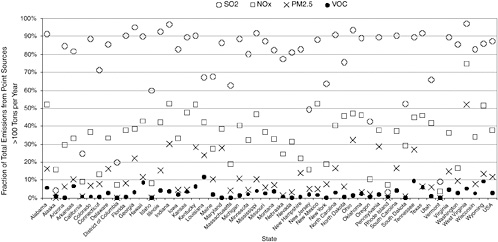
eligible sources. Only in Alaska, California, the District of Columbia, Idaho, Iowa, Kansas, Massachusetts, Minnesota, Nebraska, Nevada, Oklahoma, Oregon, Rhode Island, South Dakota, and Vermont is less than 5% of total emissions derived from point sources that have PM2.5 emissions over 100 tons/year. More than 27% of the total for Indiana, Kentucky, Maryland, Ohio, Pennsylvania, Tennessee, and West Virginia comes from potential NSR sources; the maximum is 52% in West Virginia. NSR rule changes that result in increased or decreased emissions would potentially have their greatest effect on emissions in those states and on air quality and health effects in those states and at downwind locations.
For NOx, 38% of the U.S. total derives from potential NSR emitters. Only California (9%), the District of Columbia (7%), Idaho (7%), Rhode Island (7%), and Vermont (4%) show fractions of less than 10% of the total. More than 50% of total NOx emissions in Alabama, Indiana, Kentucky, New Mexico, West Virginia, and Wyoming comes from NSR-eligible sources, with fully 75% of the total derived from these emitters in West Virginia. Even small changes in NOx emissions owing to NSR rule changes might have nonnegligible effects on emissions in these states.
SO2 emitters are dominated by point sources with rates exceeding 100 tons/year in nearly all the states. Some 87% of total U.S. emissions is from the NSR-eligible emitters. Only Alaska (4%), California (25%), the District of Columbia (20%), New Jersey (49%), Oregon (43%), Rhode Island (3%), and Vermont (9%) derive less than half the total SO2 emissions from these sources. NSR changes that increase or decrease emissions have the potential to affect total SO2 emissions most significantly in most states, compared with percentage changes in other criteria air-pollutant emissions (see Chapter 6).
Nationwide Emission-Source Categories
Figure 7-2 summarizes contributions of different emission categories to total point-source emissions for the entire United States. For PM2.5, about 50% of total point-source emissions are due to fuel combustion in the electricity-generating industry with about 40% due to coal combustion. Other important source categories are wood, pulp and paper, metals, and mineral processing. Point sources account for about 18% of PM2.5 emissions and about 7% of PM10 emissions (EPA 2003d). Primary PM2.5 and PM10 emissions contribute a minor fraction (under 10%) of measurable ambient PM (Chow and Watson 2002; EPA 2004k).
Figure 7-1 shows that large point sources are important contributors to pollutants (SO2, NOx, and, to a smaller extent, VOCs) that participate in the formation of secondary PM. For SO2, about 75% of point-source emissions is attributable to coal combustion by the electricity-generating
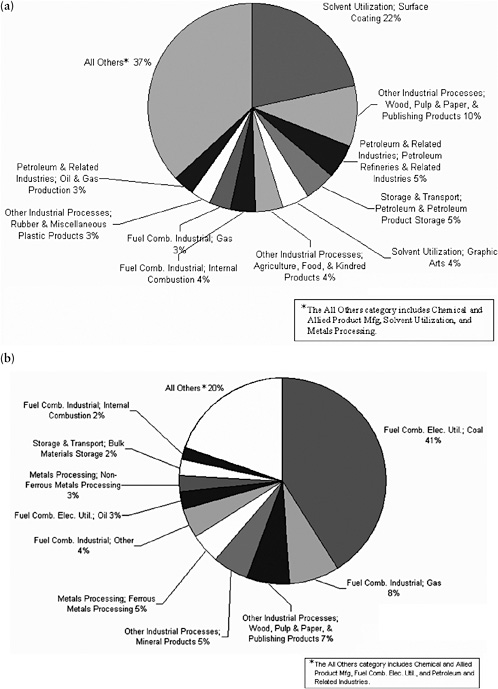
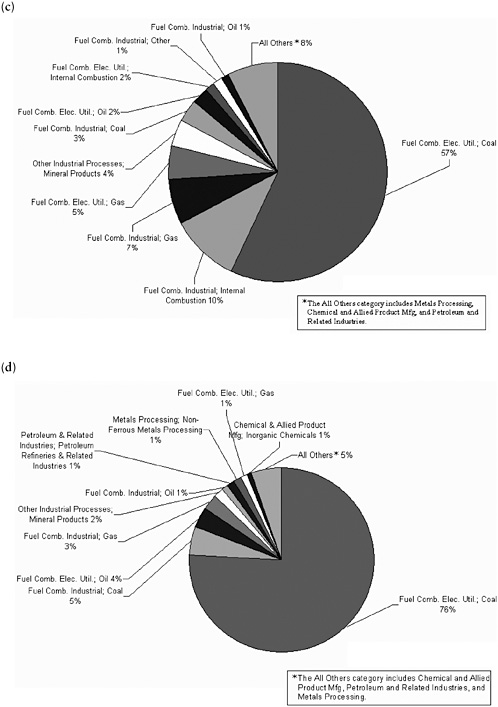
industry, with the remaining contributions due to fuel combustion at other industrial sources (Figure 7-2). In contrast, only about 50% of NOx point-source emissions is due to coal combustion in electricity-generating facilities, with the remainder divided equally among other fuel-combustion activities. In contrast with the predominance of fuel-combustion activities for NOx and SO2, point sources of VOCs are attributable primarily to petroleum and related industries, chemical manufacturing, and other industrial processes, including pulp and paper, food, rubber, and plastics manufacturing. VOC-derived organic aerosol may constitute an important fraction of PM2.5 in U.S. regions when photochemical transformation predominates (Cabada et al. 2004; Dechapanya et al. 2004). Individual VOCs can differ substantially in the rates at which they react in the atmosphere and the effects that they have on the formation of O3 and PM (Carter 1994; Atkinson 2000; Pandis 2004), but these differences are not considered by NSR. Another important contributor to secondary aerosol formation is ammonia emissions. Nationally, point sources contribute only a minor fraction of ammonia emissions compared with agricultural sources (EPA 2004k).
Sources with Emissions Greater than 100 Tons/Year by State
The information presented above helps to contextualize NSR-eligible sources relative to other emission sources, but it is also important to consider emissions from individual states because these are the basis of statewide and regional emission rules. Figure 7-3 summarizes emissions by state for point sources most likely to be subject to NSR (those emitting more than 100 tons/year). It complements the emission maps in our interim report that show total point-source and electricity-generating facility emissions by state, and it expands on Figures 7-1 and 7-2. PM2.5, NOx, and SO2 emissions are dominated by electricity-generating-facility emissions in most states, especially states with the highest emissions.
Coal-fired power generation is the dominant emitter in each state where emissions are high. Only Florida has a large quantity of emissions from oil-fired electricity generators. Gas-fired generators are important sources of NOx in Florida, Louisiana, Mississippi, New York, Oklahoma, and Texas. Sources other than electricity-generating facilities are important as a fraction of the total in the states with the lowest emissions. Emissions from the chemical and refining industries are substantial contributors to total emissions in Louisiana and Texas. The paper industry is a substantial contributor in Alabama, Georgia, and Michigan. The highest PM2.5, NOx, and SO2 emissions are from the midwestern states and Texas, again dominated by coal-fired power generation. Electricity-generating facility emissions in those states contribute most to NSR-eligible emissions, and this indicates that the most important emission changes could potentially be obtained in
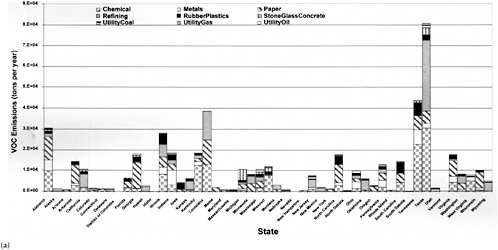
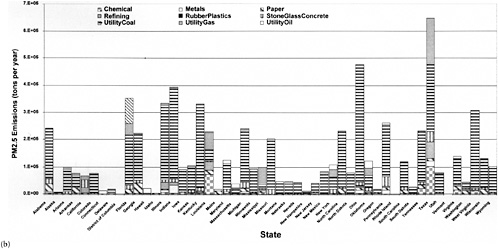
those settings. However, it is not necessarily the case that the highest emitters experience the largest changes in emissions due to NSR rule changes, inasmuch as different sectors are influenced by NSR in different ways. Nor is it necessarily the case that sources in states with lower emissions have no detectable contributions to adverse air quality and health effects. Given those qualifications, these data provide the ability to focus future modeling efforts first on sources and regions that contribute most to the emission inventory.
VOC emissions follow a different pattern, which is dominated by sources other than electricity-generating facilities. Chemical and refining industries dominate the VOC emissions, and some states—such as Alabama, Georgia, and Louisiana—have important contributions from the paper industry. Texas and the southern states have the highest VOC emissions.
Emissions by Age of Facility
Knowing the ages of facilities would provide insight about which have been subject to New Source Performance Standards (NSPS). Although information on facility age is not available for all sectors, relevant data inferred from boiler sales are available for the electric utility sector and for commercial and industrial boilers (EEA, 2005). The data suggest that over 47% of total large boiler capacity is at least 40 years old; large boilers are defined as those with a total capacity in excess of 10 million Btu/hour. Roughly 7% of total boiler capacity is less than 10 years old. Table 7-1 a and b summarize rates of NOx and SO2 emission from coal-fired generators in 2002 by the period during which a power plant came into service. They also provide information on how much generators in each period contributed to total generation and total capacity of coal-fired generation. Table 7-1b includes information on average capacity factor (actual generation divided by potential generation) of generators by vintage and the average heat rate (in British thermal units of heat input from fuel combustion per kilowatt-hour of electricity generated) for generators in each vintage class.
The data show that older facilities have higher emission rates than newer facilities, and older facilities contribute more to total emissions than they do to total electricity generation from coal units. With perhaps one exception, heat rates are lower for newer power generators than for older units. Older generators have lower capacity factors than newer generators and, if those generators were operated more often, their average heat rates likely would be lower. There is a selection bias in the data whereby the generators with lower heat rates of any vintage typically are the ones that receive greater use.
Table 7-1 c and d display the same data organized in a different way. Coal-fired generating units are classified by an NSPS category according
TABLE 7-1 Emissions from Coal-Fired Electricity Generation by Age
|
(a) 2002 NOx Emissions and Share of Generation of Coal-Fired Capacity by Vintage |
|||||
|
Power Plant Established |
Avg. NOx Emission Rate (lb/MWh) |
% Total NOx Emitted |
% of Coal-Fired Electricity Generation |
% of NOx Emitted per % of Electricity Generateda |
% of Coal-Fired Electricity Capacity |
|
Pre-1950 |
5.51 |
0.65 |
0.50 |
1.31 |
0.92 |
|
1950-1959 |
5.07 |
15.11 |
12.56 |
1.20 |
14.32 |
|
1960-1969 |
4.56 |
21.27 |
19.65 |
1.08 |
20.51 |
|
1970-1979 |
4.28 |
39.31 |
38.76 |
1.01 |
38.13 |
|
1980-1989 |
3.53 |
21.74 |
25.97 |
0.84 |
23.84 |
|
Post-1990 |
3.15 |
1.92 |
2.56 |
0.75 |
2.27 |
|
(b) 2002 SO2 Emissions and Performance of Coal-Fired Capacity by Vintage |
||||||
|
Power Plant Established |
Avg. SO2 Emission Rate (lb/MWh) |
% of Total SO2 Emitted |
% of Coal-Fired Electricity Generation |
% of SO2 Emitted per % of Electricity Generateda |
Average Capacity Factor (%)b |
Average Heat Rate (Btu/kWh generated) |
|
Pre-1950 |
20.58 |
1.02 |
0.50 |
2.04 |
36.35 |
12,549 |
|
1950-1959 |
15.78 |
19.64 |
12.56 |
1.56 |
58.93 |
10,668 |
|
1960-1969 |
13.92 |
27.12 |
19.65 |
1.38 |
64.37 |
10,150 |
|
1970-1979 |
9.31 |
35.75 |
38.76 |
0.92 |
68.29 |
10,270 |
|
1980-1989 |
6.02 |
15.49 |
25.97 |
0.60 |
73.17 |
10,401 |
|
Post-1990 |
3.88 |
0.98 |
2.56 |
0.38 |
75.80 |
9,982 |
|
(c) 2002 NOx Emissions and Share of Generation of Coal-Fired Capacity by NSPSc |
|||||
|
NSPS Status According to EIA 767 |
Avg. NOx Emission Rate (lb/MWh) |
% Total NOx Emitted |
% of Coal-Fired Electricity Generation |
% of NOx Emitted per % of Electricity Generateda |
% of Coal-Fired Electricity Capacity |
|
Unknown |
2.93 |
0.16 |
0.23 |
0.69 |
0.27 |
|
Not affected by NSPS |
4.67 |
65.90 |
59.51 |
1.11 |
62.62 |
|
Subject to Aug. 1971 standards (D) |
3.57 |
26.73 |
31.58 |
0.85 |
29.56 |
|
Subject to Sept. 1978 standards (Da) |
3.50 |
7.21 |
8.68 |
0.83 |
7.56 |
|
(d) 2002 SO2 Emissions and Performance of Coal-Fired Capacity by NSPSc |
||||||
|
NSPS Status According to EIA 767 |
Average SO2 Emission Rate (lb/MWh) |
% of Total SO2 Emitted |
% of Coal-Fired Electricity Generation |
% of SO2 Emitted per % of Electricity Generateda |
Average Capacity Factorb (%) |
Average Heat Rate (Btu/kWh generated) |
|
Unknown |
4.56 |
0.10 |
0.23 |
0.45 |
56.58 |
11,247 |
|
Not covered by NSPS |
12.93 |
76.25 |
59.51 |
1.28 |
63.85 |
10,250 |
|
Subject to Aug. 1971 standards (D) |
6.66 |
20.86 |
31.58 |
0.66 |
71.79 |
10,519 |
|
Subject to Sept. 1978 standards (Da) |
3.23 |
2.78 |
8.68 |
0.32 |
77.17 |
10,185 |
|
aIf the generators of a particular vintage (or in a particular NSPS category) emitted a particular pollutant in proportion to its share of total electricity generation, the value would be 1. bCapacity factor of units that operated that are strictly associated with boilers in CEM system database. cThe Subpart D standards apply to fossil-fuel-fired steam boilers for which construction began after August 17, 1971. The Subpart Da standards affect those boilers that began construction after September 18, 1978. For boilers not covered by NSPSs construction began before August 17, 1971. A new NSPS for NOx was promulgated in 1998, but no new coal-fired generating facilities have been permitted since this new standard was issued. NOTES: All quantities, including percentages of emissions and generation capacity, are calculated with reference only to coal-fired generating units. Percentages (taking account of rounding) add to 100% because other types of generating capacity are not considered. These tables and the associated dataset were constructed by David Evans of Resources for the Future. Data used to make these tables come from three sources: emission data are from EPA’s CEM system database; generation and capacity data are from EIA’s 767 dataset; and information on vintage of generating units is from EIA’s Form 860 dataset. SOURCE: EIA 2004b,c; EPA 2004m. |
||||||
to information from U.S. Energy Information Administration (EIA) Form 767 for 2002 (EIA 2004b). Most of the capacity and generation are not subject to NSPS. Generators not subject to NSPS typically have higher SO2 and NOx emission rates (in pounds of pollutant per megawatt-hour of electricity generated) than generators that were permitted under the NSPS that came into effect in 1971. The generators in the post-1978-standard category have substantially lower SO2 emission rates than those subject to
earlier standards, but NOx emission rates are nearly identical with those of the earlier group. That reflects the fact that NSPS for NOx did not change much in 1978 (Burtraw and Evans 2004). The NSPS regime depends on when construction started, whereas the vintages in Tables 7-1a and b are determined by when a generator came into service.
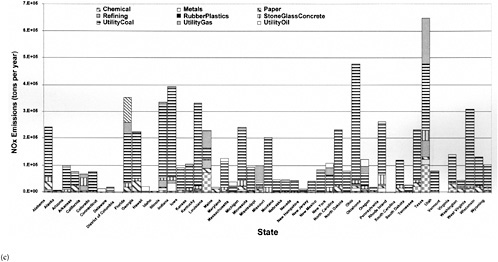
Figure 7-4 shows annual emissions of SO2 and NOx in 2002 from generating facilities categorized by NSPS status according to EIA from 767 data. The coal-fired generating units not covered by NSPS are predominantly in the eastern United States, with large concentrations in Pennsylvania and Ohio, upwind of major East Coast population centers, and with other clusters in Kentucky, southern Illinois and Indiana, the Carolinas, and Alabama. Those units tend to have higher SO2 annual emission rates than plants permitted under the 1971 and 1978s. The smaller variation in total annual NOx emissions across the different NSPS categories is consistent with the smaller differences in average NOx emission rates across the different classes of generating units. Most of the emitting units are in the East, but new units can have total annual emissions as high as older units, reflecting in part the higher capacity factors at the newer units. Geographic concentrations of NOx emissions typically are in the same locations as concentrations of SO2 emissions.
Emission Trends
EPA has been reporting emissions by source categories since the early 1970s (EPA 2004j). Regulations controlling emission sources of pollution have been implemented over the last several decades and have been associated with declining emissions of some pollutants in some categories. Because NSR is directed at major stationary sources, the focus here is on these sources.
Figure 7-5 shows the trend of point-source emissions of NOx, VOCs, PM10, and SO2 since 1970. Point-source NOx emissions have remained nearly constant over the last 30 years, with power-generating point sources dominating them. Total point-source SO2 emissions have decreased over the last 30 years. Much of the early decreases in point-source SO2 emissions resulted from decreases in the metal-smelting sector; later decreases are due to reductions from the electricity-generating sector. Nevertheless, point sources remain a large fraction of SO2 emissions, and point-source emissions are responsible for a large fraction of PM. PM10 emissions declined substantially from 1970 to 1985 because of industrial emission controls; there have been no major changes since 1985. PM2.5 has remained largely unchanged (not shown in the figure) since it was first reported in 1995. VOC emissions declined over the last 30 years, for a variety of reasons (e.g., emission controls for O3 abatement).
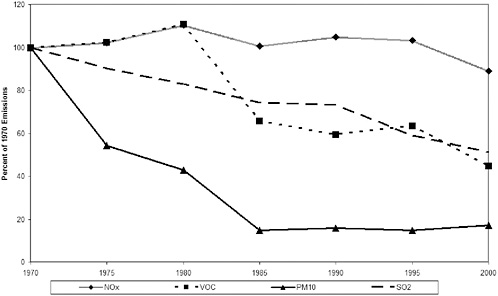
FIGURE 7-5 Criteria-pollutant emission trends for point sources. SOURCE: Data from EPA 2004i.
ESTIMATING EFFECTS OF EMISSIONS ON AMBIENT CONCENTRATIONS
Conceptual Model
As noted in the introduction to this chapter, directly emitted gaseous VOCs, NOx, and SO2 are precursors of gaseous O3 and for PM2.5, including major constituents such as SO4, NO3, and secondary organic aerosol (SOA). Figure 7-6 illustrates some of the pathways that convert precursor emissions into PM2.5 and O3.
O3 is formed from the photochemical oxidation of VOCs (labeled RO2 in Figure 7-6) in the presence of NOx. The reaction is self-perpetuating because NO is regenerated from the photolysis of NO2. That explains why O3 is affected by both NOx and VOC emissions. The complexity of those interacting cycles of pollutants means that incremental emission decreases in one pollutant may not result in proportional decreases in O3. Variability in emission-source operations and meteorologic conditions creates uncertainty in the O3 concentrations to which downwind populations may be exposed. The nonlinearity of this system may actually result in an increase in O3 with small reductions in VOC or NOx precursor emissions.
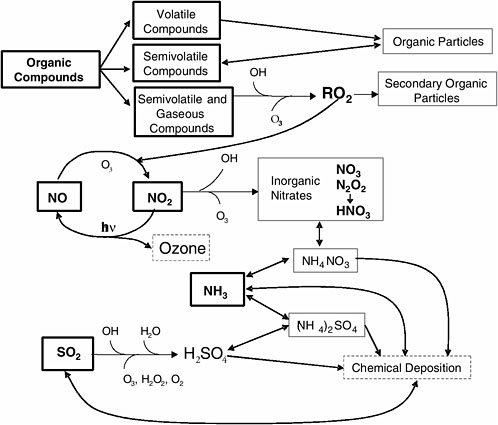
FIGURE 7-6 Chemical links between O3 and PM formation. Major precursors are shown in boxes with thick sides. Secondary particle components are shown in boxes with thin-sided solid sides. SOURCE: NARSTO 2004. Reprinted with permission; copyright 2004, Cambridge University Press.
Secondary PM is produced by reactions that involve SO2, NOx, VOCs, and ammonia (NH3). Oxidizing agents—produced by VOCs and NOx—convert SO2 to sulfuric acid and then to SO4; they also convert NOx to nitric acid and then to NO3. Those stable products form into particles and typically are neutralized by NH3 to form salts (ammonium sulfate and ammonium nitrate). The same reactions in which RO2 compounds are produced and O3 is formed make organic components that condense into particles. Aqueous-phase reactions in fog and cloud droplets also produce organic and inorganic products that contribute to mass in the condensed phase.
Estimating Effects of Emission Changes with Air-Quality Models
As described in our interim report, atmospheric fate and transport models are used to relate emission changes to temporally and spatially indexed ambient concentrations and deposition. The effects of changes in the NSR rules on ambient concentrations depend on how the effects of emission changes on ambient concentrations are estimated by the models. This section focuses on the air-quality modeling of O3 and PM because there are many areas that do not attain the NAAQS for these pollutants. This focus does not imply that SO2, NOx, and CO emission changes may not be influential in some local settings, but rather that national-level health estimates will depend largely on ambient PM and O3 concentration changes.
In earlier assessments, such models as the Urban Airshed Model (UAM) were used to evaluate O3 concentration changes. Although those models capture many essential factors that influence O3 formation, UAM has been shown to underestimate diurnal variability and has been recommended more for average patterns over longer periods than for site-specific short-term estimates (Hogrefe et al. 2001a,b; Hogrefe and Rao 2001). Models like the Regulatory Modeling System for Aerosols and Acid Deposition (REMSAD, SAI 1998) were used to determine secondary SO4 and NO3 formation, which capture basic phenomena of secondary particle formation but tend to omit important aspects of secondary aerosol formation associated with O3 photochemistry. EPA applied the Community Multi-scale Air Quality (CMAQ, Binkowski and Roselle 2003) model for its updated analyses of the Clean Air Interstate Rule (CAIR) for PM2.5 (70 Fed. Reg. 25162 [2005]) and the CAMx model (ENVIRON 2005) for O3. Receptor-oriented source apportionment models have also been applied to determine contributions from industrial and other sources (Chow and Watson 2002; Watson and Chow 2004).
Although existing models have some important limitations and greater uncertainties are anticipated for secondary PM and O3 concentrations as compared with directly emitted PM, SO2, and NOx, these models likely perform better for estimating population-health benefits over long time-frames than for estimating concentration effects for specific hours at specific receptor locations, because some of the model uncertainties (related to wind direction) may cancel out for aggregate risk estimates. Given the possibility that the NSR rule changes will lead to shifts in the location of emissions with a smaller influence on total national emissions (Chapter 6), it is important to understand the influence of location on pollutant fate and transport and on public-health effects. The CAIR modeling did that for eastern states by determining incremental changes in O3 and PM2.5 in downwind states owing to emission reductions in upwind states and serves as a good example of how models can be used to evaluate the effects of emission reductions.
Geographic location can have three major influences. First, meteorological conditions—such as temperature, humidity, wind speed and direction—can influence the fate and transport of a pollutant, including the rate at which SO4, NO3, SOA, and O3 are formed and their dispersion. Second, ambient pollution at downwind sites will influence not only atmospheric chemistry but also attainment-nonattainment status. Third, population patterns at downwind sites will influence the magnitude of the public-health effects of emission changes. In addition, pollutant fate and transport will be affected by such facility characteristics as stack height and diameter, pollutant exit temperature and velocity, and other site characteristics, so differentiating among sources and source categories is important.
Addressing the first point, different factors will influence formation of SO4, NO3, and O3. SO2 can be converted to SO4 through reactions in gas and aqueous phases and to a lesser extent in the aerosol phase (Seinfeld and Pandis 1998). In the gas phase, SO2 is oxidized in the presence of the OH radical; higher formation rates are found with greater solar radiation intensity. Thus, SO4 formation is greater in the presence of sunlight (during the daytime and during the summer), so diurnal and seasonal emission trends are important to understand. Aqueous-phase SO4 formation occurs in cloud water, and this can be the dominant route of SO4 formation in some geographic settings (such as the northeastern United States). NH3 availability will have some importance; in low-NH3 environments, aqueous-phase sulfuric acid will be the dominant form of SO4 aerosol, whereas in NH3-rich environments, sulfuric acid is neutralized to form ammonium sulfate (Seinfeld and Pandis 1998).
Although oxidation of NO2 via the OH radical is a route of formation, formation of ammonium nitrate aerosol will depend on the relative ambient concentrations of SO4, NO3, and NH3. NH3 will preferentially react with sulfuric acid over nitric acid. In areas where NH3 concentrations are low, most of the NO3 exists as gas-phase nitric acid that is not part of PM2.5, but in NH3-rich locations, all the sulfuric acid is neutralized and remaining NH3 reacts with nitric acid to create particulate ammonium nitrate (Seinfeld and Pandis 1998). Owing to that interaction, there are geographic settings in the eastern United States where SO2 emission reductions may result in decreases in PM2.5 ammonium sulfate but increases in PM2.5 ammonium nitrate (Ansari and Pandis 1998).
From the perspective of the effects of the NSR rule changes, the implication is that SO2 or NOx emission changes could have different effects on PM2.5, depending on where the emissions occur. In general, the Northeast, Ohio, and Pennsylvania tend to be sulfate-rich, in large part because they are downwind from coal-fired power plants. NOx emission reductions in those areas may not lead to substantial reactions in PM2.5 concentrations, because there would be inadequate NH3 to react with nitric acid. But in
the plains states of the Midwest, concentrations of NH3 are high and SO4 concentrations lower, so NOx reductions might result in reductions in PM2.5 ammonium nitrate concentrations. PM2.5 travels hundreds or thousands of kilometers, so the plume from a given source may travel through multiple regimes.
For O3, the influential factors and geographic patterns are somewhat different from those for secondary PM2.5 sulfate and nitrate. As indicated in Figure 7-6, O3 is formed in a complex atmospheric cycle involving NOx and VOCs in the presence of sunlight. The O3 formation process is highly nonlinear; with high background concentrations of VOCs relative to NOx, reductions in NOx may lead to lower O3 concentrations. In settings with high NOx concentrations relative to VOCs, NOx emission reductions tend to increase O3 concentrations. In general, higher VOC concentrations tend to lead to more O3 (or little change in O3), and higher NOx concentrations may either increase or decrease ambient O3. Because NOx is emitted by motor vehicles in large quantities, urban areas tend to be high in NOx, and urban NOx emission reductions may increase local O3, although the reductions may result in decreased O3 concentrations at more distant locations. Similarly, in nonurban areas, NOx concentrations are lower and biogenic VOC emissions may be higher (especially in eastern states), so reductions in NOx would tend to decrease O3 concentrations. Thus, the urban-rural status of an emission source will have an important effect on the magnitude and direction of O3 concentration changes.
To summarize, air-quality models show that the geographic location of an emission source, as well as the emission height and seasonal or diurnal emission patterns, can influence O3 and secondary PM2.5 formation rates. It is therefore critical to understand where emission sources affected by the NSR rule changes are (including region and urban-rural status) because their locations will influence the magnitude and even direction of the effects. As explained in earlier chapters, models simulate decision-making processes or sectoral-level responses, but they may lack adequate input data or model resolution to be able to appropriately characterize geographic shifts in emissions. Without adequate estimates of the geographic patterns of emission changes, air-quality models cannot provide reliable estimates of changes in ambient concentrations owing to the NSR rule changes.
AMBIENT CONCENTRATIONS
Ozone and PM2.5NAAQS Nonattainment Areas
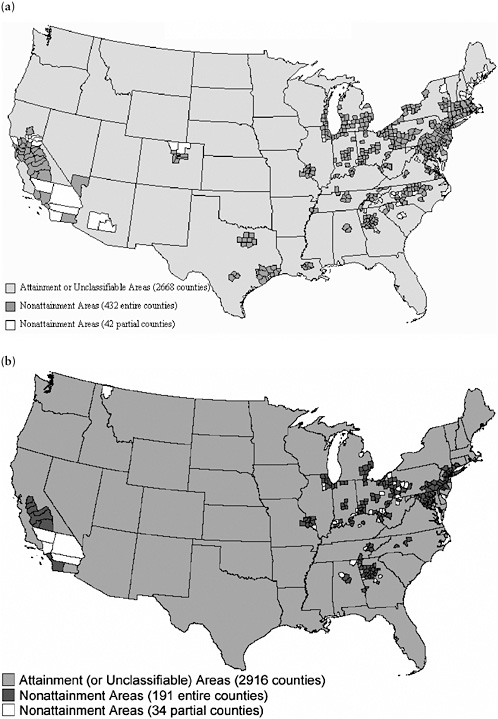
A second influence of geographic location involves whether downwind sites are in nonattainment of NAAQS. The background concentration could be influential in health benefits estimation for cases where there may be
population health effects from exposure concentrations below the NAAQS, or where the effect of a change in concentration would differ depending on the background concentration (i.e., a nonlinear concentration-response function). Figure 7-7 shows the extent of U.S. nonattainment areas for O3 and PM2.5. Areas where the O3 standard is exceeded cover multiple counties in central and Southern California; Las Vegas, Nevada; Phoenix, Arizona; along the Colorado Front Range; the Houston, Dallas, and San Antonio areas in Texas; and much of the midwestern and eastern United States. Nonattainment areas for the annual average PM2.5 NAAQS are primarily in California and the eastern United States. Comparing these distributions with the fraction of precursor emissions that are potentially affected by NSR in Figures 7-1 and 7-3 indicates that the midwestern, southern, and northeastern states would be most likely to have NSR-eligible sources contributing to NAAQS violations. In many western states, emission changes resulting from NSR rule changes probably have a minimal effect on NAAQS attainment status although some sources may contribute to downwind NAAQS violations. The nonattainment status of much of Southern California indicates that the contribution from point sources should not be discounted. In many of those states, the changes may be more important for future emission reductions related to regional haze (Watson 2002).
Composition of PM2.5
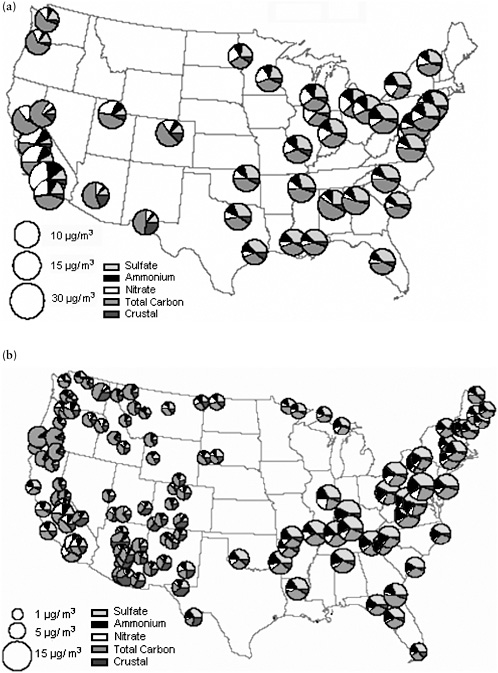
Although the combination of emission inventory data and attainment-nonattainment status provides some insight into geographic patterns, it does not directly address the relative source contributions in a specific geographic area. PM2.5 composition and its variation in space and time can be used to identify the importance of different source contributions. A comparison of Figure 7-8 a and b shows that many of the urban sites contain a larger component of carbonaceous particles than the nonurban sites, probably because of more abundant primary emissions from traffic and fuel use. The exception is the large nonurban (and urban) carbon fraction in the Pacific Northwest due to extensive wildfires during summer 2002. Sulfate concentrations are much higher in the eastern United States than in the West, and they are similar in nearby urban and regional sites; this is consistent with the distribution of coal-fired power plants in the United States and the long-range transport of SO4 particles. NO3 constitutes a larger fraction of PM2.5 in the West, especially in California. Particulate NO3 levels in the eastern United States is low but may increase if SO2 reductions free NH3 for reaction with nitric acid that would increase ammonium nitrate, as described above. Nevertheless, review of a large number of studies (Watson 2002) demonstrates that SO4 decreases with reductions in regional SO2 emissions.
HEALTH EFFECTS
The final step in understanding the health effects of changes in emissions would involve quantifying the effects of the modeled ambient concentration changes on a variety of health outcomes. Nonattainment areas indicate where the air is deemed unhealthful according to the current NAAQS (Table 2-1), but NAAQS are periodically revised in response to discoveries about air pollution and health effects and epidemiological evidence may indicate that non-zero health effects occur below currently promulgated standards. To evaluate health benefits of changes in emissions, a standard health-benefits analysis framework has been endorsed by the National Research Council (NRC 2002) and applied by EPA (1999, 2004l), the World Health Organization (WHO 2002a,b), the World Bank (Van Beukering et al. 2002), and many independent investigators. A comprehensive evaluation of the framework is beyond the scope of this report. Instead, the committee focuses on a few critical dimensions relevant to the effects of the NSR rule changes. First, as in our interim report, we provide brief descriptions of the status of health concerns associated with the criteria pollutants, except lead.1 In addition, summary information is given for several VOCs, which are also regulatory targets but are managed differently from the criteria pollutants.2 The objectives of this review are to determine which pollutants have been associated with health effects at current ambient concentrations and to consider more broadly the extent to which health effects can be attributed to single pollutants (a necessary step in health-benefits analysis). Second, the likelihood of nonlinearity in the concentration-response functions is discussed to determine geographic locations in which health benefits might be anticipated. Finally, the influence of the geographic location of sources on the potential health effects of changes in emissions is evaluated by addressing pollutant fate and transport, population patterns, and the shapes of the concentration-response functions.
A large and growing body of published epidemiologic and toxicologic research, as summarized in EPA criteria documents cited below, establishes that the criteria pollutants are associated with a variety of health effects, including increased occurrence of cardiopulmonary morbidity, cardiopulmonary and cancer mortality, effects on birth outcomes (low birth weight and infants that are small for gestational age), and impaired growth of lung function in children. The associations are most consistent in children (particularly those with asthma) and the elderly (particularly those with
underlying cardiovascular diseases and diabetes). In contrast with the clarity of the overall associations, the extent to which the various health effects can be attributed to a given pollutant or combination of pollutants is less clear; this limitation must be considered in examining the quantitative estimates of association attributed to any single pollutant. In the case of PM, the problem is compounded by the fact that PM is a complex physical-chemical mixture whose components probably interact with other criteria pollutants (such as O3) in ways that may affect health outcomes. Characterizing an overall pollutant mixture with respect to its health implications is a major future challenge for air-pollution-related health-effects research.
Carbon Monoxide
Concerns about the health effects of inhaled CO have focused on the various manifestations of its greater affinity than that of oxygen for binding to blood hemoglobin, thereby reducing blood oxygen concentrations. Accordingly, the current NAAQS for CO is based on preventing significant health effects by limiting blood carboxyhemoglobin concentrations (in normal nonsmokers) to about 2% or less (EPA 2000). The health effect driving the current NAAQS is angina (chest pain) in exercising people who have coronary arterial disease. The onset of angina signals ischemia (lack of sufficient oxygen) in heart muscle and not only limits the level and duration of exercise but also can increase the risk of arrhythmias and death.
Epidemiologic research since the last review of the CO NAAQS has provided some evidence of associations between increases in CO concentrations and increased cardiopulmonary mortality and morbidity. Several studies focused on PM, but multipollutant models also appeared to show significant relationships between CO and mortality (EPA 2004h). Some studies suggest that in such cases CO serves as a marker of mobile-source contributions of several pollutants and perhaps even as a surrogate of toxic PM2.5 (supposedly, that emitted directly from combustion sources). Whether CO affects mortality directly or serves as an indirect indicator of exposure to other toxicants is not resolved; however, the statistical link between CO and mortality cannot be disregarded.
Recent research has demonstrated statistical associations between ambient CO and low birth weight (Ritz and Yu 1999). The finding has not been replicated sufficiently to evaluate either exposure-response relationships or the specificity of the effect of CO confidently, but the evidence warrants concern.
CO can also exert central nervous system effects, including reductions in hand-eye coordination (driving or tracking) and in attention and vigilance. Available data, however, suggest that ambient concentrations are unlikely to cause such effects unless ambient exposures are superimposed on exposures
from other sources, such as heavy smoking or hot spots caused by extreme traffic emissions (EPA 2000).
Nitrogen Oxides
As described above, NOx commonly refers to the sum of NO and NO2. The symbol NOy commonly refers to the sum of NOx and other oxidized nitrogen compounds, such as nitric acid. Nitrous oxide is commonly excluded. NO and NO2 have numerous sources, especially combustion emissions, and are present in ambient air in greater concentrations than the other species. NO2 is toxic by virtue of its oxidation potential and has received the greatest health-research and risk-assessment attention. NO has lower toxicity but is increasingly recognized as a mediator or intermediate of cellular signaling and biochemical processes, both beneficial and detrimental. NOy is of concern not only for its toxicity but also because of its participation (with VOCs and sunlight) in the formation of O3 and secondary PM (nitrates).
NOx constituents are oxidants and thus may contribute to the wide range of respiratory health effects thought to be associated with inhaling oxidants or mediated by oxidation pathways. Experimental and accidental inhalation of NO2 at high concentrations has been shown to cause respiratory symptoms (such as cough and wheezing), reduced lung function, and increased airway responsiveness in both healthy and asthmatic people. The evidence of those effects at common ambient concentrations (less than 0.05 ppm based on an annual average) is equivocal (EPA 1995c). Among the many recent epidemiologic studies of the effects of particles and copollutants on respiratory and cardiovascular outcomes, NOx has seldom arisen as an important factor. Prolonged high exposures of animals (for example, at 10 ppm and higher) have caused emphysema-like changes in some, but not all, studies. Tissue changes are unlikely at ambient exposure concentrations; however, the recent finding that ambient exposure to O3, also an oxidant gas, affects lung development suggests the possibility that NOx contributes to similar effects. High indoor exposures of children (often associated with gas-stove use) have been linked to reduced resistance to respiratory infections and increased likelihood of respiratory illness (Hasselblad et al. 1992), including wheezing and persistent coughing (van Strien et al. 2004). In addition, recent evidence suggests that NO2 exposures increase the severity of virus-induced asthma exacerbations (Chauhan et al. 2003). Although it is unconfirmed, NOx emissions might contribute to the associations between respiratory illness in children and proximity to heavily traveled roadways (Wjst et al. 1993; Oosterlee et al. 1996; Brunekreef et al. 1997).
Research since the last review of the NO2 NAAQS indicates that NOx may retard lung growth in children (Gauderman et al. 2004). Differences between the rates of lung growth in children living in areas of higher and
lower pollution were statistically associated with NO2 and with airborne acid and PM2.5, substances to which NOx contributes. NO2 (and other air pollutants) also may increase airway responsiveness to allergens (Rusznak et al. 1996; Jenkins et al. 1999).
Although probably NOx contributes to the effects of air pollution on public health, it is likely that NOx species affect health more through their contribution to the formation of O3 and secondary PM than through their direct effects.
Ozone
O3, like PM, is one of the criteria pollutants of greatest health concern. There is little doubt that public health is measurably affected by exposures that occur in many areas in the United States (EPA 1996).
O3 is an oxidant gas emitted directly from sources (such as electric motors) in only small amounts. Ambient O3 is formed in the atmosphere overwhelmingly by reactions involving NOx, VOCs, and ultraviolet radiation (sunlight) (see Figure 7-6). It is one of several photochemical oxidants. In the respiratory tract, O3 interacts with polyunsaturated fatty acids, electron donors (such as ascorbate and vitamin E), and the thiol, aldehyde, and amine groups of low-molecular-weight compounds and proteins. O3 is very reactive, and its most harmful biologic effects probably result from the products of initial reactions with surface fluids and cell walls rather than from direct interactions with intracellular targets. In people who have chronic obstructive pulmonary disease or asthma, the antioxidant content of the lung lining can be reduced, potentially contributing to increased sensitivity to O3 (Mudway and Kelly 2000).
O3 has been associated with an array of adverse effects, but the effects primarily driving the current standard are pulmonary function decrements in exercising children, adolescents, and susceptible (for example, asthmatic) people. O3 causes a neurogenic (reflex) inhibition of maximal inspiration that reduces maximal forced expiratory volume during lung-function tests and ventilatory capacity during exercise. O3 also causes increased airway responsiveness (constriction) to other materials (such as airway-constricting drugs and allergens). Although the degree of increased responsiveness may not differ much between healthy and asthmatic people, the much greater baseline responsiveness of asthmatic people makes the O3-induced additional decrement potentially more serious. High O3 is associated with increased clinic visits and hospitalization of people with asthma and other pre-existing respiratory diseases; there is also some evidence of increased mortality among these populations (Thurston and Ito 2001; Bell et al. 2004).
O3 also acts as a respiratory and eye irritant, giving rise to noticeable, if not life-threatening, discomfort that limits activity and reduces quality
of life. It may impair defenses against respiratory pathogens and inhaled particles. There is evidence (EPA 1996) that O3 slows the clearance of particles from the lungs by damaging cilia and retarding the activity of macrophages; however, it is not clear whether this occurs in humans at actual exposure concentrations. Furthermore, Pope et al. (2002) observed an association between long-term exposure to summertime O3 and increased risk of premature death in cohort studies, although the relationship was not statistically significant. Bell et al. (2004) found a statistically significant association between short-term changes in O3 and average mortality in 95 large U.S. urban communities. Three recent meta-analyses (Bell et al. 2005; Ito et al. 2005; Levy et al. 2005) supported findings of increased mortality associated with daily changes in O3 concentrations.
Research since the 1996 O3 criteria document (EPA 1996) reviews indicates that O3 retards lung growth. Exposures of animals have produced alterations in the development of lung structure during growth (Schelegle et al. 2003). Epidemiologic studies have demonstrated that entering college students from areas with high O3 concentrations have smaller lungs and lower lung function than students from areas with low O3 (Kunzli et al. 1997) and that long-term exposure to O3 is associated with decreases in measures of small-airway function (Tager et al. 2005).
Suspended Particulate Matter
PM encompasses a physically and chemically diverse class of ambient air pollutants of both anthropogenic and biologic origin. The PM standard is the only NAAQS that does not target a specific chemical or family of chemical species. PM concentration is defined functionally as the change in mass of a filter through which ambient air is drawn under standardized conditions. PM can be solid, liquid, or composed of semivolatile species (partitioned between the PM and vapor phases, depending on ambient conditions), and it can be either directly emitted from sources (primary, such as fly ash) or formed in the atmosphere (secondary, such as SO4) from precursor gases. Regardless of composition, the aerodynamic size of PM determines its ability to enter the mouth or nose and the distribution of fractional deposition throughout the respiratory tract (EPA 2004h). There is no exclusive difference in the ability of PM of any aerodynamic diameter of 10 µm or less to reach different parts of the respiratory tract; both 10-µm and 10-nm particles could be deposited in the nose or the deep lung. However, the probability of deposition in different locations varies considerably with size. Most inhaled PM of a typical ambient size distribution is not deposited at all but is exhaled (EPA 2004h); however, there is clear evidence that the portion that is deposited can exert adverse health effects if the exposure is sufficient.
A large array of health effects have been associated with exposure to PM in both epidemiologic and laboratory studies. The current PM2.5 NAAQS (62 Fed. Reg. 38651 [1997]) was based on epidemiologic evidence of mortality. The concerns about human health effects associated with ambient PM or demonstrated in laboratory studies have expanded from earlier concerns about total mortality and respiratory morbidity to include cardiac mortality and morbidity, blood-vessel constriction, stroke, premature birth, low birth weight, retarded lung growth, enhancement of allergic responses, reduced resistance to infection, degenerative lesions in the brain, and lung cancer (EPA 2004h).
Both short-term increases in PM exposure and longer-term exposure concentrations are of concern. Numerous time-series studies have correlated variations in ambient PM with concurrent or lagging variations in health outcomes; other studies have demonstrated differences in mortality and morbidity between populations with different long-term PM exposures (Dockery et al. 1993; Pope et al. 1995, 2002, 2004). The relationship between the effects of short-term spikes in exposure and the cumulative effects of longer-term exposure to both spikes and baseline concentrations is uncertain.
The quantitative relationship between PM exposure and health effects remains uncertain, as does the proportion of the criteria-pollutant health effects attributable to PM copollutants. Despite the uncertainties and the attendant debates, it seems clear that current concentrations in some areas and at some times in the United States are associated with health burdens that warrant concern, and a causal interpretation of the epidemiologic evidence implies a public-health burden from PM exceeding that from other criteria air pollutants (EPA 2004h).
The relationship between PM composition (particle size fractions and chemical components) and adverse health effects remains uncertain. The current PM NAAQS assumes that all PM mass is of equal toxicity, but it is unlikely that the mechanisms of action and relative toxicities do not differ across constituents. Different PM components (such as metals and organics) drive different types of toxicity (some components are more toxic than others for some effects), and the same PM composition administered in different particle sizes has different potencies. However, there has been insufficient systematic study of the effects of composition and size differences on the different effects of concern on which to base composition-specific standards. In part, size is incorporated into the NAAQS as a rough surrogate of composition (because most fine PM stems from the combustion of fossil fuel or biomass, whereas coarse particles tend to arise from fugitive dust, pollens and spores, and sea salt). However, particles of similar size can have vastly different origins and composition. An extensive discussion of the weight of evidence for differential toxicity of key particle constituents (that is, sulfate,
metals, and organic carbon) is beyond the scope of this report, but the recent particulate matter criteria document (EPA 2004h) contains some relevant information. In particular, EPA came to the conclusion that the information is insufficient at the present time to clearly identify the high-risk chemical components of PM2.5, beyond an apparent differentiation between combustion and noncombustion particles.
Sulfur Dioxide
SO2 is of concern both because it is a direct respiratory irritant and because it contributes to the formation of SO4 and sulfuric acid in PM. The current NAAQS for SO2 is based primarily on preventing airway constriction in exercising, unmedicated asthmatic people (EPA 1994e). People with asthma are of particular concern both because they have increased baseline airflow resistance and because their SO2-induced increase in resistance is greater than that in healthy people and increases with the severity of their asthma. SO2 is thought to induce airway constriction via neural reflexes involving irritant receptors in the airways; the NAAQS is aimed at preventing stimulation of these reflexes in people with asthma.
Epidemiologic research since the last review of the SO2 NAAQS (Krewski et al. 2000; Pope et al. 2002) has repeatedly demonstrated associations between ambient SO2 and cardiopulmonary morbidity and mortality. Studies focused primarily on PM have often demonstrated significant or nearsignificant statistical associations between SO2 and the health outcomes. The implications of those findings are unclear. As a respiratory irritant, SO2 probably contributes directly to respiratory morbidity, and it might contribute directly to mortality of respiratory origin. Through neural reflexes, it is possible that SO2 also might contribute directly to cardiac arrhythmia and thus cardiac morbidity and mortality, but this possibility has not been explored in controlled studies.
To the extent that ambient concentrations of SO2 are linked to concentrations of particulate SO4 and airborne acid at the same location, SO2 also might be serving as a marker of ambient SO4 (and thus ambient fine PM), which might cause the effects. However, until we have a better understanding of the specific physical-chemical air-pollutant species causing cardiopulmonary morbidity and mortality, we cannot ignore the possible direct contribution of SO2.
Volatile Organic Compounds
In addition to the criteria pollutants, emissions addressed by the NSR program include a diverse group of VOCs. VOCs encompass an array of chemical species that have in common a fundamental organic structure
(primarily hydrocarbons, including oxidized and substituted hydrocarbons), a presence primarily or entirely in the gas phase under ambient conditions, and a reactivity that leads to participation (with NOx and sunlight) in atmospheric reactions that result in the formation of O3. Because of research on the role of VOCs in the formation of O3 and efforts to identify and control emissions of its most reactive precursors, VOCs have long been targeted as a group to be regulated (EPA 1996). VOC emissions also contribute to the formation of airborne PM. The major classes of VOCs are alkanes, alkenes, aromatics, carbonyls, alcohols, and ethers. The substances included in VOC measurements can vary; some measurements target specific species, and others encompass multiple substances (such as total nonmethane hydrocarbons).
Although VOCs are addressed by NSR because, as precursors of O3, they contribute to health and welfare effects, many members of the group are also of concern because of their toxicity. Those considered to have the most important primary health implications are also included within the regulatory group termed hazardous air pollutants (HAPs, also known as toxic air pollutants or air toxics). The Clean Air Act lists 188 HAP species or classes. In its most recent National-Scale Air Toxics Assessment, EPA reviewed 32 of the 33 HAPs it identified in 1999 to be of greatest concern in urban areas plus diesel PM (EPA 2002f). EPA terms the 33 key HAPs urban air toxics (64 Fed. Reg. 38706 [1999]) (see Table 7-2). Examples of VOC HAPs are benzene, which is found in gasoline; methylene chloride, which is used as a solvent and paint stripper by a number of industries; and perchloroethlyene, which is emitted from some dry-cleaning facilities. The health effects of VOC HAPs differ among the species; summaries can be found at EPA (2004n). Most effects of concern involve mutagenicity, cancer, irritation (inflammation), neurotoxicity, or modulation of immune responses.
Health Effects of New Source Review Changes
The evidence presented above provides some insight into the complexity of quantifying the health effects of changes in ambient air pollution. O3 and PM2.5 have shown the strongest associations with health outcomes at current ambient concentrations. In light of that and findings from our earlier evaluation of emission data and from consideration of attainment-nonattainment status, the committee recommends that future analyses of the national-level effects of NSR rule changes focus on those pollutants and their precursors. However, both pollutants may represent indexes rather than single causative agents. For example, O3 exerts its effects through its oxidative properties, and other photochemical oxidants may have similar effects. PM, as a combination of constituents, may have effects that depend on its composition and on the concentrations of copollutants. Estimation of
TABLE 7-2 Urban Air Toxics
|
Acetaldehydea Acroleina Acrylonitrilea Arsenic compounds Benzenea Beryllium compounds 1,3-Butadienea Cadmium compounds Carbon tetrachloridea Chloroforma Chromium compounds Coke-oven emissions 1,3-Dichloropropenea Dioxin Ethylene dibromidea Ethylene dichloridea Ethylene oxidea Formaldehydea Hexachlorobenzenea Hydrazinea Lead compounds Manganese compounds Mercury compounds Methylene Chloridea Nickel compounds Perchloroethylenea Polychlorinated byphenyls (PCBs) Polycyclic organic matter Propylene dichloridea Quinolinea 1,1,2,2-tetrachloroethanea Trichloroethylenea Vinyl chloridea |
|
aAlso a volatile organic compound (VOC). SOURCE: 64 Fed. Reg. 38706 (1999); EPA 2004f. |
the health effects of NSR rule changes may depend on the extent to which changes in concentrations of individual components are useful surrogates of changes in the pollutant mixtures to which populations are exposed. In any case, a focus on O3 and PM2.5 is probably the best approach for a first approximation of health benefits. Because many of the aforementioned uncertainties are unlikely to be resolved in the near term, that will probably be the approach that will need to be used in upcoming evaluations of NSR rule changes.
Shape of the Concentration-Response Functions
Given the committee’s focus on PM and O3, we can consider the second question mentioned above, which addresses the shape of the concentration-response functions. That would influence the magnitude of health benefits anticipated from changes in concentrations in different geographic locations and is important in determining whether health effects would be anticipated in NAAQS attainment areas or, more generally, whether incremental concentration changes would have a greater effect in some locations than in others. There is general agreement that detection of thresholds for various pollutants is difficult with population data because such data represent weighted averages (weights unknown) of pollutant-host interactions. By and large, the body of personal-exposure data is insufficient to determine pollutant thresholds precisely.
For PM, although epidemiologic evidence has not shown a threshold for mortality effects (Pope et al. 2002; Daniels et al. 2004), epidemiologic
studies lacking accurate personal-exposure data have a limited ability to detect thresholds if they exist. Furthermore, although animal studies have provided insight into mechanisms of response and confirmed the toxicity of some PM components, few statistically significant responses have been demonstrated in the laboratory at ambient exposure concentrations. The most recent EPA staff paper on the review of the PM NAAQS (EPA 2005f) concludes that although there are probably individual biologic thresholds for specific health responses, studies do not support or refute the existence of thresholds in PM-mortality relationships at the population level. Given that uncertainty, regulatory impact analyses typically use a no-threshold assumption for a base case but evaluate the sensitivity of conclusions to that assumption (EPA 1999). Similarly, for O3, although the National Morbidity, Mortality, and Air Pollution Study (Bell et al. 2004) finds a similar relative risk for O3 above and below the NAAQS, differences between personal O3 exposures and ambient concentrations make it difficult to detect thresholds (Zhang and Lioy 1994; Brauer et al. 2002).
From the perspective of the NSR rule changes, future analyses should consider whether policy conclusions are sensitive to assumptions about thresholds and other nonlinearities. Such analyses should consider a variety of population thresholds other than the NAAQS, especially because the PM2.5 NAAQS could be revised in coming years on the basis of evidence of effects at lower ambient concentrations (EPA 2005f). The analyses should also take account of the likelihood that imposing a threshold on observational data that appear linear would result in a higher slope above the threshold (a so-called hockey stick concentration-response function). Thus, although it is more likely that health effects would be observed at higher ambient concentrations, there is no specific evidence that health effects are isolated to nonattainment areas. The geographic patterns of health effects could also be influenced by geographic clustering in the prevalence of susceptible people (asthmatics and diabetics). Available data are generally too sparse for such an assessment, although significant urban-rural differences may be present for multiple health outcomes of interest.
Because of difficulties in linking health outcomes exclusively with O3 and PM and because of a lack of definitive evidence regarding the shape of the concentration-response function (especially at low concentrations), there would be substantial uncertainties in quantifying health outcomes associated with NSR rule changes even if concentration changes were quantified. However, if the same assumptions are used for all emission scenarios to be compared, the relative effects of different strategies are likely to be appropriately ranked, and the analyses will provide order-of-magnitude estimates that can be used to determine whether more-refined information would be needed to choose among policy options.
Influence of Geographic Location of Sources on Potential Health Effects
Our final question is related to the population health effects associated with emission changes. A relevant calculation would integrate atmospheric fate and transport with population patterns and ambient concentrations downwind of sources. Formally incorporating the above uncertainties in health effects is beyond the scope of this report, but under a working assumption of a linear concentration-response function for O3 or PM, some estimates from the literature can provide insight into the degree to which the relationship between emissions and total population exposure varies spatially or temporally. By total population exposure, we refer to the summation of incremental concentration changes across the population, multiplied by the affected population, which would give a value proportional to health benefits in the event of a linear concentration-response function. For example, Mauzerall et al. (2005) used the CAMx model of the relationship between NOx emissions and O3 concentrations from point sources in different locations and under different meteorologic conditions and followed a health-benefits analysis framework. They found that health benefits per unit of NOx emission reductions were twice as high during a high-temperature episode relative to a low-temperature episode and that health benefits per unit of NOx emission reductions were more than twice as high for a source in Maryland as for a source in North Carolina (in spite of 1-hour maximum O3 concentrations that were more than twice as high in North Carolina). The latter differential was attributed to downwind population density. In a follow-up study, Tong et al. (2006) evaluated the ozone-related exposure and health effects associated with additional NOx emissions in various source counties around Atlanta, Georgia. They determined that the aggregate effects were negative for source counties near the city center and positive for rural source counties. The negative impacts for urban emissions were attributed to local ozone scavenging in the domain where population density was greatest. This modeling illustrates the substantial spatial variability in health benefits per unit emission reductions, especially for secondary pollutants. Similarly, Wilson (2003) used a source-receptor matrix to determine the relationship between NOx, SO2, and primary PM emissions and population exposures to PM2.5, considering 507 power plants across the United States. He found that total population exposure (the product of population and incremental concentration changes) to ammonium sulfate per unit of SO2 emissions varied by a factor of 10 and population exposure to PM2.5 ammonium nitrate per unit of NOx emissions varied by a factor of 40 among sites. Similar variability has been reported elsewhere (Evans et al. 2002; Zhou et al. 2006). In all of these studies, as in Mauzerall et al. (2005) and Tong et al. (2006), downwind population patterns as well as meteorology and stack characteristics were important predictors of total population
exposure. Both of these analyses clearly indicate that geographic variability in health benefits for a given emission reduction is substantial even under the assumption of a linear concentration-response function with no threshold, and this variability would only increase if nonlinearities were considered.
CONCLUSIONS
The committee draws the following conclusions:
-
Nationally, the fraction of total emissions from existing sources that are eligible to be subject to NSR varies by pollutant: for SO2, 80% is from point sources potentially subject to NSR. For NOx, 30-40% is from point sources potentially subject to NSR. For primary PM2.5 and VOC, little is emitted directly from point sources.
-
Electricity-generating facilities, especially coal-fired power plants, dominate SO2, NOx, and PM2.5 emissions from NSR-eligible sources. It is unclear whether the NSR rule changes would have a greater effect on electricity-generating facilities than on other sectors, and it is unknown whether electricity-generating facilities will dominate the emission changes associated with the NSR rule changes. However, NSR revisions that substantially affect electricity-generating facility emissions would tend to have the greatest effect on point-source emissions in most states.
-
NSR-eligible point sources account for a large portion of total emissions in Texas, midwestern, southern, and eastern states but a much smaller portion of total emissions in western states. That is due in large part to the geographic distribution of coal-fired power plants.
-
Within the electricity-generating sector, older power generators have higher emission rates than newer facilities and contribute proportionately more to total emissions than to electricity generation. The older facilities are more likely than newer facilities to undergo maintenance, repair, and replacement of key components, so a substantial portion of emissions from the electricity-generating sector are potentially affected by the NSR rule changes.
-
On the basis of emissions data, attainment-nonattainment status, and health evidence, O3 and PM2.5 are the criteria air pollutants most likely to contribute to health effects of NSR rule changes, although uncertainties remain regarding the extent to which these pollutants represent indexes rather than direct causative agents.
-
Atmospheric fate and transport models constitute the recommended approach to determine the O3 and PM2.5 concentration changes associated with NSR rule changes, but model users should ensure that such models incorporate critical phenomena of O3 and secondary aerosol chemistry over long downwind distances.
-
On the basis of factors influencing O3 and secondary aerosol chemistry, there will be well-defined geographic patterns in the concentration effects of emission changes in O3 and secondary PM precursors, including regional patterns for PM2.5 based on ambient SO4, NO3, and NH3 concentrations and urban-rural patterns for O3 based on ambient concentrations of NOx and VOCs.
-
The emissions from regions most affected by NSR vary by pollutant. For SO2, the relevant regions are the Ohio River valley, the northeastern corridor, and the southern Appalachians. For NOx, the eastern United States is dominated by NSR sources and shows the same spatial pattern as for SO2. For VOCs, the pattern is determined primarily by the location of petrochemical industries, along the major waterways, California, the Gulf Coast, the eastern seaboard, the Great Lakes, and the Ohio River valley.
-
The regions with the highest SO2, NOx, and PM2.5 emissions are the same as those where the NSR-controlled sources dominate emissions of these pollutants and their precursors.
-
Given those factors and downwind population patterns, health benefits per unit of emission reduction can vary by more than an order of magnitude across sites even if concentration-response functions are assumed to be linear, and the variability could be even greater if thresholds or non-linearity would be present. Understanding geographic patterns of emission changes associated with NSR rule changes would therefore be critical in determining the net public-health effects.


