
2
Aging in Sub-Saharan Africa: The Changing Demography of the Region
Victoria A. Velkoff and Paul R. Kowal
INTRODUCTION
Population aging will become perhaps the most important demographic dynamic affecting families and societies throughout the world in the coming decades. Nearly 63 percent of the population age 60 and older currently resides in developing countries, and this percentage will increase to nearly 73 percent over the next 25 years. Yet the limited understanding of the demographics of aging in most developing countries stands in stark contrast to the comparatively well-documented course and implications of aging in developed countries.
A combination of factors contributes to the limited understanding of the situation of older people in Africa: they constitute a smaller proportion of the population and their proportions are projected to grow fairly slowly relative to other areas in the world.1 In addition, other more pressing political, demographic, and health issues have confronted the subcontinent over the past two decades, and the systems to collect data essential for
accurate demographic estimates and projections are largely lacking. Resources available for addressing demographic changes and health problems in Africa have focused on issues of more immediate concern to the great majority of people who are not yet old: infant, child, and maternal health; nutrition; and HIV/AIDS. However, the consequences of recent social and political upheavals—HIV/AIDS, poverty, and violent conflicts— have shaken the core of societies and thrust older people into new roles in families and communities.
Despite the fact that the older population makes up a small proportion of the population in most sub-Saharan African countries, the number of older people is growing. In 2005, there were 34 million people age 60 and over in sub-Saharan Africa, and this number is projected to increase to over 67 million by 2030. In fact, the number of older people is growing more rapidly in sub-Saharan Africa than in the developed world. This increase in the number of older people will occur despite the excess mortality due to AIDS that many countries are currently experiencing.
This paper is divided into two sections. The first section focuses primarily on the demographic aspects of aging in sub-Saharan African countries with a special subsection examining the impact of AIDS on population aging. The demographic data in this first section are from the U.S. Census Bureau’s International Programs Center’s International Data Base. The second section compares and contrasts the estimates and projections from the U.S. Census Bureau with those of the United Nations (UN) Population Division. This section presents, compares, and contrasts these two sources of demographic estimates and projections, focusing on populations age 60 and older. The underlying models and assumptions, input data, and the resulting output data are examined to describe the demographic aspects of aging in sub-Saharan African countries. The concluding section provides suggestions for future work in the area.
DEMOGRAPHIC DIMENSIONS
The world is aging at an unprecedented rate. The numbers of older persons and pace of aging vary widely between and within regions, and typically more developed regions have higher proportions of their populations in older age groups than do developing regions (Figure 2-1). For example, nearly 21 percent of Europe’s population was age 60 and over in 2005. In contrast, less than 5 percent of sub-Saharan Africa’s population was age 60 and over. In other developing regions, those aged 60 and over make up between 7 and 9 percent of the population. In all regions of the world, the proportion age 60 and over is projected to increase in the future.
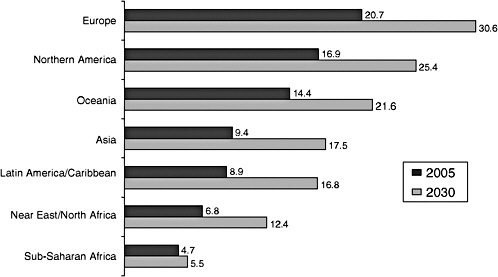
FIGURE 2-1 Percentage age 60 and over by region of the world: 2005 and 2030.
SOURCE: U.S. Census Bureau (2005).
By 2030, over 30 percent of Europeans are projected to be age 60 and over. In Asia and Latin America and the Caribbean, the proportions age 60 and over are projected to nearly double in less than 25 years. Again, sub-Saharan Africa stands in contrast to the other regions of the world with the proportion age 60 and over projected to grow only slightly, from 4.7 percent in 2005 to 5.5 percent in 2030.
The Misconception of “No Older People” in Africa
The small increase in the proportion age 60 and over in sub-Saharan Africa masks a large increase in the number of people in this age group. The number of people age 60 and over in sub-Saharan Africa will nearly double from over 34 million in 2005 to over 67 million in 2030. The number of older people is growing more rapidly in sub-Saharan Africa than in the developed world and will continue to do so in the future (Figure 2-2). The average annual growth rate of the population age 60 and over in sub-Saharan Africa is over 2 percent and will increase over the next 50 years to nearly 4 percent. In contrast, the average annual growth rate of this population in developed countries is less than 2 percent and is projected to decline to less than 1 percent over the next several decades.
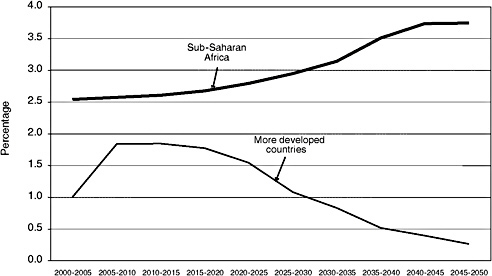
FIGURE 2-2 Average annual growth rates of the age 60 and over population in sub-Saharan Africa versus more developed countries: 2000 to 2050.
SOURCE: U.S. Census Bureau (2005).
Country Comparisons
Population aging in sub-Saharan Africa is not uniform. Both the size of the 60 and over population and the proportion of the population they account for varies among the countries of the region.2
Eight Countries Have at Least 1 Million People Age 60 and Over
In 2005, Nigeria ranked among the top 30 countries in the world on the basis of the size of its population age 60 and over. Nigeria had the largest older population in sub-Saharan Africa, with over 6 million people age 60 and over; South Africa had just over 3.4 million (Figure 2-3). Six additional sub-Saharan African countries had over 1 million people age 60 and over in 2005.
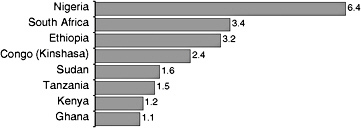
FIGURE 2-3 Sub-Saharan African countries with at least 1 million people age 60 and over: 2005 (number of people age 60 and over in millions).
SOURCE: U.S. Census Bureau (2005).
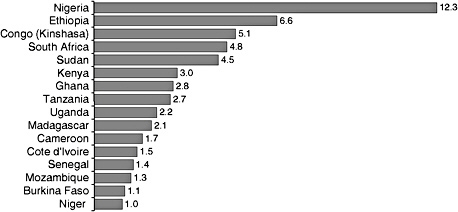
FIGURE 2-4 Sub-Saharan African countries with at least 1 million people age 60 and over: 2030 (number of people age 60 and over in millions).
SOURCE: U.S. Census Bureau (2005).
The size of older populations in many sub-Saharan African countries is roughly equivalent to certain developed countries. For instance, Nigeria’s older population is roughly the same size as those in South Korea and Canada.
The list of countries with at least 1 million people age 60 and over is projected to increase to 16 by the year 2030 (Figure 2-4). Again, Nigeria will have the largest older population, with over 12 million people age 60 and over, and Ethiopia will rank second, with over 6 million people. Congo (Kinshasa) and South Africa are projected to have nearly 5 million older people in 2030. Burkina Faso, Cameroon, Cote d’Ivoire, Madagascar, Mozambique, Niger, Senegal, and Uganda are all projected to have their older populations grow to over 1 million people by 2030.
Mauritius Is the Oldest Country in Sub-Saharan Africa
Although the proportion age 60 and over is just under 5 percent for sub-Saharan Africa as a whole, a number of countries have much higher proportions in this age group (Figure 2-5). Over 9 percent of Mauritius’s population was age 60 and over in 2005, making it the oldest country in sub-Saharan Africa. South Africa had 7.8 percent of its population age 60 and over in 2005 and nearly 7 percent of Lesotho’s population was in this age group. At the other end of the spectrum are such countries as Benin, Burundi, Kenya, Mauritania, Rwanda, Uganda, and Zambia, where the older population accounted for less than 4 percent of the total population.
By 2030, nearly 22 percent of the population of Mauritius is projected to be age 60 and over. In South Africa over 12 percent of the population is projected to be 60 and over (Figure 2-6). While the proportion of this population group is projected to increase in some countries (for example, Congo [Brazzaville], Ghana, Mauritius, and South Africa), the proportion age 60 and over is projected to remain fairly stable in many sub-Saharan African countries. For instance, 4 percent of Burundi’s population in 2005 was age 60 and over, and this proportion is projected to stay the same in 2030. In other countries, the proportion is projected to decrease slightly. In Malawi, the percentage is projected to decrease from 4.2 percent in 2005 to 3.7 percent in 2030.
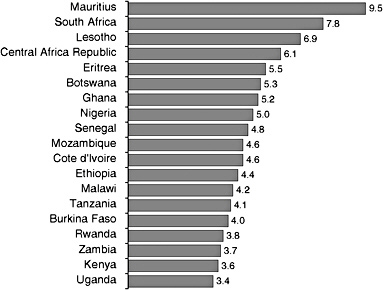
FIGURE 2-5 Percentage age 60 and over in selected sub-Saharan African countries: 2005.
SOURCE: U.S. Census Bureau (2005).
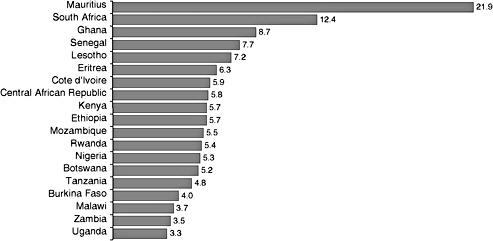
FIGURE 2-6 Percentage age 60 and over in selected sub-Saharan African countries: 2030.
SOURCE: U.S. Census Bureau (2005).
Although the proportion age 60 and over is on average projected to remain stable or decrease slightly in many countries, the absolute number of people in this age group is projected to grow in most countries. For example, the decrease in the proportion age 60 and over in Malawi between 2003 and 2030 masks an increase in the absolute number of people in this age group of around 280,000.
Older Populations Projected to Grow in Sub-Saharan African Countries
The change in the proportion of the population age 60 and over in most sub-Saharan African countries does not indicate the magnitude of change. The absolute number of people age 60 and over is projected to increase over the next three decades. However, there are exceptions, such as Botswana, Lesotho, and Swaziland. These three countries are severely affected by the AIDS epidemic, and their populations age 60 and over are projected to decrease between 2005 and 2030. Conversely, the number of older people in some countries is projected to more than double by 2030. In Sudan, for example, the number is expected to nearly triple (Figure 2-7).
Composition of Older Age Groups
In many countries in the world, the oldest old (those age 80 and over) is the fastest growing segment of the population. This is true for a majority of
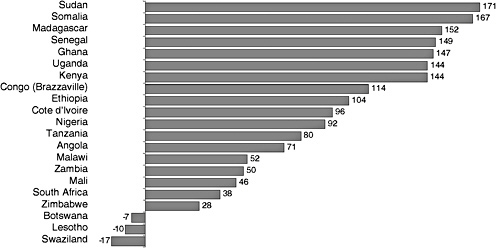
FIGURE 2-7 Percentage increase in the population age 60 and over in selected sub-Saharan African countries: 2005 to 2030.
SOURCE: U.S. Census Bureau (2005).
sub-Saharan African countries as well. In sub-Saharan Africa there were around 2.4 million people age 80 and over in 2005, and this number is projected to nearly triple to 6.1 million by 2030. Despite the rapid growth in the number of people age 80 and over, the oldest-old population accounted for less than 1 percent of the total population of sub-Saharan Africa in the years 2005 and 2030.
While the oldest old account for a very small proportion of the total population, they accounted for 7.1 percent of the 2005 population age 60 and over in sub-Saharan Africa. By 2030, the proportion will increase to 9.1 percent. In the more developed region, the oldest old will account for 22.6 percent of the population age 60 and over in 2030 and 12 percent in countries in the less developed regions.
Factors Affecting Population Structure
Impact of AIDS Seen in Population Pyramids
The extensive spread of HIV started in sub-Saharan Africa in the late 1970s, but it was not until the late 1980s that the epidemic exploded in Southern Africa (Joint United Nations Programme on HIV/AIDS and World Health Organization, 2003). Whereas the HIV/AIDS pandemic has consisted of various distinct epidemics, with geographic and population differences, almost all countries in sub-Saharan Africa have generalized
epidemics. At the end of 2004, about 25.4 million of the estimated 39.4 million people worldwide living with HIV/AIDS were in this region, accounting for approximately two-thirds of the global burden (Joint United Nations Programme on HIV/AIDS, 2004). South Africa has the largest number of people living with HIV/AIDS in the world, 5.3 million. Botswana and Swaziland have the highest prevalence levels, both approaching 40 percent with no signs of leveling off. West Africa has been relatively less affected by HIV infection than other regions of sub-Saharan Africa, but the spread of HIV from forced migration in this subregion is a significant cause for concern.
In those countries most affected by HIV/AIDS, the age-specific impact on mortality is reshaping population structures. The death of adults in their prime reproductive and economically productive years has changed age pyramids, through declining fertility and increasing mortality, resulting in very atypical age distributions both now and for the next few decades.
Specific details of the impact are provided in the next section, but a good illustration of the impact is evident on examination of the population pyramids for Botswana and Zimbabwe. Comparisons of the age and sex structures over time for each country reveal the magnitude of the devastation. Figures 2-8 through 2-11 show the age and sex structure of the populations of Botswana and Zimbabwe for 2005 and 2030. These pyramids show the population estimates and projections with AIDS mortality incorporated into the projections and what the population structures would have looked like without AIDS mortality.
The 2005 population of Botswana is somewhat smaller than it would have been if there was no AIDS mortality (Figure 2-8). By 2030, Botswana’s population age and sex structure is projected to be dramatically different from what it would have been without AIDS mortality (Figure 2-9). Botswana’s total population in all age groups is projected to decrease slightly between 2005 and 2030, dropping from about 1.6 million in 2005 to 1.5 million in 2030. The population age 60 and over is also projected to decrease slightly over the same time period. In 2005, there were 86,000 people age 60 and over, and by 2030 this population is projected to be 80,000.
The age and sex structures for Zimbabwe also show the impact of AIDS mortality; however, the impact is slightly less severe than that on Botswana. Zimbabwe’s population in 2005 is somewhat smaller than it would have been without AIDS mortality (Figure 2-10). By 2030, the impact of AIDS can clearly be seen in the age and sex structure of the population (Figure 2-11). Unlike Botswana, the total population in Zimbabwe will be larger in 2030 than it was in 2005, despite the impact of AIDS. The older population will also continue to grow in Zimbabwe. In 2005, there were 614,000 people age 60 and over, and this number is projected to grow to 783,000 by
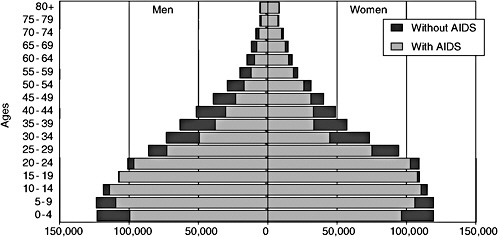
FIGURE 2-8 Population by age and sex in Botswana, with and without AIDS mortality incorporated into the estimate: 2005.
SOURCE: U.S. Census Bureau (2005).
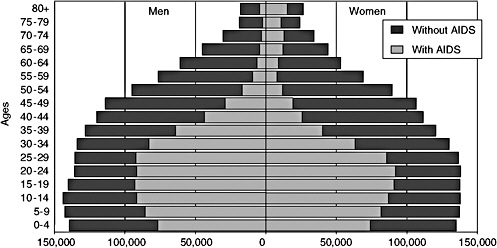
FIGURE 2-9 Population by age and sex in Botswana, with and without AIDS mortality incorporated into the projection: 2030.
SOURCE: U.S. Census Bureau (2005).
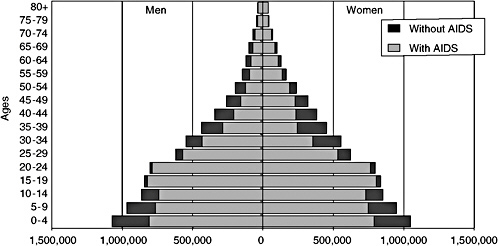
FIGURE 2-10 Population by age and sex in Zimbabwe, with and without AIDS mortality incorporated into the estimate: 2005.
SOURCE: U.S. Census Bureau (2005).
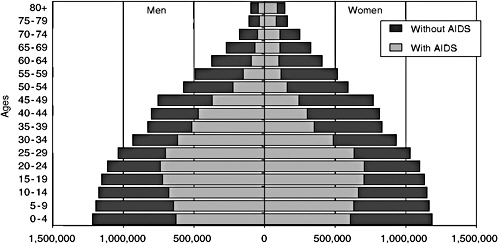
FIGURE 2-11 Population by age and sex in Zimbabwe, with and without AIDS mortality incorporated into the projection: 2030.
SOURCE: U.S. Census Bureau (2005).
2030. So even though AIDS is having a severe impact on Zimbabwe’s population, the older population will continue to grow.
Impact of AIDS on Life Expectancy
Perhaps a more intuitive understanding of mortality is obtained by considering the life expectancy at birth, the number of years a newborn child is expected to live given the existing health and other environmental conditions of the country. Projection models have usually indicated a steady increase in life expectancy under the assumption that improvements in public health and health care, particularly child immunizations, would decrease mortality.
Life expectancy in sub-Saharan African countries ranges from a high of 72.4 in Mauritius to a low of 33.2 in Swaziland (Figure 2-12). Life expectancy at birth is below 50 years in 28 sub-Saharan African countries. Eight countries have life expectancy less than 40 years. These low levels of life expectancy at birth are related to many factors, including poor access to health care, low living standards and economic oppression, and civil unrest and violent conflict. However, in most countries, the main reason for these low levels is the AIDS pandemic. Figures 2-13 and 2-14 show trends in life expectancy by sex for
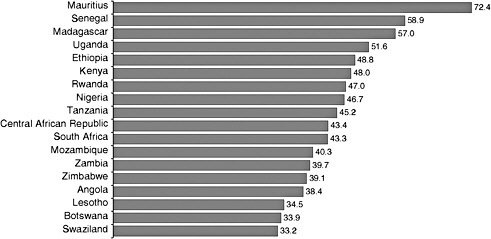
FIGURE 2-12 Life expectancy at birth for selected sub-Saharan African countries: 2005.
SOURCE: U.S. Census Bureau (2005).
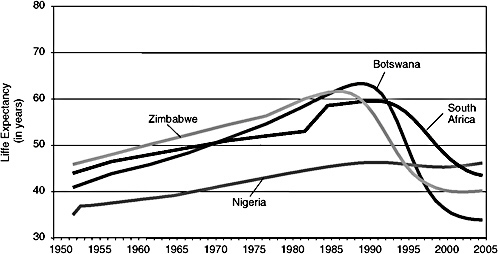
FIGURE 2-13 Male life expectancy at birth in four countries: 1950 to 2005.
SOURCES: United Nations (2001) and U.S. Census Bureau (2005).
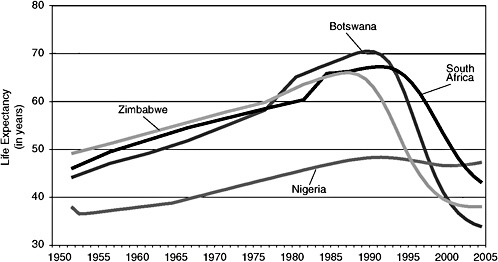
FIGURE 2-14 Female life expectancy at birth in four countries: 1950 to 2005.
SOURCES: United Nations (2001) and U.S. Census Bureau (2005).
Botswana and three other countries affected by AIDS. Life expectancy at birth increased steadily in all four countries for both men and women during the 1950s, 1960s, and 1970s. In the mid-1980s, there was a dramatic downturn in the trajectory of life expectancy at birth, mainly related to the increased mortality due to AIDS.
The trend in life expectancy at birth in Botswana is a good illustration of the devastation of AIDS on populations in Africa. In Botswana, male life expectancy at birth fell from 63.3 years the late 1980s to just 33.9 years in 2005, a decrease of 29.4 years (Figure 2-13). The loss for women is even larger: life expectancy dropped by 36.7 years over the same time period. Zimbabwe also experienced large decreases in life expectancy at birth, a drop of 21.4 years for men and 28.0 years for women. The AIDS pandemic has had, and will continue to have, an enormous impact on mortality in Africa.
Life Expectancy With and Without AIDS
Another way to illustrate the impact of AIDS on life expectancy at birth is to calculate life expectancies with and without AIDS mortality for one point in time. Taking the example of Botswana again, in 2005 life expectancy at birth for men was 40 years lower than it would have been if there was no mortality due to AIDS. AIDS mortality has had an even larger impact on female life expectancy. Life expectancy at birth for women in Botswana in 2005 was estimated at 33.8 years, 44.6 years lower than it would have been without the excess mortality due to AIDS. The net impact of AIDS on life expectancy at birth in Lesotho, Swaziland, and Zimbabwe is also large—with net differences of over 25 years in male life expectancy and 30 years in female life expectancy (see Table 2-1). That is, life expectancies at birth in these three countries are over 30 years lower for women than they would have been without AIDS mortality.
COMPARISON OF U.S. CENSUS BUREAU AND UN POPULATION DIVISION ESTIMATES AND PROJECTIONS
The U.S. Census Bureau and the UN Population Division both produce population estimates and projections for all countries of the world.3 They share data sets but use different modeling techniques and assumptions to produce their demographic estimates and projections. In this section we compare the population estimates and projections from the two organizations. We also examine the input data used for the two sets of projections and compare the assumptions that are made about fertility, mortality (particularly about the impact of the HIV epidemic), and migration.
TABLE 2-1 Life Expectancy at Birth, With and Without AIDS, by Sex for Selected Sub-Saharan African Countries: 2005 (countries with a difference of 5 or more years in life expectancy for at least one sex)
|
Country |
Men |
Women |
||||
|
With AIDS |
Without AIDS |
Difference |
With AIDS |
Without AIDS |
Difference |
|
|
Botswana |
33.9 |
73.9 |
−40.0 |
33.8 |
78.4 |
−44.6 |
|
Burkina Faso |
47.0 |
51.4 |
−4.4 |
50.0 |
55.6 |
−5.6 |
|
Burundi |
49.6 |
56.7 |
−7.1 |
51.0 |
60.1 |
−9.1 |
|
Cameroon |
50.7 |
58.6 |
−7.9 |
51.1 |
61.3 |
−10.2 |
|
Central African Republic |
43.3 |
56.6 |
−13.3 |
43.5 |
60.8 |
−17.2 |
|
Cote d’Ivoire |
46.1 |
52.0 |
−6.0 |
51.3 |
60.4 |
−9.1 |
|
Ethiopia |
47.7 |
51.7 |
−4.0 |
50.0 |
55.3 |
−5.3 |
|
Gabon |
53.6 |
62.2 |
−8.6 |
56.5 |
67.4 |
−10.9 |
|
Kenya |
48.9 |
57.3 |
−8.4 |
47.1 |
57.7 |
−10.7 |
|
Lesotho |
35.5 |
62.8 |
−27.3 |
33.4 |
68.2 |
−34.8 |
|
Malawi |
41.7 |
55.9 |
−14.2 |
41.2 |
59.0 |
−17.8 |
|
Mozambique |
39.9 |
49.6 |
−9.7 |
40.8 |
52.3 |
−11.5 |
|
Namibia |
44.7 |
68.2 |
−23.5 |
43.1 |
72.6 |
−29.5 |
|
Nigeria |
46.2 |
51.4 |
−5.2 |
47.3 |
54.5 |
−7.2 |
|
Rwanda |
45.9 |
51.0 |
−5.1 |
48.0 |
54.5 |
−6.5 |
|
South Africa |
43.5 |
63.5 |
−20.0 |
43.1 |
70.6 |
−27.5 |
|
Swaziland |
32.5 |
70.8 |
−38.3 |
34.0 |
76.0 |
−42.0 |
|
Tanzania |
44.6 |
53.4 |
−8.9 |
45.9 |
57.6 |
−11.7 |
|
Togo |
55.0 |
60.8 |
−5.8 |
59.1 |
66.7 |
−7.6 |
|
Uganda |
50.7 |
56.8 |
−6.1 |
52.5 |
60.6 |
−8.1 |
|
Zambia |
39.4 |
54.5 |
−15.0 |
40.0 |
58.9 |
−18.9 |
|
Zimbabwe |
40.2 |
69.2 |
−29.0 |
38.0 |
73.5 |
−35.5 |
|
SOURCE: U.S. Census Bureau (2005). |
||||||
Population
Table 2-2 compares the U.S. Census Bureau and the UN estimates and projections of the proportion of the population age 50 and over, age 60 and over, and age 80 and over for the world, the developed regions, the developing regions, and sub-Saharan Africa for 2005 and 2030. In 2005, the percentage of older persons in sub-Saharan Africa was low compared with other regions, and these percentages will increase at a slower rate than in other regions. The proportion age 60 and over is remarkably similar in the two data sets. The Census Bureau estimates that 4.7 percent of the population in sub-Saharan Africa was age 60 and over in 2005, and the UN estimates 4.9 percent. By 2030, both organizations project that the proportion in the older ages will increase but the increase is fairly small, less than 1 percentage point for both data sets. The differences in percentages, when comparing Census Bureau with UN data, are surprisingly small (see Table 2-2).
If we examine the absolute numbers of older people by regions, we see more of a difference between the two data sets, particularly for certain regions (e.g., Asia and North Africa); however, the difference is still small. For sub-Saharan Africa, the Census Bureau estimates 34.1 million people age 60 and over and the UN estimates 36.6 million, a difference of about 2.5 million. By 2030, the projected difference in the number of older people in sub-Saharan Africa is larger, 3.7 million people. Both organizations project that the number of people age 60 and over in sub-Saharan Africa will roughly double in size between 2005 and 2030 (see Table 2-3).
Country-level comparisons of these two data sets provide an illustration of the results of applying different assumptions to the input data. Figure 2-15 presents the differences between the two data sets in the estimates for the number of people age 60 and over in 2005. The UN estimates for Ethiopia, Sudan, and Tanzania are much larger in 2005 than are the Census Bureau’s, while the estimates for Nigeria and South Africa are larger from the Census Bureau (see Figure 2-15).
Comparing the Census Bureau and UN projections for 2030, one sees that the magnitude of the difference increases substantially, especially in Ethiopia, Nigeria, South Africa, and Tanzania (see Figure 2-16). The UN projects that in Ethiopia there will be around 7.5 million people age 60 and over and the Census Bureau projects that there it will be around 6.6 million, a difference of nearly 1 million people. For other countries, not only the magnitude but also the sign of the difference changes. For example, in 2005 the Census Bureau’s estimate for South Africa was larger than the UN estimate by around 236,000 people. In 2030, the Census Bureau’s projection for the number of older people in South Africa is smaller than that of the UN’s projection by over 1 million people. Similarly, the Census Bureau
TABLE 2-2 Percentage of the Population Age 50 and Over, 60 and Over, and 80 and Over: 2005 and 2030
|
Regiona |
Year |
Percentage Age 50 and Over |
Percentage Age 60 and Over |
Percentage Age 80 and Over |
|||
|
Census |
UN |
Census |
UN |
Census |
UN |
||
|
World |
2005 |
19.2 |
19.3 |
10.4 |
10.4 |
1.4 |
1.3 |
|
2030 |
27.8 |
27.6 |
16.8 |
16.7 |
2.5 |
2.4 |
|
|
More Developed |
2005 |
33.3 |
33.2 |
20.2 |
20.2 |
3.7 |
3.7 |
|
2030 |
42.5 |
42.0 |
29.3 |
28.9 |
6.6 |
6.3 |
|
|
Less Developed |
2005 |
16.0 |
16.1 |
8.1 |
8.2 |
0.8 |
0.8 |
|
2030 |
25.1 |
24.9 |
14.6 |
14.5 |
1.7 |
1.7 |
|
|
Sub-Saharan Africa |
2005 |
9.6 |
9.9 |
4.7 |
4.9 |
0.3 |
0.3 |
|
2030 |
11.2 |
11.2 |
5.5 |
5.7 |
0.5 |
0.5 |
|
|
aMore developed region = all countries of Europe, plus North America, Australia, New Zealand, and Japan. Less developed region = all countries in Africa, Asia (excluding Japan), Latin America and the Caribbean, Micronesia and Polynesia. For UN region definition, see http://esa.un.org/unpp/definition.html. SOURCES: U.S. Census Bureau (2005) and United Nations (2005). |
|||||||
TABLE 2-3 Number of Older People by Age and Region of the World: 2005 and 2030
|
Regiona |
Year |
Age 50 and Over |
Age 60 and Over |
Age 80 and Over |
|||
|
Census |
UN |
Census |
UN |
Census |
UN |
||
|
Europe |
2005 |
245,614,448 |
245,015,520 |
151,291,593 |
150,591,254 |
26,169,672 |
25,725,770 |
|
2030 |
312,561,235 |
304,613,381 |
214,331,028 |
207,605,773 |
45,929,877 |
41,947,901 |
|
|
North America |
2005 |
97,313,814 |
97,343,151 |
55,589,473 |
49,339,590 |
11,903,309 |
6,700,336 |
|
2030 |
147,652,565 |
145,846,216 |
102,554,119 |
100,570,697 |
21,936,520 |
19,998,266 |
|
|
Oceania |
2005 |
8,246,024 |
8,194,953 |
4,700,674 |
4,594,260 |
874,076 |
846,739 |
|
2030 |
13,693,849 |
13,838,186 |
8,857,103 |
9,103,985 |
1,793,838 |
1,793,470 |
|
|
Asia |
2005 |
691,162,428 |
706,996,181 |
355,182,191 |
364,860,938 |
38,087,333 |
38,103,899 |
|
2030 |
1,390,710,312 |
1,404,019,914 |
824,256,449 |
833,038,827 |
1,793,838 |
102,982,325 |
|
|
Latin America/Caribbean |
2005 |
93,146,632 |
93,344,375 |
49,256,543 |
49,339,590 |
6,314,087 |
6,700,336 |
|
2030 |
200,780,113 |
199,873,771 |
117,985,102 |
117,900,557 |
17,350,971 |
18,277,533 |
|
|
North Africa |
2005 |
25,672,557 |
25,888,659 |
12,765,209 |
12,868,919 |
1,059,691 |
1,058,834 |
|
2030 |
63,948,861 |
59,986,758 |
34,179,192 |
32,047,078 |
106,120,112 |
3,079,500 |
|
|
Sub-Saharan Africa |
2005 |
70,591,644 |
74,237,838 |
34,110,260 |
36,594,051 |
2,427,129 |
2,626,207 |
|
2030 |
137,419,008 |
140,021,970 |
67,335,106 |
71,033,103 |
6,097,609 |
6,549,537 |
|
|
aIn this table, regions follow the practice of the United Nations. For region definitions, see http://esa.un.org/unpp/definition.html. SOURCES: U.S. Census Bureau (2005) and United Nations (2005). |
|||||||
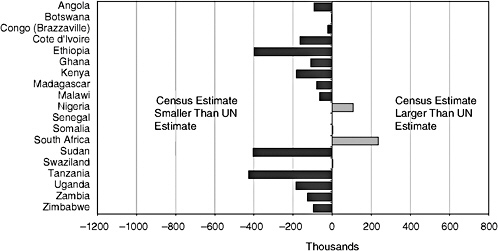
FIGURE 2-15 Difference between U.S. Census Bureau and UN estimates of the population age 60 and over in selected sub-Saharan African countries: 2005.
SOURCES: U.S. Census Bureau (2005) and United Nations (2005).
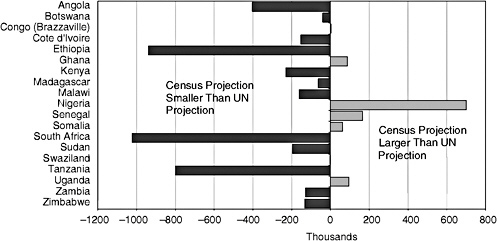
FIGURE 2-16 Difference between U.S. Census Bureau and UN estimates of the population age 60 and over in selected sub-Saharan African countries: 2030.
SOURCES: U.S. Census Bureau (2005) and United Nations (2005).
estimates for Swaziland were larger than the UN estimates in 2005. However, by 2030 the Census Bureau projections of the older population for this country are smaller than the UN’s. The opposite is true for Congo (Brazzaville), Ghana, Senegal, and Uganda, in that the Census Bureau’s estimate in 2005 was smaller than the UN’s, but by 2030, the Census Bureau’s projection of the population age 60 and over is larger than the UN’s.
A closer inspection of country-specific data reveals some unique differences between the two data sources. A number of patterns emerge when the numbers and percentages of older persons are examined from 1990 to 2030. The Census Bureau’s figures are often lower than the UN data, a situation that is probably due to the differences in assumptions about the future path of the AIDS epidemic (discussed below). The impact of violent conflict in a number of countries in sub-Saharan Africa resembles an epidemic, but, again, reliable data on the effect of these conflicts on population size are not available (see Table 2-4 for estimates of war deaths). Countries with a large impact from the HIV epidemic and countries affected by violent conflict over the past decades show the greatest differences.
Examination of population estimates and projections for Botswana demonstrate the extent to which the Census Bureau and the UN data sets differ. Both organizations project that the total population of Botswana will decrease slightly between 2005 and 2030, but the magnitude of the decrease differs. The Census Bureau projects the total population of Botswana will decline from 1.6 million in 2005 to 1.5 million by 2030, a decrease of just over 100,000 people. The UN also projects a decline, but it is slightly larger, just over 120,000 people. For the older population, the two data sources also differ. The Census Bureau projects that the 2030 older population will be about 6,000 people smaller than the 2005 older population. The UN projects that the older population in 2030 will be around 30,000 people larger than the 2005 older population.
Factors Affecting Population Projections
Comparison of input data and assumptions used in the Census Bureau and UN estimates and projections help explain the differences between the two data sets. The main differences are linked to the different assumptions about AIDS mortality.
Input Data
The four main sources of input data are censuses, vital registration, national household surveys, and demographic surveillance sites. Census data are the most often used source for the baseline population data in population projections. Figure 2-17 indicates the most recent rounds of census
TABLE 2-4 U.S. Census Bureau and the United Nations Population Division Estimates and Projections of Numbers and Percentages of Older People for Selected Countries in Sub-Saharan Africa: 1990, 2005, 2015, and 2030
|
Country |
Total Population |
Population Age 50 and Over |
Population Age 60 and Over |
Population Age 80 and Over |
||||
|
Number |
Percentage |
Number |
Percentage |
Number |
Percentage |
|||
|
Countries affected by HIV/AIDS (epidemic characteristics in parentheses) |
||||||||
|
Botswana (AIDS—late start, explosive growth, very high prevalence) |
||||||||
|
Census |
||||||||
|
1990 |
1,263,643 |
128,233 |
10.1 |
70,170 |
5.6 |
9,991 |
0.8 |
|
|
|
2005 |
1,640,115 |
159,976 |
9.8 |
86,480 |
5.3 |
13,296 |
0.8 |
|
|
2015 |
1,634,216 |
150,760 |
9.2 |
86,008 |
5.3 |
16,342 |
1.0 |
|
|
2030 |
1,537,295 |
126,666 |
8.2 |
80,348 |
5.2 |
19,638 |
1.3 |
|
UN |
||||||||
|
|
1990 |
1,428,510 |
112,310 |
7.9 |
55,405 |
3.9 |
4,344 |
0.3 |
|
|
2005 |
1,764,926 |
191,667 |
10.9 |
90,829 |
5.1 |
7,923 |
0.4 |
|
|
2015 |
1,690,491 |
213,034 |
12.6 |
124,154 |
7.3 |
10,539 |
0.6 |
|
|
2030 |
1,642,498 |
165,469 |
10.1 |
120,744 |
7.4 |
19,305 |
1.2 |
|
Kenya (AIDS—mid-start, steady growth, moderate prevalence) |
||||||||
|
Census |
||||||||
|
|
1990 |
23,358,413 |
1,836,738 |
7.9 |
918,152 |
3.9 |
90,394 |
0.4 |
|
|
2005 |
33,829,590 |
2,652,930 |
7.8 |
1,223,610 |
3.6 |
97,231 |
0.3 |
|
|
2015 |
42,702,635 |
3,615,823 |
8.5 |
1,632,772 |
3.8 |
117,860 |
0.3 |
|
|
2030 |
52,472,826 |
6,808,107 |
13.0 |
2,987,402 |
5.7 |
214,778 |
0.4 |
|
UN |
||||||||
|
|
1990 |
23,430,275 |
1,901,586 |
8.1 |
969,845 |
4.1 |
78,372 |
0.3 |
|
|
2005 |
34,255,722 |
2,929,834 |
8.6 |
1,406,063 |
4.1 |
130,706 |
0.4 |
|
|
2015 |
44,194,402 |
3,963,630 |
9.0 |
1,971,956 |
4.5 |
186,585 |
0.4 |
|
|
2030 |
60,605,792 |
6,791,920 |
11.2 |
3,217,455 |
5.3 |
286,887 |
0.5 |
|
Country |
Total Population |
Population Age 50 and Over |
Population Age 60 and Over |
Population Age 80 and Over |
||||
|
Number |
Percentage |
Number |
Percentage |
Number |
Percentage |
|||
|
Malawi (AIDS—mid-start, steady growth, high prevalence) |
||||||||
|
Census |
||||||||
|
|
1990 |
9,286,655 |
857,924 |
9.2 |
408,213 |
4.4 |
27,867 |
0.3 |
|
|
2005 |
12,707,464 |
1,082,383 |
8.5 |
535,960 |
4.2 |
34,683 |
0.3 |
|
|
2015 |
16,074,826 |
1,237,020 |
7.7 |
646,935 |
4.0 |
48,633 |
0.3 |
|
|
2030 |
22,030,253 |
1,677,073 |
7.6 |
815,850 |
3.7 |
81,753 |
0.4 |
|
UN |
||||||||
|
|
1990 |
9,459,434 |
821,864 |
8.7 |
393,630 |
4.2 |
16,041 |
0.2 |
|
|
2005 |
12,883,935 |
1,190,090 |
9.2 |
599,583 |
4.7 |
40,825 |
0.3 |
|
|
2015 |
15,997,810 |
1,402,139 |
8.8 |
760,846 |
4.8 |
55,848 |
0.3 |
|
|
2030 |
21,686,512 |
1,823,220 |
8.4 |
976,112 |
4.5 |
97,728 |
0.5 |
|
Senegal (AIDS—early start, no growth, low prevalence) |
||||||||
|
Census |
||||||||
|
|
1990 |
7,844,199 |
706,826 |
9.0 |
331,655 |
4.2 |
21,438 |
0.3 |
|
|
2005 |
11,706,498 |
1,176,631 |
10.1 |
566,950 |
4.8 |
42,071 |
0.4 |
|
|
2015 |
14,488,615 |
1,658,431 |
11.4 |
812,355 |
5.6 |
66,623 |
0.5 |
|
|
2030 |
18,292,033 |
2,837,929 |
15.5 |
1,409,079 |
7.7 |
133,766 |
0.7 |
|
UN |
||||||||
|
|
1990 |
7,977,487 |
776,870 |
9.7 |
388,355 |
4.9 |
31,543 |
0.4 |
|
|
2005 |
11,658,172 |
1,124,724 |
9.6 |
567,479 |
4.9 |
43,394 |
0.4 |
|
|
2015 |
14,538,255 |
1,511,727 |
10.4 |
744,539 |
5.1 |
62,697 |
0.4 |
|
|
2030 |
18,677,539 |
2,563,428 |
13.7 |
1,243,949 |
6.7 |
105,774 |
0.6 |
|
Uganda (AIDS—early start, now falling, moderate prevalence) |
||||||||
|
Census |
||||||||
|
|
1990 |
17,074,034 |
1,361,305 |
8.0 |
637,004 |
3.7 |
23,301 |
0.1 |
|
|
2005 |
27,269,482 |
1,794,941 |
6.6 |
917,712 |
3.4 |
70,907 |
0.3 |
|
|
2015 |
39,142,167 |
2,573,062 |
6.6 |
1,177,362 |
3.0 |
110,004 |
0.3 |
|
|
2030 |
67,604,495 |
4,921,994 |
7.3 |
2,242,143 |
3.3 |
185,678 |
0.3 |
|
UN |
||||||||
|
|
1990 |
17,757,955 |
1,476,737 |
8.3 |
727,634 |
4.1 |
42,637 |
0.2 |
|
|
2005 |
28,816,229 |
2,161,017 |
7.5 |
1,102,864 |
3.8 |
88,130 |
0.3 |
|
|
2015 |
41,918,305 |
2,648,080 |
6.3 |
1,413,514 |
3.4 |
127,436 |
0.3 |
|
|
2030 |
72,077,803 |
5,052,488 |
7.0 |
2,146,531 |
3.0 |
213,187 |
0.3 |
|
Zimbabwe (AIDS—early start, rapid growth, very high prevalence) |
||||||||
|
Census |
||||||||
|
|
1990 |
10,152,933 |
907,069 |
8.9 |
454,203 |
4.5 |
43,323 |
0.4 |
|
|
2005 |
12,160,782 |
1,159,985 |
9.5 |
613,557 |
5.0 |
70,709 |
0.6 |
|
|
2015 |
12,772,015 |
1,243,544 |
9.7 |
689,141 |
5.4 |
92,825 |
0.7 |
|
|
2030 |
12,842,466 |
1,433,303 |
11.2 |
782,899 |
6.1 |
132,727 |
1.0 |
|
UN |
||||||||
|
|
1990 |
10,564,857 |
925,692 |
8.8 |
474,510 |
4.5 |
35,717 |
0.3 |
|
|
2005 |
13,009,534 |
1,318,238 |
10.1 |
708,585 |
5.4 |
69,789 |
0.5 |
|
|
2015 |
13,804,252 |
1,443,927 |
10.5 |
846,788 |
6.1 |
94,154 |
0.7 |
|
|
2030 |
14,699,962 |
1,559,117 |
10.6 |
915,002 |
6.2 |
132,787 |
0.9 |
|
Countries affected by violent conflict (approximate start-end dates, estimated number of deaths where available) |
||||||||
|
Angola (conflict—1980-2002, 1.1 million) |
||||||||
|
Census |
||||||||
|
|
1990 |
8,290,856 |
863,766 |
10.4 |
348,563 |
4.2 |
14,854 |
0.2 |
|
|
2005 |
11,827,315 |
1,123,136 |
9.5 |
535,548 |
4.5 |
21,680 |
0.2 |
|
|
2015 |
14,655,105 |
1,400,587 |
9.6 |
614,873 |
4.2 |
33,557 |
0.2 |
|
|
2030 |
19,375,631 |
1,976,052 |
10.2 |
915,775 |
4.7 |
47,282 |
0.2 |
|
Country |
Total Population |
Population Age 50 and Over |
Population Age 60 and Over |
Population Age 80 and Over |
||||
|
Number |
Percentage |
Number |
Percentage |
Number |
Percentage |
|||
|
UN |
||||||||
|
|
1990 |
10,532,123 |
934,779 |
8.9 |
440,043 |
4.2 |
20,766 |
0.2 |
|
|
2005 |
15,941,392 |
1,332,437 |
8.4 |
628,394 |
3.9 |
36,601 |
0.2 |
|
|
2015 |
20,946,513 |
1,783,002 |
8.5 |
831,941 |
4.0 |
53,078 |
0.3 |
|
|
2030 |
30,049,775 |
2,752,104 |
9.2 |
1,318,818 |
4.4 |
87,641 |
0.3 |
|
Congo (Kinshasa) (conflict—1996-2003, 2.5 million) |
||||||||
|
Census |
||||||||
|
|
1990 |
39,064,041 |
3,536,186 |
9.1 |
1,652,198 |
4.2 |
101,560 |
0.3 |
|
|
2005 |
60,764,490 |
5,061,774 |
8.3 |
2,435,275 |
4.0 |
169,009 |
0.3 |
|
|
2015 |
82,030,429 |
6,551,088 |
8.0 |
3,219,551 |
3.9 |
250,680 |
0.3 |
|
|
2030 |
122,223,300 |
10,750,219 |
8.8 |
5,072,914 |
4.2 |
461,695 |
0.4 |
|
UN |
||||||||
|
|
1990 |
37,764,442 |
3,519,601 |
9.3 |
1,673,012 |
4.4 |
97,789 |
0.3 |
|
|
2005 |
57,548,744 |
4,985,882 |
8.7 |
2,453,022 |
4.3 |
158,931 |
0.3 |
|
|
2015 |
78,016,089 |
6,275,692 |
8.0 |
3,125,250 |
4.0 |
222,217 |
0.3 |
|
|
2030 |
117,493,959 |
9,786,515 |
8.3 |
4,616,225 |
3.9 |
372,096 |
0.3 |
|
Mozambique (conflict—1976-1992, 1 million) |
||||||||
|
Census |
||||||||
|
|
1990 |
12,655,732 |
1,153,393 |
9.1 |
494,735 |
3.9 |
22,496 |
0.2 |
|
|
2005 |
19,406,703 |
1,927,506 |
9.9 |
884,866 |
4.6 |
49,334 |
0.3 |
|
|
2015 |
21,731,142 |
2,237,793 |
10.3 |
1,089,297 |
5.0 |
73,623 |
0.3 |
|
|
2030 |
24,322,705 |
2,557,453 |
10.5 |
1,328,732 |
5.5 |
119,627 |
0.5 |
|
UN |
||||||||
|
|
1990 |
13,429,408 |
1,438,878 |
10.7 |
703,162 |
5.2 |
36,550 |
0.3 |
|
|
2005 |
19,792,295 |
2,020,773 |
10.2 |
1,026,078 |
5.2 |
73,491 |
0.4 |
|
|
2015 |
23,512,692 |
2,427,029 |
10.3 |
1,287,419 |
5.5 |
109,552 |
0.5 |
|
|
2030 |
29,603,641 |
3,138,367 |
10.6 |
1,703,205 |
5.8 |
178,798 |
0.6 |
|
Rwanda (conflict—1990-1994, 1 million) |
||||||||
|
Census |
||||||||
|
|
1990 |
6,923,738 |
596,714 |
8.6 |
304,205 |
4.4 |
17,831 |
0.3 |
|
|
2005 |
8,440,820 |
705,435 |
8.4 |
319,140 |
3.8 |
27,462 |
0.3 |
|
|
2015 |
10,687,704 |
994,796 |
9.3 |
446,765 |
4.2 |
36,168 |
0.3 |
|
|
2030 |
14,441,869 |
1,653,133 |
11.4 |
778,778 |
5.4 |
55,589 |
0.4 |
|
UN |
||||||||
|
|
1990 |
7,096,089 |
556,337 |
7.8 |
258,594 |
3.6 |
14,669 |
0.2 |
|
|
2005 |
9,037,690 |
737,815 |
8.2 |
356,014 |
3.9 |
23,354 |
0.3 |
|
|
2015 |
11,261,747 |
980,829 |
8.7 |
464,783 |
4.1 |
32,979 |
0.3 |
|
|
2030 |
14,367,933 |
1,542,229 |
10.7 |
733,961 |
5.1 |
56,673 |
0.4 |
|
Sierra Leone (conflict—1991-2002, 50,000) |
||||||||
|
Census |
||||||||
|
|
1990 |
4,220,883 |
471,635 |
11.2 |
214,460 |
5.1 |
17,430 |
0.4 |
|
|
2005 |
5,867,426 |
609,524 |
10.4 |
303,234 |
5.2 |
17,371 |
0.3 |
|
|
2015 |
7,367,438 |
676,494 |
9.2 |
355,074 |
4.8 |
23,563 |
0.3 |
|
|
2030 |
10,094,211 |
980,562 |
9.7 |
465,791 |
4.6 |
37,164 |
0.4 |
|
UN |
||||||||
|
|
1990 |
4,078,436 |
487,974 |
12.0 |
231,798 |
5.7 |
8,434 |
0.2 |
|
|
2005 |
5,525,478 |
626,839 |
11.3 |
303,550 |
5.5 |
13,463 |
0.2 |
|
|
2015 |
6,897,404 |
760,093 |
11.0 |
367,546 |
5.3 |
17,825 |
0.3 |
|
|
2030 |
9,649,911 |
1,062,311 |
11.0 |
528,521 |
5.5 |
28,856 |
0.3 |
|
Country |
Total Population |
Population Age 50 and Over |
Population Age 60 and Over |
Population Age 80 and Over |
||||
|
Number |
Percentage |
Number |
Percentage |
Number |
Percentage |
|||
|
Sudan (conflict—1983-2004, 2 million) |
||||||||
|
Census |
||||||||
|
|
1990 |
26,627,366 |
2,235,135 |
8.4 |
966,290 |
3.6 |
86,478 |
0.3 |
|
|
2005 |
40,187,486 |
3,677,107 |
9.1 |
1,643,233 |
4.1 |
81,263 |
0.2 |
|
|
2015 |
50,848,938 |
5,155,041 |
10.1 |
2,479,011 |
4.9 |
136,234 |
0.3 |
|
|
2030 |
66,346,176 |
9,302,769 |
14.0 |
4,454,353 |
6.7 |
361,476 |
0.5 |
|
UN |
||||||||
|
|
1990 |
26,066,123 |
2,659,892 |
10.2 |
1,270,552 |
4.9 |
74,536 |
0.3 |
|
|
2005 |
36,232,945 |
4,127,418 |
11.4 |
2,047,024 |
5.6 |
153,513 |
0.4 |
|
|
2015 |
44,035,008 |
5,665,452 |
12.9 |
2,870,760 |
6.5 |
240,413 |
0.5 |
|
|
2030 |
54,511,049 |
9,007,892 |
16.5 |
4,650,247 |
8.5 |
451,380 |
0.8 |
|
SOURCES: U.S. Census Bureau (2005); United Nations (2005); Zaba, Marston, and Floyd (2003); Smith (2003); U.S. Central Intelligence Agency (2004); Leitenberg (2003). |
||||||||
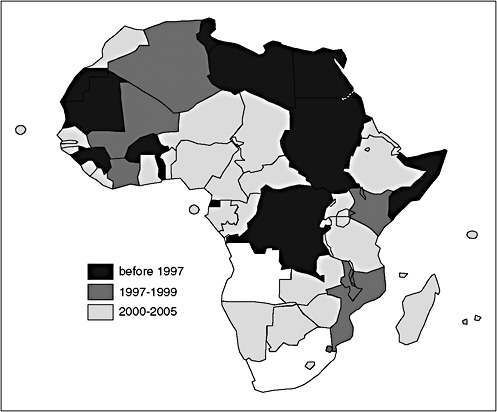
FIGURE 2-17 Most recent census dates.
SOURCE: U.S. Census Bureau (2005).
data collection for each country. While censuses provide invaluable data, they have the disadvantage of long time periods between rounds and time lags (sometimes significant) between data collection and data availability. Some sub-Saharan countries have data from a recent census (taken less than five years ago). However, others have postponed censuses from 2000 out to 2005 or later. Although certain countries took censuses near 2000, the data are not always available for use until much later (e.g., Senegal took their census in 2002 but the data have not yet been released).
Other data sources, such as vital registration data, demographic surveillance sites, and national surveys are also used as input data. However, many of these other sources have limitations, particularly for the countries of sub-Saharan Africa. Vital registration systems with high coverage are uncommon in most countries in sub-Saharan Africa. Where they do exist, coverage is variable (the World Health Organization has data from only
nine countries in sub-Saharan Africa, with coverage rates ranging from 5 percent in Mozambique to 99 percent in the Seychelles) (Kowal, Rao, and Mathers, 2003). Thus, vital registration data that can be used as input data for projections are not available for use in most projections of sub-Saharan populations.
Another source of input data is national demographic surveys, such as the Demographic and Health Surveys (DHS). These surveys are often conducted more frequently than censuses and produce high-quality data for estimations of fertility and infant and child mortality, but they do not provide adult mortality estimates. Typically, infant and child mortality estimates derived from DHS data are matched to model life tables to produce estimates of adult mortality patterns. However, given that the model life tables available were developed before the onset of the HIV/AIDS epidemic, they cannot be used without major adjustments to take into account the impact of AIDS deaths.
Demographic surveillance field sites, such as those in INDEPTH, potentially provide high-quality data; however, the data are not typically nationally representative.4 Data from demographic surveillance sites have not been used by the Census Bureau or the UN in the estimates and projections discussed in this paper.
Migration data are derived from various sources, including the UN (the United Nations High Commission for Refugees, the United Nations Statistics Division, and the United Nations Economic Commission for Europe Statistics Division) and the International Organization for Migration. Migration data are notoriously difficult to obtain and available data are generally considered to be unreliable. The political will throughout Africa to address migration policies and to obtain these data is improving, yet the realities of current data collection systems suggest that improvements will take time (African Union Commission, 2004). Data on forced, internal, and international migration are fraught with problems. Cross-border migration and internal displacement continue to create migration flows that remain difficult to track as the frequency, timing, and duration of migration patterns are subject to rapidly changing factors, such as household disintegration due to HIV/AIDS, economic forces driven by globalization, and natural and manmade disasters, many of which disproportionately affect countries in this region.
In addition, new migration patterns have developed as a result of AIDS, countering the urbanization trends: adult children “going home to die,” moving from urban areas to rural homes, to be cared for by their parents
and families (Foster, 1995). AIDS deaths are contributing to the disintegration of households, resulting in orphaned children being forced to relocate, and usually to poor areas (Richter, 2004).
Both the Census Bureau and the UN use data on HIV/AIDS prevalence rates provided by the Joint United Nations Programme on HIV/AIDS (UNAIDS) and World Health Organization (WHO) Epidemiology Reference Group (Joint United Nations Programme on HIV/AIDS and World Health Organization, 2004a). These prevalence rates are based on the best available data from different national sources, including antenatal clinic surveillance sites and national surveys. Both organizations used the UNAIDS 2004 release of HIV prevalence rates in their projections. The prevalence rates that underlie the mortality assumptions for both the Census Bureau and the UN projections are presented in Table 2-5. The characteristics and impact of HIV/AIDS vary throughout the subcontinent, which affects the magnitude and timing of their effects on demographic estimates and projections.
In general, UNAIDS divides the magnitude of the infection into three states: (1) generalized, defined as HIV prevalence consistently over 1 percent in pregnant women; (2) concentrated, defined as HIV prevalence consistently over 5 percent in at least one subpopulation at highest risk and prevalence below 1 percent in the general adult population ages 15 to 49 in urban areas; and (3) low, defined as HIV prevalence has not consistently exceeded 5 percent in any defined subpopulation (Joint United Nations Programme on HIV/AIDS and World Health Organization, 2003).
Fertility Assumptions
Historically, declines in fertility have been the main determinant of population aging in developing countries. Countries that have experienced rapid declines in fertility have also experienced rapid increases in aging (for example, South Korea and Thailand). Fertility rates for most countries in sub-Saharan Africa are still high. In many, fertility is declining slowly, which contributes to the relatively slow rate of population aging in the region (United Nations, 2003a). Future trends in fertility will affect the way that countries in the region will age.
According to Census Bureau estimates, sub-Saharan African countries accounted for 8 of the top 10 highest fertility rates in the world in 2005. Niger and Mali had the two highest total fertility rates in the world, at more than 7 births per woman, and Somalia’s estimated total fertility rate was 6.8. Only three countries in the subregion (Botswana, Mauritius, and South Africa) had total fertility rates below 3.0 children per women, and only Mauritius had a total fertility rate below the replacement level fertility of 2.1.
TABLE 2-5 Prevalence Rates for Sub-Saharan Africa HIV Adults Ages 15 to 49 from the Joint United Nations Programme on HIV/AIDS: End of 2003
|
|
Adult Prevalence (%) |
(Low Estimate and High Estimate) |
|
Sub-Saharan Africa |
7.5 |
[6.9 - 8.3] |
|
Angola |
3.9 |
[1.6 - 9.4] |
|
Benin |
1.9 |
[1.1 - 3.3] |
|
Botswana |
37.3 |
[35.5 - 39.1] |
|
Burkina Faso |
4.2 |
[2.7 - 6.5] |
|
Burundi |
6.0 |
[4.1 - 8.8] |
|
Cameroon |
6.9 |
[4.8 - 9.8] |
|
Central African Republic |
13.5 |
[8.3 - 21.2] |
|
Chad |
4.8 |
[3.1 - 7.2] |
|
Congo (Brazzaville) |
4.9 |
[2.1 - 11.0] |
|
Congo (Kinshasa) |
4.2 |
[1.7 - 9.9] |
|
Côte d’Ivoire |
7.0 |
[4.9 - 10.0] |
|
Djibouti |
2.9 |
[0.7 - 7.5] |
|
Eritrea |
2.7 |
[0.9 - 7.3] |
|
Ethiopia |
4.4 |
[2.8 - 6.7] |
|
Gabon |
8.1 |
[4.1 - 15.3] |
|
Gambia |
1.2 |
[0.3 - 4.2] |
|
Ghana |
3.1 |
[1.9 - 5.0] |
|
Guinea |
3.2 |
[1.2 - 8.2] |
|
Kenya |
6.7 |
[4.7 - 9.6] |
|
Lesotho |
28.9 |
[26.3 - 31.7] |
|
Liberia |
5.9 |
[2.7 - 12.4] |
|
Madagascar |
1.7 |
[0.8 - 2.7] |
|
Malawi |
14.2 |
[11.3 - 17.7] |
|
Mali |
1.9 |
[0.6 - 5.9] |
|
Mauritania |
0.6 |
[0.3 - 1.1] |
|
Mozambique |
12.2 |
[9.4 - 15.7] |
|
Namibia |
21.3 |
[18.2 - 24.7] |
|
Niger |
1.2 |
[0.7 - 2.3] |
|
Nigeria |
5.4 |
[3.6 - 8.0] |
|
Rwanda |
5.1 |
[3.4 - 7.6] |
|
Senegal |
0.8 |
[0.4 - 1.7] |
|
South Africa |
21.5 |
[18.5 - 24.9] |
|
Swaziland |
38.8 |
[37.2 - 40.4] |
|
Togo |
4.1 |
[2.7 - 6.4] |
|
Uganda |
4.1 |
[2.8 - 6.6] |
|
Tanzania |
8.8 |
[6.4 - 11.9] |
|
Zambia |
16.5 |
[13.5 - 20.0] |
|
Zimbabwe |
24.6 |
[21.7 - 27.8] |
|
SOURCES: Joint United Nations Programme on HIV/AIDS and World Health Organization (2004b). |
||
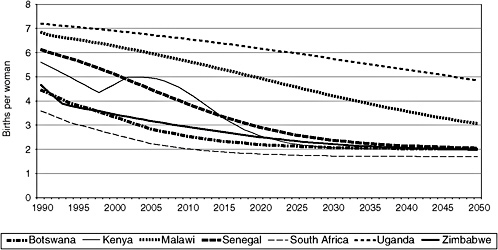
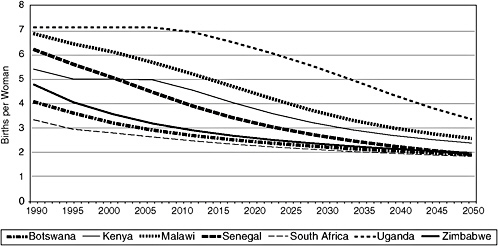
Fertility rates used in the estimates are derived from census and national household survey data. For its projections, the Census Bureau takes trends in observed fertility rates for a country and calculates the decline in the future based on a logistic function. The UN assumes that fertility decline follows a path derived from models of fertility decline that it has established on the basis of the past experiences of countries with declining fertility during the period 1950 to 2000 (United Nations, 2005). Projected fertility is compared with recent fertility trends in each country and adjusted so that the projected fertility is consistent with the most recent fertility trends. Projected fertility rates for a number of sub-Saharan countries are shown in Figures 2-18a (Census Bureau) and 2-18b (UN). Both the Census Bureau and the UN project fertility to decrease in all of the countries of sub-Saharan Africa between 2005 and 2030; however, the size of the decrease differs. The Census Bureau projects that fertility will be at or below replacement level in only five countries in sub-Saharan Africa by 2030, and the UN projects that two countries will be at or below replacement by this date. The total fertility rate in 2030 is projected to remain above 4 children per woman in 15 of the 42 countries, according to the Census Bureau. These relatively high fertility rates ensure that the proportion in the older ages will remain fairly low in many sub-Saharan African countries well into the future.
It is unclear how fertility rates will be affected by HIV/AIDS, but at the individual level, as the time infected increases, pregnancy rates drop. Overall, the most likely result is that an HIV epidemic will slightly reduce fertility, but at this point the data are not available to make reasonable assumptions about the impact (Stover and Stanecki, 2003).
Mortality Assumptions
Although declines in fertility have historically been the driving force behind population aging in the countries of sub-Saharan Africa, mortality contributes to population aging, especially in countries highly affected by AIDS. The impact of AIDS has been so large in many of these sub-Saharan countries that it will significantly affect how their populations age.
In countries with AIDS mortality, the impact is seen clearly in mortality rates for the adult age groups. These groups are projected to have high mortality rates when AIDS mortality is incorporated into the projections.
The mortality rates are adjusted on the basis of HIV prevalence rates. The adult HIV prevalence rate for the countries in sub-Saharan Africa ranges from 0.6 in Mauritania to 38.8 in Swaziland (see Table 2-5) (Joint United Nations Programme on HIV/AIDS and World Health Organization,
2004a).5 These figures are based on HIV prevalence in women attending antenatal clinics, from which assumptions about infection rates are applied to derive rates for the general population (Joint United Nations Programme on HIV/AIDS, 2004). Despite the limitations and without a functioning vital registration system or representative national-level surveys, prevalence rates derived from antenatal clinic data provide the best source of routinely collected information currently available.6
The Census Bureau incorporated AIDS mortality in 54 countries into their 2005 International Data Base. Of these 54 countries, 39 were in sub-Saharan Africa. The Census Bureau obtained estimates of AIDS-related mortality using a new application that incorporates estimates of HIV prevalence from the Estimation and Projection Package (EPP)—an epidemiologically realistic model developed and used by the WHO and UNAIDS. EPP produces a national “best fit” curve of adult HIV prevalence using sentinel surveillance data pertaining to pregnant women. The Census Bureau used country-specific adult HIV prevalence estimates from EPP for years from the beginning of the epidemic to 2010. The Census Bureau applied assumptions from the WHO/UNAIDS Epidemiological Reference Group about the age and sex distribution of HIV incidence, sex ratios of new infections, mother-to-child transmission rate, and disease progression. The model allows for competing risk of death and projects HIV incidence implied by the EPP estimates of HIV prevalence through 2010, assuming a decline in HIV incidence of 50 percent by 2050. The model can include the impact of antiretroviral therapy, but the current projections assume no one will receive treatment (U.S. Census Bureau, 2005).
In its 2004 revision, the UN Population Division increased the total number of countries with substantial excess deaths caused by HIV/AIDS to 60; of these 60 countries, 40 are located in sub-Saharan Africa (United Nations, 2005). A slow pace of mortality decline in countries highly affected by the AIDS epidemic was used for mortality risk not related to HIV/ AIDS. For countries not considered “most affected” by HIV/AIDS, mortality is projected based on models of changing life expectancy produced by the UN.
Infection prevalence data from models created by UNAIDS were used
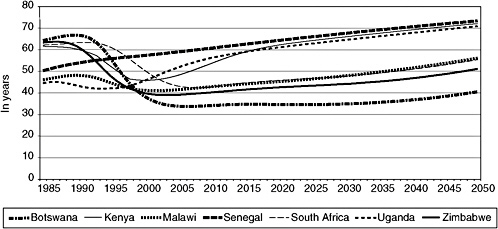
FIGURE 2-19a Life expectancy at birth in selected sub-Saharan African countries: 1990 to 2050 (U.S. Census Bureau data). SOURCE: U.S. Census Bureau (2005).
to estimate past dynamics and create projections for annual incidences of HIV infection. The 2004 UN revision projects the impact of HIV/AIDS to be less severe than was previously forecast in the 2002 revision. This difference is due to the revised and lower estimates of HIV prevalence in several countries (based on UNAIDS data for 2003) (United Nations, 2005; Joint United Nations Programme on HIV/AIDS, 2004). Also in the 2004 revision, the UN has assumed that beginning in 2005 changes in behavior and treatment will reduce the chances of infection in the future.
Both the Census Bureau and the UN project that life expectancy at birth will continue to decline for countries in which AIDS mortality is present (see Figures 2-19a and 2-19b). However, life expectancy at birth is projected to increase in most countries beginning some time after 2010.
CONCLUSION
Accurate statistics on basic demographic events are the foundation of rational health and public policy, yet many countries lack sound demographic information. In particular, data on both the number and causes of death in sub-Saharan African countries are virtually nonexistent. Reliable adult mortality data on levels, let alone causes, simply do not exist for the majority of the countries in sub-Saharan Africa. Mortality estimates are modeled from limited sources of data, such as surveys, censuses, and demographic surveillance sites (in the small number of countries where they exist). Currently there is a paucity of high-quality country-level data on mor-
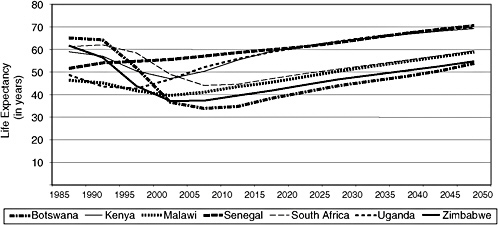
FIGURE 2-19b Life expectancy at birth in selected sub-Saharan African countries: 1990 to 2050 (UN data).
SOURCE: United Nations (2005).
tality for the sub-Saharan countries, and this has an impact on population estimates and projections. Efforts are currently under way to improve the collection of demographic data in many sub-Saharan countries, which will improve the future projections and assist in elucidating how these countries will age in the future.
The impact of HIV/AIDS on adult mortality rates in sub-Saharan Africa has reshaped the population structure and age distribution in most countries. Approximately 2.3 million people died of AIDS in 2004 (Joint United Nations Programme on HIV/AIDS, 2004). By the year 2020, it is projected that a total of 75 million Africans will have lost their lives to AIDS since the beginning of the epidemic. The impact of AIDS dramatically affects how countries in sub-Saharan Africa will age over the next several decades. Despite the huge impact of AIDS, sub-Saharan Africa is aging and will continue to age. The number of older people is projected to nearly double in less than 30 years. These growing numbers of older people will age in countries that are ill equipped to deal with the challenges that aging populations pose.
Explanation of Acronyms/Abbreviations
AIDS Acquired Immunodeficiency Syndrome
HIV Human Immunodeficiency Virus
HMN Health Metrics Network
INDEPTH An international network of field sites with continuous demographic evaluation of populations and their health in developing countries
IOM International Organization of Migration
SAVVY Sample Vital Registration and Verbal Autopsy
UN United Nations Population Division
UNECE United Nations Economic Commission for Europe Statistics Division
UNHCR United Nations High Commission for Refugees
UNSD United Nations Statistics Division
UNAIDS Joint United Nations Programme on HIV/AIDS
USCB U.S. Census Bureau
WHO World Health Organization
REFERENCES
African Union Commission. (2004, March). Experts Group Meeting on the Policy Framework on Migration in Africa, Addis Ababa, Ethiopia. Opening speech by Adv. Bience Gawanas, African Union Commissioner for Social Affairs.
Foster, S.A. (1995). A study of adult diseases in Zambia: Final report. London, England: Overseas Development Agency.
Joint United Nations Programme on HIV/AIDS. (2004). 2004 report on the global AIDS epidemic. Executive Summary. Geneva, Switzerland: Author.
Joint United Nations Programme on HIV/AIDS and World Health Organization. (2003, September). A history of the HIV/AIDS epidemic with emphasis on Africa. Training Workshop on HIV/AIDS and Adult Mortality in Developing Countries. New York: United Nations.
Joint United Nations Programme on HIV/AIDS and World Health Organization. (2004a, December). AIDS epidemic update. UNAIDS/04.45E.
Joint United Nations Programme on HIV/AIDS and World Health Organization. (2004b, December). Technical report on improving estimates and projections of HIV/AIDS. Based on a meeting of the UNAIDS/WHO Reference Group for Estimates, Modelling, and Projections, Sintra, Portugal. Geneva, Switzerland: Author.
Kowal, P.R., Rao, P.V.C., and Mathers, C. (2003). Report on a WHO workshop: Minimum data set on ageing and adult mortality data in Sub-Saharan Africa. Geneva, Switzerland: World Health Organization.
Leitenberg, M. (2003). Death in wars and conflicts between 1945-2000. New York: Cornell University. Peace Studies Program.
Richter, L.M. (2004, May). The impact of HIV/AIDS on the development of children. Presented at the Seminar on HIV/AIDS, Vulnerability, and Children: Dynamics and Long-term Implications for Southern Africa’s Security, 4 April, 2003, Pretoria. Institute for Security Studies monograph no. 109.
Smith D. (2003). The atlas of war and peace. New York: Penguin Putnam.
Stover, J., and Stanecki, K.A. (2003). Estimating and projecting the size and impact of the HIV/AIDS epidemic in generalized epidemics: The UNAIDS Reference Group approach. Geneva, Switzerland: Joint United Nations Programme on HIV/AIDS.
United Nations. (2001). World population prospects: The 2000 revision. New York: Author.
United Nations. (2003a). The impact of HIV/AIDS on mortality. (Workshop on HIV/AIDS and Adult Mortality in Developing Countries. UN/POP/MORT/2003/14). New York: Author.
United Nations. (2003b). World population prospects: The 2002 revision. New York: Author.
United Nations. (2005). World population prospects: The 2004 revision. (ESA/P/WP.193). New York: Author.
U.S. Census Bureau. (2004). The AIDS pandemic in the 21st century. (International Population Reports No. WP/02-2, available from the U.S. Government Printing Office). Washington, DC: U.S. Department of Commerce.
U.S. Census Bureau. (2005). International programs center, international database. Available: http://www.cia.gov/cia/publications/factbook/ [accessed August 2006].
U.S. Central Intelligence Agency. (2004). The world fact book. Available: http://www.census.gov/ipc/wwf [accessed Sept. 2006].
Zaba, B., Marston, M., and Floyd S. (2003). The effect of HIV on child mortality trends in sub-Saharan Africa. Presented at the Training Workshop on HIV/AIDS and Adult Mortality in Developing Countries, Population Division, Department of Economic and Social Affairs, United Nations Secretariat, September 8-13, New York.


