
2
EXPOSURES IN THE PERSIAN GULF
The purpose of this chapter is to summarize in a general way what is known about the many exposures that might have been present in the Gulf War Theater and to discuss the effect of exposure information on the interpretation of human health outcomes in the available studies of Gulf War veterans. The committee does not draw conclusions about the association between specific exposures in the gulf and health outcomes. In general, three main types of studies are reviewed in this chapter: major cohort studies that typically assessed exposures with questionnaires administered to study subjects, simulation studies to assess the potential magnitude of exposures encountered under specific circumstances, and environmental fate and transport models that were then used in epidemiologic analyses (in some cases, incorporating information from simulation studies). In addition, some exposures—specifically, exposures to depleted uranium compounds—were assessed primarily with biologic monitoring.
The rarity of direct assessment of exposure critically hinders evaluation of the potential health effects of specific exposures. There have been detailed and laudable efforts to simulate and model exposures, but they are hampered by the lack of input data required to link exposure scenarios to specific people or even specific units or job categories. One can confidently compare health responses only between deployment in the theater and nondeployment or deployment elsewhere. To move beyond the current state requires that more-detailed information be gathered during future military deployments. Specifically, a job-task-unit-exposure matrix in which information on people with specific jobs or tasks or attached to specific units (typically available from routinely collected records) is linked to exposures through expert assessment or simulation studies would enable quantitative assessment of the effects of specific exposures.
EXPOSURE ASSESSMENT IN EPIDEMIOLOGIC STUDIES
As described in more detail in later chapters, most of the Gulf War literature is based on veterans’ reports of their own exposures. In addition, many studies report the prevalence of specific health outcomes or clusters of outcomes among Gulf War veterans; those studies might or might not compare prevalence with that of control groups.
STUDIES ASSESSING EXPOSURES WITH QUESTIONNAIRES
Gulf War epidemiologic studies that assess exposures with questionnaires administered to study subjects typically rely on self-reports of exposure and are generally considered to be
subject to recall or reporting bias (see Chapter 3) even when objective measures of health status are collected. The potential for bias is increased in studies in which both exposure and health-outcome information is based on self-reports. The use of self-reported exposure information was unavoidable in most Gulf War literature, but a number of attempts have been made to compare self-reported exposures with other estimates of exposure. Although such alternative estimates might appear to be more objective, for most comparisons between self-reported exposure and other measures there is no “gold standard” of exposure. Accordingly, the studies simply report on comparisons of different estimates of exposure rather than provide an objective assessment of the validity of self-reports. Exceptions might include exposure to vaccinations, for which records are available, and exposure to depleted uranium (DU), which can be verified with biologic monitoring. The following sections describe comparisons between self-reported and other measures of exposure.
Exposure to Oil-Well Fire Smoke
A number of studies have, at least indirectly, examined the validity of self-reported exposures. With respect to the oil-well fires, Lange et al. (2002) reported moderate correlations (r = 0.4 and 0.5) between self-reports of low and high exposures to oil-fire smoke as assessed with a dispersion model linked to troop-unit location information. At each level of self-reported exposure (based on the number of days exposed), the modeled exposures were highly variable. Cowan et al. (2002) reported a low interclass correlation coefficient (kappa) of 0.13 for self-reported exposure to oil-fire smoke vs cumulative modeled exposure (according to the model used by Lange et al.) to oil-fire smoke or days with high modeled exposure. Wolfe et al. (2002) reported that responses to a yes-no question regarding oil-fire exposure in the Fort Devens cohort did not correlate well with modeled particle exposures. Higher correlations were found when information regarding the self-reported frequency, duration, and intensity of exposure was considered.
Exposure to Vaccination
The strongest analysis of reporting bias with regard to vaccine exposure was conducted by Mahan et al. (2004) in their study of anthrax vaccination. Veterans were asked whether they received anthrax vaccination or were uncertain about receiving it. In a cohort of 11,441 Gulf War veterans who completed a health and exposure survey, 352 respondents also were on a Department of Defense (DOD) list of 7,691 people who were vaccinated at least once. The list was compiled from several sources and is the largest compilation of Gulf War veterans identified as receiving anthrax vaccination. In the full cohort, 4,601 (40%) reported receiving the vaccine, 2,979 (26%) reported not receiving it, and 3,861 (34%) were uncertain. Of the subset of 352 who were on the DOD vaccination list, 260 (74%) reported receiving the vaccine, 34 (10%) reported not having received it, and 58 (16%) reported that they were uncertain. This comparison indicates a 26% false-negative rate, but the lack of a documented “nonvaccinated” group makes it impossible to determine the false-positive rate. The study also provides some evidence of reporting bias.
Although immunization history was self-reported in most studies, Unwin et al. (1999) asked survey respondents to refer to their own vaccination records, if available, in a study of UK veterans deployed to the gulf compared with those deployed to Bosnia or other Gulf-War-era veterans. Some 32% of the Gulf War veterans in the survey reported that they had vaccination
records, and confirmation by the investigators suggested that those with records had used them when completing the questionnaire. Only 2.8% of veterans without records reported receiving pertussis vaccination despite the fact that the anthrax and pertussis vaccines were always administered simultaneously. Of those with records, 36% reported receiving pertussis vaccination. Reporting of biologic-warfare vaccinations (for example, anthrax, plague, and pertussis) was associated with “CDC syndrome” (that is, Centers for Disease Control and Prevention multisymptom syndrome), irrespective of the use of records. However, an association of routine vaccinations (for example, hepatitis, typhoid, and cholera) with CDC syndrome was present only in those who did not use their records. The analysis, therefore, provides some evidence of bias with regard to self-reporting of vaccinations.
The investigators limited a later analysis focused on the same cohort to the subset of personnel who had vaccination records (Hotopf et al. 2000). That analysis concluded that multiple vaccinations received during deployment (but not multiple vaccinations received before deployment) were associated with symptom clusters.
Kelsall et al. (2004a) specifically asked Australian Gulf War veterans to refer to their own immunization booklets for information regarding the number and timing of immunizations relative to their Gulf War deployment. Although data were not provided in the paper, the authors report that the 52% of the 1,418 survey respondents who had immunization booklets reported higher total numbers of immunizations than those without booklets and were less likely to report not having received any immunizations. That suggests a general pattern of underreporting of exposures among veterans who provided self-reported vaccination information. The paper does not provide specific information on the types of immunizations reported, nor does it evaluate any potential bias regarding the source of vaccination records and the reporting of health outcomes.
Exposure to Pyridostigmine Bromide
Pyridostigmine bromide (PB) is a drug that was used during the Gulf War as a pretreatment to prevent the harmful effects of nerve agents because of its ability to reversibly bind to acetylcholinesterase (AChE).1 The bound fraction is thereby protected from exposure to nerve agents that would irreversibly bind to AChE. PB is not an antidote (it has no value when administered after nerve-agent exposure) and is not a substitute for atropine or 2-pralidoxime chloride; rather, it enhances their efficacy (Madsen 1998).
DOD reported that 5,328,710 doses were fielded and estimated that about 250,000 personnel took at least some PB during the Gulf War.2 It was supplied in a 21-tablet blister pack; the dosage prescribed was one 30-mg tablet every 8 hours. Each pack provided a 1-week supply of PB for one person, and military personnel were issued two blister packs each. Recommended long-term storage was at 2-80°C, and blister packs removed from refrigeration were to be used
within 6 months (Madsen 1998). Variation in use occurred, however, because it was self-administered and was to be taken only on orders of a unit commander (PAC 1996b).
Keeler and colleagues (1991) conducted an uncontrolled retrospective survey of the medical officers of the XVIII Airborne Corps. The unit’s 41,650 soldiers were instructed to take PB at the onset of Operation Desert Storm in January 1991. Use varied from one to 21 tablets taken over 1-7 days; 34,000 soldiers reported taking the medication for 6-7 days. Reported side effects of PB were estimated to have been present in half the troops; they were not incapacitating, however, and were primarily gastrointestinal. An estimated 1% of the soldiers believed that they had symptoms that warranted medical attention, but less than 0.1% had effects sufficient to warrant discontinuation of the drug (Keeler et al. 1991; Schumm et al. 2002). Although the prescribed PB dosage was three tablets per day, the veterans reported varied compliance with this regime: only 24% took the tablets in accordance with the directions that were supposed to have been given, 6% of those who reported the number of tablets per day indicated that they took six or more per day (twice the recommended number), and 61% took only one or two pills per day (below the recommended number).
Other papers reviewed included only general self-reports of PB consumption (for example, yes or no for PB consumption) or total numbers of tablets consumed during service; therefore, it is not possible to assess dosage or compliance with directions. As with many of the exposures, there were no data available for comparison between self-reported exposure and an objective measure of PB exposure. The Schumm et al. (2002) report described above, however, does suggest a strong possibility of dosages that were higher and lower than the recommended amounts.
Exposure to Depleted Uranium
The validity of self-reported exposure to DU can be evaluated on the basis of measurement of urinary uranium. Uranium activity decreases over time, but it has a very long radiologic half-life (4.5 x10⁹ years for U-238), so those with high exposures can be identified many years later. High urinary uranium is presumed to result from continuing mobilization of DU from metal fragments that oxidize in situ (McDiarmid et al. 2004a). As discussed in detail later in this chapter, although many veterans reported a potential for DU exposure, only those with retained DU-containing shrapnel had high urinary uranium. For example, 9-11 years after “exposure”, high DU in urine was present in only six of 446 people in the Department of Veterans Affairs DU surveillance program, and all six individuals had embedded shrapnel (McDiarmid et al. 2004b). It should be recognized, however, that at the time of many of the large Gulf War cohort surveys, the potential for DU exposure (for example, involvement in a friendly-fire incident, rescue where DU-containing munitions or vehicles were used, or presence during a fire at Camp Doha, Kuwait, that involved detonation and burning of DU-containing munitions) was not as well understood as it is now. Consequently, veterans who reported their own DU exposure were working with the best available information and reported that they were exposed, whereas it is now understood that retention of DU-containing embedded shrapnel is the major source of increased DU exposure in military personnel. Furthermore, some people might have inhaled and cleared DU-containing particles or might have had embedded DU-containing shrapnel that was later removed; therefore, they would not have increased urinary uranium even though they had been exposed at least briefly. That exposure cannot be measured objectively, but there is a possibility that such exposures were linked with acute or later health effects.
GENERAL COHORT STUDIES (PREVALENCE STUDIES)
As discussed above, most studies rely on self-reported exposures for which validation is not possible. Some of them simply report on the prevalence of self-reported exposures, and others compare self-reported exposures with exposures of control groups (that is, nondeployed veterans or veterans deployed elsewhere, such as in Bosnia). For example, Kroenke et al. (1998), in their study of 18,495 veterans involved in the DOD Comprehensive Clinical Evaluation Program, indicate self-reported exposures to “fuel” in 89% of respondents, to tent heaters in 73%, to oil-fire smoke in 72%, and to DU in 16%. Similarly, Proctor (1998) describes self-reported exposures to a variety of agents (number who were exposed and number who were exposed and felt sick at the time of exposure) and includes measures on the Expanded Combat Exposure Scale regarding exposure to chemical- and biologic-warfare agents. Exposures to anti-nerve-gas pills, pesticides, Scud debris, chemical- and biologic-warfare agents, oil-fire smoke, vehicle exhaust, smoke from tent heaters, and smoke from burning human waste were all considered. Relatively high exposure prevalence was reported for all those agents except pesticides and chemical- and biologic-warfare agents. Cherry et al. (2001) describe the prevalence of self-reported exposures among the UK cohort (n = 7,971). Questionnaire results on 14 specific exposures are summarized after stratification by type of military service (Army, Navy, and Air Force). Overall, 30% reported more than six inoculations, 61% reported exposure to oil-fire smoke, 60% used nerve-agent prophylaxis for more than 14 days, and only 7% reported handling pesticides. Those studies clearly indicate that a high frequency of Gulf War veterans report a large number of exposures but provide little information regarding the validity or magnitude of the exposures.
Studies that compared self-reported exposure frequencies with exposure of control groups are more informative. For example, in their study of 527 active-duty Gulf War veterans and 970 nondeployed Seabees, Gray et al. (1999a) provide comparisons of multiple exposures between those deployed in the Gulf War and those not deployed. Many kinds of exposures were compared, and many were higher in deployed Gulf War veterans. For example, there were 2.3 times more diesel exposure, 3.8 times more tent-heater exposure, 2.5 times more DU exposure, and 117 times more oil-fire exposure in the deployed than in the nondeployed.
Unwin et al. (1999) conducted a cross-sectional postal survey of a random sample of veterans deployed in the Gulf War and of veterans deployed in Bosnia and veterans deployed in places other than the Persian Gulf during the Gulf War era (that is, military personnel who served during the period of the Gulf War but were not deployed in the gulf) to determine whether there was a relationship between ill health and self-reported exposures. Of 16 kinds of exposures assessed, all except exposure to dead animals and exhaust from heaters or generators were more frequent in the Gulf War-deployed cohort than in the control groups. More than 70% of the Gulf War-deployed cohort reported exposure to oil-fire smoke, to exhaust from heaters or generators, and to the sound of chemical alarms, and over 80% reported exposure to PB, NBC (nuclear, biologic, chemical) suits, and to diesel or petrochemical fumes.
STUDIES USING SIMULATION TO ASSESS THE POTENTIAL MAGNITUDE OF EXPOSURES
Simulation studies were used to assess the potential magnitude of exposures encountered under specific circumstances. In some cases, the simulations were later incorporated into fate and transport models.
Tent Heaters
Tent heaters are used to heat tents and other semienclosed environments. Tent heaters, whether vented to the outside or unvented, produce potentially dangerous chemicals as a result of combustion. Carbon monoxide (CO) is the most hazardous byproduct of combustion. Fuels, primarily kerosene-based aviation fuel, were used in the gulf for heaters, cooking stoves, and portable generators. The fumes and exhaust produced by those fuels, particularly when used in unventilated tents, might have exposed people to benzene, toluene, xylene, ethyl benzene, and combustion products, including CO, sulfur dioxide (SO2), carbon dioxide (CO2), nitrogen dioxide (NO2), particulate matter (PM), lead, and other pollutants.
Cheng et al. (2001) performed simulation studies to measure emissions associated with tent heaters that used different fuel types. High concentrations were measured when tent doors were closed (air-exchange rates in this situation were 1.0-1.4 hr–1), and concentrations were below the limits of detection when tent doors were open. Kerosene heaters were associated with higher concentrations of combustion products (Cheng 1999). Concentrations of PM10-containing organic carbon, elemental carbon (soot), sulfate, and ammonium were as high as 850 μg/m3. In comparison, under the National Ambient Air Quality Standards, the US Environmental Protection Agency has set a standard of 150 μg/m3 for PM10. That is a 24-hour standard that is not to be exceeded more than once a year (US Environmental Protection Agency 2006).
Many of the prevalence studies list self-reported exposures to tent-heater emissions, but there is no specification of heater or fuel types or of whether tent flaps were typically open or closed, so it is not possible to determine the magnitude of exposures. Given that the simulation studies demonstrate the potential for high exposures to combustion products (some of which are similar to those in the oil-fire smoke plume), exposures to tent-heater emissions could modify or potentially confound the assessment of associations between oil-well fire smoke exposure and respiratory outcomes.
Khamisiyah Demolition and Potential Exposure to Sarin and Cyclosarin
During a cease-fire period in March 1991, troops from the US 37th and 307th engineering battalions destroyed enemy munitions throughout the occupied areas of southern Iraq (PAC 1996a). A large storage complex at Khamisiyah, Iraq, which contained more than 100 bunkers, was destroyed. Two sites in the complex—one of the bunkers and another site called the pit—contained stacks of 122-mm rockets loaded with sarin and cyclosarin (Committee on Veterans Affairs 1998). According to estimates, 371 kg of sarin and cyclosarin combined was released (Winkenwerder 2002). US troops performing demolitions were unaware of the presence of nerve agents because their detectors, sensitive only to lethal or near-lethal concentrations of nerve agents (CDC 1999), did not sound any alarms before demolition. It was not until October 1991 that inspectors from the UN Special Commission (UNSCOM) confirmed the presence of a mixture of sarin and cyclosarin at Khamisiyah (Committee on Veterans Affairs 1998).
No air monitoring was conducted at the time of the Khamisiyah demolition. At the request of the Presidential Advisory Committee, Robert Walpole, of the Central Intelligence Agency (CIA), and Bernard Rostker, of DOD, used models to estimate ground-level concentrations of sarin and cyclosarin as a function of distance and direction from the detonation sites and then to estimate the extent of potential exposure of US military personnel to the nerve agents (PAC 1996a). The models produced a series of geographic maps of the Khamisiyah area that overlay known troop-unit locations with the projected path of the sarin–cyclosarin plume. Initially, however, because of the complexity of the modeling that needed to be done, CIA-DOD estimated that any noticeable effects of sarin and cyclosarin would possibly have been seen within 25 km of the demolition site. The CIA-DOD report estimated, on the basis of troop locations, that about 10,000 US troops had been within 25 km and thus might have been exposed to sarin or cyclosarin over a period of hours (CIA-DOD 1997). Given the uncertainties in that estimate, CIA-DOD doubled the distance and, again on the basis of unit locations, estimated that roughly 20,000 troops were within 50 km. In 1997, DOD mailed a survey to the 20,000 troops who might have been within 50 km of Khamisiyah; of the 7,400 respondents, more than 99% reported no acute effects that could be correlated with exposure to sarin or cyclosarin (CIA-DOD 1997). The survey was attached to a letter from the secretary of veterans affairs indicating that chemical weapons had been present at Khamisiyah at the time of the demolition. The letter also urged survey recipients to call the Gulf Incident Hotline with any additional information about the Khamisiyah incident or to report illnesses that they attributed to their service in the Gulf War.
The CIA-DOD (1997) models integrated four components:
-
UNSCOM reporting and intelligence summaries of the amount, purity, and type of chemical-warfare agents stored at Khamisiyah.
-
Results of experiments3 performed later at Dugway Proving Ground to simulate the demolition at Khamisiyah and thus estimate the amount of sarin and cyclosarin released, the release rate, and the type of release (instantaneous, continuous, or flyout).
-
A combination of dispersion models that incorporated meteorologic conditions at the time (including wind direction) to simulate the transport and diffusion of the plume so that agent concentrations downwind could be estimated.
-
Unit location information to determine the position of troops in relation to the plume’s path.
Potential exposure was categorized as a “first-noticeable-effects” level and a “general-population” level. At the first-noticeable-effects level, for which the lower limit was set at 1 mg-min/m3, the estimated exposure would be high enough to cause watery eyes, runny nose, chest tightness, sweating, muscle twitching, or other early signs of exposure to organophosphorus compounds. The general-population level of exposure, for which the upper limit was set at 0.01296 mg-min/m3, was the “dosage below which the general population, including children and older people, could be expected to remain 72 hours with no effects”. Between those two was the “area of low-level exposure” (CIA-DOD 1997). The models indicated that the plume with concentrations at the first-noticeable-effects level would have dispersed to below 1 mg-min/m3 within 3 days of the demolition. The plume with concentrations in the low-level range dispersed
to be in the general-population level within 5 days of the demolition. Taking the potential first-noticeable-effects exposures and the potential low-level exposures into account and eliminating the counting of the same troops on multiple days, CIA-DOD estimated that nearly 99,000 troops might have been exposed to sarin or cyclosarin above the general-population level over the course of 4 days after the demolition of the storage pit at Khamisiyah. Those CIA-DOD findings were challenged in a US Senate report (Committee on Veterans Affairs 1998). The Senate report took issue with the method, especially the reconstruction of the pit site; with the nature of the demolition; and with the number of exposed troops.
At the request of the Senate Committee on Veterans Affairs, the Air Force Technical Applications Center (AFTAC) prepared another exposure model. The AFTAC report summary indicates that AFTAC used models different from those used by CIA-DOD to simulate atmospheric chemistry (Committee on Veterans Affairs 1998). The report indicated additional geographic areas of low-level exposure not modeled by CIA-DOD. The CIA-DOD model was reviewed by an expert panel in 1998; as stated in the Khamisiyah narrative, “this panel approved of the DOD/CIA modeling methodology but recommended a number of improvements, including revisions to the computer models used. The Special Assistant initiated improvements to the 1997 model process to obtain the highest quality of hazard area definition possible. Modeling improvements continued throughout 1998 and 1999 and culminated in redefined potential hazard areas in January 2000” (Winkenwerder 2002).
A second CIA-DOD model, a peer-reviewed revision of the first, was completed in 2000 (Rostker 2000), and a final report was released in 2002 (Winkenwerder 2002). The second CIA-DOD model differed from the first in that it incorporated updated unit-location and personnel data, revised the meteorologic models, reduced the estimates of nerve-agent release, combined the toxicity of sarin and cyclosarin (the first model used only sarin), and adjusted the general-population level to account for a briefer duration of troops’ potential exposure. Troops were considered exposed to sarin at 0.0432 mg-min/m3 and to cyclosarin at 0.0144 mg-min/m3.
Neither of the models found any troops to have been exposed to concentrations above first-noticeable-effects levels, that is, concentrations that would have been high enough to induce a particular type of chemical alarm to sound and to produce visible signs of the acute cholinergic syndrome among troops. No medical reports by the US Army Medical Corps at the time of the release were consistent with signs and symptoms of acute exposure to sarin (PAC 1996a). That is in accordance with the result of the 1997 DOD survey completed by 7,400 troops within 50 km of Khamisiyah: no reports of cholinergic effects (CIA-DOD 1997).
Two other storage sites in central Iraq, Muhammadiyat and Al Muthanna, sustained damage from air attacks during the Gulf War. Munitions containing 2.9 metric tons of sarin–cyclosarin and 1.5 metric tons of mustard gas were damaged at Muhammadiyat, and munitions containing 16.8 metric tons of sarin–cyclosarin were damaged at Al Muthanna (PAC 1996a). Atmospheric modeling by CIA-DOD determined that the nearest US personnel—400 km away—were outside the range of contamination (PAC 1996a).
To estimate potential exposures to sarin or cyclosarin released from the demolition at Khamisiyah, a number of estimation and modeling procedures have been used. Table 2.1 and the chronology that follows describe the evolution of those approaches to estimate potential exposures. It must be noted, however, that in no cases were sarin and cyclosarin measured, although a Czechoslovak chemical-decontamination unit did detect sarin in areas of northern Saudi Arabia within the timeframe of the Khamisiyah demolition, which suggested that sarin was released into the air. Furthermore, the General Accounting Office (GAO) report (GAO 2004)
suggests that multiple reports of sarin detection indicate that the spatial extent of sarin release was far greater than that predicted by the various models.
TABLE 2.1 Models of Sarin and Cyclosarin Release
|
Model |
No. Troops Potentially Exposed |
Features |
Epidemiologic Studies Using Models to Assess Exposure to Sarin/Cyclosarin |
|
50-km radius Rostker 1997 |
20,000 |
Circular radius around site; binary determination of exposure status |
McCauley et al. 2002 |
|
1997–Model 1 CIA-DOD 1997 |
98,910 |
Dispersion model; exposure estimated for sarin; estimated four strata of exposure |
Gray et al. 1999b |
|
2000–Model 2 (2000 interim Report; 2002 final report) Rostker 2000 Winkenwerder 2002 |
101,752 |
Revision of Model 1, including improved meteorologic models, degradation parameters, increased location specificity, included Air Force personnel, increased toxicity of cyclosarin, modified thresholds for high and low exposure |
Bullman et al. 2005; Davis et al. 2004; Smith et al. 2003; Smith et al. 2002b |
Chronology (excerpted and modified from GAO 2004 and CIA-DOD 1997):
1996
-
August: CIA asked Lawrence Livermore National Laboratory to perform atmospheric-dispersion calculations using a hypothetical release scenario.
-
August: CIA, from the above modeling, stated that an area around Khamisiyah as large as 25 km downwind and 8 km wide could have been contaminated.
-
September: DOD estimated that 10,000 troops had been within 25 km of Khamisiyah.
-
October: DOD extended the distance to 50 km and estimated that 20,000 US troops had been within this zone.
-
October: The deputy secretary of defense sent a memorandum to 20,000 veterans who had been identified as being within 50 km of Khamisiyah.
1997
-
July: DOD and CIA jointly announced the results of Khamisiyah dispersion modeling (Model 1).
-
July: DOD sent written notices to 98,910 veterans in the potential hazard area and about 10,000 notices to those who had received a survey and letter from the deputy secretary of defense but were not in the potential hazard area.
2000
-
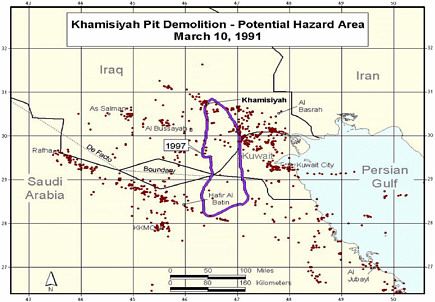
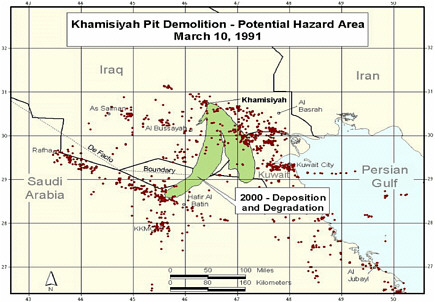
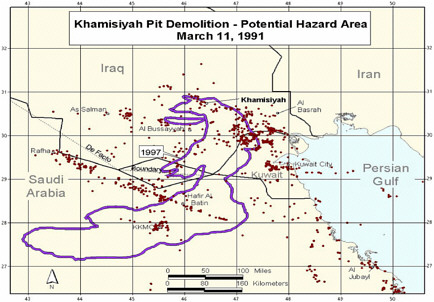
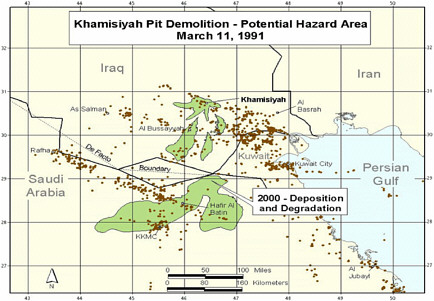
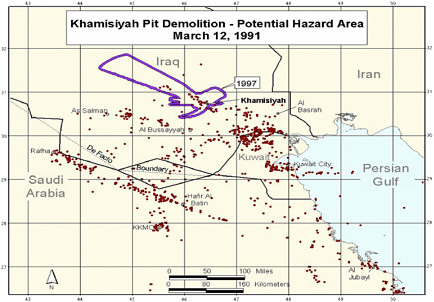
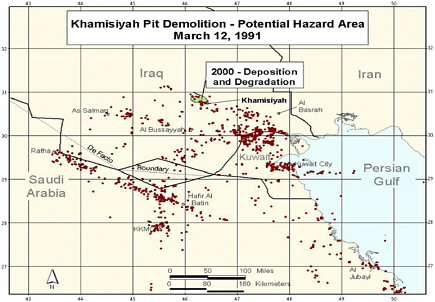
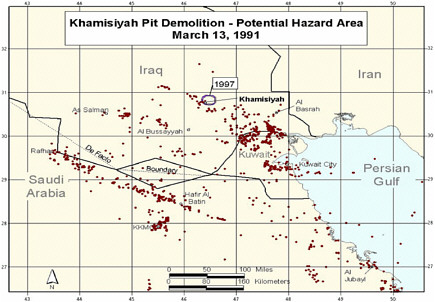
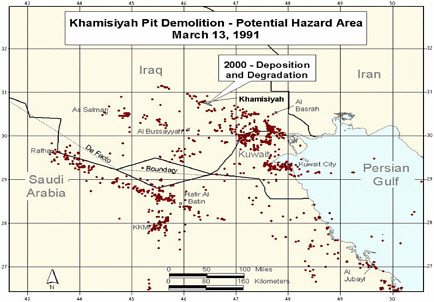
Revised model (Model 2) completed. Revision included updated meteorologic and dispersion models incorporating dilution, deposition, and degradation terms; revised emissions estimates from the CIA, and improved troop location information and specificity (Model 1 determined
-
location at battalion level—500-900 soldiers; Model 2 determined location at the unit level—under 200 soldiers. That resulted in generally smaller geographic areas to be considered as exposure areas).
-
DOD’s estimate of the troop number possibly exposed increased by about 2,000. About 35,000 troops who had been notified of possible exposure were no longer in the possible hazard area, whereas about 37,000 newly identified troops probably were in the hazard area.
-
Additional analyses resulted in change of potential number of exposed US troops to 101,752. The differences between the 1997 and 2000 models with respect to geographic coverage can be seen in the images below as excerpted from Rostker (2000). In general, the 2000 model estimates dispersion over a smaller area.
Epidemiologic Studies Using Fate and Transport Models to Assess Exposure to Sarin and Cyclosarin
On the basis of results of initial estimates of troops within 50 km who were potentially exposed, McCauley et al. (2002) compared those within 50 km of Khamisiyah with a nondeployed control group and a deployed control group that had not been determined to be within 50 km of the site. After completion of the study, results of the first dispersion model (Model 1) were released. On the basis of the revised model, roughly half those within 50 km were not under the plume.
Gray (1999b) used the original Khamisiyah dispersion model (1997, Model 1) to assess the potential relationship between exposure and postwar hospitalization. That model was linked to troop-movement data at the unit level (50-120 people, according to Gray et al.) in a geographic information system (GIS) framework. According to the authors, locations were not always recorded daily, and units were widely dispersed throughout the region. Additional interviews of 150 officers conducted by the DOD Office of the Special Assistant for Gulf War Illnesses (OSAGWI) were undertaken to optimize the troop-location information for the March 10-13 period of the Khamisiyah munitions destruction. It is not clear whether that resulted in any changes in location information used in the study. The dispersion model included estimates of emissions based on the numbers of rockets present at Khamisiyah and their sarin and cyclosarin content. Rocket-destruction modeling was developed by DOD and CIA to determine the amounts of the agents initially released and the rate of evaporative release. Several meteorologic models were combined with three dispersion models to generate five estimates of daily plume coverage related to the Khamisiyah demolition (detailed report described in DOD report (CIA-DOD 1997). The meteorologic models were validated with measurements of dispersion of smoke from the oil fires. That exercise resulted in a “notification plume” in which exposures were estimated to be at least a low level (0.0126 mg-min/m3 for sarin) and, after consultation with an expert panel, an “epidemiologic plume” that combined results of the best meteorologic and dispersion models. Plumes were estimated for each day during March 10-13, 1991. Potentially exposed veterans (124,487) were classified into four groups: uncertain low exposure (n = 75,717); 0-0.01256 mg-min/m3 (n = 18,952); 0.01257-0.09656 mg-min/m3 (n = 23,061); and 0.09657-0.51436 mg-min/m3 (n = 6,757). In addition, the study considered 224,804 nonexposed people. Overall, exposures of 349,291 veterans were estimated.
Bullman et al. (2005) used the revised model in their analysis of mortality (2000, Model 2). The revised model was also used by Smith et al. (2002b, 2003) and Davis et al. (2004). The revised model is based on recommendations from a DOD peer review of the initial model and additional information—specifically, more recent versions of the meteorologic models, updated information on the number of rockets damaged during the demolition (from 500 to 225), incorporation of gaseous deposition and nerve-agent decay in the modeling (which would lower exposure estimates and numbers exposed), and different thresholds for high and low exposure to sarin and cyclosarin. Most important, the revised model included more-specific information regarding the location of individual military units at the time of the Khamisiyah explosion and added information on Air Force personnel that was not included in the original estimates. In the earlier (1997) model, a person’s location was determined largely by the location of the battalion (which comprised 500-900 people), whereas the revised model included location information on the company (which comprised 100-200 people). On the basis of a combination of the improved location data with revised 2000 modeling, estimates indicate that roughly 102,000 soldiers were within the low-exposure areas for a sarin dosage of 0.0432 mg-min/m3 (0.00003 mg/m3 times
1,440 minutes [24 hours]) and a cyclosarin dosage of 0.0144 mg-min/m3, assuming that cyclosarin was more than 3 times as toxic as sarin—and no soldiers were in the high-exposure area. Of the 102,000, about 66,000 were considered to be exposed in the 1997 model. The increase in the number of potentially exposed people is based on the more accurate troop-location information.
Despite the continued improvement in the model, a recent GAO report (GAO 2004) remains critical of the models and argues that epidemiologic studies that use those models incorporate substantial exposure misclassification due to errors in estimation of troop locations combined with uncertainty regarding plume locations. The report identifies the following major problems with the modeling:
-
Underestimation of plume heights and consequently underestimated areas of potential exposure.
-
Source-emission estimates based on unrealistic simulation.
-
In all models, large variability in plume location and size.
Specifically, the GAO report notes that the models used were not developed for long-range transport of chemical-warfare agents, included inaccurate and highly uncertain information regarding the numbers of sarin- or cyclosarin-containing rockets that were destroyed and the rate of release of the compounds from each rocket, and underestimated the height of plumes resulting from demolition. The GAO report also states that there is a large degree of variability between the models that were used regarding the size and path of a plume. The variability led to the use of a single composite model (also called the ensemble approach, in which results of different model combinations are averaged to approximate a variety of conditions—a relatively common approach in atmospheric science), but the results of any single model were excluded. That decision dramatically reduced the area of potential exposure. The GAO report notes that exposure of troops cannot be reliably estimated for epidemiologic studies.
Given the lack of any means to evaluate model performance, it is not possible to determine the accuracy of the final version of the model. One can conclude that any studies that used the earlier version of the model (Gray et al. 1999b; McCauley et al. 2002) or less specific exposure-estimation approaches are likely to be inaccurate according to the current understanding of the dispersion of agents from Khamisiyah. Even if the final model can be accepted as an accurate determination of exposure, an important problem for epidemiologic studies has been introduced by the numerous notifications to veterans regarding potential exposure to agents released from Khamisiyah. Given that the sequential notifications went to different people, under any of the more recent modeling scenarios there will be people who were previously notified as being exposed but who will be considered unexposed on the basis of model results. That might jeopardize the findings of studies that focused on Khamisiyah emissions, because knowledge of potential exposure might lead to biased reporting of health outcomes. Furthermore, the large differences between model estimates of who was and who was not exposed raises concern regarding the potential for exposure misclassification—even in the most recent model. Other characteristics of the model inputs (such as the amounts and purity of the sarin and cyclosarin that were estimated to be present before demolition) and dispersion parameters will affect the quantitative estimates of exposure and the extent of the area under the plume but are less likely to have major effects on a binary classification of exposed-unexposed.
STUDIES USING ENVIRONMENTAL FATE AND TRANSPORT MODELS FOR SPECIFIC EXPOSURES
At the end of the Gulf War, over 600 Kuwaiti oil wells were ignited by retreating Iraqi troops. Large plumes of smoke rose from the fires. Occasionally, the smoke remained near the ground and enveloped US military personnel. No systematic monitoring occurred from the initial deployment in 1990 to May 1991, when several independent teams from multiple US and international agencies (including the US Army Environmental Health Agency [AEHA] and the US Environmental Protection Agency [EPA]) went into Kuwait to monitor the ambient air contamination due to oil-well fire emissions (Spektor 1998). Smoke was sampled to improve understanding of the nature of the plumes generated by the burning oil wells. Most of the oil fires were still burning when measurements began.
Individual fires created distinct smoke plumes over short distances, but over longer distances the plumes merged into one “supercomposite” plume about 40 km wide south of Kuwait City. At the base of the plume, oil falling in droplet form or emitted from uncapped wells collected in pools on the desert; the pools sometimes were on fire as well (Hobbs and Radke 1992). The smoke plumes from individual fires varied in color and density. Black smoke plumes resulted from single well fires and had relatively high concentrations of carbon; they made up 60-65% of the fires. The densest black plumes were from the burning pools of oil. White smoke plumes, accounting for 25-30% of the fires, contained almost no carbon but had a higher concentration of inorganic salts; this is consistent with reports of the presence of brine solutions in the oil fields (Cofer et al. 1992; Spektor 1998).
The available monitoring data indicate that concentrations of nitrogen oxides, carbon monoxide, sulfur dioxide, hydrogen sulfide, other pollutant gases, and polycyclic aromatic hydrocarbons (PAHs) did not exceed those in the air of a typical US industrial city. PAH concentrations in the samples were low (PAC 1996b). High concentrations of particulate matter (PM) from sand and soot were often observed at multiple monitoring sites; an estimated 20,000 tons of soot, or fine-particle mass, was generated by the fires (Thomas et al. 2000) and made up about 23% of the PM in the Persian Gulf, often at concentrations twice those considered safe (Rostker 2000).
In addition to air monitoring, potential exposures of troops to smoke and combustion products from the oil-well fires were modeled (Draxler et al. 1994). Daily and seasonal normalized air concentrations due to emissions from the oil-well fires were computed with a modified Lagrangian transport, dispersion, and deposition model for February-October 1991. The highest normalized concentrations were near the coast between Kuwait and Qatar. Peak values moved farther west and inland with each season; that is, the smoke and combustion products moved from over the Gulf in spring to the west over the Saudi Peninsula by autumn.
Assessment of exposure to oil-fire smoke used self-reports of exposure and a detailed atmospheric model that was combined with troop-unit location information. For example, Kelsall (2004b) used self-reported exposures to oil-fire smoke and dust storms, including no exposure, low exposure (less than 5 hours/day or outside for less than 10 days), and high exposure (more than 5 hours/day or outside for 10 days or more). Most of the Australian veterans included in the study had either no (46.1%) or low (44.8%) exposure to oil-fire smoke. The timing of deployment relative to the beginning of the air war (January 17, 1991) and the ignition of oil wells was also used as a more objective estimate of exposure in this study.
The use of such modeling is supported by a number of measurements (ground-based and satellite) that provided detailed characterization of plume dispersion and dynamics. For example, Hobbs and Radke (1992) described the atmospheric properties of the Kuwaiti oil fires. Individual fires produced distinct, isolated plumes that merged beyond short distances and fanned outward horizontally. Smoke was never observed to rise above 6 km, and this prevented rapid transport over large distances. As a result of scavenging by clouds and precipitation, the residence time of a smoke particle in the atmosphere was relatively short (days). The composite plume from the north and south oil fields was 40 km wide south of Kuwait City and 0.5-2 km in altitude. Individual fires produced different plumes with different appearances (white and black smoke) due to different amounts of salt (more salt resulted in more whiteness). A composite plume consisted of about 30% salt, 15-20% soot (elemental carbon), 8% sulfate, and 30% organic carbon.
The oil-fire smoke model that was used in epidemiologic studies is described in detail in Smith et al. (2002a) and Lange et al. (2002). Briefly, the National Oceanic and Atmospheric Administration and the US Army Center for Health Promotion estimated 24-hour concentrations for 15 x 15-km grids (a total of 40,401 grids) in the Gulf War Theater. The Lagrangian HYSPLIT model was used with meteorologic data to estimate air concentrations of PM. The model estimates were compared with aircraft and surface measurements of carbon-soot smoke and sulfur dioxide.
The troop-location information was compiled from daily data provided by the US Armed Services Center for Unit Records Research as described in Gray et al. (1999b) and Smith et al. (2002a). Particle exposures were estimated for each troop unit on each day by using the closest HYSPLIT grid point. The unit-based exposures were then linked to DOD personnel files to identify individual service members in each unit and to assign exposures to each member. In their analysis, Smith et al. categorized exposure on the basis of estimated concentrations and durations: average daily exposure at 1-260 μg/m3 for 1-25 days (33.7%), for 25-50 days (5.7%), and for over 50 days (0.9%); and average daily exposure at over 260 μg/m3 for 1-25 days (16.8%), for 26-50 days (17.0%), and for over 50 days (9%). The reference category of no exposure accounted for 16.8% of the 405,142 study subjects (75% of the active-duty deployed Gulf War veterans).
It is important to note that all the above studies (Cowan et al. 2002; Gray et al. 1999b; Lange et al. 2002; Smith et al. 2002a) used the same exposure model and that the model was developed with ground-based measurement data and satellite data. The use of satellite data in particular improves confidence in the model’s ability to describe the spatial extent of the oil-fire plumes accurately. Furthermore, the troop-unit (about 120 people per unit) location information was derived from handwritten records of GPS-based location information. For each unit, a single location was derived for each day; unit subgroups were identified (and assigned different exposures) if multiple locations for a unit were present for at least 3 consecutive days. Lange et al. (2002) also describe a quality-control check of the unit-location information. The results of the epidemiologic studies with this model are discussed in later chapters. There are limitations in any assessment of exposure that does not include individual measurements, but this model used state-of-the-art approaches and was based, wherever possible, on measurement data.
STUDIES USING BIOLOGIC MONITORING FOR SPECIFIC EXPOSURES
Depleted Uranium
Potential exposure to DU in the Gulf War resulted from the generation of uranium-dust particles and shrapnel when DU munitions penetrated a target. The penetration leads to the generation of fragments and particles that ignite easily. Exposure might occur through inhalation of particles or via embedded shrapnel. DU is almost entirely U-238 and has only 60% of the radioactivity of natural uranium (U) because it has been depleted of much of the more radioactive isotopes (U-235 and U-234). Uranium decay results in the release of alpha particles which travel short distances. Consequently, the principal radiation hazard associated with DU exposure is to tissues in immediate contact with internalized DU fragments or particles (McDiarmid et al. 2004a).
DU was used in several types of armor-piercing munitions during the Gulf War because of its extreme density and effectiveness in penetrating armor. In addition, DU was used in tank armor. Potential exposures were typically associated with friendly-fire incidents in which US tanks mistakenly fired DU munitions into other US combat vehicles (GAO 2000). Those incidents reportedly exposed 102 service members, who were in or on the vehicles at the time of impact, to shrapnel that contained embedded DU or to inhaled or ingested DU particles. An additional 60 people involved in rescue and evacuation and 191 who entered DU-contaminated vehicles after impact might also have been exposed. A fire at Camp Doha, Kuwait, involved detonation and burning of DU-containing munitions and led to additional potential exposures. More minor exposures might have been experienced by other people from a variety of circumstances such as passing through areas with DU smoke and handling spent DU munitions.
In response to concerns regarding the potential health effects of exposure to DU, VA initiated a urinary-uranium testing program, which was open to any concerned Gulf War veteran and, with special notification, provided to those who were suspected of receiving the highest DU exposures. McDiarmid et al. (2004b) reported the results of urinary uranium measurements for a total of 446 Gulf War veterans, including 169 veterans with no known friendly-fire involvement but self-reporting of other potential DU exposures. It is important to note that there is not complete overlap between those involved in the screening program and those noted above with potential exposure.
Of the 446 veterans, 22 had high urinary uranium (0.05 μg/g of creatinine). Of the 22, 15 had a second sample tested for confirmation, and only six had high uranium in the second sample. Of the initial 22 samples, 21 were subjected to isotopic analysis to determine the source of the high urinary uranium. Three subjects had confirmed DU exposure, and the remaining 18 had isotope ratios consistent with natural-uranium exposure (McDiarmid et al. 2004b). The results of the surveillance also indicate no increased urinary uranium in those participating in the program compared with a sample of US adults in the National Health and Nutrition Examination Surveys. In a comparison of exposure scenarios with urinary-uranium measurements, only the presence of embedded shrapnel was associated with high urinary uranium. Those reporting that they were in or on a vehicle hit by friendly fire (29 of the 446) or in a vehicle hit by enemy fire (31 of the 446) also had somewhat increased urinary uranium, although the report did not provide details of the statistical comparisons. In the study, 19 exposure categories or scenarios determined from questionnaire responses to 30 questions were analyzed in relation to urinary-uranium measurements. The 30 scenarios were determined by a panel of military experts and
health physicists and ranked by intensity of exposure by the DOD OSAGWI (Office of the Special Assistant for Gulf War Illness).
Focused analyses of veterans who reported being involved in friendly-fire incidents have also been conducted. For example, a group of 39 veterans reporting exposure to DU during friendly-fire incidents were assessed by McDiarmid et al. (2004a). All urinary-uranium measurements, except one, were above 0.10 μg/g of creatinine and were from people with retained DU shrapnel. They also reported good agreement between measurements made in 2001 and those made in 1997 and 1999. An earlier study (McDiarmid et al. 2001b) of 50 veterans who had been exposed to friendly fire and had retained shrapnel found that all but one were excreting high concentrations of urinary uranium (0.018-39.1 μg/g of creatinine).
Hooper et al. (1999) reported on 33 US soldiers who had been in or on a vehicle struck by DU munitions, selected from a DOD list of 68 military personnel who were wounded in February 1991 in friendly-fire incidents. Of the 68, 48 were contacted, and 33 agreed to participate. Retained shrapnel was identified with x-ray pictures and 24-hour urine samples were collected. Of the 33, 23 had been told that they were wounded with shrapnel; most were unsure whether it was removed. X-ray analysis detected shrapnel in 15 of the 23 and in two others who were not aware of any shrapnel; that suggests that DU can penetrate to soft tissue without superficial wounds. Subjects with retained shrapnel had urinary uranium 150 times as high as those with no evidence of shrapnel (4.47 vs 0.03 μg/g of creatinine). Subjects with reported shrapnel wounds but no retained shrapnel on x-ray pictures had low urinary-uranium measurements that were comparable with those in subjects without suspected shrapnel. In those with confirmed shrapnel, urinary uranium remained high 4 years after exposure and was highly correlated with previous measurements (3 years after exposure).
It is important to note that even in those with documented persistent DU exposure, no signs of classic uranium-related adverse outcomes have been observed. Furthermore, it is argued that, on the basis of experience with uranium miners and that of veterans with persistent DU exposure, veterans with normal urinary-uranium measurements are unlikely to develop any uranium-related toxicity in the future regardless of initial DU exposure (McDiarmid et al. 2001a).
In summary, results of detailed surveillance indicate persistently increased urinary uranium in a very small number of subjects with embedded DU-containing shrapnel. The vast majority of veterans who participated in DU-exposure surveillance, presumably because of potential exposure, did not show evidence of long-term DU exposure. It is likely that some of those veterans were initially exposed to DU that has since been cleared or largely sequestered in bone.
Oil-Well Fire Smoke
In light of concern about oil-well fire smoke and exposure to other agents related to Gulf War service, Poirier et al. (1998) conducted biologic monitoring and DNA-adduct monitoring for PAH exposure of 61 US soldiers before deployment (while in Germany), during their deployment in Kuwait, and after their deployment (back in Germany). Environmental monitoring indicated low PAH concentrations in those soldiers’ areas of service in Kuwait. Concentrations of adducts and markers of PAH exposure were lowest during the period of Kuwaiti deployment, and there was no indication of increased PAH exposure while the soldiers were deployed in Kuwait. Additional biologic monitoring data on the same people for metals and volatile organic compounds (VOCs) are described by US AEHA (1994). The biologic measurements did not in
general indicate any Gulf War deployment-related differences in exposure. In most cases, results were within the normal US population reference range determined by the CDC National Center for Environmental Health. The one exception was higher predeployment and postdeployment than deployment concentrations of PAH-DNA adducts; that implies very low PAH exposure of soldiers deployed in the Gulf War. The data do not suggest any exposure at high PAH concentrations during deployment in Kuwait. Similarly, low exposure to metals and VOCs during deployment was found.
SUMMARY AND CONCLUSIONS
The studies that used self-reports indicate that there is a higher prevalence of reporting of multiple biologic and chemical exposures by veterans than by their nondeployed counterparts, especially exposures to oil-well fire smoke, diesel, insecticides, and tent-heater fumes. Those studies also show evidence of reporting bias regarding vaccinations, and studies of PB generally show a high prevalence of underconsumption and, for a smaller subset, overconsumption of PB relative to recommended dosages.
There is little agreement between subjective and objective measurements of exposure to DU and oil-well fire smoke. DU, however, is the best-characterized exposure because of extensive database of urinary uranium measurements. Those data indicate that a very small number of people clearly have prolonged exposure to DU. The oil-fire smoke studies, although not based on individual measurements as in the case of DU, incorporate objective exposure assessment inasmuch as models have been evaluated with actual measurements and with troop-location information based on measurements. There are substantial problems with the assessment of exposure to the Khamisiyah demolition products (sarin and cyclosarin). Inconsistencies between models and lack of any model evaluation make it difficult to ascertain the accuracy of exposure assessment. The epidemiologic studies that used the initial models (50 km and Model 1—Table 2.1) are likely to have greater inaccuracy. More recent studies (using Model 2) are likely to be improved but still retain substantial uncertainty, which results in a potential for exposure misclassification.
REFERENCES
Bullman TA, Mahan CM, Kang HK, Page WF. 2005. Mortality in US Army Gulf War Veterans Exposed to 1991 Khamisiyah Chemical Munitions Destruction. American Journal of Public Health 95(8):1382-1388.
CDC (Centers for Disease Control and Prevention). 1999. Background Document on Gulf War-Related Research for the Health Impact of Chemical Exposures During the Gulf War: A Research Planning Conference. Atlanta, GA: Centers for Disease Control and Prevention.
Cheng YS, Zhou Y, Chow J, Watson J, Frazier C. 2001. Chemical composition of aerosols from kerosene heaters burning jet fuels. Aerosol Science and Technology 35(6):949-957.
Cheng Y. 1999. Characterization of Emissions from Heaters Burning Leaded Diesel Fuel in Unvented Tents. Washington, DC: Department of Defense.
Cherry N, Creed F, Silman A, Dunn G, Baxter D, Smedley J, Taylor S, Macfarlane GJ. 2001. Health and exposures of United Kingdom Gulf war veterans. Part II: The relation of health to exposure. Occupational and Environmental Medicine 58(5):299-306.
CIA-DOD (Central Intelligence Agency-Department of Defense). 1997. Modeling the Chemical Warfare Agent Release at the Khamisiyah Pit. Washington, DC: CIA-DOD.
Cofer WR, Stevens RK, Winstead EL. 1992. Kuwaiti oil fires: Compositions of source smoke. Journal of Geophysical Research 97(D17):14521-14525.
Committee on Veterans’ Affairs, US Senate. 1998. Report of the Special Investigation Unit on Gulf War Illnesses. Washington, DC: 105th Congress, 2nd session.
Cowan DN, Lange JL, Heller J, Kirkpatrick J, DeBakey S. 2002. A case-control study of asthma among U.S. Army Gulf War veterans and modeled exposure to oil well fire smoke. Military Medicine 167(9):777-782.
Davis LE, Eisen SA, Murphy FM, Alpern R, Parks BJ, Blanchard M, Reda DJ, King MK, Mithen FA, Kang HK. 2004. Clinical and laboratory assessment of distal peripheral nerves in Gulf War veterans and spouses. Neurology 63(6):1070-1077.
Draxler RR, McQueen JT, Stunder BJB. 1994. An evaluation of air pollutant exposures due to the 1991 Kuwait oil fires using a Lagrangian model. Atmospheric Environment 28(13):2197-2210.
GAO (Government Accountability Office). 2000. Understanding of Health Effects From Depleted Uranium Evolving but Safety Training Needed. Washington, DC: GAO.
GAO. 2004. Gulf War Illnesses: DOD’s Conclusions About US Troops’ Exposure Cannot Be Adequately Supported. Washington, DC: GAO.
Gray GC, Kaiser KS, Hawksworth AW, Hall FW, Barrett-Connor E. 1999a. Increased postwar symptoms and psychological morbidity among U.S. Navy Gulf War veterans. American Journal of Tropical Medicine and Hygiene 60(5):758-766.
Gray GC, Smith TC, Knoke JD, Heller JM. 1999b. The postwar hospitalization experience of Gulf War Veterans possibly exposed to chemical munitions destruction at Khamisiyah, Iraq. American Journal of Epidemiology 150(5):532-540.
Hobbs PV, Radke LF. 1992. Airborne studies of the smoke from the Kuwait oil fires. Science 256(5059):987-991.
Hooper FJ, Squibb KS, Siegel EL, McPhaul K, Keogh JP. 1999. Elevated urine uranium excretion by soldiers with retained uranium shrapnel. Health Physics 77(5):512-519.
Hotopf M, David A, Hull L, Ismail K, Unwin C, Wessely S. 2000. Role of vaccinations as risk factors for ill health in veterans of the Gulf war: Cross sectional study. British Medical Journal 320(7246):1363-1367.
Keeler JR, Hurst CG, Dunn MA. 1991. Pyridostigmine used as a nerve agent pretreatment under wartime conditions. Journal of the American Medical Association 266(5):693-695.
Kelsall HL, Sim MR, Forbes AB, Glass DC, McKenzie DP, Ikin JF, Abramson MJ, Blizzard L, Ittak P. 2004a. Symptoms and medical conditions in Australian veterans of the 1991 Gulf War: Relation to immunisations and other Gulf War exposures. Occupational and Environmental Medicine 61(12):1006-1013.
Kelsall HL, Sim MR, Forbes AB, McKenzie DP, Glass DC, Ikin JF, Ittak P, Abramson MJ. 2004b. Respiratory health status of Australian veterans of the 1991 Gulf War and the effects of exposure to oil fire smoke and dust storms. Thorax 59(10):897-903.
Kroenke K, Koslowe P, Roy M. 1998. Symptoms in 18,495 Persian Gulf War veterans. Latency of onset and lack of association with self-reported exposures. Journal of Occupational and Environmental Medicine 40(6):520-528.
Lange JL, Schwartz DA, Doebbeling BN, Heller JM, Thorne PS. 2002. Exposures to the Kuwait oil fires and their association with asthma and bronchitis among Gulf War veterans. Environmental Health Perspectives 110(11):1141-1146.
Madsen JM. 1998. Clinical Considerations in the Use of Pyridostigmine Bromide As Pretreatment for Nerve-Agent Exposure. Aberdeen Proving Ground, MD: Army Medical Research Institute of Chemical Defense.
Mahan CM, Kang HK, Dalager NA, Heller JM. 2004. Anthrax vaccination and self-reported symptoms, functional status, and medical conditions in the National Health Survey of Gulf War Era Veterans and Their Families. Annals of Epidemiology 14(2):81-88.
McCauley LA, Lasarev M, Sticker D, Rischitelli DG, Spencer PS. 2002. Illness experience of Gulf War veterans possibly exposed to chemical warfare agents. American Journal of Preventive Medicine 23(3):200-206.
McDiarmid MA, Engelhardt SM, Oliver M. 2001a. Urinary uranium concentrations in an enlarged Gulf War veteran cohort. Health Physics 80(3):270-273.
McDiarmid MA, Squibb K, Engelhardt S, Oliver M, Gucer P, Wilson PD, Kane R, Kabat M, Kaup B, Anderson L, Hoover D, Brown L, Jacobson-Kram D, Depleted Uranium Follow-Up Program. 2001b. Surveillance of depleted uranium exposed Gulf War veterans: Health effects observed in an enlarged "friendly fire" cohort. Journal of Occupational and Environmental Medicine 43(12):991-1000.
McDiarmid MA, Engelhardt S, Oliver M, Gucer P, Wilson PD, Kane R, Kabat M, Kaup B, Anderson L, Hoover D, Brown L, Handwerger B, Albertini RJ, Jacobson-Kram D, Thorne CD, Squibb KS. 2004a. Health effects of depleted uranium on exposed Gulf War veterans: A 10-year follow-up. Journal of Toxicology and Environmental Health Part A 67(4):277-296.
McDiarmid MA, Squibb K, Engelhardt SM. 2004b. Biologic monitoring for urinary uranium in gulf war I veterans. Health Physics 87(1):51-56.
Office of the Secretary of Defense. January 30, 1998. Letter to Honorable Arlen Specter, Chairman Committee on Veterans Affairs United States Senate.
PAC (Presidential Advisory Committee). 1996a. Presidential Advisory Committee on Gulf War Veterans' Illnesses: Final Report. Washington, DC: US Government Printing Office.
PAC. 1996b. Presidential Advisory Committee on Gulf War Veterans' Illnesses: Final Report. Washington, DC: US Government Printing Office.
Poirier MC, Weston A, Schoket B, Shamkhani H, Pan CF, McDiarmid MA, Scott BG, Deeter DP, Heller JM, Jacobson-Kram D, Rothman N. 1998. Biomonitoring of United States Army soldiers serving in Kuwait in 1991. Cancer Epidemiology, Biomarkers and Prevention 7(6):545-551.
Proctor SP, Heeren T, White RF, Wolfe J, Borgos MS, Davis JD, Pepper L, Clapp R, Sutker PB, Vasterling JJ, Ozonoff D. 1998. Health status of Persian Gulf War veterans: Self-reported symptoms, environmental exposures and the effect of stress. International Journal of Epidemiology 27(6):1000-1010.
Rostker B. 1997. US Demolition Operations at the Khamisiyah Ammunition Storage Point. Washington, DC: Department of Defense.
Rostker, B. 2000. US Demolition Operations at Khamisiyah. [Online]. Available: http://www.gulflink.osd.mil/khamisiyah_ii/ [accessed August 6, 2004].
Schumm WR, Reppert EJ, Jurich AP, Bollman SR, Webb FJ, Castelo CS, Stever JC, Kaufman M, Deng LY, Krehbiel M, Owens BL, Hall CA, Brown BF, Lash JF, Fink CJ, Crow JR, Bonjour GN. 2002. Pyridostigmine bromide and the long-term subjective health status of a sample of over 700 male Reserve Component Gulf War era veterans. Psychological Reports 90(3 Pt 1):707-721.
Smith TC, Heller JM, Hooper TI, Gackstetter GD, Gray GC. 2002a. Are Gulf War veterans experiencing illness due to exposure to smoke from Kuwaiti oil well fires? Examination of Department of Defense hospitalization data. American Journal of Epidemiology 155(10):908-917.
Smith TC, Smith B, Ryan MA, Gray GC, Hooper TI, Heller JM, Dalager NA, Kang HK, Gackstetter GD. 2002b. Ten years and 100,000 participants later: Occupational and other factors influencing participation in US Gulf War health registries. Journal of Occupational and Environmental Medicine 44(8):758-768.
Smith TC, Gray GC, Weir JC, Heller JM, Ryan MA. 2003. Gulf War veterans and Iraqi nerve agents at Khamisiyah: Postwar hospitalization data revisited. American Journal of Epidemiology 158(5):457-467.
Spektor DM. 1998. A Review of the Scientific Literature As It Pertains to Gulf War Illnesses, Volume 6: Oil Well Fires. Santa Monica, CA: RAND.
Thomas R, Vigerstad T, Meagher J, McMullin C. 2000. Particulate Exposure During the Persian Gulf War. Washington, DC: Department of Defense.
Unwin C, Blatchley N, Coker W, Ferry S, Hotopf M, Hull L, Ismail K, Palmer I, David A, Wessely S. 1999. Health of UK servicemen who served in Persian Gulf War. Lancet 353(9148):169-178.
United States Environmental Protection Agency. National Ambient Air Quality Standards (NAAQS). [Online]. Available: http://www.epa.gov/air/criteria.html [accessed July 11, 2006].
US AEHA (United States Army Environmental Hygiene Agency). 1994. Final Report: Kuwait Oil Fire Health Assessment: 5 May-3 December 1991. Report No. 39.26-L192-91. Washington, DC: US Army Environmental Hygiene Agency.
Winkenwerder W. 2002. US Demolition Operations at Khamisiyah. Washington, DC: Department of Defense.
Wolfe J, Proctor SP, Erickson DJ, Hu H. 2002. Risk factors for multisymptom illness in US Army veterans of the Gulf War. Journal of Occupational and Environmental Medicine 44(3):271-281.


