
7
The Importance of Data Sharing to Consistent Macroeconomic Statistics
Dennis Fixler and J. Steven Landefeld
Bureau of Economic Analysis
The Bureau of Economic Analysis (BEA) has a unique position in the decentralized U.S. statistical system. BEA produces the national income and product accounts (NIPAs), a comprehensive and consistent double-entry set of accounts for the economy. BEA uses a myriad of data collected from public and private data sources to construct these accounts. In this role, BEA often confronts major inconsistencies in piecing these data together that are not evident from the perspective of the agencies collecting the individual pieces of the economic puzzle. BEA has been described as the canary in the mineshaft for the U.S. statistical system.
The U.S. statistical system has evolved over time in such policy agencies as the U.S. Department of Commerce, Labor, the Treasury, Agriculture, and Energy to provide data and answer questions relevant to the agencies’ missions. Surveys and the legislation supporting them have evolved independently. The result is a diverse set of data using different business registers, different industry classifications for establishments, different concepts and definitions, different timing, and different collection methods.
These differences in survey frames and procedures produce significant quantitative differences in what would appear to be the same measures of economic activity. For example, employment in individual industries as reported by the Labor Department’s Bureau of Labor Statistics (BLS) can differ markedly from that reported by the Department of Commerce’s Census Bureau. Differences exist for wages and salaries across industries, across states, and in the aggregate (see Tables 7-2 and 7-6).
WHY IT MATTERS
The implications of these differences in estimates is illustrated in Table 7-1, which summarizes the various data sources used by BEA in constructing one of its sets of accounts. Gross domestic product (GDP) is mainly estimated using data collected by the Census Bureau, while gross domestic income (GDI) is mainly estimated using data collected by BLS, the Census Bureau, and the Statistics of Income (SOI, part of the Internal Revenue Service, IRS). In concept, GDP should equal GDI because all final expenditures should end up as income to households, business, or government. However, because of the differences in the source data used in estimating GDP and GDI, often they are not equal, and the result is the statistical discrepancy.
Such discrepancies between GDP and GDI can have large impacts on fiscal and monetary policy. During the latter half of the 1990s, a large and persistent discrepancy arose, with real GDI growing 0.6 percent faster than real GDP (1995-2000). This was important for budget planning because real trend GDP growth is used as the baseline for estimating near-term trend growth in 5-year budget forecasts made by the Office of Management and Budget (OMB) and the Congressional Budget Office. To illus-
TABLE 7-1 BEA Summary Account 1—Primary Data Sources (billions of dollars)
|
|
Primary Data Source |
2004 |
|
Income side |
|
|
|
Labor compensation |
BLS |
$6,693.4 |
|
Corporate profits & gov’t enterprises |
Census Bureau, SOI |
973.6 |
|
Proprietors’ income and rental income |
Census Bureau, SOI |
1023.8 |
|
Interest on assets, taxes, & misc. payments |
SOI, FRB |
1,531.3 |
|
Depreciation |
Census Bureau |
1,435.3 |
|
GROSS DOMESTIC INCOME |
|
$11,657.5 |
|
Statistical discrepancy |
|
76.8 |
|
GROSS DOMESTIC PRODUCT |
|
$11,734.3 |
|
Expenditure side |
|
|
|
Personal consumption expenditures |
Census Bureau |
$8,214.3 |
|
Gross private domestic investment |
Census Bureau |
1,928.1 |
|
Gov’t consumption exp. & gross invest. |
Gov’t, Census Bureau |
2,215.9 |
|
Net exports of goods and services |
Census Bureau, BEA |
–624.0 |
|
GROSS DOMESTIC PRODUCT |
|
$11,734.3 |
trate the impact, according to OMB’s FY 2006 analysis of the “sensitivity of the budget to economic assumptions,” a persistent understatement of real GDP growth by 1.0 percent would result in an overstatement of the projected deficit of $530 billion. Similarly, a persistent understatement of real trend GDP growth could lower the Federal Reserve’s estimate of non-inflationary sustainable growth and signal the need for a tighter monetary policy than necessary.
One possible answer to the source of this discrepancy could lie in the recording of stock options, bonuses, and fringe benefits in employee compensation. While there are many sources of the difference between BLS and the Census Bureau payroll data, it is interesting that during the latter half of the 1990s, when stock options and bonuses were growing rapidly, the Census Bureau data rose at a 7.8 percent average annual rate, whereas the BLS data rose at a 7.5 percent average annual rate (1995-2000). Part of this may reflect the recording of stock options. For example, in Washington State—a state with significant stock option activity—the Census Bureau data grew nearly twice as fast (11.5 percent) as the BLS payroll data (6.2 percent) for 2000. If it turned out that stock options were under-reported in the BLS data, it would suggest that the growth rate of GDI might be even higher, thereby focusing additional effort on improving the reporting of final expenditures on services and other less-well-measured components of GDP.
Another example of the importance of BEA accuracy is illustrated by its regional data, which are used in the geographic allocation of nearly $200 billion in federal funds. These data are also used by virtually every state for its tax and planning purposes. BEA uses BLS data for these state and local estimates, which are taken from quarterly employment and unemployment tax forms.
The differences between the two sets of payroll data across states vary from the BLS set’s being 4.2 percent higher in New Mexico to 9.5 lower in Alaska than what is reported by the Census Bureau. These differences could have a significant impact on the allocation of state Medicaid funds, which uses BEA per capita state personal income to determine the federal share of payments for each state. Differences in growth rates can also have an important impact on state tax projections and spending plans. For example, in New York the $1.2 billion difference in growth in wages and salaries between 2001 and 2002 between BLS and the Census Bureau series would amount to about a $173 million difference in projected income taxes.
These are but a few of the examples of the implications for government and business decision makers. In the sections below, the implications for users of estimates ranging from profits and productivity to inflation and offshoring are explored.
DATA SHARING
Over the years, numerous proposals have been put forth to resolve the problems associated with a decentralized system. One has been the creation of a central statistical office such as those that exist in Canada, Australia, and other countries. The creation of such an entity has not proved popular for various reasons. Consolidation would require extensive budget negotiation and resources to coordinate and implement a process that ensures there is little to no disruption in data production. Furthermore, the current system allows for the specialization that has arguably led to many of the innovations produced by U.S. statistical agencies.
Given these difficulties, a practical way to achieve many of the benefits of a central statistical agency without the costs is to permit the sharing of business data among the three general-purpose statistical agencies—BEA, BLS, and the Census Bureau—that produce the bulk of the nation’s economic data. All three agencies have an excellent record of protecting confidential data, have access to various types of tax data, and share various types of data that could be significantly improved by data sharing.
A major step forward in allowing data sharing was the passage of the Confidential Information Protection and Statistical Efficiency Act of 2002 (CIPSEA). Section 521 stipulated that business data can be shared for statistical purposes among BEA, the Census Bureau, and BLS. At the time CIPSEA was formulated, it was understood that for data sharing to be completely operational, there would have to be some changes in Section 6103, paragraph (j), of Title 26 (Internal Revenue Code) and the accompanying regulations that govern access to federal tax information (FTI). These changes are necessitated by the facts that much of the Census Bureau information is commingled with FTI and neither BEA nor BLS has the Census Bureau level of access to use such data. Although there have been discussions concerning the formulation of a bill to submit to Congress to bring about the necessary changes in Title 26, to date no bill has been written for submission.
The absence of fully implemented data sharing especially affects BEA because it collects few data of its own and relies primarily on the Census Bureau for its data. Data sharing, however, does not just affect the ability of BEA to access Census Bureau data; the inability of BLS and the Census Bureau to share data greatly affects the quality of the data that BEA receives from both agencies. In this chapter we provide examples of how the absence of data sharing affects BEA estimates.
The limited access to business tax data has enormous effects on BEA’s ability to access Census data that are commingled with tax data. The Cen-
sus Bureau sample frames are constructed from IRS data, and, under current rules, name, address, and employer identification numbers are generally considered tax data. Although in principle BEA has access to corporate tax records in the SOI sample, the Census Bureau does not know the identification of those firms and so BEA has generally not been allowed access to Census records. Without going into the arcane detail, whether BEA has access to corporate Census records that are commingled with tax data is determined by the extent to which the Census Bureau claims that data are based on their own collection and not IRS records. Such a claim is generally made by the Census Bureau in the case of multiunit establishments. Thus BEA cannot access Census Bureau records from single-unit establishments. Finally, because legislation limits BEA access to corporate tax records, BEA cannot access partnership and sole proprietor Census Bureau records, which are collected from tax data–based sample frames.
The limited access to tax data also impedes BEA’s use of the Census records to construct sample frames for its international surveys. The impediment is especially problematic in the services area, because many of these providers are not multiunit establishments. In a joint effort by BEA, Census, and the National Science Foundation (NSF) regarding identifying international research and development expenditures, it was discovered that there was considerable difference between Census and BEA sample frames. In this case, BEA had identified many firms that were not in the Census Bureau sample.
Below we provide some detailed illustrations of how the absence of data sharing affects BEA estimates. We also discuss how the effect on BEA estimates would affect policy decisions that are based on those estimates.
Industry Employment Differences
BLS, the Census Bureau, and SOI are the main sources of wage and salary data in the U.S. economy. Figures 7-1 and 7-2 show that the levels and growth of total payroll according to these sources are broadly consistent, but that there are significant differences in magnitudes. Below we focus on the BLS and the Census Bureau data, as those are the two main sources used by BEA.1
BLS prepares comprehensive wage and salary data in its Quarterly
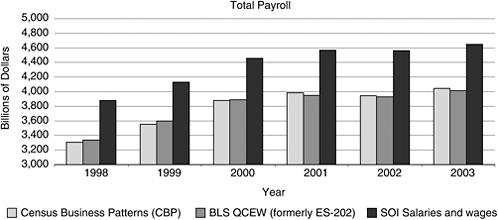
FIGURE 7-1 Payroll data comparison—the Census Bureau, BLS, and SOI levels.
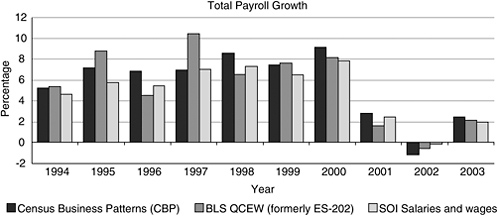
FIGURE 7-2 Payroll data comparison—the Census Bureau, BLS, and SOI growth.
Census of Employment and Wages Program (QCEW).2 These data are widely used in BEA and are the basis for the wage and salary component of personal income. The Census Bureau also prepares payroll data as part of its Quinquennial Economic Census and Annual Survey programs. These Census data are considered to be less timely than BLS data, but in some areas, such as educational services, membership organizations, and nonprofits, they are considered to be more complete than the QCEW data.
In addition, Census data on wages are generally recognized as providing a better industry distribution of aggregate wages, and incorporating these data into BEA estimates offers a unique opportunity to create greater consistency among the BEA industry accounts’ measures of gross output, intermediate inputs, and value added. The decision, however, to choose one set of data over the other has implications for the measurement of value added in the industry accounts, which can be traced out through examining the estimates prepared as part of the annual industry accounts.
For some industries, the differences in the level of employment are significant. Table 7-2 identifies the differences in levels between BLS and the Census wage and salary data for 2002, an economic census year.3 The primary explanations for the differences are that the Census Bureau and BLS have different sample frames of establishments and that establishments in both frames are not always classified in the same industry. The Census Bureau and BLS are currently engaged in a project that seeks to study this source of difference and explore other sources of differences. Before this project could be undertaken, approval from the IRS had to be obtained. The presentation at the workshop by James Spletzer (BLS) and Paul Hanczaryk (Census Bureau) provided details of the study (see Chapter 2 of this volume).
As shown in Table 7-2, there are many relatively large differences among industries in which estimates are available from both BLS and the Census Bureau. In the case of oil and gas extraction, the Census payroll estimate is about 50 percent lower than the BLS estimate. In addition, the Census Bureau estimate for all of manufacturing is about 15 percent—or roughly $100 billion—lower than the BLS estimate. In contrast, Census payroll estimate for management of companies and enterprises is about 63 percent—or over $70 billion—higher than the BLS estimate.4
Because employment and wage data are used in several places in the national accounts, we will now show how BEA estimates would be different if the Census data were used instead of the currently used BLS data for manufacturing and a few other industries in the computation of value-added. Although the current-dollar growth rate could change by as much as 2.0 percentage points (e.g., computers and electronic products), Table 7-3 shows the relative rankings for the selected industries tended to be relatively stable.
TABLE 7-2 Differences in BLS Wages and the Census Bureau Payroll by NAICS Industry, 2002 (in thousands of dollars)
|
1997 NAICS Codes |
Industry Name |
BEA Wagesa |
|
|
All Industries |
4,968,131,000 |
|
|
Private industries |
4,119,730,000 |
|
11 |
Agriculture, forestry, fishing, and hunting |
31,815,000 |
|
111, 112 |
Crop and animal production (“Farms”) |
17,685,000 |
|
113, 114, 115 |
Forestry, fishing, and related activities |
14,130,000 |
|
21 |
Mining |
30,788,000 |
|
211 |
Oil and gas extraction |
11,455,000 |
|
212 |
Mining, except oil and gas |
10,470,000 |
|
213 |
Support activities for mining |
8,863,000 |
|
22 |
Utilities |
40,094,000 |
|
23 |
Construction |
272,418,000 |
|
31, 32, 33 |
Manufacturing |
675,523,000 |
|
33, 321, 327 |
Durable goods |
441,182,000 |
|
321 |
Wood product manufacturing |
17,585,000 |
|
327 |
Nonmetallic mineral product manufacturing |
20,674,000 |
|
331 |
Primary metal manufacturing |
23,209,000 |
|
332 |
Fabricated metal product manufacturing |
59,742,000 |
|
333 |
Machinery manufacturing |
57,050,000 |
|
334 |
Computer and electronic product manufacturing |
98,359,000 |
|
335 |
Electrical equipment and appliance manufacturing |
20,630,000 |
|
3361, 3362, 3363 |
Motor vehicle, body, trailer, and parts manufacturing |
58,705,000 |
|
3364, 3365, 3366, 3369 |
Other transportation equipment manufacturing |
38,954,000 |
|
337 |
Furniture and related product manufacturing |
18,232,000 |
|
339 |
Miscellaneous manufacturing |
28,042,000 |
|
31, 32 (excluding 321 and 327) |
Nondurable goods |
234,341,000 |
|
311 ,312 |
Food product manufacturing |
60,356,000 |
|
313, 314 |
Textile and textile product mills |
14,525,000 |
|
315,316 |
Apparel manufacturing |
10,751,000 |
|
322 |
Paper manufacturing |
25,611,000 |
|
323 |
Printing and related support activities |
27,061,000 |
|
324 |
Petroleum and coal products manufacturing |
7,632,000 |
|
325 |
Chemical manufacturing |
57,293,000 |
|
326 |
Plastics and rubber products manufacturing |
31,112,000 |
|
42 |
Wholesale trade |
280,745,000 |
|
44, 45 |
Retail trade |
360,341,000 |
|
48, 49 |
Transportation and warehousing, excluding postal service |
162,206,000 |
|
481 |
Air transportation |
30,550,000 |
|
482 |
Rail transportation |
11,824,000 |
|
483 |
Water transportation |
2,888,000 |
|
484 |
Truck transportation |
47,917,000 |
|
|
|
Percent Differenced |
|
|
|
BLS Wagesb |
Census Payrollc |
BEA and Census |
BLS and Census |
BLS and Census Differencee |
|
|
|
— |
— |
|
|
3,923,090,541 |
|
— |
— |
|
|
24,146,183 |
|
— |
— |
|
|
15,862,753 |
|
— |
— |
|
|
8,283,429 |
|
— |
— |
|
|
30,557,227 |
|
— |
— |
|
|
11,269,829 |
5,564,811 |
–51.4 |
–50.6 |
–5,705,018 |
|
10,321,353 |
8,987,397 |
–14.2 |
–12.9 |
–1,333,956 |
|
8,966,044 |
6,707,242 |
–24.3 |
–25.2 |
–2,258,802 |
|
39,895,551 |
43,493,804 |
8.5 |
9.0 |
3,598,253 |
|
260,841,814 |
254,000,182 |
–6.8 |
–2.6 |
|
|
670,676,772 |
573,401,510 |
–15.1 |
–14.5 |
–97,275,262 |
|
437,547,486 |
370,407,941 |
–16.0 |
–15.3 |
–67,139,545 |
|
16,952,331 |
15,909,908 |
–9.5 |
–6.1 |
–1,042,423 |
|
20,543,618 |
17,933,376 |
–13.3 |
–12.7 |
–2,610,242 |
|
23,246,080 |
21,508,667 |
–7.3 |
–7.5 |
–1,737,413 |
|
59,352,280 |
57,361,374 |
–4.0 |
–3.4 |
–1,990,906 |
|
56,689,509 |
49,470,768 |
–13.3 |
–12.7 |
–7,218,741 |
|
98,045,569 |
64,314,150 |
–34.6 |
–34.4 |
–33,731,419 |
|
20,479,516 |
17,957,015 |
–13.0 |
–12.3 |
–2,522,501 |
|
58,579,129 |
50,331,680 |
–14.3 |
–14.1 |
–8,247,449 |
|
38,446,534 |
31,231,174 |
–19.8 |
–18.8 |
–7,215,360 |
|
18,107,133 |
17,364,837 |
–4.8 |
–4.1 |
–742,296 |
|
27,105,787 |
27,024,992 |
–3.6 |
–0.3 |
–80,795 |
|
233,129,286 |
202,993,569 |
–13.4 |
–12.9 |
–30,135,717 |
|
59,649,421 |
52,334,562 |
–13.3 |
–12.3 |
–7,314,859 |
|
14,501,506 |
12,333,814 |
–15.1 |
–14.9 |
–2,167,692 |
|
10,360,588 |
8,567,969 |
–20.3 |
–17.3 |
–1,792,619 |
|
25,744,232 |
21,336,257 |
–16.7 |
–17.1 |
–4,407,975 |
|
26,457,610 |
25,738,613 |
–4.9 |
–2.7 |
–718,997 |
|
7,891,082 |
6,202,508 |
–18.7 |
–21.4 |
–1,688,574 |
|
57,322,150 |
44,032,801 |
–23.1 |
–23.2 |
–13,289,349 |
|
31,202,697 |
32,447,045 |
4.3 |
4.0 |
1,244,348 |
|
276,607,852 |
249,986,560 |
–11.0 |
–9.6 |
–26,621,292 |
|
348,909,029 |
296,215,722 |
–17.8 |
–15.1 |
–52,693,307 |
|
146,810,674 |
|
— |
— |
–146,810,674 |
|
30,180,386 |
|
— |
— |
–30,180,386 |
|
10,869 |
|
— |
— |
–10,869 |
|
2,793,556 |
3,031,880 |
5.0 |
8.5 |
238,324 |
|
46,824,531 |
47,833,730 |
–0.2 |
2.2 |
1,009,199 |
|
1997 NAICS Codes |
Industry Name |
BEA Wagesa |
|
485 |
Transit and ground passenger transportation |
8,996,000 |
|
486 |
Pipeline transportation |
3,272,000 |
|
487, 488, 492 |
Other transportation and support activities |
39,802,000 |
|
493 |
Warehousing and storage |
16,957,000 |
|
51 |
Information |
189,736,000 |
|
511 |
Publishing including software |
58,394,000 |
|
512 |
Motion picture and sound recording industries |
18,258,000 |
|
513 |
Broadcasting and telecommunications |
84,838,000 |
|
514 |
Information and data processing services |
28,246,000 |
|
52 |
Finance and insurance |
370,088,000 |
|
521, 522 |
Federal Reserve banks, credit intermediation and related services |
132,010,000 |
|
523 |
Securities, commodity contracts, investments |
112,344,000 |
|
524 |
Insurance carriers and related activities |
119,830,000 |
|
525 |
Funds, trusts, and other financial vehicles |
5,904,000 |
|
53 |
Real estate, rental, and leasing |
71,785,000 |
|
531 |
Real estate |
51,015,000 |
|
532,533 |
Rental and leasing services and lessors of intangible assets |
20,770,000 |
|
54 |
Professional and technical services |
415,422,000 |
|
5411 |
Legal services |
80,297,000 |
|
5415 |
Computer systems design and related services |
84,251,000 |
|
5412-5414, 5416-5419 |
Other professional, scientific and technical services |
250,874,000 |
|
55 |
Management of companies and enterprises |
117,147,000 |
|
56 |
Administrative and waste services |
193,525,000 |
|
561 |
Administrative and support services |
180,230,000 |
|
562 |
Waste management and remediation services |
13,295,000 |
|
61 |
Educational services |
74,446,000 |
|
62 |
Health care and social assistance |
472,214,000 |
|
621 |
Ambulatory health care services |
209,724,000 |
|
622, 623 |
Hospitals and nursing and residential care facilities |
217,119,000 |
|
624 |
Social assistance |
45,371,000 |
|
71 |
Arts, entertainment, and recreation |
51,526,000 |
|
711, 712 |
Performing arts, museums, and related activities |
24,724,000 |
|
713 |
Amusements, gambling, and recreation |
26,802,000 |
|
72 |
Accommodation and food services |
153,922,000 |
|
721 |
Accommodation |
40,764,000 |
|
722 |
Food services and drinking places |
113,158,000 |
|
|
|
Percent Differenced |
BLS and Census Differencee |
|
|
BLS Wagesb |
Census Payrollc |
BEA and Census |
BLS and Census |
|
|
7,787,298 |
7,575,497 |
–15.8 |
–2.7 |
–211,801 |
|
3,277,932 |
3,082,558 |
–5.8 |
–6.0 |
–195,374 |
|
39,101,445 |
34,489,516 |
–13.3 |
–11.8 |
–4,611,929 |
|
16,834,658 |
18,689,122 |
10.2 |
11.0 |
1,854,464 |
|
188,758,526 |
|
— |
— |
–188,758,526 |
|
58,307,089 |
64,712,028 |
10.8 |
11.0 |
6,404,939 |
|
17,879,785 |
12,516,040 |
–31.4 |
–30.0 |
–5,363,745 |
|
84,664,461 |
88,624,463 |
4.5 |
4.7 |
3,960,002 |
|
27,907,191 |
27,686,444 |
–2.0 |
–0.8 |
–220,747 |
|
356,371,058 |
|
— |
— |
–356,371,058 |
|
131,188,066 |
124,076,870 |
–6.0 |
–5.4 |
–7,111,196 |
|
108,325,327 |
101,285,387 |
–9.8 |
–6.5 |
–7,039,940 |
|
110,965,984 |
120,683,183 |
0.7 |
8.8 |
9,717,199 |
|
5,891,681 |
|
— |
— |
–5,891,681 |
|
68,801,129 |
|
— |
— |
–68,801,129 |
|
48,110,832 |
41,911,444 |
–17.8 |
–12.9 |
–6,199,388 |
|
20,690,296 |
18,706,319 |
–9.9 |
–9.6 |
–1,983,977 |
|
390,450,138 |
|
— |
— |
–390,450,138 |
|
69,875,728 |
69,939,404 |
–12.9 |
0.1 |
63,676 |
|
83,897,952 |
72,168,495 |
–14.3 |
–14.0 |
–11,729,457 |
|
236,676,458 |
|
— |
— |
–236,676,458 |
|
117,462,176 |
190,807,531 |
62.9 |
62.4 |
73,345,355 |
|
191,825,310 |
|
— |
— |
–191,825,310 |
|
178,563,429 |
195,425,035 |
8.4 |
9.4 |
16,861,606 |
|
13,261,881 |
12,178,484 |
–8.4 |
–8.2 |
–1,083,397 |
|
64,700,545 |
|
— |
— |
–64,700,545 |
|
456,030,369 |
|
— |
— |
–456,030,369 |
|
204,320,753 |
203,716,200 |
–2.9 |
–0.3 |
–604,553 |
|
215,390,850 |
212,480,514 |
–2.1 |
–1.4 |
–2,910,336 |
|
36,318,766 |
36,090,970 |
–20.5 |
–0.6 |
–227,796 |
|
47,050,671 |
|
— |
— |
–47,050,671 |
|
24,652,961 |
24,057,801 |
–2.7 |
–2.4 |
–595,160 |
|
22,397,710 |
21,069,716 |
–21.4 |
–5.9 |
–1,327,994 |
|
142,208,429 |
|
— |
— |
–142,208,429 |
|
36,805,629 |
34,874,261 |
–14.4 |
–5.2 |
–1,931,368 |
|
105,402,801 |
92,632,794 |
–18.1 |
–12.1 |
–12,770,007 |
|
1997 NAICS Codes |
Industry Name |
BEA Wagesa |
|
81 |
Other services, except government |
155,989,000 |
|
|
Government |
848,401,000 |
|
|
Federal civilian |
141,631,000 |
|
|
Federal military |
59,529,000 |
|
|
State and local |
647,241,000 |
|
NOTE: Census payroll data are from the U.S. Census Bureau web site as of April 1, 2005. BLS wage data are consistent with the 2004 annual revision of the national income and product accounts and the 2004 annual revision of the annual industry accounts. aWage and salary disbursements consists of the monetary remuneration of employees, including corporate officers salaries and bonuses, commissions, pay-in-kind, incentive payments, and tips. It reflects the amount of payments disbursed, but not necessarily earned during the year. Wage and salary disbursements are measured before deductions, such as social security contributions and union dues. In recent years, stock options have become a point of discussion. Personal income includes stock options of nonqualified plans at the time that they have been exercised by the individual. Stock options are reported in wage and salary disbursements. The value that is included in wages is the difference between the exercise price and the price that the stock options were granted. |
||
Estimates of value-added in the annual industry accounts are prepared in a two-part process. First, three-digit North American Industry Classification System (NAICS) industry estimates are controlled to the national income and product accounts for compensation of employees and “taxes on production and imports less subsidies,” and initial estimates of gross operating surplus are extrapolated from the most recent set of “balanced” gross operating surplus estimates.5 Second, these three-digit NAICS industry controls are distributed to greater industry detail in the annual input-output tables through a two-step process. Detailed industry levels are extrapolated using QCEW data for compensation, and “taxes less subsidies” and gross operating surplus are extrapolated using detailed gross output estimates. Then all three components are scaled back to the three-digit controls. Extrapolation of industry detail for compensation could result in differences in shares depending on the choice to use
|
|
|
Percent Differenced |
BLS and Census Differencee |
|
|
BLS Wagesb |
Census Payrollc |
BEA and Census |
BLS and Census |
|
|
100,987,088 |
|
— |
— |
–100,987,088 |
|
|
|
— |
— |
0 |
|
|
|
— |
— |
0 |
|
|
|
— |
— |
0 |
|
|
|
— |
— |
0 |
|
bReported quarterly total wages are the wages paid by Unemployment Insurance covered employers during the calendar quarter, regardless of when the services were performed. Reported total annual wages are the sum of the total wages reported for the corresponding quarters. cPayroll includes all forms of compensation, such as salaries, wages, commissions, dismissal pay, bonuses, vacation allowances, sick-leave pay, and employee contributions, to qualified pension plans paid during the year to all employees. For corporations, payroll includes amounts paid to officers and executives; for unincorporated businesses, it does not include profit or other compensation of proprietors or partners. Payroll is reported before deductions for social security, income tax, insurance, union dues, etc. This definition of payroll is the same as that used by the IRS on Form 941. dComputed as Census Payroll less BLS wages, divided by BLS wages. eComputed as Census Payroll less BLS wages. |
||||
QCEW or the Census data. Again, these differences would be the largest for detailed industries in which the magnitude of the difference is the greatest.
The employment differences also have an impact on the computation of chain-type quantity indexes, real value-added by industry, and contributions to real growth. To measure the impact, BEA’s double-deflation method for preparing real value-added for the industry accounts was simulated to incorporate different nominal value-added levels, and then the resulting impact on the real value-added estimates was examined. For this exercise, three-digit NAICS industry estimates for value-added were allowed to increase (decrease) by the difference in wage data between BLS and the Census Bureau, and new levels of nominal intermediate inputs were computed as the difference between published gross output by industry and the simulated value-added by industry. Next, the new intermediate input levels were deflated by the published price indexes for intermediate inputs to produce real intermediate inputs. Finally, real value-added by industry was computed as the difference between published real gross output by industry and real intermediate inputs by industry.
The choice of wage data affects the resulting change in real value-
TABLE 7-3 Differences in Current-Dollar Value-Added Growth by Manufacturing Industries and for ICT-Producing Industries Combined, 2002
|
|
|
2002 |
|||
|
1997 NAICS Code |
Industry |
Published |
Simulated |
Published Rank |
Simulated Rank |
|
31, 32, 33 |
Manufacturing |
0.4 |
0.7 |
|
|
|
33, 321, 327 |
Durable goods |
–0.9 |
–0.4 |
|
|
|
321 |
Wood product manufacturing |
–4.2 |
–4.4 |
15 |
16 |
|
327 |
Nonmetallic mineral product manufacturing |
–3.5 |
–3.7 |
14 |
15 |
|
331 |
Primary metal manufacturing |
1.2 |
1.7 |
8 |
8 |
|
332 |
Fabricated metal product manufacturing |
–2.4 |
–2.3 |
13 |
13 |
|
333 |
Machinery manufacturing |
–5.4 |
–5.4 |
17 |
17 |
|
334 |
Computer and electronic product manufacturing |
–4.7 |
–2.7 |
16 |
14 |
|
335 |
Electrical equipment and appliance manufacturing |
–6.2 |
–6.3 |
18 |
18 |
|
3361, 3362, 3363 |
Motor vehicle, body, trailer, and parts manufacturing |
10.0 |
10.2 |
1 |
1 |
|
3364, 3365, 3366, 3369 |
Other transportation equipment manufacturing |
1.1 |
0.8 |
9 |
9 |
|
337 |
Furniture and related product manufacturing |
–0.7 |
–0.6 |
10 |
10 |
|
339 |
Miscellaneous manufacturing |
3.9 |
3.9 |
5 |
5 |
|
31, 32 (excluding 321 and 327) |
Nondurable goods |
2.3 |
2.1 |
|
|
|
|
|
|
|
|
|
|
311, 312 |
Food product manufacturing |
3.2 |
3.1 |
7 |
7 |
|
313, 314 |
Textile and textile product mills |
–1.8 |
–1.6 |
11 |
11 |
|
315, 316 |
Apparel manufacturing |
8.6 |
10.2 |
2 |
1 |
|
322 |
Paper manufacturing |
3.8 |
3.9 |
6 |
5 |
|
323 |
Printing and related support activities |
–1.8 |
–1.8 |
11 |
12 |
|
324 |
Petroleum and coal products manufacturing |
–23.1 |
–24.9 |
19 |
19 |
|
325 |
Chemical manufacturing |
6.2 |
6.0 |
3 |
3 |
|
326 |
Plastics and rubber products manufacturing |
4.5 |
4.4 |
4 |
4 |
|
|
Addenda: |
|
|
|
|
|
|
ICT-producing industriesa |
–2.3 |
–1.4 |
|
|
|
NOTE: The 3-digit NAICS industry estimates for value added were allowed to increase (decrease) by the difference in wage data between BLS and the Census Bureau. Estimates were simulated based on data published as part of the 2004 annual revision to the annual industry accounts. aConsists of computer and electronic products; publishing industries (includes software); information and data processing services; and computer systems design and related services. |
|||||
TABLE 7-4 Differences in Real Value-Added Growth by Manufacturing Industries and for ICT-Producing Industries Combined, 2002
|
|
|
2002 |
||||
|
1997 NAICS Code |
Industry |
Simulated |
Published |
Published Rank |
Simulated Rank |
|
|
31, 32, 33 |
Manufacturing |
2.3 |
2.8 |
|
|
|
|
33, 321, 327 |
Durable goods |
1.3 |
2.0 |
|
|
|
|
321 |
Wood product manufacturing |
–3.2 |
–3.4 |
16 |
16 |
|
|
327 |
Nonmetallic mineral product manufacturing |
–5.2 |
–5.4 |
18 |
18 |
|
|
331 |
Primary metal manufacturing |
1.0 |
1.5 |
9 |
8 |
|
|
332 |
Fabricated metal product manufacturing |
–2.9 |
–2.9 |
14 |
14 |
|
|
333 |
Machinery manufacturing |
–5.9 |
–6.0 |
19 |
19 |
|
|
334 |
Computer and electronic product manufacturing |
7.4 |
15.6 |
4 |
3 |
|
|
335 |
Electrical equipment and appliance manufacturing |
–4.4 |
–4.2 |
17 |
17 |
|
|
3361, 3362, 3363 |
Motor vehicle, body, trailer, and parts manufacturing |
15.0 |
16.0 |
2 |
2 |
|
|
3364, 3365, 3366, 3369 |
Other transportation equipment manufacturing |
–1.1 |
–1.5 |
11 |
11 |
|
|
337 |
Furniture and related product manufacturing |
–3.1 |
–3.2 |
15 |
15 |
|
|
339 |
Miscellaneous manufacturing |
1.1 |
1.1 |
8 |
10 |
|
|
31, 32 (excluding 321 and 327) |
Nondurable goods |
3.7 |
3.8 |
|
|
|
|
|
|
|
|
|
||
|
311, 312 |
Food product manufacturing |
–1.9 |
–2.5 |
12 |
13 |
|
|
313, 314 |
Textile and textile product mills |
0.7 |
1.2 |
10 |
9 |
|
|
315, 316 |
Apparel manufacturing |
10.1 |
11.8 |
3 |
4 |
|
|
322 |
Paper manufacturing |
5.2 |
5.2 |
6 |
6 |
|
|
323 |
Printing and related support activities |
–2.3 |
–2.3 |
13 |
12 |
|
|
324 |
Petroleum and coal products manufacturing |
31.6 |
34.6 |
1 |
1 |
|
|
325 |
Chemical manufacturing |
6.6 |
7.1 |
5 |
5 |
|
|
326 |
Plastics and rubber products manufacturing |
3.5 |
3.4 |
7 |
7 |
|
|
|
Addenda: |
|
|
|
|
|
|
|
ICT-producing industriesa |
2.0 |
3.6 |
|
|
|
|
NOTE: BEA’s double-deflation methodology for preparing real value added for the industry accounts was simulated to incorporate different nominal value-added levels and then the attending impact on the real value added was examined. For this exercise, three-digit NAICS industry estimates for value added were allowed to increase (decrease) by the difference in wage data between BLS and the Census Bureau, and new levels of nominal intermediate inputs were computed as the difference between published gross output by industry and the simulated value added by industry. Estimates were simulated based on data published as part of the 2004 annual revision to the annual industry accounts. aConsists of computer and electronic products; publishing industries (includes software); information and data processing services; and computer systems design and related services. |
||||||
added for an industry. In general, the impact is greatest for industries with the largest differences in BLS-Census payroll levels. For example, real value-added for computer and electronic products would double that of the published estimates (15.6 versus 7.4 percent) if the 2002 Census rather than BLS payroll data had been used (see Table 7-4). This impact on the real value-added growth for computers would have resulted in a different story for the recovery of manufacturing in 2002: the published estimates show real growth for manufacturing increasing 2.3 percent; the simulated estimates result in a 2.8 percent real growth. In addition, the real value-added growth for the ICT-related industries6 would have increased by 3.6 percent in 2002, or 1.6 percentage points over the published estimate, if BEA used the Census Bureau payroll data. The shifts in the industry distribution of real value-added growth shown in Table 7-4 also affect the estimates for contributions to growth and productivity.
In addition, the changing labor and capital shares for an industry that result from the changes in the computation in real value-added would in turn produce changes in the weighting of each industry’s value-added price index. An industry’s value-added price index represents the prices of its primary factors of production. Thus, the industry’s price index and the current-dollar components of its value-added can be used to assess the contribution of each component to the value-added price index. To illustrate, suppose that the Census payroll data were used in place of the BLS wages in preparing a measure of current-dollar value-added for the oil and gas extraction industry. Compensation of employees would fall by the amount of the difference in wage data or by approximately 50 percent (see Table 7-2), thereby reducing current-dollar value-added by the difference between the two wage measures. Thus, compensation of employees as a percentage of current-dollar value-added for the oil and gas extraction industry would fall from approximately 19 to 13 percent, and gross operating surplus would rise from approximately 66 to 72 percent, thereby increasing the cost of capital.7
In the annual industry accounts, value-added unit costs are computed by dividing current-dollar value-added and its components by real (chained-dollar) value-added. The resulting quotients provide the value-
|
6 |
Consists of computer and electronic products; publishing industries (includes software); information and data processing services; and computer systems design and related services. |
|
7 |
Shares of current-dollar value-added were computed from the data in Table 7-2 and from published data on current-dollar value-added by industry found in the GDP-by-industry accounts. The published current-dollar data are available on the BEA web site, at http://www.bea.gov/bea/dn2/gdpbyind_data.htm. Choose the GDPbyInd_VA_NAICS.xls file under the header “1998-2004 NAICS data.” |
added chain-type price indexes and the component price indexes. That is, unit cost measures provide estimates of a component’s share of the value-added price index for an industry. The changes in the share for unit labor costs, reflected by the change in compensation of employees and for unit capital costs and embedded in the change in gross operating surplus, will have an impact on the value-added unit costs as well.8 The reason is that value-added unit costs attribute changes in the value-added unit prices to the components of value-added in proportion to the component’s share of current-dollar value-added. As a result, year-to-year changes in component shares of current-dollar value-added result in changes in the contributions of the cost components to value-added prices even if the prices do not change.
Table 7-5 presents ratios of gross output, as measured by BEA, to the different measures of employment. The data for gross output come from the preliminary 2002 benchmark input-output accounts instead of the GDP-by-industry measures used above. Also, the Census employment data are of a different vintage: data are as of October instead of the April data used in the other tables. In general, the absolute value of the difference between the NIPA ratio and the Census ratio exceeds that of the NIPA ratio and the BLS ratio. In addition, there are several industries for which there is a sign difference. If these ratios are viewed as indicators of industry productivity, one would tell different stories for many industries. However, comparisons of the rankings of industries by the ratio reveal that there are no substantive differences between them; that is, the rankings differ by several places, but the top and the bottom of the rankings contain similar industries.
Analysis of Impact on Regional Estimates
The choice of wage data affects the analysis of state economic activity. At the state level the range of differences in total private wages and salaries in 2003 vary from BLS being 4.2 percent higher in New Mexico to 9.5 percent lower in Alaska than what is reported by the Census Bureau in its County Business Patterns (CBP) data (see Table 7-6). Although the U.S. level of BLS wages is lower by only 0.6 percent, or $25.1 billion, New York’s BLS data is lower than the Census data by 2.0 percent, or $6.7 billion, and the combination of Connecticut, New Jersey, and New York is lower than the Census by $13.0 billion.
The differences between the two programs have implications for
TABLE 7-5 Employment Data and Ratios from the BEA, Census, and BLS, 2002
|
2002 NAICS Code |
Industry Name |
BEA Gross Output (billions of dollars)a |
|
11 |
Agriculture, forestry, fishing, and hunting |
270.6 |
|
111-112 |
Farms |
220.4 |
|
113-115 |
Forestry, fishing, and related activities |
50.1 |
|
21 |
Mining |
179.1 |
|
211 |
Oil and gas extraction |
103.7 |
|
212 |
Mining, except oil and gas |
48.0 |
|
213 |
Support activities for mining |
27.4 |
|
22 |
Utilities |
314.7 |
|
23 |
Construction |
909.2 |
|
31-33 |
Manufacturing |
3,839.2 |
|
321, 327, 331-335, 3361-3366, 3369, 337, 339 |
Durable goods |
2,080.5 |
|
321 |
Wood products |
87.5 |
|
327 |
Nonmetallic mineral products |
93.0 |
|
331 |
Primary metals |
138.2 |
|
332 |
Fabricated metal products |
243.4 |
|
333 |
Machinery |
241.2 |
|
334 |
Computer and electronic products |
353.2 |
|
335 |
Electrical equipment, appliances, and components |
100.5 |
|
3361-3363 |
Motor vehicles, bodies and trailers, and parts |
463.6 |
|
3364-3366, 3369 |
Other transportation equipment |
162.8 |
|
337 |
Furniture and related products |
74.2 |
|
339 |
Miscellaneous manufacturing |
122.7 |
|
311-316, 322-326 |
Nondurable goods |
1,758.7 |
|
311-312 |
Food and beverage and tobacco products |
562.3 |
|
313-314 |
Textile mills and textile product mills |
75.2 |
|
315-316 |
Apparel and leather and allied products |
47.7 |
|
322 |
Paper products |
151.8 |
|
323 |
Printing and related support activities |
94.7 |
|
324 |
Petroleum and coal products |
212.4 |
|
325 |
Chemical products |
444.8 |
|
326 |
Plastics and rubber products |
169.8 |
|
42 |
Wholesale trade |
866.6 |
|
44-45 |
Retail trade |
1,046.0 |
|
48-49 |
Transportation and warehousing |
603.6 |
|
481 |
Air transportation |
98.1 |
|
482 |
Rail transportation |
45.5 |
|
483 |
Water transportation |
23.7 |
|
484 |
Truck transportation |
202.3 |
|
485 |
Transit and ground passenger transportation |
31.6 |
|
486 |
Pipeline transportation |
28.0 |
|
487-488, 492 |
Other transportation and support activities |
129.9 |
|
493 |
Warehousing and storage |
44.5 |
|
NIPA Employmentb |
Census Employmentc |
BLS Employmentd |
NIPA Ratio |
Census Ratio |
BLS Ratio |
|
Thousands of Employees |
Output per Employee in Dollars |
||||
|
1,564 |
N/A |
N/A |
173,018 |
N/A |
N/A |
|
870 |
N/A |
N/A |
253,333 |
N/A |
N/A |
|
694 |
N/A |
N/A |
72,190 |
N/A |
N/A |
|
511 |
485 |
507 |
350,489 |
369,548 |
353,411 |
|
124 |
105 |
121 |
836,290 |
991,595 |
853,547 |
|
213 |
197 |
210 |
225,352 |
243,214 |
228,932 |
|
175 |
183 |
176 |
156,571 |
149,964 |
156,025 |
|
594 |
663 |
591 |
529,798 |
474,629 |
532,493 |
|
6,978 |
7,374 |
6,694 |
130,295 |
123,306 |
135,822 |
|
15,349 |
14,693 |
15,218 |
250,127 |
261,299 |
252,280 |
|
9,528 |
9,052 |
9,454 |
218,356 |
229,830 |
220,064 |
|
574 |
540 |
554 |
152,439 |
162,102 |
157,953 |
|
520 |
484 |
517 |
178,846 |
192,311 |
179,816 |
|
506 |
495 |
506 |
273,123 |
279,422 |
273,160 |
|
1,552 |
1,573 |
1,545 |
156,830 |
154,736 |
157,569 |
|
1,229 |
1,164 |
1,221 |
196,257 |
207,158 |
197,561 |
|
1,500 |
1,261 |
1,497 |
235,467 |
280,024 |
235,913 |
|
498 |
492 |
496 |
201,807 |
204,486 |
202,626 |
|
1,153 |
1,088 |
1,152 |
402,082 |
425,957 |
402,594 |
|
679 |
608 |
678 |
239,764 |
267,911 |
240,188 |
|
607 |
596 |
604 |
122,241 |
124,467 |
122,948 |
|
708 |
752 |
685 |
173,305 |
163,151 |
179,020 |
|
5,822 |
5,640 |
5,764 |
302,078 |
311,803 |
305,123 |
|
1,760 |
1,666 |
1,743 |
319,489 |
337,432 |
322,570 |
|
487 |
449 |
484 |
154,415 |
167,639 |
155,416 |
|
419 |
387 |
404 |
113,843 |
123,156 |
118,037 |
|
542 |
488 |
541 |
280,074 |
311,126 |
280,597 |
|
724 |
719 |
706 |
130,801 |
131,795 |
134,088 |
|
117 |
103 |
118 |
1,815,385 |
2,062,617 |
1,798,598 |
|
928 |
846 |
923 |
479,310 |
525,512 |
481,711 |
|
845 |
982 |
844 |
200,947 |
172,862 |
201,176 |
|
5,711 |
5,865 |
5,617 |
151,742 |
147,749 |
154,283 |
|
15,500 |
14,648 |
15,012 |
67,484 |
71,411 |
69,677 |
|
4,265 |
N/A |
3,989 |
141,524 |
N/A |
151,329 |
|
562 |
N/A |
561 |
174,555 |
N/A |
174,796 |
|
194 |
N/A |
N/A |
234,536 |
N/A |
N/A |
|
54 |
66 |
53 |
438,889 |
358,260 |
445,757 |
|
1,367 |
1,435 |
1,337 |
147,988 |
140,955 |
151,294 |
|
403 |
398 |
372 |
78,412 |
79,321 |
84,946 |
|
42 |
37 |
42 |
666,667 |
761,076 |
660,673 |
|
1,127 |
1,050 |
1,108 |
115,262 |
123,756 |
117,229 |
|
516 |
566 |
514 |
86,240 |
78,687 |
86,524 |
|
2002 NAICS Code |
Industry Name |
BEA Gross Output (billions of dollars)a |
|
51 |
Information |
956.6 |
|
511 |
Publishing industries (includes software) |
251.3 |
|
512 |
Motion picture and sound recording industries |
81.6 |
|
515-517 |
Broadcasting and telecommunications |
525.6 |
|
518-519 |
Information and data processing services |
98.2 |
|
52-53e |
Finance, insurance, real estate, rental, and leasing |
3,358.0 |
|
54-56 |
Professional and business services |
1,838.4 |
|
54 |
Professional, scientific, and technical services |
1,052.1 |
|
5411 |
Legal services |
215.7 |
|
5415 |
Computer systems design and related services |
171.5 |
|
5412-5414, 5416-5419 |
Miscellaneous professional, scientific, and technical services |
664.9 |
|
55 |
Management of companies and enterprises |
297.8 |
|
56 |
Administrative and waste management services |
488.5 |
|
561 |
Administrative and support services |
435.0 |
|
562 |
Waste management and remediation services |
53.5 |
|
61-62 |
Educational services, health care, and social assistance |
1,310.8 |
|
61 |
Educational services |
152.9 |
|
62 |
Health care and social assistance |
1,157.9 |
|
621 |
Ambulatory health care services |
526.8 |
|
622-623 |
Hospitals and nursing and residential care facilities |
523.4 |
|
624 |
Social assistance |
107.7 |
|
71-72 |
Arts, entertainment, recreation, accommodation, and food services |
709.3 |
|
71 |
Arts, entertainment, and recreation |
175.7 |
|
711-712 |
Performing arts, spectator sports, museums, and related activities |
82.3 |
|
713 |
Amusements, gambling, and recreation industries |
93.4 |
|
72 |
Accommodation and food services |
533.6 |
|
721 |
Accommodation |
143.7 |
|
722 |
Food services and drinking places |
389.9 |
|
81 |
Other services, except government |
452.7 |
|
aGross output data were obtained from the BEa web site at the following address: http://www.bea.gov/bea/dn2/i-o_benchmark_2002.htm (October 7, 2005). bData were obtained from the NIPA tables at the BEA web site at the following address: http://www.bea.gov/bea/dn/nipaweb/TableView.asp#Mid (October 7, 2005). cData were obtained from the U.S. Census Bureau web site at the following address: http://www.census.gov/econ/census02/data/us/US000.HTM (October 7, 2005). dData were obtained from the BLS’ Quarterly Census of Employment and Wages (October 12, 2005). |
||
|
NIPA Employmentb |
Census Employmentc |
BLS Employmentd |
NIPA Ratio |
Census Ratio |
BLS Ratio |
|
Thousands of Employees |
Output per Employee in Dollars |
||||
|
3,381 |
3,736 |
3,359 |
282,934 |
256,045 |
284,821 |
|
998 |
1,090 |
961 |
251,804 |
230,638 |
261,548 |
|
393 |
303 |
385 |
207,634 |
269,176 |
211,980 |
|
1,507 |
1,772 |
1,534 |
348,772 |
296,694 |
342,739 |
|
484 |
572 |
479 |
202,893 |
171,737 |
204,877 |
|
7,999 |
8,546 |
7,724 |
419,803 |
392,955 |
434,753 |
|
16,418 |
18,649 |
15,926 |
111,975 |
98,578 |
115,434 |
|
7,103 |
7,302 |
6,662 |
148,121 |
144,084 |
157,915 |
|
1,279 |
1,170 |
1,116 |
168,647 |
184,422 |
193,209 |
|
1,148 |
1,107 |
1,144 |
149,390 |
154,874 |
149,851 |
|
4,676 |
5,025 |
4,402 |
142,194 |
132,318 |
151,059 |
|
1,685 |
2,605 |
1,682 |
176,736 |
114,306 |
177,041 |
|
7,630 |
8,742 |
7,581 |
64,024 |
55,881 |
64,434 |
|
7,311 |
8,410 |
7,264 |
59,499 |
51,724 |
59,887 |
|
319 |
332 |
318 |
167,712 |
161,232 |
168,376 |
|
16,752 |
N/A |
15,353 |
78,247 |
N/A |
85,375 |
|
2,709 |
N/A |
1,961 |
56,442 |
N/A |
77,985 |
|
14,043 |
14,010 |
13,393 |
82,454 |
82,651 |
86,457 |
|
4,758 |
4,938 |
4,630 |
110,719 |
106,681 |
113,790 |
|
6,893 |
6,965f |
6,846 |
75,932 |
75,141 |
76,448 |
|
2,392 |
2,106 |
1,917 |
45,025 |
51,142 |
56,189 |
|
12,255 |
11,970 |
12,000 |
57,878 |
59,258 |
59,109 |
|
1,910 |
1,849 |
1,802 |
91,990 |
95,041 |
97,528 |
|
495 |
546 |
494 |
166,263 |
150,835 |
166,705 |
|
1,415 |
1,303 |
1,308 |
66,007 |
71,678 |
71,415 |
|
10,345 |
10,121 |
10,198 |
51,581 |
52,722 |
52,322 |
|
1,793 |
1,813 |
1,769 |
80,145 |
79,247 |
81,242 |
|
8,551 |
8,308 |
8,430 |
45,597 |
46,933 |
46,254 |
|
6,859 |
N/A |
4,253 |
66,001 |
N/A |
106,443 |
|
eNot all of the industry entitled “Funds, trusts, and other financial vehicles (525)” is included. The gross output for finance, insurance, and real estate includes the imputation for owner-occupied dwellings which causes higher output to employment ratios. fThe Census Bureau data for hospitals for 2002 include government and nongovernment hospitals. To make data comparable, government hospitals were not included. |
|||||
TABLE 7-6 Census Bureau (CBP) Payroll and BLS (QCEW) Private Wage Comparison (billions of dollars, unless otherwise noted)
|
|
|
|
|
Yr-Yr % Chg |
|
|
|
CBP Annual Payrolla |
2001-2002 |
2002-2003 |
||
|
|
2001 |
2002 |
2003 |
||
|
Alabama |
45.2 |
45.5 |
47.1 |
0.7 |
3.5 |
|
Alaska |
8.3 |
8.4 |
8.7 |
1.2 |
3.0 |
|
Arizona |
60.0 |
61.1 |
64.4 |
1.8 |
5.3 |
|
Arkansas |
25.8 |
25.9 |
27.0 |
0.5 |
4.3 |
|
California |
521.8 |
510.8 |
520.6 |
–2.1 |
1.9 |
|
Colorado |
71.5 |
67.8 |
67.9 |
–5.2 |
0.2 |
|
Connecticut |
68.9 |
68.5 |
69.7 |
–0.6 |
1.8 |
|
Delaware |
15.0 |
14.7 |
15.1 |
–2.0 |
2.5 |
|
D.C. |
20.8 |
21.4 |
22.5 |
2.7 |
5.1 |
|
Florida |
189.6 |
192.9 |
202.4 |
1.7 |
4.9 |
|
Georgia |
115.9 |
113.8 |
116.3 |
–1.9 |
2.2 |
|
Hawaii |
12.7 |
13.4 |
14.1 |
5.3 |
5.9 |
|
Idaho |
12.4 |
12.6 |
13.1 |
1.7 |
4.3 |
|
Illinois |
204.3 |
197.8 |
201.0 |
–3.2 |
1.6 |
|
Indiana |
79.3 |
79.4 |
81.4 |
0.1 |
2.6 |
|
Iowa |
34.5 |
34.8 |
36.0 |
1.1 |
3.4 |
|
Kansas |
33.3 |
33.2 |
34.0 |
–0.5 |
2.7 |
|
Kentucky |
42.6 |
42.5 |
43.8 |
–0.1 |
2.9 |
|
Louisiana |
45.2 |
45.6 |
47.1 |
1.0 |
3.3 |
|
Maine |
14.2 |
14.4 |
14.8 |
1.2 |
2.9 |
|
Maryland |
74.2 |
75.0 |
78.9 |
1.1 |
5.1 |
|
Massachusetts |
134.7 |
127.9 |
127.1 |
–5.0 |
–0.6 |
|
Michigan |
142.9 |
142.4 |
144.0 |
–0.4 |
1.1 |
|
Minnesota |
84.9 |
84.5 |
87.3 |
–0.4 |
3.3 |
|
Mississippi |
22.7 |
22.8 |
23.6 |
0.2 |
3.8 |
|
Missouri |
74.4 |
74.1 |
75.6 |
–0.4 |
2.0 |
|
Montana |
7.2 |
7.4 |
7.7 |
2.8 |
4.0 |
|
Nebraska |
20.8 |
21.7 |
23.1 |
4.4 |
6.2 |
|
Nevada |
27.5 |
29.3 |
31.3 |
6.4 |
6.9 |
|
New Hampshire |
18.5 |
18.7 |
18.8 |
0.9 |
1.0 |
|
New Jersey |
154.2 |
152.4 |
154.5 |
–1.2 |
1.4 |
|
New Mexico |
14.8 |
15.1 |
15.8 |
1.9 |
4.9 |
|
New York |
343.5 |
329.8 |
332.6 |
–4.0 |
0.9 |
|
North Carolina |
103.0 |
101.8 |
104.6 |
–1.2 |
2.7 |
|
North Dakota |
6.4 |
6.6 |
6.9 |
1.8 |
5.3 |
|
Ohio |
156.9 |
154.8 |
157.5 |
–1.3 |
1.7 |
|
Oklahoma |
33.4 |
33.6 |
33.6 |
0.5 |
0.0 |
|
Oregon |
44.1 |
43.5 |
44.3 |
–1.3 |
1.9 |
|
Pennsylvania |
169.9 |
169.2 |
174.5 |
–0.4 |
3.1 |
|
Rhode Island |
13.2 |
13.5 |
14.5 |
3.0 |
7.3 |
|
South Carolina |
43.8 |
44.0 |
44.6 |
0.4 |
1.4 |
|
South Dakota |
7.6 |
7.8 |
8.0 |
1.8 |
2.7 |
|
Tennessee |
70.7 |
71.3 |
73.2 |
0.8 |
2.7 |
|
Texas |
282.3 |
277.8 |
281.6 |
–1.6 |
1.4 |
|
Utah |
26.1 |
26.2 |
26.8 |
0.4 |
2.3 |
|
QCEW Private Wagesb |
||||
|
|
|
|
Yr-Yr % Chg |
|
|
2001 |
2002 |
2003 |
2002 |
2003 |
|
44.9 |
45.6 |
46.8 |
1.6 |
2.8 |
|
7.3 |
7.6 |
7.9 |
3.8 |
3.3 |
|
62.7 |
63.1 |
65.8 |
0.6 |
4.3 |
|
25.5 |
25.9 |
26.5 |
1.9 |
2.2 |
|
518.6 |
508.2 |
521.1 |
–2.0 |
2.5 |
|
71.6 |
68.9 |
69.1 |
–3.7 |
0.3 |
|
68.3 |
66.8 |
68.0 |
–2.2 |
1.9 |
|
13.7 |
13.7 |
14.2 |
0.5 |
3.5 |
|
22.1 |
22.7 |
23.6 |
2.9 |
4.0 |
|
191.0 |
195.7 |
204.5 |
2.4 |
4.5 |
|
116.3 |
114.8 |
116.4 |
–1.2 |
1.3 |
|
13.3 |
13.8 |
14.5 |
3.4 |
5.5 |
|
12.8 |
12.9 |
13.2 |
0.9 |
2.4 |
|
199.2 |
196.8 |
198.3 |
–1.2 |
0.8 |
|
78.9 |
79.6 |
81.1 |
0.9 |
1.8 |
|
34.1 |
34.6 |
35.6 |
1.4 |
2.9 |
|
33.0 |
33.1 |
33.3 |
0.2 |
0.9 |
|
43.3 |
43.8 |
45.1 |
1.1 |
2.8 |
|
44.2 |
44.7 |
45.7 |
1.1 |
2.3 |
|
14.1 |
14.4 |
14.9 |
2.2 |
3.3 |
|
73.4 |
74.9 |
77.7 |
2.1 |
3.7 |
|
130.4 |
126.4 |
127.6 |
–3.0 |
0.9 |
|
144.0 |
143.0 |
145.3 |
–0.7 |
1.6 |
|
82.4 |
83.1 |
85.4 |
0.8 |
2.8 |
|
22.6 |
23.0 |
23.5 |
1.7 |
1.9 |
|
73.2 |
73.7 |
74.7 |
0.7 |
1.4 |
|
7.4 |
7.7 |
8.1 |
4.1 |
4.7 |
|
20.6 |
21.0 |
21.7 |
2.0 |
3.1 |
|
29.7 |
30.3 |
32.6 |
2.2 |
7.5 |
|
19.1 |
19.1 |
19.6 |
0.0 |
2.8 |
|
146.0 |
147.0 |
150.0 |
0.7 |
2.0 |
|
15.6 |
15.9 |
16.5 |
2.5 |
3.6 |
|
334.6 |
322.1 |
325.9 |
–3.7 |
1.2 |
|
101.9 |
101.8 |
103.1 |
–0.1 |
1.2 |
|
6.3 |
6.5 |
6.8 |
2.8 |
4.9 |
|
154.1 |
154.2 |
156.6 |
0.1 |
1.5 |
|
32.3 |
32.2 |
32.8 |
–0.3 |
1.7 |
|
44.0 |
43.7 |
44.5 |
–0.8 |
1.9 |
|
167.5 |
169.0 |
173.4 |
0.9 |
2.6 |
|
13.0 |
13.4 |
14.2 |
3.0 |
5.9 |
|
42.5 |
42.9 |
44.0 |
0.8 |
2.5 |
|
7.5 |
7.6 |
7.9 |
2.4 |
3.5 |
|
70.5 |
71.7 |
73.9 |
1.7 |
2.9 |
|
286.6 |
281.7 |
284.1 |
–1.7 |
0.8 |
|
25.9 |
25.7 |
26.2 |
–0.6 |
1.6 |
|
|
|
|
|
Yr-Yr % Chg |
|
|
|
CBP Annual Payrolla |
2001-2002 |
2002-2003 |
||
|
|
2001 |
2002 |
2003 |
||
|
Vermont |
7.3 |
7.4 |
7.7 |
2.1 |
3.0 |
|
Virginia |
102.5 |
101.7 |
106.1 |
–0.8 |
4.3 |
|
Washington |
86.5 |
83.1 |
90.6 |
–3.9 |
9.0 |
|
West Virginia |
14.5 |
14.8 |
15.2 |
2.3 |
3.0 |
|
Wisconsin |
74.3 |
75.3 |
78.3 |
1.4 |
4.0 |
|
Wyoming |
4.9 |
5.1 |
5.4 |
2.7 |
6.3 |
|
US sum |
3,989.1 |
3,943.2 |
4,040.9 |
–1.2 |
2.5 |
|
US published |
3,989.1 |
3,943.2 |
4,040.9 |
–1.2 |
2.5 |
|
aIn addition to private wages, the CBP payroll data cover those government employees who work in government hospitals, federally chartered savings institutions and credit unions, liquor stores, and wholesale liquor establishments. bThe BLS data do not cover certain religious elementary and secondary schools because a Supreme Court decision exempts some of these schools from unemployment compensation taxes. The BLS data also exclude college students (and their spouses) who are employed by the school in which they are enrolled and student nurses and interns who are employed by hospitals as part of their training. In half of the states, the BLS data only include nonprofit organizations with four or more employees during 20 weeks in a calendar year. Beginning in 2001, BLS classifies all Native American tribal data under local government; previously, commercial establishments were classified as private. |
|||||
|
|
BLS less Census Bureau |
% Difference |
||||
|
|
2001 |
2002 |
2003 |
2001 |
2002 |
2003 |
|
Alabama |
–0.3 |
0.1 |
–0.3 |
–0.7 |
0.2 |
–0.5 |
|
Alaska |
–1.0 |
–0.8 |
–0.8 |
–11.9 |
–9.7 |
–9.5 |
|
Arizona |
2.7 |
2.0 |
1.5 |
4.5 |
3.3 |
2.3 |
|
Arkansas |
–0.3 |
0.0 |
–0.5 |
–1.2 |
0.1 |
–1.9 |
|
California |
–3.2 |
–2.7 |
0.5 |
–0.6 |
–0.5 |
0.1 |
|
Colorado |
0.1 |
1.1 |
1.2 |
0.1 |
1.6 |
1.7 |
|
Connecticut |
–0.6 |
–1.7 |
–1.7 |
–0.9 |
–2.5 |
–2.4 |
|
Delaware |
–1.4 |
–1.0 |
–0.9 |
–9.0 |
–6.7 |
–5.8 |
|
D.C. |
1.3 |
1.3 |
1.2 |
6.1 |
6.3 |
5.2 |
|
Florida |
1.4 |
2.7 |
2.1 |
0.7 |
1.4 |
1.1 |
|
Georgia |
0.3 |
1.1 |
0.1 |
0.3 |
0.9 |
0.0 |
|
Hawaii |
0.6 |
0.4 |
0.4 |
4.9 |
3.0 |
2.7 |
|
Idaho |
0.5 |
0.4 |
0.1 |
3.7 |
2.9 |
1.1 |
|
Illinois |
–5.1 |
–1.0 |
–2.8 |
–2.5 |
–0.5 |
–1.4 |
|
Indiana |
–0.4 |
0.2 |
–0.4 |
–0.5 |
0.3 |
–0.4 |
|
Iowa |
–0.4 |
–0.2 |
–0.4 |
–1.0 |
–0.7 |
–1.1 |
|
QCEW Private Wagesb |
||||
|
|
|
|
Yr-Yr % Chg |
|
|
2001 |
2002 |
2003 |
2002 |
2003 |
|
7.5 |
7.5 |
7.7 |
0.9 |
2.3 |
|
103.2 |
102.4 |
106.3 |
–0.8 |
3.9 |
|
82.6 |
81.8 |
83.5 |
–1.0 |
2.0 |
|
15.1 |
15.2 |
15.4 |
1.0 |
1.0 |
|
73.0 |
74.2 |
76.1 |
1.7 |
2.6 |
|
5.0 |
5.2 |
5.3 |
3.2 |
3.8 |
|
3,952.2 |
3,930.8 |
4,015.8 |
–0.5 |
2.2 |
|
3,952.2 |
3,930.8 |
4,015.8 |
–0.5 |
2.2 |
|
SOURCES: CBP (County Business Patterns) from the Census Bureau web site: 2003 data released 08/05, downloaded 9/28/05. QCEW (Quarterly Census of Employment and Wages) from flat file downloaded from BLS web site on 9/28/05. Fixed decimals. |
||||
|
State and Local Inc Tax as % of Total Wages |
Effective State and Local Tax BLS to Census Bureau Difference (millions of dollars) |
||||
|
2001 |
2002 |
2003 |
2001 |
2002 |
2003 |
|
3.70 |
3.57 |
3.49 |
–11 |
3 |
–9 |
|
0.00 |
0.00 |
0.00 |
0 |
0 |
0 |
|
2.80 |
2.57 |
2.56 |
76 |
52 |
38 |
|
4.89 |
4.68 |
4.53 |
–15 |
2 |
–23 |
|
6.67 |
5.21 |
5.18 |
–211 |
–139 |
25 |
|
3.48 |
3.96 |
3.72 |
2 |
44 |
44 |
|
5.26 |
4.48 |
4.64 |
–34 |
–77 |
–79 |
|
5.02 |
4.47 |
4.43 |
–68 |
–44 |
–39 |
|
2.79 |
2.27 |
2.28 |
36 |
31 |
26 |
|
0.00 |
0.00 |
0.00 |
0 |
0 |
0 |
|
4.78 |
4.46 |
4.44 |
16 |
48 |
3 |
|
5.54 |
5.26 |
4.88 |
34 |
21 |
19 |
|
6.60 |
4.93 |
4.89 |
31 |
18 |
7 |
|
3.05 |
3.17 |
3.06 |
–155 |
–33 |
–84 |
|
4.53 |
4.33 |
4.32 |
–17 |
11 |
–15 |
|
4.53 |
4.24 |
4.15 |
–16 |
–11 |
–17 |
|
|
BLS less Census Bureau |
% Difference |
||||
|
|
2001 |
2002 |
2003 |
2001 |
2002 |
2003 |
|
Kansas |
–0.3 |
–0.1 |
–0.7 |
–0.9 |
–0.3 |
–2.0 |
|
Kentucky |
0.7 |
1.3 |
1.3 |
1.8 |
3.0 |
2.9 |
|
Louisiana |
–0.9 |
–0.9 |
–1.4 |
–2.1 |
–2.0 |
–3.0 |
|
Maine |
–0.1 |
0.0 |
0.1 |
–0.8 |
0.2 |
0.6 |
|
Maryland |
–0.8 |
–0.1 |
–1.2 |
–1.1 |
–0.2 |
–1.5 |
|
Massachusetts |
–4.3 |
–1.5 |
0.5 |
–3.2 |
–1.2 |
0.4 |
|
Michigan |
1.0 |
0.5 |
1.3 |
0.7 |
0.4 |
0.9 |
|
Minnesota |
–2.4 |
–1.5 |
–1.9 |
–2.9 |
–1.7 |
–2.2 |
|
Mississippi |
–0.1 |
0.2 |
–0.2 |
–0.4 |
1.0 |
–0.8 |
|
Missouri |
–1.3 |
–0.4 |
–0.9 |
–1.7 |
–0.6 |
–1.2 |
|
Montana |
0.2 |
0.3 |
0.3 |
2.4 |
3.7 |
4.3 |
|
Nebraska |
–0.2 |
–0.7 |
–1.4 |
–1.0 |
–3.3 |
–6.1 |
|
Nevada |
2.1 |
1.0 |
1.2 |
7.7 |
3.4 |
4.0 |
|
New Hampshire |
0.6 |
0.4 |
0.8 |
3.2 |
2.3 |
4.1 |
|
New Jersey |
–8.3 |
–5.4 |
–4.5 |
–5.4 |
–3.5 |
–2.9 |
|
New Mexico |
0.7 |
0.8 |
0.7 |
4.9 |
5.5 |
4.2 |
|
New York |
–8.9 |
–7.7 |
–6.7 |
–2.6 |
–2.3 |
–2.0 |
|
North Carolina |
–1.1 |
0.0 |
–1.5 |
–1.1 |
0.0 |
–1.4 |
|
North Dakota |
–0.1 |
0.0 |
–0.1 |
–1.4 |
–0.4 |
–0.9 |
|
Ohio |
–2.8 |
–0.6 |
–0.9 |
–1.8 |
–0.4 |
–0.6 |
|
Oklahoma |
–1.1 |
–1.3 |
–0.8 |
–3.2 |
–3.9 |
–2.3 |
|
Oregon |
–0.1 |
0.1 |
0.1 |
–0.2 |
0.3 |
0.3 |
|
Pennsylvania |
–2.3 |
–0.2 |
–1.1 |
–1.4 |
–0.1 |
–0.6 |
|
Rhode Island |
–0.1 |
–0.1 |
–0.3 |
–1.0 |
–0.9 |
–2.2 |
|
South Carolina |
–1.3 |
–1.1 |
–0.6 |
–3.0 |
–2.5 |
–1.4 |
|
South Dakota |
–0.1 |
–0.1 |
–0.1 |
–1.9 |
–1.4 |
–0.6 |
|
Tennessee |
–0.2 |
0.5 |
0.6 |
–0.3 |
0.7 |
0.9 |
|
Texas |
4.3 |
3.9 |
2.5 |
1.5 |
1.4 |
0.9 |
|
Utah |
–0.2 |
–0.4 |
–0.6 |
–0.7 |
–1.6 |
–2.4 |
|
Vermont |
0.2 |
0.1 |
0.1 |
2.6 |
1.5 |
0.8 |
|
Virginia |
0.7 |
0.7 |
0.3 |
0.7 |
0.7 |
0.3 |
|
Washington |
–3.9 |
–1.3 |
–7.1 |
–4.5 |
–1.6 |
–7.9 |
|
West Virginia |
0.6 |
0.4 |
0.1 |
4.1 |
2.8 |
0.9 |
|
Wisconsin |
–1.3 |
–1.1 |
–2.2 |
–1.8 |
–1.5 |
–2.8 |
|
Wyoming |
0.1 |
0.1 |
0.0 |
1.5 |
2.0 |
–0.5 |
|
US sum |
–36.9 |
–12.4 |
–25.1 |
–0.9 |
–0.3 |
–0.6 |
|
US published |
–36.9 |
–12.4 |
–25.1 |
–0.9 |
–0.3 |
–0.6 |
|
SOURCES: CBP (County Business Patterns) from Census Bureau web site: 2003 data released 08/05, downloaded 9/28/05. QCEW (Quarterly Census of Employment and Wages) from flat file downloaded from BLS web site on 9/28/05. Fixed decimals. |
||||||
|
State and Local Inc Tax as % of Total Wages |
Effective State and Local Tax BLS to Census Bureau Difference (millions of dollars) |
||||
|
2001 |
2002 |
2003 |
2001 |
2002 |
2003 |
|
4.72 |
4.32 |
4.19 |
–14 |
–4 |
–29 |
|
6.24 |
6.20 |
6.21 |
47 |
79 |
80 |
|
3.19 |
3.16 |
3.12 |
–30 |
–29 |
–44 |
|
6.54 |
5.91 |
5.75 |
–7 |
2 |
5 |
|
7.81 |
7.42 |
7.35 |
–65 |
–11 |
–88 |
|
6.29 |
5.12 |
5.46 |
–269 |
–76 |
25 |
|
4.14 |
3.75 |
3.57 |
42 |
20 |
47 |
|
5.05 |
5.44 |
5.25 |
–123 |
–79 |
–101 |
|
3.29 |
3.18 |
3.16 |
–3 |
8 |
–6 |
|
4.66 |
4.25 |
4.17 |
–59 |
–19 |
–37 |
|
5.32 |
4.79 |
4.83 |
9 |
13 |
16 |
|
4.57 |
4.16 |
3.97 |
–10 |
–30 |
–56 |
|
0.00 |
0.00 |
0.00 |
0 |
0 |
0 |
|
0.35 |
0.30 |
0.22 |
2 |
1 |
2 |
|
4.44 |
3.75 |
3.67 |
–367 |
–202 |
–166 |
|
3.94 |
3.99 |
3.80 |
29 |
33 |
26 |
|
7.93 |
6.96 |
6.96 |
–709 |
–536 |
–468 |
|
5.89 |
5.59 |
5.42 |
–67 |
–3 |
–81 |
|
2.47 |
2.20 |
2.12 |
–2 |
–1 |
–1 |
|
6.28 |
6.30 |
5.97 |
–175 |
–37 |
–54 |
|
5.22 |
5.00 |
4.98 |
–55 |
–66 |
–38 |
|
7.31 |
7.23 |
7.47 |
–7 |
9 |
9 |
|
4.90 |
4.58 |
4.54 |
–115 |
–10 |
–49 |
|
5.46 |
4.88 |
4.65 |
–7 |
–6 |
–15 |
|
4.35 |
4.14 |
4.09 |
–57 |
–46 |
–25 |
|
0.00 |
0.00 |
0.00 |
0 |
0 |
0 |
|
0.23 |
0.16 |
0.13 |
0 |
1 |
1 |
|
0.00 |
0.00 |
0.00 |
0 |
0 |
0 |
|
5.14 |
4.64 |
4.60 |
–9 |
–20 |
–29 |
|
4.66 |
4.78 |
4.26 |
9 |
5 |
3 |
|
5.61 |
4.65 |
4.91 |
38 |
32 |
13 |
|
0.00 |
0.00 |
0.00 |
0 |
0 |
0 |
|
5.09 |
5.14 |
5.03 |
30 |
22 |
7 |
|
5.80 |
5.39 |
5.44 |
–77 |
–60 |
–119 |
|
0.00 |
0.00 |
0.00 |
0 |
0 |
0 |
|
— |
— |
— |
–2,353 |
–1,084 |
–1,276 |
|
— |
— |
— |
— |
— |
— |
public policy and business administration. Specifically, regional data affect federal government fund allocations to states, analysis of state government tax efforts, state and local government tax and revenue planning, business analyses of the size of markets, and the extent of the safety net at the state level. For example, the Medicaid program uses BEA per capita personal income in the Federal Medicaid Assistance Percentage formula to determine the federal share of payments for each state. Since wages and salaries and wage-related components account for about two-thirds of personal income, the level of differences among the states—varying from $2.5 billion in Texas to –$7.1 billion in Washington for 2003—would have a significant impact on the federal share of Medicaid payments for each state.
In New York, the $1.2 billion dollar difference in growth in wages and salaries from 2001 to 2002 between BLS and the Census Bureau series, shown in Table 7-6, would amount to about a $173 million difference in projected state and local government income taxes received. New Jersey would have a $165 million projected difference in income taxes, and Massachusetts would have a $193 million projected difference.
If the difference between BLS and the Census Bureau reflects coverage differences, then, for example, the 10.4 percent average difference in Alaska for the years 2001 through 2003 would reflect the percentage of the workforce that is not covered by unemployment insurance. This information would be very useful to those officials interested in the extent of the unemployment insurance safety net among the states.
Finally, the differences may also reflect changes in coverage between the programs. For example, beginning in 2004, the Washington State unemployment insurance program no longer covers exercised stock options in its definition of covered wages and salaries, whereas the Census Bureau wages continue to cover exercised stock options for all states. Thus an increase in the differences between the two programs is expected beginning in 2004. Access to microdata in the programs would allow identification of the amount of the exercised stock options in the state.
Regional and Industry Influences Combined: County Business Patterns by Industry Compared with BLS QCEW Data
BEA uses BLS QCEW data in its initial estimates of wages, since it is the most comprehensive and earliest available data. This choice is made because the CBP data become available later. These data, however, are used as a check on the initial estimates as well as a data source for certain areas that are not covered by QCEW. Although the two data series have a large amount of overlap, at the NAICS sector (two-digit) level of wage
detail, CBP data and QCEW data can show different trends for certain industries. In Table 7-7, the mean absolute difference in average annual growth between 1998 and 2002 across industries is 0.9 percentage points. Table 7-8 shows larger variations across industries with respect to one-year growth rates: mean absolute differences in growth rates are 1.0, 2.1, 2.0, and 1.2 percentage points for 1999 through 2002, respectively.9
For individual industries, there is a considerable difference in growth rates as well. Between 1998 and 2002 the absolute difference in growth rates can vary as much as 2.2 percentage points, as is the case for the information sector (51), and as little as 0.2 percentage points, as in the health care and social assistance sector (62). One-year growth rates show larger differences. In 2002 there was a 5.6 percentage point difference in growth for the administrative, support, waste management, and remediation services sector (56), and in 2001 there was a 6.5 percentage point difference for the arts, entertainment, and recreation sector (71). In 2000, there was a 9.0 percentage point difference in the growth rate for the information sector (51) and a 6.7 percentage point difference for the forestry, fishing, hunting, and agriculture support sector (11). In the latter case, CBP data show a decline of 2.7 percent, while QCEW data show an increase of 4.0 percent.
Employment Differences and BEA International Accounts
BEA collects data on the activity of multinational firms at the enterprise level. In the early 1990s a study was conducted to compile establishment-based data for foreign-owned establishments in the United States, the results of which are included in Foreign Direct Investment in the United States: Establishment Data for 1987. For this study, BEA shared its confidential enterprise-level data with BLS and the Census Bureau so that each could determine the relevant set of establishments. There was no interaction between the Census Bureau and BLS in the compilation of each list. As shown in Table 7-9, BLS identified 3 percent more establishments for all industries than the Census Bureau, and the corresponding BLS employment level is 4 percent less than the corresponding Census
|
9 |
All of the QCEW data in Table 7-7 are based on the private sector in order to better match the survey population of the CBP. In addition, it should be noted that the 2001 growth rates are based on 2000 levels that are backcasted for QCEW; that is, all QCEW data prior to 2001 are backcasted for NAICS. For a description of the backcasting procedure, see Morisi (2003). Many of the larger differences between the data series during the period of backcasting are in services sectors. |
TABLE 7-7 Private Annual Payroll Data—Census Bureau (CBP) and BLS (QCEW): Levels
|
NAICS |
1998 |
||||
|
Code |
Industry Code Description |
CBP |
QCEW |
$ Diff. |
% Diff. |
|
|
Total |
3,309.4 |
3,338.7 |
29.3 |
0.9 |
|
11 |
Forestry, fishing, hunting, and agric. support |
4.7 |
21.5 |
16.8 |
362.0 |
|
21 |
Mining |
21.9 |
29.5 |
7.5 |
34.3 |
|
22 |
Utilities |
38.1 |
34.5 |
–3.6 |
–9.4 |
|
23 |
Construction |
198.5 |
202.9 |
4.4 |
2.2 |
|
31 |
Manufacturing |
607.3 |
678.9 |
71.6 |
11.8 |
|
42 |
Wholesale trade |
233.9 |
238.5 |
4.6 |
2.0 |
|
44 |
Retail trade |
260.3 |
294.3 |
34.0 |
13.1 |
|
48 |
Transportation and warehousing |
108.6 |
128.7 |
20.2 |
18.6 |
|
51 |
Information |
146.8 |
160.1 |
13.2 |
9.0 |
|
52 |
Finance and insurance |
290.0 |
279.2 |
–10.8 |
–3.7 |
|
53 |
Real estate, rental, and leasing |
49.9 |
55.8 |
5.9 |
11.9 |
|
54 |
Professional, scientific, and technical services |
277.6 |
309.1 |
31.4 |
11.3 |
|
55 |
Management of companies and enterprises |
175.6 |
105.4 |
–70.3 |
–40.0 |
|
56 |
Admin, support, waste management, remediation services |
163.7 |
152.2 |
–11.5 |
–7.0 |
|
61 |
Educational services |
52.3 |
47.7 |
–4.6 |
–8.8 |
|
62 |
Health care and social assistance |
395.5 |
358.3 |
–37.2 |
–9.4 |
|
71 |
Arts, entertainment, and recreation |
36.0 |
37.9 |
1.8 |
5.1 |
|
72 |
Accommodation and food services |
109.6 |
117.6 |
8.0 |
7.3 |
|
81 |
Other services (except public administration) Mean (excluding Total and 11) |
96.0 |
82.3 |
–13.7 |
–14.2 1.9 |
Bureau level. However, at the individual industry levels, the differences can be substantial. The average percentage difference in the number of establishments (fifth column in the table), without regard to direction of the difference, is 24 percent and the corresponding average difference in employment is 7.7 percent. Inasmuch as the table reflects data classified under the Standard Industrial Classification (SIC) system, the movement to NAICS is likely to have affected these estimates. For example, under the SIC system, auxiliaries in manufacturing (mainly head offices) were included in the manufacturing sector as a separate industry, and while the Census Bureau followed that classification, BLS dispersed the auxiliaries into the other manufacturing industries. Under NAICS, auxiliaries are still separately identified, but they are now placed in a sector entitled
|
1999 |
|||
|
CBP |
QCEW |
$ Diff. |
% Diff. |
|
3,554.7 |
3,594.7 |
40.1 |
1.1 |
|
4.8 |
22.3 |
17.5 |
363.6 |
|
21.0 |
28.1 |
7.1 |
33.8 |
|
39.4 |
35.5 |
–3.9 |
–9.8 |
|
219.1 |
224.2 |
5.1 |
2.3 |
|
625.5 |
702.4 |
76.9 |
12.3 |
|
250.0 |
255.6 |
5.6 |
2.2 |
|
281.9 |
314.3 |
32.4 |
11.5 |
|
116.7 |
137.7 |
21.0 |
18.0 |
|
170.3 |
186.2 |
15.9 |
9.4 |
|
313.2 |
303.0 |
–10.3 |
–3.3 |
|
54.1 |
59.4 |
5.3 |
9.9 |
|
311.2 |
362.5 |
51.3 |
16.5 |
|
192.4 |
113.3 |
–79.1 |
–41.1 |
|
183.1 |
167.1 |
–16.0 |
–8.7 |
|
56.9 |
51.2 |
–5.7 |
–10.0 |
|
409.2 |
372.1 |
–37.1 |
–9.1 |
|
39.4 |
41.0 |
1.6 |
4.0 |
|
116.9 |
125.7 |
8.8 |
7.5 |
|
102.0 |
86.9 |
–15.1 |
–14.8 1.7 |
“Management of Companies and Enterprises”; thus, they are no longer in the sector of the establishments that they serve. Indeed, one of the major differences in the number of manufacturing establishments that can be found in the 1997 economic census between the SIC system and NAICS is due to the different treatment of auxiliary establishments.
A more recent study examined differences in establishments and employment in the area of research and development (R&D) performed by U.S. firms. The NSF through the Census Bureau collects data on the R&D expenditures of U.S. firms. BEA collects data on the R&D expenditures of U.S. and foreign multinational companies. The BEA/Census Bureau/NSF R&D link project was a study to determine whether an integrated data set on U.S. R&D performance and funding could be created by linking the Census Bureau data on the R&D activity of all U.S. companies with BEA
data. This project was conducted under the authority of the International Investment and Trade Act and CIPSEA. No Title 26 data were used in the linking operation or subsequent tabulations or reports for this study; neither BEA nor the Census Bureau data sets used for the project contained such data, as all original FTI were replaced by respondent data for the Census Bureau surveys being linked. The Census Bureau informed the IRS of the project to alleviate any questions or concerns the IRS might have.
The project demonstrated that it is feasible to link the Census Bureau and BEA survey data, and that by linking the data an integrated data set on the domestic and international dimensions of R&D can be created. Table 7-10 compares the NSF data with the BEA data for U.S. parent companies and therefore examines only a subset of U.S. firms—U.S. affiliates of foreign companies were not included. Despite the smaller BEA uni-
|
2001 |
2002 |
||||||
|
CBP |
QCEW |
$ dif. |
% dif. |
CBP |
QCEW |
$ dif. |
% dif. |
|
3,989.1 |
3,952.2 |
–36.9 |
–0.9 |
3,943.2 |
3,930.8 |
–12.4 |
–0.3 |
|
4.8 |
23.6 |
18.8 |
393.2 |
5.0 |
24.1 |
19.2 |
385.0 |
|
25.0 |
31.9 |
6.9 |
27.7 |
24.0 |
30.6 |
6.6 |
27.5 |
|
41.9 |
39.3 |
–2.6 |
–6.2 |
41.8 |
39.9 |
–1.9 |
–4.7 |
|
247.2 |
260.2 |
13.0 |
5.2 |
247.3 |
260.8 |
13.5 |
5.5 |
|
617.7 |
704.1 |
86.4 |
14.0 |
580.4 |
670.7 |
90.3 |
15.6 |
|
275.9 |
279.6 |
3.7 |
1.3 |
262.5 |
276.6 |
14.1 |
5.4 |
|
314.8 |
344.1 |
29.3 |
9.3 |
320.7 |
348.9 |
28.2 |
8.8 |
|
129.5 |
149.8 |
20.3 |
15.6 |
127.3 |
146.9 |
19.6 |
15.4 |
|
207.1 |
205.8 |
–1.3 |
–0.7 |
188.1 |
188.8 |
0.7 |
0.4 |
|
373.6 |
359.4 |
–14.2 |
–3.8 |
372.7 |
356.4 |
–16.3 |
–4.4 |
|
64.0 |
66.9 |
2.9 |
4.6 |
65.2 |
68.8 |
3.6 |
5.5 |
|
374.4 |
403.7 |
29.3 |
7.8 |
368.8 |
390.5 |
21.7 |
5.9 |
|
213.1 |
118.4 |
–94.8 |
–44.5 |
204.8 |
117.5 |
–87.3 |
–42.6 |
|
221.4 |
189.1 |
–32.3 |
–14.6 |
212.2 |
191.8 |
–20.4 |
–9.6 |
|
67.1 |
60.4 |
–6.7 |
–10.0 |
72.0 |
64.7 |
–7.3 |
–10.1 |
|
465.7 |
425.5 |
–40.3 |
–8.6 |
499.2 |
456.0 |
–43.1 |
–8.6 |
|
46.1 |
45.2 |
–0.9 |
–2.0 |
47.7 |
47.1 |
–0.7 |
–1.4 |
|
128.6 |
138.1 |
9.5 |
7.4 |
131.1 |
142.2 |
11.1 |
8.5 |
|
115.2 |
97.7 |
–17.5 |
–15.2 –0.7 |
118.9 |
101.0 |
–17.9 |
–15.1 0.1 |
|
SOURCES: Census Web site (5/23/05): http://censtats. census.gov/cgi-bin/cbpnaic/cbpsel.pl; and BLS Web site (5/24/05): ftp://ftp.bls.gov/pub/special.requests/cew/. |
|||||||
verse, the table shows that in some industries BEA data indicate a far higher level of R&D expenditures than that for all U.S. firms— pharmaceuticals and medicines, for example. At the micro level, there were 11 cases in which the BEA and Census data for total R&D spending for the matched U.S. parent companies differed by more than $500 million. There is a substantial difference in the collected data for manufacturing and nonmanufacturing. The substantially lower number for non-manufacturing may result from the fact that R&D expenditures for nonmanufacturing firms are relatively more difficult to define and identify; so this area is more likely to be affected by differences in treatment.
The study also demonstrated some of the main benefits of data sharing—in the improvement of sample frames and the quality of reported data. For example, as a result of the project, the Census Bureau added over 500 companies to the sample for the Survey of Industrial Research
TABLE 7-8 Private Annual Payroll Data—Census Bureau (CBP) and BLS (QCEW): Growth
|
|
|
Growth Rate (%) |
|||
|
|
|
1999 |
|||
|
NAICS |
CBP |
QCEW |
Diff. |
Ab. Diff. |
|
|
Code |
Industry Code Description |
||||
|
|
Total |
7.4 |
7.7 |
0.3 |
0.3 |
|
11 |
Forestry, fishing, hunting, and agric. support |
3.4 |
3.8 |
0.4 |
0.4 |
|
21 |
Mining |
–4.4 |
–4.7 |
–0.3 |
0.3 |
|
22 |
Utilities |
3.3 |
2.8 |
–0.5 |
0.5 |
|
23 |
Construction |
10.4 |
10.5 |
0.1 |
0.1 |
|
31 |
Manufacturing |
3.0 |
3.5 |
0.5 |
0.5 |
|
42 |
Wholesale trade |
6.9 |
7.2 |
0.3 |
0.3 |
|
44 |
Retail trade |
8.3 |
6.8 |
–1.5 |
1.5 |
|
48 |
Transportation and warehousing |
7.5 |
6.9 |
–0.5 |
0.5 |
|
51 |
Information |
16.0 |
16.3 |
0.4 |
0.4 |
|
52 |
Finance and insurance |
8.0 |
8.5 |
0.5 |
0.5 |
|
53 |
Real estate, rental, and leasing |
8.4 |
6.5 |
–2.0 |
2.0 |
|
54 |
Professional, scientific, and technical services |
12.1 |
17.3 |
5.2 |
5.2 |
|
55 |
Management of companies and enterprises |
9.5 |
7.5 |
–2.0 |
2.0 |
|
56 |
Admin, support, waste management, remediation services |
11.9 |
9.8 |
–2.0 |
2.0 |
|
61 |
Educational services |
8.8 |
7.4 |
–1.4 |
1.4 |
|
62 |
Health care and social assistance |
3.5 |
3.9 |
0.4 |
0.4 |
|
71 |
Arts, entertainment, and recreation |
9.4 |
8.2 |
–1.1 |
1.1 |
|
72 |
Accommodation and food services |
6.7 |
6.9 |
0.2 |
0.2 |
|
81 |
Other services (except public administration) |
6.2 |
5.5 |
–0.7 |
0.7 |
|
|
Minimum |
|
|
–2.0 |
0.1 |
|
|
Mean |
|
|
–0.2 |
1.0 |
|
|
Maximum |
|
|
5.2 |
5.2 |
and Development. For more information, see a report on the findings of the project—“Research and Development Link Project: Final Report” at www.bea.gov/bea/di/FinalReportpublic.pdf.
How Data Sharing Could Help
A large part of BEA’s job is adjusting the various data for differences in timing, concepts, and definitions. However, this is often difficult because, for the most part, BEA does not have access to the underlying
|
2000 |
|||
|
CBP |
QCEW |
Diff. |
Ab. Diff. |
|
9.1 |
8.2 |
–0.9 |
0.9 |
|
–2.7 |
4.0 |
6.7 |
6.7 |
|
5.3 |
5.7 |
0.4 |
0.4 |
|
3.3 |
6.9 |
3.6 |
3.6 |
|
9.5 |
9.6 |
0.1 |
0.1 |
|
2.9 |
5.9 |
2.9 |
2.9 |
|
8.0 |
8.3 |
0.2 |
0.2 |
|
7.3 |
6.8 |
–0.5 |
0.5 |
|
7.6 |
6.9 |
–0.7 |
0.7 |
|
23.0 |
14.0 |
–9.0 |
9.0 |
|
10.7 |
10.2 |
–0.5 |
0.5 |
|
9.5 |
8.4 |
–1.1 |
1.1 |
|
16.3 |
9.1 |
–7.2 |
7.2 |
|
9.9 |
9.4 |
–0.4 |
0.4 |
|
14.8 |
11.0 |
–3.9 |
3.9 |
|
8.9 |
8.5 |
–0.3 |
0.3 |
|
5.4 |
6.1 |
0.6 |
0.6 |
|
9.6 |
10.1 |
0.4 |
0.4 |
|
7.4 |
6.8 |
–0.6 |
0.6 |
|
7.8 |
6.7 |
–1.0 |
1.0 |
|
|
|
–9.0 |
0.1 |
|
|
|
–0.6 |
2.1 |
|
|
|
6.7 |
9.0 |
microdata. If armed with full data-sharing capability, BEA, BLS, and the Census Bureau could explore and resolve differences in the activities of major companies or in their classification to various industries and regions. The agencies could also compare data to investigate and resolve persistent differences, such as the reporting of bonuses and stock options, the capitalization of computer investment, the impact of differences in timing, and the differences in company practices with respect to the writing-down of inventories or to the treatment of pensions and other fringe benefits.
The limited access also affects BEA’s ability to study observed anomalies in the Census Bureau data. The following are some examples of observations that BEA would like to study.
-
There are substantial differences in the reported payrolls from the Census Bureau and BLS, by area. For example, in Washington state, between 1999 and 2000, the Census Bureau reports an 11.5 percent increase (more than $9 billion) while BLS reports a 6.2 percent increase ($5 billion). There are many possible reasons for the discrepancy, and data sharing
|
2002 |
1998-2002 |
||||||
|
CBP |
QCEW |
Diff. |
Ab. Diff. |
CBP |
QCEW |
Diff. |
Ab. Diff. |
|
–1.2 |
–0.5 |
0.6 |
0.6 |
4.5 |
4.2 |
–0.3 |
0.3 |
|
3.9 |
2.2 |
–1.7 |
1.7 |
1.7 |
2.9 |
1.2 |
1.2 |
|
–4.2 |
–4.3 |
–0.1 |
0.1 |
2.2 |
0.9 |
–1.3 |
1.3 |
|
–0.2 |
1.4 |
1.7 |
1.7 |
2.4 |
3.7 |
1.3 |
1.3 |
|
0.0 |
0.3 |
0.2 |
0.2 |
5.6 |
6.5 |
0.8 |
0.8 |
|
–6.0 |
–4.7 |
1.3 |
1.3 |
–1.1 |
–0.3 |
0.8 |
0.8 |
|
–4.8 |
–1.1 |
3.8 |
3.8 |
2.9 |
3.8 |
0.8 |
0.8 |
|
1.9 |
1.4 |
–0.5 |
0.5 |
5.4 |
4.3 |
–1.0 |
1.0 |
|
–1.7 |
–1.9 |
–0.2 |
0.2 |
4.0 |
3.4 |
–0.7 |
0.7 |
|
–9.2 |
–8.3 |
0.9 |
0.9 |
6.4 |
4.2 |
–2.2 |
2.2 |
|
–0.2 |
–0.8 |
–0.6 |
0.6 |
6.5 |
6.3 |
–0.2 |
0.2 |
|
1.9 |
2.8 |
0.9 |
0.9 |
6.9 |
5.4 |
–1.6 |
1.6 |
|
–1.5 |
–3.3 |
–1.8 |
1.8 |
7.4 |
6.0 |
–1.3 |
1.3 |
|
–3.9 |
–0.8 |
3.2 |
3.2 |
3.9 |
2.7 |
–1.2 |
1.2 |
|
–4.2 |
1.4 |
5.6 |
5.6 |
6.7 |
6.0 |
–0.7 |
0.7 |
|
7.2 |
7.1 |
–0.1 |
0.1 |
8.3 |
7.9 |
–0.4 |
0.4 |
|
7.2 |
7.2 |
0.0 |
0.0 |
6.0 |
6.2 |
0.2 |
0.2 |
|
3.4 |
4.0 |
0.6 |
0.6 |
7.3 |
5.6 |
–1.7 |
1.7 |
|
1.9 |
3.0 |
1.1 |
1.1 |
4.6 |
4.9 |
0.3 |
0.3 |
|
3.2 |
3.4 |
0.2 |
0.2 |
5.5 |
5.2 |
–0.3 |
0.3 |
|
|
|
–1.8 |
0.0 |
|
|
–2.2 |
0.2 |
|
|
|
0.7 |
1.2 |
|
|
–0.4 |
0.9 |
|
|
|
5.6 |
5.6 |
|
|
1.3 |
2.2 |
|
SOURCES: Census Bureau web site (5/23/05): http://censtats. census.gov/cgi-bin/cbpnaic/cbpsel.pl and BLS Web site (5/24/05): ftp://ftp.bls.gov/pub/special.requests/cew/. |
|||||||
-
with access to tax data would help get at the cause. For example, one source of the difference could be differences in the recording of stock options. By knowing the companies in the state, it would be possible to check with firm reports about reported stock options and thereby reconcile any difference. Such huge differences in the payroll numbers affect the estimation of GDI.
-
BEA obtains monthly data from the Census Bureau for the manufacturing sector based on the M3 (Manufacturers’ Shipments, Inventories and Orders) survey. However, because participation in this survey is vol-
TABLE 7-9 Comparison of the Census Bureau and BLS Data for Foreign-Owned Establishments, 1992
|
|
Census Bureau |
BLS |
BLS Value as Percentage of Census Bureau Value |
|||
|
|
Number of Establishments |
Number of Employees |
Number of Reporting Units |
Number of Employees |
Number of Establishments |
Number of Employees |
|
All industries |
102,958 |
4,944,157 |
106,041 |
4,747,637 |
103 |
96 |
|
Agricultural services, forestry, and fishinga |
139 |
5,814 |
139 |
4,265 |
100 |
73 |
|
Mining |
|
120,782 |
1,640 |
102,814 |
102 |
85 |
|
Construction |
3,322 |
2,305 |
90,866 |
189 |
97 |
|
|
Manufacturing |
81 |
2,004,947 |
13,076 |
1,930,135 |
102 |
96 |
|
Transportation and public utilitiesb |
231,638 |
3,792 |
222,999 |
97 |
96 |
|
|
Wholesale trade |
91 |
513,012 |
34,999 |
491,578 |
186 |
96 |
|
Retail trade |
3,190 |
26,756 |
853,158 |
71 |
100 |
|
|
Finance, insurance, and real estate |
401,018 |
9,558 |
360,287 |
83 |
90 |
|
|
Services |
2,775 |
12,899 |
676,091 |
85 |
94 |
|
|
Otherc |
9 |
1,116 |
569 |
3,137 |
n.m. |
n.m. |
|
NOTE: n.m. = not meaningful. aExcludes agricultural production of crops and livestock. bThe Census Bureau data exclude railroad transportation. cFor the Census Bureau: consists of private education and noncommerical establishments; for BLS: consists of nonclassifiable est ablishments. SOURCES: The Census Bureau data: Foreign Direct Investment in the United States: Establishment Data for 1992 available on BEA’s Web site at http://www.bea.gov/bea/ai1.htm#BEACENS. BLS data: BLS news release: “Employment and Wages in Foreign-Owned Businesses in the United States, Fourth Quarter 1992,” October 1996. |
||||||
TABLE 7-10 Comparison of NSF R&D Expenditures by All U.S. Companies with BEA R&D Expenditures by U.S. Parent Companies, 2001 (millions of dollars or percentage)
|
|
NSF: All U.S. Companies |
BEA: U.S. Parent Companies |
Parent Companies as Percentage of all U.S. Companies |
|
All industries |
198,505 |
143,017 |
72 |
|
Manufacturing |
120,705 |
115,118 |
95 |
|
Food |
1,819 |
914 |
50 |
|
Beverage and tobacco products |
152 |
469 |
309 |
|
Textiles, apparel, and leather |
(D) |
125 |
n.a. |
|
Wood products |
182 |
(D) |
n.a. |
|
Paper, printing and support activities |
(D) |
(D) |
n.a. |
|
Petroleum and coal products |
(D) |
1,002 |
n.a. |
|
Chemicals |
17,892 |
31,927 |
178 |
|
Basic chemicals |
1,876 |
1,742 |
93 |
|
Resin, synthetic rubber, fibers, and filament |
(D) |
2,972 |
n.a. |
|
Pharmaceuticals and medicines |
10,137 |
23,169 |
229 |
|
Other chemicals |
(D) |
4,045 |
n.a. |
|
Plastics and rubber products |
(D) |
929 |
n.a. |
|
Nonmetallic mineral products |
990 |
339 |
34 |
|
Primary metals |
485 |
484 |
100 |
|
Fabricated metal products |
1,599 |
554 |
35 |
|
Machinery |
6,404 |
8,561 |
134 |
|
Computer and electronic products |
47,079 |
38,356 |
81 |
|
Computers and peripheral equipment |
(D) |
7,727 |
n.a. |
|
Communications equipment |
15,507 |
14,526 |
94 |
|
Semiconductor and other electronic components |
14,358 |
11,114 |
77 |
|
Navigational, measuring, electromedical, and control instruments |
12,947 |
4,158 |
32 |
|
Other computer and electronic products |
(D) |
832 |
n.a. |
|
Electrical equipment, appliances, and components |
4,980 |
2,008 |
40 |
|
Transportation equipment |
25,965 |
25,147 |
97 |
|
Motor vehicles, trailers, and parts |
(D) |
18,183 |
n.a. |
|
Other |
(D) |
6,964 |
n.a. |
|
Furniture and related products |
301 |
128 |
43 |
|
Miscellaneous manufacturing |
6,606 |
2,570 |
39 |
|
Nonmanufacturing |
77,799 |
27,899 |
36 |
|
Mining, extraction, and support activities |
(D) |
411 |
n.a. |
|
Utilities |
133 |
59 |
44 |
|
|
NSF: All U.S. Companies |
BEA: U.S. Parent Companies |
Parent Companies as Percentage of all U.S. Companies |
|
Construction |
320 |
(D) |
n.a. |
|
Trade |
24,372 |
(D) |
n.a. |
|
Transportation and warehousing |
1,848 |
12 |
1 |
|
Information |
(D) |
9,514 |
n.a. |
|
Publishing |
13,760 |
6,452 |
47 |
|
Newspaper, periodical, book, and database |
649 |
(D) |
n.a. |
|
Software |
13,111 |
(D) |
n.a. |
|
Broadcasting and telecommunications |
(D) |
796 |
n.a. |
|
Telecommunications |
(D) |
782 |
n.a. |
|
Other |
(D) |
14 |
n.a. |
|
Other information |
(D) |
2,266 |
n.a. |
|
Finance, insurance, and real estate |
(D) |
624 |
n.a. |
|
Professional, scientific, and technical services |
27,704 |
10,348 |
37 |
|
Architectural, engineering, and related services |
3,386 |
18 |
1 |
|
Computer systems design and related services |
9,154 |
8,929 |
98 |
|
Other |
15,164 |
1,401 |
9 |
|
NOTES: (D) = suppressed to avoid disclosure of data of individual companies; n.a. = not available. SOURCES: R&D spending by all U.S. companies: Research and Development in Industry: 2001 available on the NSF web site at http://www.nsf.gov/statistics/nsf05305/htmstart.htm; R&D spending by U.S. parent companies: U.S. Direct Investment Abroad: Operations of U.S. Parent Companies and Their Foreign Affiliates, Revised 2001 Estimates available on the BEA’s web site at http://www.bea.gov/bea/ai/iidguide.htm#link12b. |
|||
-
untary and some firms decide not to participate, BEA does not know the extent of participation. A recent example is the decision by a major producer of semiconductors to terminate its participation, which represented a huge erosion in the representativeness of the surveys. The Annual Survey of Manufacturers, however, is mandatory. Thus BEA must wait until the annual data are available before it can check the estimates based on the monthly data. If BEA had access to the M3 data, then it could identify the firms responsible for missing data and possibly estimate the missing information from publicly available sources such as company reports. Publicly available sales data from company reports could aid in the estimation of missing shipment data from a company that did not provide
-
such information in the M3 survey. The ability to estimate such missing information would serve to reduce revisions to GDP.
-
Relatedly, the M3 surveys provide inventories data to BEA, and BEA does not always know whether a company has reported an inventory adjustment to the Census Bureau in the same way that the company has entered it on its financial accounts. A few years ago the press reported a major write-down of inventory by a major producer of information technology equipment. Without knowing how the firm entered the write-down in its Census Bureau report, BEA had no way of checking if the inventory adjustment was accurately reflected both on the product side of the national accounts (inventories is a component of investment) and on the income side (the valuation of inventories affects corporate profits). In fact, there was a large adjustment to inventories.
How Data Sharing Would Help Cope with Disasters
The massive destruction wrought by Hurricane Katrina is having a significant impact on the ability of the statistical agencies to collect economic data in the affected regions. As a result of the disappearance of sample units, estimates of retail trade, construction, employment and wages, and other components of the principal economic indicators will contain many imputations. Data sharing would allow a combining of data that would enable the statistical agencies to better impute missing values. For example, in the absence of complete business list reconciliation between the Census Bureau and BLS, data sharing would allow one of the agencies to find alternative establishments that might serve as proxies for missing establishments and thereby provide a straightforward imputation. In addition, the Census Bureau sales values might be used by BLS to impute prices for its price indexes. The ability to share data would also enable the statistical agencies to examine each other’s establishment-level imputations to see if they suit an agency’s needs. For example, the BEA regional program would have access to the BLS establishment imputations for QCEW to see if their needs are met. In short, data sharing would allow the statistical agencies to economize resources to efficiently handle disruptions to the usual production of economic statistics.
REFERENCES
Morisi, T. 2003 Recent changes in the National Current Employment Statistics Survey. Monthly Labor Review June.
Moyer, B.C., M.A. Planting, M. Fahim-Nader, and S.K.S. Lum 2004 Preview of the comprehensive revision of the annual industry accounts. Survey of Current Business 84(March):38-51.
National Science Foundation, Division of Science Resources Statistics 2005 Research and Development in Industry: 2001. (NSF #05-305.) Arlington, VA: National Science Foundation. Available: http://nsf.gov/statistics/nsf05305/front.htm [accessed May 2006].
Strassner, E.H., G.W. Medeiros, and G.M. Smith 2005 Annual industry accounts: Introducing KLEMS input estimates for 1997-2003. Survey of Current Business 85(September):34.
U.S. Bureau of Economic Analysis, International Economic Accounts 2005a Foreign Direct Investment in the United States: Establishment Data for 1992. (Census data.) Available: http://www.bea.gov/bea/ai1.htm#BEACENS [accessed May 2006].
2005b U.S. Direct Investment Abroad: Operations of U.S. Parent Companies and Their Foreign Affiliates, Revised 2001. Available: http://www.bea.gov/bea/ai/iidguide.htm#link12b [accessed May 2006].
U.S. Bureau of Economic Analysis and U.S. Census Bureau 1992 Foreign Direct Investment in the United States: Establishment Data for 1987. Washington, DC: U.S. Government Printing Office.
U.S. Census Bureau 2003 County Business Patterns, NAICS. Available: http://censtats.census.gov/cgi-bin/cbpnaic/cbpsel.pl [accessed May 2006].
U.S. Census Bureau, Bureau of Economic Analysis, and National Science Foundation Division of Science Resources Statistics 2005 Statistics Research and Development Data Link Project: Final Report. Available: http://www.bea.gov/bea/di/FinalReportpublic.pdf [accessed May 2006].
U.S. Department of Labor, Bureau of Labor Statistics 1996 Employment and Wages in Foreign-Owned Businesses in the United States, Fourth Quarter 1992. (News release.) Washington, DC: U.S. Department of Labor, Bureau of Labor Statistics.
2002 Quarterly Census of Employment and Wages Program Data. Available: ftp://ftp.bls.gov/pub/special.requests/cew/ [accessed May 2006].


