
3
Examining Persistence and Attrition
CHAPTER HIGHLIGHTS
Women who start out on the path toward a career in academic science and engineering leave it for other fields at higher rates than their male counterparts. While there are field differences in pattern of attrition, more women than men leave at nearly every stage of the career trajectory. Fewer high school senior girls than boys state a desire to major in science or engineering in college. Girls who state such an intention are likelier than comparable boys to change their plans before arriving at college. Once in college, women and men show a similar persistence to degree, but women science and engineering majors are less likely than men to enter graduate school.
Women who enter graduate school in science and engineering are as likely as men to earn doctorates, but give a poorer rating to faculty-student interactions and publish fewer research papers than men. Many women graduate students report feelings of isolation. More women than men report plans to seek postdoctoral positions. Among postdoctoral scholars, women report lower satisfaction with the experience, and women are proportionately underrepresented in the applicant pools for tenure-track faculty positions.
It appears that women and men faculty in most fields who are reviewed receive tenure at similar rates. There is substantial faculty mobility prior to the tenure case, when some tenure-track ladder faculty move between institutions and others leave academe. Mo-
bility patterns differ between women and men; men who move prior to tenure tend to leave academe, while women tend to enter adjunct positions. For women faculty members, feelings of isolation, lack of respect of colleagues, and difficulty in integrating family and professional responsibilities are major factors in attrition from university careers. For universities, faculty attrition presents a serious loss both economically and in morale.
FINDINGS
3-1. There is substantial attrition of both men and women along the science and engineering educational pathway to first academic position. The major differences between the patterns of attrition are at the transition points: fewer high school girls intend to major in science and engineering fields, more alter their intentions to major in science and engineering between high school and college, fewer women science and engineering graduates continue on to graduate school, and fewer women science and engineering PhDs are recruited into the applicant pools for tenure-track faculty positions.
3-2. Productivity does not differ between men and women science and engineering faculty, but it does between men and women graduate students and postdoctoral scholars. Differences in numbers of papers published, meetings attended, and grants written reflect the quality of faculty-student interactions.
3-3. There is substantial faculty mobility between initial appointment and tenure case. Faculty at Research I universities are half as likely as the overall population of faculty to move to other types of academic institutions. Men and women hired into tenure-track positions had a similar likelihood of changing jobs, but men were twice as likely to move from academia to other employment sectors (15.3% of men and 8.5% of women) and women were 40% more likely to move to an adjunct position (9.2% of men and 12.7% of women).
3-4. Overall, men and women science and engineering faculty who come up for tenure appear to receive it at similar rates. Differences in the rate at which men and women receive tenure vary substantially by field and by race or ethnicity. For example, in social sciences women are about 10% less likely than men to be awarded tenure. African American women science and engineering faculty were 10% less likely than men of all ethnicities to be awarded tenure.
3-5. As faculty move up in rank, differences between men and women become apparent in promotions, awards, and salary.
3-6. No organization addresses the concerns of minority-group women; scientific and professional society committees address either women or minorities; most data are collected and analyzed by sex or by race or ethnicity.
3-7 Policy analyses of the education, training, and employment of scientists and engineers are hampered by data collection inadequacies, including lack of data, inability to compare data among surveys, difficulty in constructing longitudinal cohorts, difficulty in examining sex and race or ethnicity, and lags in the reporting of data.
RECOMMENDATIONS
3-1. Efforts to increase the number of women in science and engineering should be focused on both recruiting and retention. Professional societies should work to recruit high school students to science and engineering careers. Colleges and universities should work to recruit women and minority students to science and engineering majors, to graduate school, and to faculty positions. University leaders and faculties need to work together to identify and remedy issues that address faculty retention.
3-2. Recruiting for faculty positions needs to be an active process that consciously develops and reaches out to women and minority-group scientists. Deans and department chairs and their tenured faculty should expand their faculty recruitment efforts to ensure that they reach adequately and proactively into the existing and ever-increasing pool of women candidates.
3-3. We need to understand more about faculty turnover. Universities should collect department data and scientific and professional societies should track discipline-wide turnover; the data should be collected annually and shared so that turnover dynamics can be understood and appropriate policies can be developed to retain faculty.
3-4. Changes should be made in the type of data that are collected on minority-group women and efforts should be made to ensure that the data are comparable across surveys and studies. Specifically, the National Science Foundation (NSF) Survey of Doctorate Recipients needs to be made more robust to allow for analysis of the small numbers of women of color. Other national surveys must collect data in a way that permits multiple demographic comparisons. Federal agencies and pro-
fessional societies must report data so that the particular experiences of minority-group women can be understood and tracked and appropriate policies can be developed.
3-5. Universities should collect data annually on education and employment of scientists and engineers by sex and race or ethnicity using a standard scorecard format (Box 6-8). Data should include the number of students majoring in science and engineering disciplines; the number of students graduating with a bachelor’s or master’s degree in science and engineering fields; postgraduation plans; graduate school enrollment, attrition, and completion; postdoctoral plans; number of postdoctoral scholars; and data on faculty recruitment, hiring, turnover, tenure, promotion, salary, and allocation of institutional resources. The data should be made publicly available.
3-6. Scientific and professional societies should collect and disseminate field-wide education and workforce data with a similar scorecard.
Women who start on the path toward a career in academic science leave that path in favor of other fields at a higher rate than their male colleagues. In this chapter, we will analyze sex differences in science and engineering education and career trajectories and rates of departure from the academic science track in favor of careers in other sectors. The decision to pursue a particular career path is a choice, but certainly not an arbitrary one. Forces other than individual preference or scholastic aptitude and preparation affect choices about career paths and appear to be driving women into careers outside of academic research.
Not everyone who pursues a scientific education wants to be an academic scientist; 59% of science and mathematics, 55% of social science, and 28% of engineering graduate students say that they are preparing to become college or university faculty members or to seek postdoctoral research or academic appointments.1 In the United States, fewer than half of all people with PhDs in science and engineering are employed in the academic sector (Figure 3-1).
As discussed in Chapter 2, social expectations and stereotypes regarding what it means to be a scientist or engineer influence career choices. Men benefit from a series of accumulated advantages: the implicit assumption that men can be academic scientists and engineers, the encouragement they
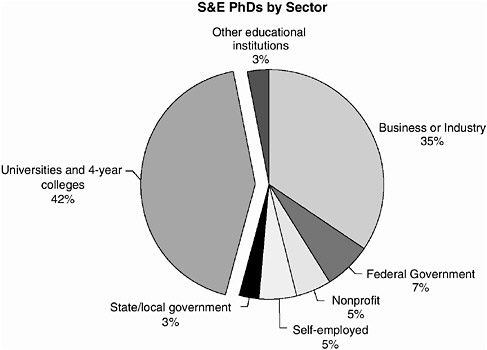
FIGURE 3-1 Occupations of science and engineering PhDs by sector, 2002.
SOURCE: National Science Foundation (2004). Women, Minorities, and Persons with Disabilities in Science and Engineering, 2004. Arlington, VA: National Science Foundation.
receive to pursue academic careers, and role models provided by men who have successful academic careers. Women often suffer from a series of accumulated disadvantages, so when they make career choices, they choose from a set of options different from that of their male counterparts.2 Research shows that the more ways in which a person differs from the norm, the more social interactions affect choices; thus, the interlocking effects of
sex and race can further restrict career options.3 An analysis by the Education Trust4 found that 93 of every 100 white kindergartners would graduate from high school, 65 would complete some college, and 33 would obtain a bachelor’s degree. The corresponding numbers for black kindergartners were 87, 50, and 18, respectively. Of 100 Hispanic and Native American kindergartners, only 11 and 7, respectively, would earn a bachelor’s degree.
|
There is no linear path to a degree. The default ‘pipeline’ metaphor … is wholly inadequate to describe student behavior [which] moves in starts and stops, sideways, down one path to another and perhaps circling back. Liquids move in pipes; people don’t. —Cliff Adelman, in The Toolbox Revisited: Paths to Degree Completion From High School Through College (2006)5 |
The question is where are differences in decision making manifested between men and women? The cohort of high school graduates who are now of an age to be assistant professors (assuming a direct educational path and no stop-outs) would have been seniors in the mid-1980s (Box 3-1 for a description of lagged cohort analysis). For this cohort, specific differences exist between the rates at which men and women chose and persevered in science and engineering education and careers.6 In 1982, high school senior girls were half as likely as boys to plan a science or engineering major in college. This difference was compounded by girls’ rate—2.4 times higher than that of boys—of attrition from the science and engineering educational trajectory during the transition from high school to college. During college, women and men showed similar perseverance to degrees in science and engineering fields. The other substantial difference in education and career attrition or perseverance between men and women in the cohort occurred during the transition from graduate school to tenure-track positions (Figure 1-2).
|
3 |
CSV Turner (2002). Women of color in academe: Living with multiple marginality. Journal of Higher Education 73(1):74-93. |
|
4 |
Education Trust, Inc. (2002). The Condition of Education, 2002. Data were from surveys conducted by the US Department of Education and the US Department of Commerce Bureau of the Census, March Current Population Surveys, 1971-2001. |
|
5 |
Available from the US Department of Education at http://www.ed.gov/rschstat/research/pubs/toolboxrevisit/toolbox.pdf. |
|
6 |
Y Xie and KA Shauman (2003). Women in Science: Career Processes and Outcomes. Cambridge, MA: Harvard University Press. |
|
CONTROVERSIES BOX 3-1 Models of Faculty Representation Most analyses of career trajectories of women scientists and engineers use a pipeline analogy, positing that women are underrepresented at senior levels of academe because they are disproportionately “lost” along the journey from interested high school student to tenured faculty. However, analyses must take into account the number of years it takes for a person to progress from a newly attained PhD to a tenured faculty position. There is a lag between earning a degree and advancing to the next level and “without considering lag time, we are left with erroneous conclusions about what the distribution of women faculty should be without enough information about what the available pool of women is.”a Senior-level academics attained their PhDs a number of years before reaching the level of full professor. One study reports that in 2002 the middle 50% of full professors in physics earned their doctorates in 1967-1980.b Therefore, in considering the representation of women in this faculty rank, it is most appropriate to consider that representation in terms of the cohort of PhDs granted in 1967-1980. Similarly for associate professors the appropriate cohort (again using the example of physics) is 1984-1991 and for assistant professors (the “entry level” of the professoriate) it is 1991-1997. That is what is meant by considering “lag time.” Although the specific length of the lag time may vary from field to field (based on such factors as number of postdoctoral fellowships required before receiving a faculty appointment), the general principle applies in fields other than physics. When lag time is considered, one notices that when the current cohort of senior faculty received their doctorates there were fewer women in the pool than there are now. In some fields, that almost completely explains the low numbers of women in senior faculty positions. For instance in physics, in 2005 5% of full professors were women; in 1967-1980 (when the current cohort of full physics professors would have attained their PhDs) an average of 4% of PhDs were awarded to women. At the associate professor level, 11% were women in 2005; and in 1984-1991 (the appropriate year range for this cadre) 9% of PhDs went to women. At the assistant professor level, 16% were women in 2005; and in 1991-1997 (the appropriate year range for this cadre) 12% of PhDs went to women.c Similar findings are not confined to the discipline of physics. Using a similar type of analysis a National Research Council panel reported, in a general non-discipline-specific finding, that “much, but not all, of the difference in men and women in their success in becoming faculty is due to differences in the stage of their career.”d The panel predicted, in the coming decades, increases in the percentages of female faculty. However, other work presents an alternative view. Nelson, in a study of faculty representation at “top 50” science and engineering schools, reports that “in most science disciplines studied, the percentage of women among recent PhD recipi |
|
ents is much higher than their percentage among assistant professors, the typical rank of recently hired faculty.”e Nelson finds further, that even in fields where women earn more PhDs than men (such as biology), “white males maintain their hold on the vast majority of assistant professor positions.”f Similar findings were reported by Myers and Turner, who found the disparity between the number of female PhD recipients and the number of female assistant professors to be especially acute for underrepresented minority groups.g Such findings indicate that qualified female candidates exist, but in many fields they are not being recruited into the tenure-track applicant pool in proportion to their presence in the PhD pool and suggest that the lag model is insufficient to account for the current underrepresentation of female faculty. The usefulness of the lag model discussed above depends on the validity of the pipeline model itself, a validity that has been questioned by some. The traditional pipeline model assumes a one-way flow in career progression, suggesting that once a person leaves science it is not possible to return. Work by Xie and Shauman challenges this paradigm, arguing that “exit, entry and reentry are real possibilities. Many persons, especially women, become scientists through complicated processes rather than by just staying in the pipeline.”h Others, including the Building Engineering and Science Talent (BEST) Initiative (Box 1-2) and the Human Frontier Science Program, have developed new paradigms for education, training, and career paths in the natural sciences.i Women may be more likely to pursue career paths that are not accounted for in traditional models of representation. Efforts should be made to be cognizant and supportive of those different career paths, and, in considering faculty representation, it is important to consider pathways beyond the pipeline paradigm. Xie and Shauman argue that the underrepresentation of women in science and engineering is “a complex social phenomenon that defies any attempt at simplistic explanation.” They note the “complex and multifaceted nature of women scientists’ career processes and outcomes” and suggest that increasing “women’s representation in science/engineering requires many social, cultural and economic changes that are large-scale and independent.” Clearly the pipeline model is important but, by itself, it is not sufficient to address underrepresentation. A National Research Council panelj found that, “while the most important
|
|
factor affecting gender differences in faculty status is the age of a scientist or engineer, there are important differences related to field, type of institution, and other variables.” A study by Kuck and colleagues highlights one of the other factors: the significance of the institution from which a person received their PhD as a factor in women’s likelihood of attaining a tenure-track position in chemistry. Kuck and colleagues examined hiring patterns in the 50 top-rated chemistry departments. They found that among the 50 departments, 10 schools supplied 60% of the younger faculty members, while only 32% of the faculty came from the other 40 schools.k The 10 top faculty-supplying schools were, with a few exceptions, also the top-rated graduate schools. In other words, “a small group of schools contributed a disproportionate number of younger faculty.” Postdoctoral placements also play a role in attaining tenure-track positions. Kuck and colleagues report that hiring of chemistry faculty by the top 50 universities is tracking the growth of women in postdoctoral appointments. Those who hold appointments at the top five suppliers of faculty are more likely to be preferentially hired by a top-50 department. Such findings demonstrate the influence of the PhD or postdoctoral institution on future career prospects and suggest that, when looking at faculty representation, it may be important to look at the pool of doctorates and postdoctorates from only a select subset of research universities. |
That type of analysis is useful for broad-brush policy development, but very specific differences by field must be acknowledged. Over the past decade, there have been significant changes, including increases in the numbers and proportion of girls taking high-level science and mathematics classes in high school and increases in graduate school enrollments and degrees. Research on underrepresentation in science and engineering focuses on the two categories of sex and race or ethnicity in large part because the data are collected by sex or race or ethnicity. As a consequence, minority-group women tend to disappear in analyses.7 Where possible, in the analysis of persistence and attrition in science and engineering education
and academic careers, this report includes data on minority-group women broken out by race and ethnicity.8
COURSE SELECTION IN HIGH SCHOOL
Rigorous study in high school is the best predictor of persistence to a degree in college.9 Advanced mathematics study appears to be an additional important factor in preparing students for college and can substantially narrow differences between racial and ethnic groups.10 The gender gap in science and mathematics courses taken in high school has narrowed over the last decade (Table 3-1). Since 1994, girls have been as likely as boys to complete advanced mathematics courses, including Advanced Placement or International Baccalaureate calculus.11 Also since 1994, girls have been more likely than boys to take advanced biology and chemistry. Physics is the only advanced science subject in which boys continue to complete courses at higher rates than girls, although the difference is small. African Americans and Hispanics were less likely than whites to complete advanced mathematics and science courses in high school.
In an analysis of the National Educational Longitudinal Survey, Hanson found variability in attitudes toward science among women.12 For ex-
|
8 |
The committee acknowledges that there are different experiences within racial and ethnic groups. These are addressed in more detail in the National Science Foundation’s Women, Minorities, and Persons with Disabilities in S&E reports, http://www.nsf.gov/statistics/wmpd/; BEST reports, http://www.bestworkforce.org; NAS/NAE/IOM (2006). Biological, Social, and Organizational Components of Success for Women in Academic Science and Engineering. Washington, DC: The National Academies Press; G Campbell, R Denes, and C Morrison (1999). Access Denied: Race, Ethnicity and the Scientific Enterprise, New York: Oxford University Press; National Research Council (1992). Science and Engineering Programs: On Target for Women? Washington, DC: National Academy Press; National Research Council (1991). Women in Science and Engineering: Increasing Their Numbers in the 1990s: A Statement on Policy and Strategy. Washington, DC: National Academy Press; National Research Council (1989). Everybody Counts: A Report to the Nation on the Future of Mathematics Education. Washington, DC: National Academy Press. |
|
9 |
LJ Horn and L Kojaku (2001). High School Academic Curriculum and the Persistence Path Through College: Persistence and Transfer Behavior of Undergraduates 3 Years after Entering 4-Year Institutions (NCES 2001-163). Washington, DC: US Department of Education. |
|
10 |
C Adelman (1999). Answers in the Toolbox: Academic Intensity, Attendance Patterns, and Bachelor’s Degree Attainment (PLLI 1999-8021). Washington, DC: US Department of Education; G Orfield (2005). Dropouts in America: Confronting the Graduation Rate Crisis. Cambridge, MA: Harvard Education Press. |
|
11 |
National Science Board (2006). Science and Engineering Indicators, 2006. Arlington, VA: National Science Foundation, Appendix Table 1-17. |
|
12 |
SL Hanson (2004). African American women in science: Experiences from high school through the post-secondary years and beyond. NWSA Journal 16(1):96. |
TABLE 3-1 Percentage of High School Graduates Completing Advanced Coursework in Mathematics and Science, by Sex and Year of Graduation
|
|
1990 |
1994 |
1998 |
2000 |
||||
|
Subject |
Men |
Women |
Men |
Women |
Men |
Women |
Men |
Women |
|
Mathematics |
||||||||
|
20.6 |
20.9 |
23.0 |
24.9 |
19.4 |
22.5 |
17.9 |
21.1 |
|
14.4 |
13.0 |
16.3 |
18.4 |
23.1 |
22.9 |
25.4 |
27.9 |
|
1.2 |
0.8 |
2.0 |
2.1 |
3.4 |
4.0 |
5.8 |
5.6 |
|
8.3 |
6.2 |
10.3 |
10.1 |
12.0 |
11.6 |
13.3 |
12.0 |
|
Science |
||||||||
|
25.7 |
29.2 |
31.5 |
37.8 |
33.8 |
40.8 |
31.5 |
40.5 |
|
43.8 |
46.1 |
47.5 |
53.3 |
53.3 |
59.2 |
58.1 |
66.8 |
|
24.9 |
18.3 |
26.7 |
22.5 |
31.0 |
26.6 |
35.6 |
31.5 |
|
SOURCES: US Department of Education, National Center for Education Statistics, National Assessment of Educational Progress, 1990, 1994, 1998, and 2000 High School Transcript Studies. Based on Table 1-8 in National Science Board (2006). Science and Engineering Indicators, 2006. Arlington, VA: National Science Foundation. |
||||||||
ample, African American girls expressed a greater interest in science than did white girls in both the 8th and 10th grades.
COLLEGE-GOING AND MAJORS
In the mid-1980s, about half of high school graduates enrolled in college immediately on graduation. In 2003, 65% of high school graduates enrolled in college on graduation, with 43% at 4-year colleges and 22% at 2-year colleges. The proportion entering college was higher among white students than among African American or Hispanic students. In addition, the rate of increase was higher among women than men at both 4- and 2-year colleges.13
A larger proportion of women than men high school seniors indicate an expectation to attend and complete college, but men are about 60% more likely to indicate an expectation to major in a science and engineering field.14 For at least 20 years, about one-third of all first-year college students have planned to study science and engineering.15 The proportion is similar among most racial and ethnic groups and, similar to high school intentions, is higher among men than women in many fields (Table 3-2). It should be noted that the percentages of Asian, African American, and Hispanic first-year college students who intend to pursue a science or engineering major are higher than that of their white counterparts.
Undergraduate Persistence to Degree
Women undergraduates have outnumbered men since 1982, and in 2002 they earned 58% of all bachelor’s degrees. The share and number of science and engineering bachelor’s degrees awarded to women and minority-group members has increased over the last 20 years, and women have earned at least half of all bachelor’s degrees in science and engineering since 2000.16 Much of the increase among minorities was fueled by an increase in science and engineering degrees awarded to women. A recent study17
|
13 |
National Science Board (2006). Science and Engineering Indicators, 2006. Arlington, VA: National Science Foundation, Figures 1-28 and 1-29. |
|
14 |
Y Xie and KA Shauman (2003). Women in Science: Career Processes and Outcomes. Cambridge, MA: Harvard University Press, Chapter 2. |
|
15 |
HS Astin (2005). Annual Survey of the American Freshman, National Norms. Los Angeles, CA: Higher Education Research Institute. |
|
16 |
National Science Board (2006), ibid. |
|
17 |
C Goldin, LF Katz, and I Kuziemko (2006). The Homecoming of American College Women: The Reversal of the College Gender Gap (NBER Working Paper No. 12139). Cambridge, MA: National Bureau of Economic Research. |
TABLE 3-2 Percentages of First-Year College Students Intending to Major in Science and Engineering, by Sex and Race or Ethnicity, 2004
suggests that those trends result from much longer term shifts in which women saw higher education as a way to gain entrance into the skilled labor market.
There are substantial variations in the demographics of degree recipients by field, sex, and race or ethnicity (Table 3-3). A larger proportion of Asian Americans earn science and engineering bachelor’s degrees than that of any other racial or ethnic group. African American women earn more science bachelor’s degrees than African American men. In all racial or ethnic categories, men earn more engineering bachelor’s degrees than women. It is also interesting to note that, although one-third of all first-year college students plan to study science and engineering, only half that proportion graduate with degrees in science and engineering. The most important factor for completing a bachelor’s degree for both men and women appears to be rigorous preparation in high school.18
|
18 |
C Adelman (2006). The Toolbox Revisited: Paths to Degree Completion from High School through College. Washington, DC: US Department of Education, http://www.ed.gov/rschstat/research/pubs/toolboxrevisit/toolbox.pdf. |
|
Hispanic |
Native American |
Asian American |
White |
||||
|
Men |
Women |
Men |
Women |
Men |
Women |
Men |
Women |
|
2.1 |
1.3 |
3.2 |
2.1 |
2.6 |
2.0 |
3.0 |
1.9 |
|
7.9 |
10.4 |
8.2 |
9.0 |
14.1 |
18.0 |
6.4 |
7.7 |
|
0.8 |
0.7 |
0.7 |
0.5 |
1.0 |
0.8 |
1.0 |
0.7 |
|
4.5 |
0.6 |
4.7 |
0.5 |
4.1 |
0.6 |
3.9 |
0.3 |
|
8.7 |
15.6 |
8.7 |
14.4 |
6.7 |
10.6 |
7.4 |
10.6 |
|
21.0 |
3.1 |
15.2 |
2.9 |
25.8 |
5.6 |
17.0 |
2.7 |
|
45.0 |
31.7 |
40.7 |
29.4 |
54.3 |
25.8 |
38.7 |
23.9 |
|
SOURCE: National Science Board (2006). Science and Engineering Indicators, 2006. Arlington, VA: National Science Foundation, Appendix Table 2-6. Data compiled from HS Astin (2005). Survey of the American Freshman: National Norms. Higher Education Research Institute, University of California at Los Angeles. |
|||||||
Social Factors Influencing Undergraduate Attrition
Many students who enter college intending to obtain a science and engineering bachelor’s degree abandon their goal along the way. As shown above and in numerous other studies, it is not poor high school preparation, ability, or effort, but rather the educational climate of science and engineering departments that correlates with the high proportion of undergraduates who opt out of science and engineering.19 Although the gap between intention and attainment is large for all students, research shows that a lower proportion of women realize their high school intentions.20 In
TABLE 3-3 Number of Bachelor’s Degrees in Science and Engineering, by Sex and Race or Ethnicity, 2001
addition, more men college students make the transition into science and engineering fields from other fields.21
Data indicate that these climate issues affect decision making early on; once students enroll in college, the probability of completing a science and engineering major is similar for men and women. Xie and Shauman report that, for students who declare a major in science and engineering, 60% of
|
Hispanic |
Native American |
Asian American |
White |
||||
|
Men |
Women |
Men |
Women |
Men |
Women |
Men |
Women |
|
448 |
497 |
59 |
59 |
730 |
700 |
8,046 |
5,202 |
|
1,493 |
3,101 |
312 |
334 |
3,356 |
4,536 |
24,868 |
31,407 |
|
357 |
295 |
28 |
23 |
482 |
434 |
4,245 |
3,928 |
|
2,302 |
726 |
193 |
78 |
4,280 |
2,046 |
19,043 |
5,448 |
|
5,505 |
9,999 |
534 |
930 |
4,786 |
8,023 |
47,272 |
79,622 |
|
1,858 |
962 |
192 |
64 |
5,341 |
1,684 |
31,710 |
7,057 |
|
11,963 (13.3) |
15,580 (17.3) |
1,318 (15.2) |
1,478 (17.1) |
18,975 (25.1) |
17,423 (23.0) |
135,184 (15.2) |
132,664 (14.9) |
|
can includes Pacific Islanders. Students with unknown race or ethnicity and those who are temporary residents are not included. SOURCE: National Science Foundation, Division of Science Resource Statistics, special tabulations of US Department of Education, National Center for Education Statistics, Integrated Postsecondary Education Data System, Completions Survey. Arlington, VA: National Science Foundation. Data available at http://www.nsf.gov/statistics/wmpd/tables/tabc-15.xls. |
|||||||
women and 57% of men complete the major.22 Students’ expectations of their social roles strongly influence their educational and career goals. Applying Eagly and Karau’s role congruity theory to women in science suggests an incongruity between stereotypical female characteristics and the attributes that are thought to be required for success in academic science and engineering.23
Women and men appear to enter science and engineering majors for different reasons. Seymour and Hewitt suggest that women were almost twice as likely as men to have chosen a science and engineering major through the active influence of someone important to them, such as a
relative, teacher, or close friend. In contrast, men were twice as likely as women to cite being good at mathematics or science in high school as a reason for declaring the major (whether or not they were actually better prepared than women).24 That suggests that more young men than women had the confidence to take higher-level mathematics and science courses in college.
Women and men also appear to leave science and engineering majors for different reasons (Table 3-4). Similar proportions of men and women cited losing interest in science, engineering, and mathematics (SEM) majors, poor teaching, and shifting to more appealing career options. More women felt that they could get a better education in a non-SEM major, rejected SEM careers and lifestyles, and felt that advising was inadequate. Men more frequently cited course overload, loss of confidence, financial problems, and issues with competition. A study on the retention of science and engineering undergraduates at the University of Washington also indicates that advising and a supportive community are important factors in the retention of women in SEM majors.25
The University of Washington study looked only at women who entered college with an interest in pursuing a science or engineering major. The sequencing of science and engineering courses is often strict, so it can be difficult to enter a science or engineering major from a nonscience or nonengineering field. Even so, men are twice as likely as women to move from a nonscience field into a science field during their first 2 years.26 Universities can institute programs to increase enrollment and reduce attrition (Box 3-2).
COLLEGE TO GRADUATE SCHOOL
A larger percentage of men than women who major in science and engineering enroll in graduate school in science and engineering fields (about 15% of men and 10% of women). An additional 8% of men and 12% of women enter graduate school in a nonscience or nonengineering field, and nearly 75% of those who earn science and engineering bachelor’s degrees enter the workforce directly.27
|
24 |
Seymour and Hewitt (1997), ibid. |
|
25 |
SG Brainard and L Carlin (1997). A Longitudinal Study of Undergraduate Women in Engineering and Science, http://fie.engrng.pitt.edu/fie97/papers/1252.pdf. |
|
26 |
Xie and Shauman (2003). Women in Science: Career Processes and Outcomes. Cambridge, MA: Harvard University Press. |
|
27 |
Xie and Shauman (2003), ibid. |
TABLE 3-4 Top Reasons for Leaving Science, Engineering, or Mathematics Undergraduate Degree Program, by Sex
The proportion of women varies by field and personal factors:28
-
Women bachelor’s degree recipients in the physical sciences are more likely than men to attend graduate school in a non-science and engineering field (19% compared to 5%).
-
Women with an undergraduate degree in engineering are more likely than men to attend graduate school in engineering (20% compared to 15%). In contrast with science fields, a bachelor’s degree in engineering is
|
EXPERIMENTS AND STRATEGIES BOX 3-2 Carnegie Mellon’s Women in Computer Science Program Carnegie Mellon University brought female enrollment in its undergraduate computer science program up from 7% to 40% from 1995 to 2000 and significantly reduced attrition.a Here’s what it did:
|
-
often considered a terminal degree; many engineering graduates find satisfying and well-paying jobs in the private sector. To gain entry to these jobs, employers may require more credentials from women than men.29
-
Married women and women with children are far less likely than married men and men with children to attend graduate school.
Graduate School
The number of science and engineering doctoral degrees awarded in the United States has remained fairly constant over the last two decades, fluctu-
ating between 12,000 to 14,000 degrees awarded each year. The major change has been in the percentage of PhD recipients who have been temporary residents, which has risen from 23% in 1966 to 39% in 2003.30 Among US citizens and permanent residents, the number of white men earning science and engineering PhDs has decreased from a peak of 11,000 in 1975 to about 7,000 in 2003. The number and proportion of science and engineering PhDs awarded to white women and to members of underrepresented minorities have increased over the past two decades; from 1983 to 2003, the number of science and engineering PhDs earned by African Americans, Hispanics, and Native Americans had more than doubled to 1,500, or 5% of all PhDs awarded (Table 3-5).
There are a few key differences in perseverance to degree by sex. In a recent longitudinal study of PhD completion, Nettles and Millett31 followed a cohort of graduate students to determine the significant factors affecting time to degree and degree completion. They found women and men to have similar completion rates and time to degree. All students ostensibly had access to a faculty adviser, but only a subset of students (69%) indicated they had a mentor.32
Research productivity is of concern for women in SEM. When several background and experience factors were adjusted for, men graduate students showed a significant advantage in paper presentations, publishing research articles, and consequently total research productivity. Overall, the most consistent contributions to productivity measures were having a mentor and being supported by a research assistantship during the course of one’s studies. Women were as likely as men to have mentors and assistantship support, so other factors besides the conventional departmental indicators underlie the sex differences in productivity. Nettles and Millett point to the sex difference in graduate students’ rating of their interactions with faculty. The fact that women gave low ratings to their interactions with
TABLE 3-5 Number of PhD Degrees Awarded In Science and Engineering, by Race or Ethnicity and Sex, 2003
faculty may be a consequence of the predominance of male faculty in science and engineering fields.33 Minority-group women face additional challenges in navigating student-faculty interactions in graduate school.34
|
Hispanic |
Native American |
Asian American |
White |
||||
|
Men |
Women |
Men |
Women |
Men |
Women |
Men |
Women |
|
58 |
31 |
2 |
2 |
125 |
81 |
1,406 |
575 |
|
110 |
87 |
6 |
9 |
283 |
261 |
1,875 |
1,574 |
|
9 |
7 |
1 |
1 |
27 |
24 |
297 |
110 |
|
6 |
4 |
2 |
0 |
62 |
17 |
240 |
64 |
|
113 |
209 |
14 |
24 |
112 |
173 |
1,798 |
2,494 |
|
80 |
23 |
9 |
2 |
259 |
80 |
1,256 |
300 |
|
376 |
362 |
34 |
38 |
868 |
636 |
6,872 |
5,117 |
|
can Indians; in 2003 Asian American does not include Pacific Islanders. Students with unknown race or ethnicity and those who are temporary residents are not included. SOURCE: National Science Foundation (2003). Survey of Earned Doctorates, 2003. Arlington, VA: National Science Foundation. |
|||||||
|
Overall, the finding that men rated student-faculty social interactions higher than women is the most troubling observation, because it implies the continuing existence of the “old boys club” and possible sex discrimination. —Michael Nettles and Catherine Millett (2006)35 |
For minority-group students, it appears that type of graduate funding support, although it does not impact time to degree, can have a significant effect on formation of peer connections, faculty interactions, and research productivity. In the sciences and mathematics, African Americans were more than three times less likely than whites to publish.36 Science and engineering teaching assistants appear to have fewer opportunities to pub
lish articles, and those supported on research assistantships reported higher publication rates. Nettles and Millett suggest that fellowship support of minority-group students may separate them from both research obligations and opportunities. Other research supports the finding that type of graduate research support can affect faculty interaction and career outcomes; students on fellowships were less likely to continue in academic science and engineering careers.37
It is notable that there are substantial differences by field, sex, and race or ethnicity in the types of graduate research support received (Table 3-6). Biological sciences have a very low proportion of students using personal funds (12.4%) compared with computer science (25.0%) and social and behavioral sciences (41.8%). Teaching assistantships are 2.5 times more prevalent in mathematics (52.5%) than in any other field. Research assistantships are prevalent in physical sciences (47.2%), engineering (43.2%), and biological sciences (35.7%). Engineering and computer science have a higher proportion of students receiving employer assistance than science fields (8.3%, 9.1%, and 2.3%, respectively). More women support their graduate work with personal funds and more men receive employee reimbursement. More African Americans and Hispanics receive fellowship support, more whites receive teaching assistantships, and more Asian Americans receive research assistantships.
Single women without children appear to be equally likely as all men to complete a science and engineering graduate degree.38 Other research indicates that doctoral students who are married or who have children under the age of 18 years have experiences similar to those of their peers who are not married or do not have children. They report similar peer interactions, social and academic interactions with faculty, and levels of research productivity. The primary difference is that students with children were more likely to temporarily stop out of their graduate program, and, in engineering and social sciences (but not other sciences), students with children took longer to complete their PhDs.39 In 2006, both Stanford University and Dartmouth College announced specific graduate student childbirth policies to facilitate the retention of women graduate students (Box 6-6).
As discussed in the chemistry case study, one’s academic pedigree can affect the likelihood of landing a tenure-track position, particularly in a research university. Most men and women who earn science and engineer-
TABLE 3-6 Primary Source of Support (Percent) for US Citizen and Permanent Resident Science and Engineering Doctorate Recipients, by Sex and Race or Ethnicity, 1999-2003
TABLE 3-7 Top 10 US Baccalaureate Institutions of Science and Engineering Doctorate Recipients, 1999-2003
|
|
Men |
Women |
|
Total S&E PhDs |
80,516 |
46,432 |
|
|
University of California, Berkeley (957) |
University of California, Berkeley (552) |
|
|
Cornell University, all campuses (719) |
Cornell University, all campuses (462) |
|
|
University of Illinois, Urbana-Champaign (671) |
University of Michigan, Ann Arbor (450) |
|
|
Massachusetts Institute of Technology (650) |
University of California, Los Angeles (379) |
|
|
Pennsylvania State University, main campus (591) |
University of Wisconsin, Madison (324) |
|
|
Harvard University (558) |
Harvard University (321) |
|
|
University of Michigan, Ann Arbor (558) |
University of Illinois, Urbana-Champaign (317) |
|
|
Brigham Young University, main campus (524) |
University of California, San Diego (311) |
|
|
University of Wisconsin, Madison (510) |
University of Texas, Austin (305) |
|
|
University of Texas, Austin (501) |
University of California, Davis (501) |
|
SOURCE: National Science Foundation (1999-2003). Survey of Earned Doctorates. Arlington, VA: National Science Foundation. |
||
ing doctorates earned their baccalaureate degrees at research universities (Table 3-7); Gaughan and Robin found that obtaining an undergraduate degree at one of the Research I universities is highly predictive of entry into an academic career.40 There are differences by sex, race, and ethnicity in the baccalaureate origins of science and engineering doctorates.41 For example, historically black colleges and universities and women’s colleges
|
40 |
Gaughan and Robin (2004), ibid. |
|
41 |
DG Solorzano (1994). The baccalaureate origins of Chicana and Chicano doctorates in the physical, life, and engineering sciences: 1980-1990. Journal of Women and Minorities in Science and Engineering 1(4):253-272; NR Sharpe and CH Fuller (1995). Baccalaureate origins of women physical science doctorates: Relationship to institutional gender and science discipline. Journal of Women and Minorities in Science and Engineering 2(1):1-15; T Lintner (1996). The Forgotten Scholars: American Indian Doctorate Receipt, 1980-1990, http://eric.ed.gov/ERICDocs/data/ericdocs2/content_storage_01/0000000b/80/25/be/36.pdf; CB Leggon and W Pearson (1997). The baccalaureate origins of African American female PhD scientists. Journal of Women and Minorities in Science and Engineering 3(4):213-224. |
have played a larger role in producing women African American science PhD students: 75% of the African American women who earned PhDs in biology from 1975-1992 earned their baccalaureate degrees from either Spelman College or Bennett College.42
Graduate School Attrition
A number of researchers have examined the factors involved in graduate school attrition. Graduate Record Examination scores and undergraduate grade point averages are poor predictors of PhD attainment rates.43 The social climate of graduate school plays a large role in whether a woman obtains a PhD in science or engineering.
While in graduate school, students face many challenges, not the least of which is maintaining self-confidence. Some have suggested that women are conditioned to measure the value of their achievements by the amount and nature of the feedback and attention they receive from others, but that men are taught to require little support from others.44 Those social expectations would make women more vulnerable to losing their self-confidence in situations where little praise is given—a common occurrence in graduate school.45 Other researchers reported that a loss in self-confidence adversely affected career plans and the determination to carry them out.46 The integration of students into a community is associated with lower attrition rates.47
The isolation that women experience in graduate school has led to a number of adverse consequences, such as reduced opportunities to compare experiences with others, to seek help without the fear of being judged as inadequate or lacking in intelligence, to receive affirmation of their evaluations of situations, to obtain advice on ways of addressing a problem, to
|
42 |
CB Leggon and W Pearson (1997). The baccalaureate origins of African American female PhD scientists. Journal of Women and Minorities in Science and Engineering 3:213-224. |
|
43 |
National Research Council (1996). The Path to the PhD. Washington, DC: National Academy Press. |
|
44 |
VJ Kuck, CH Marzabadi, SA Nolan, and J Buckner (2004). Analysis by gender of the doctoral and postdoctoral institutions of faculty members at the top-fifty ranked chemistry departments. Journal of Chemical Education 81(3):356-363, http://www.chem.indiana.edu/academics/ugrad/Courses/G307/documents/Genderanalysis.pdf. |
|
45 |
CA Trower and JL Bleak (2004). Study of New Scholars. Gender: Statistical Report [Universities]. Cambridge, MA: Harvard Graduate School of Education, http://www.gse.harvard.edu/~newscholars/newscholars/downloads/genderreport.pdf. |
|
46 |
Kuck et al. (2004), ibid. |
|
47 |
BE Lovitts (2001). Leaving the Ivory Tower: The Causes and Consequences of Departure from Doctoral Study. Lanham, MD: Rowman and Littlefield. |
TABLE 3-8 Location and Type of Planned Postgraduate Study for US Citizens and Permanent Resident Science and Engineering PhD Recipients, by Sex, 2003
|
Location and Type of Postgraduate Activity |
All S&E PhD recipients |
Women |
Men |
|
US PhD recipients |
10,863 |
4,545 |
6,316 |
|
Based in United States |
96.4% |
96.7% |
96.1% |
|
Academic employment |
24.0% |
26.6% |
22.2% |
|
Industry employment |
16.6% |
11.7% |
20.1% |
|
Postdoctoral study |
42.9% |
45.3% |
41.2% |
|
Othera |
12.8% |
13.1% |
12.6% |
|
Based abroad |
3.3% |
3.1% |
3.5% |
|
Location unknown |
0.3% |
0.2% |
0.4% |
|
a Includes elementary and secondary schools, government, nonprofit, and other or unknown. SOURCE. National Science Foundation, Division of Science Resource Statistics, Survey of Earned Doctorates, 2003. Arlington, VA: National Science Foundation. |
|||
gain peer support and encouragement, and to build a professional network. In group meetings, female students reported that often their remarks were barely recognized by other group members, while the comments of their male peers were met with enthusiasm and support. Other studies reiterate this finding—that women are indeed “left out of informal networks” of communication.48
POSTGRADUATE CAREER PLANS
A majority of students in the sciences and mathematics (59%) and the social sciences (55%), but only 28% of students in engineering, prepare to become postdoctoral scholars or college or university faculty. Among all science and engineering PhD recipients in 2003, more women than men reported plans to enter postdoctoral study, and substantially more men than women reported plans to enter industrial employment (Table 3-8).
POSTDOCTORAL APPOINTMENTS
Postdoctoral research is virtually required in the life sciences, and is becoming increasingly common in the physical sciences and engineering. In the life sciences, men and women PhDs obtain postdoctoral appointments at similar rates (70.7% of women and 72.5% of men)—nearly 6,400 women and 10,500 men. In the physical sciences, 42.7% of women and 47.4% of men obtain postdoctoral appointments —1,000 women and 5,100 men.49
Professional Development and Productivity
In a recent national survey, Davis50 reports that postdoctoral scholars with the highest levels of oversight and professional development are more satisfied, give their advisers higher ratings, report fewer conflicts with their advisers, and are more productive than those reporting the lowest levels of oversight. Although salaries and benefits were weakly linked to subjective success and positive adviser relations, higher salaries51 and increased structured oversight appear to be linked to paper production, both for all peer-reviewed papers and first-author papers. Perhaps most interesting is the role of planning. Davis found that postdoctoral scholars who had crafted explicit plans with their adviser at the outset of their appointments were more satisfied with their experience than those who had not. In addition to subjective measures of success, postdoctoral scholars with written plans submitted papers to peer-reviewed journals at a 23% higher rate, first-author papers at a 30% higher rate, and grant proposals at a 25% higher rate than those without written plans.
Research on the post-PhD employment of scientists and engineers has shown that men employed in the academic sector express significantly greater job satisfaction than women; members of underrepresented minority groups are far less satisfied.52 Similarly, Davis found that men postdoctoral scholars had higher levels of subjective success than women. Men had higher publication rates, although women submitted grant proposals at a higher rate; this suggests different resource allocation strategies. Underrepresented minority postdoctoral scholars submitted first-author papers at a lower rate than majority postdoctoral scholars. These data may
|
49 |
National Science Foundation (2004). Graduate Students and Postdoctorates in Science and Engineering. Arlington, VA: National Science Foundation. |
|
50 |
G Davis (2005). Optimizing the Postdoctoral Experience: An Empirical Approach (Working Paper). Research Triangle Park, NC: Sigma Xi, The Scientific Research Society. |
|
51 |
One standard deviation in each (for salary, a 19% difference, or roughly $7,600) corresponds to a 6.5-7% increase in the rate of paper production. |
|
52 |
P Moguerou (2002). Job Satisfaction among US PhDs: The Effects of Gender and Employment Sectors (Working Paper), http://www.rennes.inra.fr/jma2002/pdf/moguerou.pdf. |
reflect what has been reported in mentoring studies of graduate students (see above) and junior faculty, where men and women report substantially different mentoring relationships. One institution found that women faculty were less likely than men to have mentors who actively fostered their careers and more likely than male faculty to report having mentors who used the women faculty’s work for the mentor’s own benefit (Box 6-3).
Funding Source
Overall, postdoctoral funding source does not appear to have a differential effect on career outcome. Certainly, being awarded a prestigious fellowship appears to have a favorable effect on one’s chances of landing a tenure-track position,53 but is not clear whether the fellowships select those who are already destined to land such positions or provide an additional advantage in being hired.
Recognizing that the age at which researchers receive their first independent award has been increasing over the last 20 years, the National Institutes of Health created the Pathway to Independence Award.54 The award provides an opportunity for promising postdoctoral scientists to receive both mentored and independent research support from the same award. It remains to be seen how this award will affect the proportion of postdoctoral scholars who successfully transition to faculty positions or whether it will increase the proportion of women scientists who continue in academic careers.
Similarly, it is unclear whether there is a differential effect on career progression for women who receive a prestigious award such as the NSF Faculty Early Career Development (CAREER) award. Each year NSF selects nominees for the Presidential Early Career Awards for Scientists and Engineers (PECASE) from among the most meritorious new CAREER awardees. The PECASE program recognizes outstanding scientists and engineers who early in their careers show exceptional potential for leadership at the frontiers of knowledge. PECASE is the highest honor bestowed by the US government on scientists and engineers beginning their independent careers.55 It is notable that the proportion of women CAREER and PECASE awardees in the last 10 years meets or exceeds the proportion of women in the PhD pool (Figure 3-2).
|
53 |
G Pion and M Ionescu-Pioggia (2003). Bridging postdoctoral training and a faculty position: Initial outcomes of the Burroughs Wellcome Fund Career Awards in the Biomedical Sciences. Academic Medicine 78(2):177-186. |
|
54 |
http://grants.nih.gov/grants/new_investigators/pathway_independence.htm. |
|
55 |
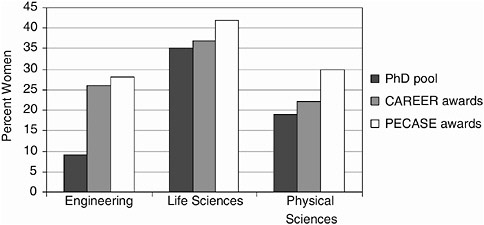
FIGURE 3-2 Proportion of women CAREER and PECASE awardees, 1995-2004.
NOTES: PhD pool was calculated as the average proportion of women earning PhDs in the 5-year period prior to the award. Physical sciences include mathematics and computer sciences.
SOURCE: PhD Pool: National Science Foundation, Survey of Earned Doctorates, 1991-1999; CAREER awards and PECASE awards are published by the National Science Foundation and available at http://www.nsf.gov/awardsearch. Engineering awards were those made by the ENG directorate, life sciences awards were those made by the BIO directorate, and physical sciences awards were those made by the CSE, GEO and MPS directorates.
FACULTY POSITIONS
Gains in women’s representation among bachelor’s and doctoral degree recipients have not translated into representation among college and university faculty (Figure 1-2 and Table 3-9). Four times as many men as women with science and engineering doctorates hold full-time faculty positions.56 Data derived from the Association of American Medical Colleges Faculty Roster show that less than 5% of medical school faculty identify themselves as African American, Hispanic, or Native American.57 Even though more African American women than African American men earn
TABLE 3-9 Bachelor’s Degree Recipients Compared with Faculty, by Sex and Field, 2002
|
|
Percent Women |
Percent Men |
||
|
Students |
Faculty |
Students |
Faculty |
|
|
Biological sciences |
58.4 |
20.2 |
41.6 |
79.8 |
|
Chemistry |
47.3 |
12.1 |
52.7 |
87.9 |
|
Computer science |
27.7 |
10.6 |
72.3 |
89.4 |
|
Physics |
21.4 |
6.6 |
78.6 |
93.4 |
|
SOURCE: CB Leggon (2006). Women in science: Racial and ethnic differences and the differences they make. Journal of Technology Transfer 31:325-333. |
||||
science and engineering degrees, African American women make up less than half of the total African American full-time faculty in colleges and universities.58 As discussed above, the underrepresentation of women on faculties can contribute to undergraduate and graduate students opting into career paths outside of academe.59 It can also contribute to feelings of isolation among female faculty.
Hiring New Doctorates into Faculty Positions
No data are available on the total number of science and engineering tenure-track positions available each year. It is well known, however, that there are not nearly enough faculty positions to accommodate the new PhD pool. In physics in 2003, for example, there were 679 new faculty recruitments (including tenured, tenure-track, temporary, and non-tenure-track positions) and 1,197 new PhDs.60 In mathematics in 2004, there were
|
58 |
WB Harvey (2003). 20th Anniversary Minorities in Higher Education Annual Status Report. Washington, DC: American Council on Education; K Hamilton (2002). The state of the African American professoriate. Black Issues in Higher Education 19(7):30-31. |
|
59 |
Discussed in ALW Sears (2003). Image problems deplete the number of women in academic applicant pools. Journal of Women and Minorities in Science and Engineering 9:169-181; MF Fox and PE Stephan (2001). Careers of young scientists: Preferences, prospects, and realities by gender and field. Social Studies of Science 31(1):109-122. |
|
60 |
R Ivie and KN Ray (2005). Women in Physics and Astronomy, 2005 (AIP Publication Number R-430.02). College Park, MD: American Institute of Physics, http://www.aip.org/statistics/trends/reports/women05.pdf. |
1,081 doctoral recipients and 232 reported hires in all faculty departments (126 were tenure-track at Research I universities).61
Fields vary in the proportion of female faculty relative to the available pool. In physics in 2004, a higher percentage of women were hired as junior faculty than are represented in the recent PhD pool: 18% of new physics hires and 13% of recent physics PhDs.62 In mathematics in 2004, women made up 31% of doctoral recipients and 28.4% of new faculty hires.63 Paradoxically, fields with higher proportions of women in the PhD pool have lower proportions of women in the applicant pool (Figure 1-2a, b, and c).64 The same appears to be true in academic medicine (Box 3-3).
Usual department hiring processes often do not identify exceptional female candidates. That point is brought into sharp focus by a recent report from the Massachusetts Institute of Technology (MIT),65 in which the number of women science faculty is plotted over time (Figure 3-3).
|
The increases in the representation of women and minorities don’t just “happen,” but result from specific pressures, policies, and positive initiatives designed to increase the hiring of women or minorities; and that when these pressures abate or expire, hiring progress stops or even reverses. —Nancy Hopkins, Diversification of a University Faculty (2006) |
In 2006, there were 36 female faculty and 240 male faculty in the School of Science at MIT. The total number of tenured and untenured women faculty in the MIT science departments rose steeply twice: between 1972 and 1976 and between 1997 and 2000. Those rises do not reflect contemporaneous increases in the size of the faculty. The number of male faculty actually decreased (from 259 to 229) during the rise in female faculty between 1997 and 2000 because of an early retirement program. Instead, the first sharp rise in the number of women science faculty beginning in 1972 was the result of pressures associated with the Civil Rights Act
|
61 |
EE Kirkman, JW Maxwell, and CA Rose (2005). 2004 Annual Survey of the Mathematical Sciences. Notices of the American Mathematical Society, http://www.ams.org/employment/2004Survey-Third-Report.pdf. |
|
62 |
R Ivie and KN Ray (2005). Women in Physics and Astronomy, 2005. American Institute of Physics. |
|
63 |
Kirkman, Maxwell, and Rose (2005), ibid. |
|
64 |
Applications, interviews, and hiring decisions are discussed in the forthcoming report by the National Academies Committee on Women in Science and Engineering (Box 1-3). |
|
65 |
Hopkins (2006), ibid. Available at http://web.mit.edu/fnl/volume/184/hopkins.html. |
|
DEFINING THE ISSUES BOX 3-3 Academic Medicine During the last 30 years the share of women graduating from medical colleges has nearly reached parity with the share of male graduates. However, as shown in Figure B3-1, while the share of women students and faculty members was similar before 1974, since then, increases in the proportion of women medical school graduates have not translated into similar increases in the proportion of women in faculty positions. 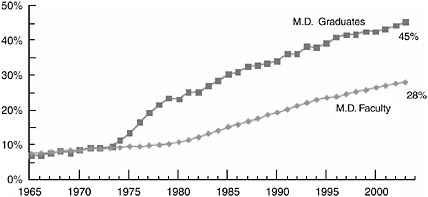 FIGURE B3-1 Representation of women MDs in academic medicine faculty positions, 1965-2004. ADAPTED FROM: Association of American Medical Colleges (2005). The changing representation of men and women in academic medicine. AAMC Analysis in Brief 5(2):1-2, http://www.aamc.org/data/aib/aibissues/aibvol5_no2.pdf. A Snapshot of the Current Situation for Female Faculty Members in Medicinea
|
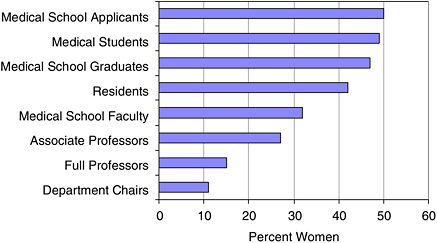 FIGURE B3-2 Proportion of women in academic medicine, by educational stage and rank. ADAPTED FROM: Association of American Medical Colleges (2005). Women in US Academic Medicine: Statistics and Medical School Benchmarking, http://www.aamc.org/members/wim/statistics/stats05/wimstats2005.pdf. Reasons for Differences Brown and colleaguesb note that a number of factors may contribute to women’s slower advancement, but a pipeline problem is not among them. They conclude that the supply of women graduating from medical schools is adequate and that “the culture of academic medicine, not the numbers of available women, drives the lopsided numbers.” Cultural issues include a lack of high-ranking female role models; gender stereotyping that works to limit opportunities; exclusion from career development opportunities; differences in workplace expectations for men and women; social and professional isolation; and gender differences in the amount of funding, space, and staff support provided. Those factors have been found to adversely affect female faculty members’ career satisfaction and advancement. In addition, traditional constructs of reward and hierarchy within departments have been found to impede advancement of women faculty because they are inherently gender-biased. Bickel et al. point out “medicine tends to over-value heroic individualism” with the result that “women will not ‘measure up’ as easily as men do.”c |
|
A second difficulty is related to tensions between professional and personal life which seem to be especially acute for women in academic medicine. Brown et al. report that “the demands of career and personal life [are] each great enough to extract compromise from the other, and, further, that anticipated support from a partner, the community, and medical center was inadequate to make it possible to succeed in multiple roles at once.” Bickel and colleagues note that academic medicine tends to “reward unrestricted availability to work (i.e., neglect of personal life).” Furthermore, as in other fields, the pressures of the tenure timeline in academic medicine often coincide with decisions (and associated pressures) to start a family. Potential Policy Options Potential policy actions to redress those problems focus on adjusting the institutional environment in a way that improves the experiences of both male and female faculty. Improving the quality of professional development programs for all faculty has proven effective in addressing culture and climate issuesd (Chapter 4 and Box 6-3). Other suggestions are to:
|
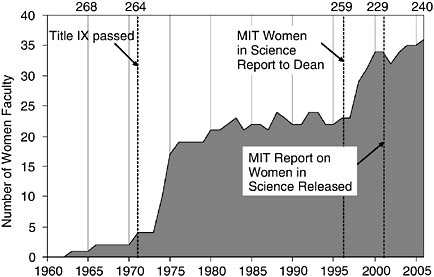
FIGURE 3-3 Number of women faculty in the School of Science at the Massachusetts Institute of Technology, 1963-2006.
NOTES: The numbers of male faculty in several relevant years are shown along the top of the graph.
ADAPTED FROM: N Hopkins (2006). Diversification of a university faculty: Observations on hiring women faculty in the schools of science and engineering at MIT. MIT Faculty Newsletter 18(4):1, 16-23. http://web.mit.edu/fnl/volume/184/hopkins.html.
and affirmative action regulations. In particular, Secretary of Labor George Schultz in 1971 ordered compliance reviews of hiring policies of women in universities. All institutions receiving federal funding were required to have such plans in effect as of that year. The second sharp rise between 1997 and 2000 resulted directly from the Dean of the School of Science’s response to the 1996 MIT Report on Women Faculty in the School of Science.
The “Pool”
As discussed in Box 3-1, one of the current controversies is how to define the available pool of talent. Some base their figures on the proportion of women who have recently graduated with a PhD or MD; others suggest it should be based on the average over several years. In some fields where postdoctoral appointments are common, “recent” may be 5 years
prior to a search. Others suggest the appropriate pool should be the proportion of women in the postdoctorate pool. Still others argue that the pool should be based on the proportion of women earning PhDs in top-tier institutions. As discussed in Box 3-1, there is currently no consensus on how to measure the “pool” of qualified candidates.
At the University of California, Berkeley, “doctoral pool” is defined in a two-step process. First, the average proportion of US residents earning PhDs in the relevant field in the 5 years prior is obtained from the National Science Foundation Survey of Earned Doctorates, which publishes these figures annually. Second, the pool is narrowed by considering only those PhDs awarded at the 35 institutions producing the most PhDs at top-quartile-rated doctoral programs, based on the National Research Council’s Research Doctorate Programs in the United States: Continuity and Change report.66 Indeed, research on hiring shows that faculty at Research I universities received their doctorate degrees from a very select group of institutions,67 and that narrowing the institutional filter further may provide a more realistic picture of actual hiring practice. This issue is discussed in more detail later in this chapter in the Chemistry Case Study section. Perception of career opportunities is another factor affecting the sex distribution of the academic job applicant pool; some research indicates that women mathematics and science graduate students perceive academic careers more negatively than do men.68
Applicant data on biology and the health sciences at the University of California, Berkeley, in 2001-2004 show that women made up 47% of recent biology and health sciences doctorates from the top-quartile of graduate schools, but only 29% of applicants for tenure-track faculty positions (Figure 3-4). In physical science, mathematics, computer science, and engineering disciplines, women made up 21% of recent PhDs from those top schools and 15% of applicants (Figure 3-5). Minority-group women, in contrast with white women, are present in the University of California, Berkeley, applicant pool in the same proportion as in the PhD pool, but are not represented proportionately among assistant professors.
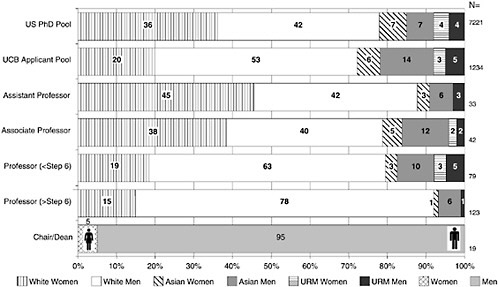
FIGURE 3-4 Biological and health sciences applicant pool and faculty positions at the University of California, Berkeley, 2001-2004.
NOTES: Underrepresented minority (URM) includes African American, Hispanic American, and Native American. Chair/Dean figures are broken down only by sex because of low counts. The PhD pool is based on PhDs granted to US residents, 1997-2001, at the 35 institutions producing the most PhDs at top quartilerated doctoral programs (National Research Council Reputational Ratings).
SOURCE: UC Berkeley Faculty Applicant Pool Database, 2001-2004; UC Berkeley Faculty Personnel Records, 2003; and National Science Foundation Survey of Earned Doctorates.
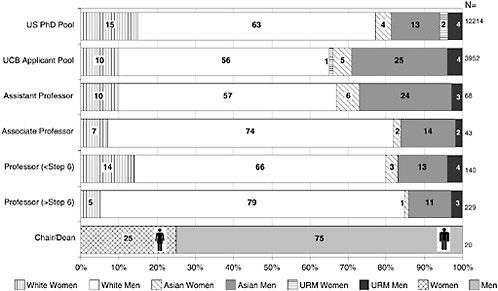
FIGURE 3-5 Physical sciences, mathematics, and engineering applicant pool and faculty positions at the University of California, Berkeley, 2001-2004.
NOTES: Underrepresented minority (URM) includes African American, Hispanic American, and Native American. There are no URM women in faculty positions in physical sciences, mathematics, and engineering departments. Chair/Dean figures are broken down only by gender because of low counts. The PhD pool is based on PhDs granted to US residents, 1997-2001, at the 35 institutions producing the most PhDs at topquartiler ated doctoral programs (National Research Council Reputational Ratings).
SOURCE: UC Berkeley Faculty Applicant Pool Database, 2001-2004. UC Berkeley Faculty Personnel Records, 2003; and National Science Foundation Survey of Earned Doctorates.
Faculty Mobility
Estimates of faculty attrition are hard to come by. Most available attrition data are on retirements, not on mobility between universities or other nonretirement attrition. There is very little information available on where faculty go who leave academe. In 1999, about 7.7% of full-time faculty left their positions, 2.2% for retirement and 5.5% for a variety of other reasons.69 The few sources of data for this type of analysis are the Association of American Medical Colleges (AAMC) Faculty Roster, which collects and reports data on medical college faculty; the American Chemical Society Directory of Graduate Research; and the American Institute of Physics Academic Workforce Survey (Box 3-4).
To better understand faculty turnover and mobility, we used the NSF Survey of Doctoral Recipients (SDR), a longitudinal survey of a sample of people who earned doctorates in the United States. We examined the sample of full-time, untenured but tenure-track science, engineering, and social science faculty in 1995 who were also part of the survey 6 years later, in 2001. We found that men and women faculty exhibit different mobility: more men receive tenure or seek positions outside of academe, and more women move to non-tenure-track positions within academe.
-
A slightly greater percentage of men than women moved from academe to other sectors of employment in 2001 (8.6% of women and 11.1% of men).
-
A greater percentage of women faculty than men were unemployed in 2001 (3.4% of women and 0.8% of men).
-
Men and women faculty had a similar likelihood of being employed at the same type of institution in 1995 and 2001 (68.5% of women and 70.1% of men).
-
Men and women faculty had a similar likelihood of moving to a different type of institution between 1995 and 2001 (18.7% of women and 17.5% of men).
-
Women faculty were significantly more likely than men to change jobs only in the social sciences.
-
Of tenure-track faculty in 1995 who were employed in the same type of institution in 2001, more men than women faculty had received tenure (54.5% of women and 59.2% of men).
|
TRACKING AND EVALUATION BOX 3-4 The Association of American Medical Colleges’ Faculty Roster, the American Chemical Society Directory of Graduate Research, and the American Institute of Physics Academic Workforce Survey The AAMC Faculty Roster was started in 1966 through joint sponsorship of the National Institutes of Health (NIH) and AAMC as an effort to assess and track the intellectual capital of medical education. The Faculty Roster contains, on a voluntary basis, employment, educational, and demographic information on faculty members at accredited US medical schools. Currently the roster contains records on about 113,000 active, full-time faculty and 122,000 inactive faculty.a The Faculty Roster is used for a variety of purposes. Although it was initially conceived to deal with the development of personnel to staff new medical schools, in more recent years it has been used to track the progress of medical schools in increasing the representation of women and minorities in faculty positions. The roster can be used to examine sources of faculty, provide background on faculty training, track inter-institutional movement by faculty, and study reasons behind faculty departure from medical academe.b NIH uses the Faculty Roster to inform policy decisions, using its data to study such topics as the growth rate of faculty or the typical age of faculty at the time at which they receive their first professorships. In addition to providing the database to its members for communication and research purposes, AAMC uses it to produce a series of annual reports on US medical school faculty, which present data on the national distribution of full-time faculty, including such information as specialty, department, rank, degree, sex, and race or ethnicity.c The American Institute of Physics conducts a biennial survey on the number of faculty, turnover, retirements, and recruitments at physics degree-granting departments. It also collects information on sex, race, and ethnicity.d The American Chemical Society also maintains a faculty database, the Directory of Graduate Research (DGR). The DGR focuses on faculty involved in chemistry research and provides information on faculty research field, academic rank, sex, and contact information. It does not collect information on race or ethnicity. The DGR provides a statistical summary of 665 chemical science departments and listings for nearly 11,000 faculty members.e
|
Next, we looked at full-time, untenured, tenure-track science, engineering, and social science faculty employed at a Research I institution in 1995. We found that between 1995 and 2001:
-
Faculty at Research I universities were half as likely as the overall population of science, engineering, and social sciences faculty to move to other types of higher education institutions.
-
Men were almost twice as likely as women to move to jobs outside academe (8.5% of women and 15.3% of men).
-
Women who were employed as tenure-track faculty in 1995 were more likely than men not to be employed in 2001 (2.5% of women, 0.6% of men).
-
Women tenure-track faculty who were employed at a Research I institution in both 1995 and 2001 cohorts were less likely than men to have received tenure in 2001 than corresponding men (56.3% of women and 61.6% of men).
Exiting the Tenure Track70
We did an additional analysis to determine why tenure-track and tenured faculty changed jobs, using the 1995-2003 SDR. To be included in the sample, individuals must have had tenure or have had tenure-track jobs in 1995. Most individuals indicated multiple reasons for job changes. The single most important reason given was pay and promotion—this did not differ by field. Other reasons for changing jobs did differ by field, rank, and sex. Across fields, women faculty consistently ranked working conditions, family, and job location higher than men among their reasons for changing jobs (Table 3-10).71 Differences were most prevalent in life sciences, particularly among full professors.
TABLE 3-10 Reasons for Job Change by Sex, All Faculty Ranks, All Fields, 1995-2003
There are sex differences in where women and men land after leaving tenure-track positions. A hazard analysis of the 1973-2001 longitudinal SDR sample shows that across science fields, men were significantly more likely to leave the tenure track for nonacademic employment. The overall hazard rate is 0.830 (p=0.05), which means that about 20% more men than women exited to nonacademic jobs. Where are the women going? Across all fields of science and engineering women are 40% more likely than men to exit the tenure track for an adjunct academic position (p=0.01). In addition to sex, the factors with the strongest correlation to this outcome were race or ethnicity, and employment at a private university or medical school. Women whose primary or secondary responsibility was teaching or those who had government funding were significantly less likely to exit to adjunct positions.
Tenure
Faculty mobility may be pushed by the expectation of a negative tenure decision. At MIT, for example, there is a 50% tenure rate in the science and engineering departments.72 This is similar to the overall tenure rate at
Research I universities (see above and footnote 95). Our analysis showed a small 4% difference in tenure rates for men and women; a number of other reports have documented similar differential tenure rates for men and women.73 Others document differential tenure rates for minority faculty.74 Some researchers have broken out tenure rates by field;75 in this finer analysis, between 1973 and 2001, women were between 1-3% less likely than men to get tenure in physical sciences, 2-4% more likely than men to get tenure in life sciences and engineering, and 8% less likely than men to get tenure in social sciences.
In addition to the cohort analysis described above, another way t analyze tenure decisions is by examining faculty who are reviewed for tenure.76 This analysis excludes faculty who leave the tenure track, and does not address time to tenure. Compared to the cohort analysis, the “review” paradigm yields higher tenure rates that are similar for men and women faculty.77 For early tenure decisions—those made within 2 years of hiring—tenure rates are 96% to 100% for men, women, and minority faculty. For 4th- and 6th-year tenure review cases, the rates are also similar for men and women in, but are lower for, minority faculty: 85% to 90% of men and women are granted tenure, while 75% to 82% of minority faculty are granted tenure.
Promotion
Women faculty gain promotion more slowly than men and are less likely to reach the highest academic rank, especially in the Research I universities (see Chapter 4). At one university, for example (Figure 3-6), the
|
73 |
National Science Foundation (2004). Gender Differences in the Careers of Academic Scientists and Engineers (NSF 04-323). Arlington, VA: National Science Foundation; AS Ash, PL Carr, R Goldstein, and RH Friedman (2004). Compensation and advancement of women in academic medicine: Is there equity? Annals of Internal Medicine 141(3):205-212; D Ginther (2001). Does Science Discriminate Against Women? Evidence from Academia (Working Paper 2001-02). Atlanta, GA: Federal Reserve Bank of Atlanta; National Research Council (2001). From Scarcity to Visibility: Gender Differences in the Careers of Doctoral Scientists and Engineers. Washington, DC: National Academy Press. |
|
74 |
MJ Dooris and M Guidos (2006). Tenure Achievement Rates at Research Universities. Presentation at the Annual Forum of the Association for Institutional Research, Chicago, IL, May 2006, http://www.psu.edu/president/pia//planning_research/reports/AIR_Tenure_Flow_Paper_06.pdf. |
|
75 |
D Ginther and S Kahn (2006). Does Science Promote Women? Evidence from Academia 1973-2001 (NBER SEWP Working Paper). Cambridge, MA: National Bureau of Economics Research, http://www.nber.org/~sewp/GintherKahn_Sciences_promo_NBER.pdf. |
|
76 |
This type of analysis is used by the National Academies Committee on Women in Science and Engineering in their 2006 workshop report (Box 1-3). |
|
77 |
Dooris and Guidos (2006), ibid. |
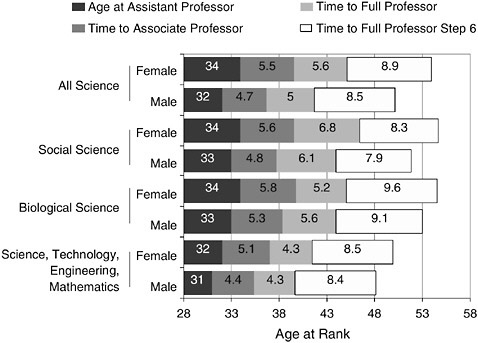
FIGURE 3-6 Advancing through the ranks: University of California, Berkeley, faculty, by sex and field.
NOTES: Science, technology, engineering, and mathematics (STEM) departments do not include biology. All Science is a composite of STEM, biology, and social science departments. Data are presented for all faculty, whether married, single, or parents. The regular professorial series consists of three ranks: assistant professor, associate professor, and full professor. Each rank is divided into steps. Advancement to full professor step six requires great distinction, recognized nationally or internationally in scholarly achievement or in teaching. See http://www.ucop.edu/acadadv/acadpers/tenure.html.
SOURCE: UC Berkeley Faculty Personnel Records, 1980-2003.
most substantial difference between men and women is in the time it takes to reach the associate professor level, although there is also a difference in the timing between tenure and full professor.78 The pattern is not unique; it has also been shown at Duke University and at MIT, where women faculty are promoted more slowly than men. Race and ethnicity is an additional
|
78 |
Additional data on time to promotion is provided by the National Academies Committee on Women in Science and Engineering in their 2006 workshop report (Box 1-3). |
factor strongly correlated with reduced probability of promotion to full professor: between 1973 and 2001, African American women were almost 10% less likely than men to be promoted to full professor within 15 years of PhD.79
The persistent effect of sex, even after controlling for a number of relevant variables, suggests that there is more to learn about the promotion process. Some researchers suggest that a reasonable explanation of women’s slower promotion and longer time in rank is that women are expected to meet higher standards for promotion, especially at Research I institutions.80 Another possibility is that women, particularly in the transition from achieving tenure to full professorship, are less likely to feel ready to apply. As discussed in Chapter 4, research shows that bias affects the judgments made about women scientists and engineers and often results in their research being less valued than research by men.
Faculty Retention
From a number of reports, projects, and task forces examining factors behind faculty retention and attrition a number of common threads emerge (Box 3-5).81
A key factor in retaining faculty of all types is the problem of differences in salaries between groups. A task force at the University of Colorado at Boulder (UC-Boulder) found that “non-competitive salaries represent the most-cited factor in faculty retention.”82 That concern was most prevalent among men; senior women faculty expressed more concern over salaries than junior women faculty. Other studies have found, however, that female faculty were less satisfied with their salaries than male faculty83 and studies
|
79 |
D Ginther, research commissioned by the committee. |
|
80 |
J Long, P Allison, and R McGinnis (1993). Rank advancement in academic careers: Sex differences and effects of productivity.” American Sociological Review 58(5):703-722; Ginther (2006), ibid. |
|
81 |
See NAS/NAE/IOM (2006). Biological, Social, and Organizational Components of Success for Women in Science and Engineering. Washington, DC: The National Academies Press; Gender Faculty Studies at Research I Universities Web site, http://www7.nationalacademies.org/cwse/gender_faculty_links.html; and the NSF ADVANCE Web site, http://www.nsf.gov/advance. |
|
82 |
University of Colorado at Boulder (2001). Faculty Recruitment and Retention Task Force Report, http://www.colorado.edu/AcademicAffairs/fac_recruit/fac_ recruit.doc. |
|
83 |
M Hemmasi, LA Graf, and JA Lust (1992). Correlates of pay and benefit satisfaction: The unique case of public university faculty. Public Personnel Management 21(4):442-443; CA Trower and JL Bleak (2004). Study of New Scholars. Gender: Statistical Report [Universities]. Cambridge, MA: Harvard Graduate School of Education, http://www.gse.harvard.edu/~newscholars/newscholars/downloads/genderreport.pdf. |
|
DEFINING THE ISSUES BOX 3-5 Factors Affecting Faculty Attrition
|
at MIT84 and elsewhere have noted that women faculty are often underpaid relative to men.85
An important issue related to salary is how universities structure and explain their tenure policies and procedures. Rigid policies for attaining tenure can raise difficulties for women and for junior faculty in general. As discussed above, women are more likely than men to leave the university at early points in their career.86 Trower and Chait report that both men and women receive little guidance about tenure policies and that junior faculty are likely to view tenure practices as “outmoded.”87 The Study of New Scholars at Harvard University reports significant differences in men and
|
84 |
Massachusetts Institute of Technology (1999). A Study on the Status of Women Faculty in Science at MIT, http://web.mit.edu/fnl/women/women.html. |
|
85 |
RR Callister (2006). The impact of gender and department climate on job satisfaction and intentions to quit for faculty in science and engineering fields. Journal of Technology Transfer 31:367-375. |
|
86 |
Also see D Teodorescu (2002). Faculty Gender Equity at Emory: PCSW Study Finds Both Fairness and Imbalances, http://www.emory.edu/ACAD_EXCHANGE/2002/octnov/pcsw.html; MN Harrigan (1999). An Analysis of Faculty Turnover at the University of Wisconsin-Madison. University of Wisconsin-Madison, http://wiscweb3.wisc.edu/obpa/Faculty Turnover/FacultyTurnover2.html. |
|
87 |
C Trower and R Chait (2002). Faculty diversity: Too little for too long. Harvard Magazine. March-April 2002. |
women faculty views of the tenure process; men are found to have clearer views of tenure prospects and expectations.88 Annual reviews and effective mentoring programs have been shown to clarify expectations and improve faculty retention (Box 6-3).
Conflicts between personal and professional life, as in the case of tenure, are often important in retention of junior and women faculty. Several studies show that women faculty are less satisfied than men with the interaction between their personal and professional lives.89 A task force at Columbia University notes that family responsibilities disproportionately impact women. Women are in their childbearing years at the same time they are developing their careers, and the demands of career and family often conflict.90 Such policies as child-care options and spousal hiring programs that are cognizant of the conflict can play a significant role in faculty retention. The UC-Boulder task force notes that spouse or partner employment opportunities can be an especially prevalent concern among junior faculty.91
Within a given faculty member’s professional life department climate and the presence or absence of a supportive work environment have important influence on attrition and retention. A number of factors commonly cited in faculty retention and attrition studies are related to the environment that faculty encounter in their workplaces.92 Work done by Callister suggests that department climate is an important factor for universities to consider when attempting to improve faculty job satisfaction and intentions to quit.93 Callister reports that women faculty tend to be less satisfied than men in their jobs and more likely to quit. In a similar finding, the Study of New Scholars at Harvard reports that women faculty are less satisfied than
|
88 |
Trower and Bleak (2004), ibid. |
|
89 |
S Bullers (1999). Selection effects in the relationship between women’s work/family status and perceived control. Family Relations: Interdisciplinary Journal of Applied Family Studies 48(2):181-188; LJ Sax, LS Hagedorn, M Arredondo, and FA Dicrisi (2002). Faculty research productivity: Exploring the role of gender and family-related factors. Research in Higher Education 43(4):423-446. |
|
90 |
Trower and Bleak (2004), ibid. |
|
91 |
University of Colorado at Boulder (2001). Faculty Recruitment and Retention Task Force Report, http://www.colorado.edu/AcademicAffairs/fac_recruit/fac_recruit.doc. |
|
92 |
SPK Jena (1999). Job, life satisfaction, and occupational stress of women. Social Science International 15(1):75-80; JC Holder and A Vaux (1998). African American professionals: Coping with occupational stress in predominantly white environments. Journal of Vocational Behavior 53(3):315-333; YF Niemann and JF Dovidio (1998). Relationship of solo status, academic rank, and perceived distinctiveness to job satisfaction of racial/ethic minorities. Journal of Applied Psychology 83(1):55-71. |
|
93 |
Callister (2006), ibid. |
men faculty with their workplace expectations and relationships, including availability of support, mentoring, and collaboration.94
The UC-Boulder task force noted a sense of “professional isolation” as the third-most common reason for faculty attrition for women and men faculty. Professional isolation may include a lack of support from colleagues, lack of inclusion in the department community, and rude or unsympathetic students. Furthermore, several studies, including ones at Colorado and Columbia, note that women (and junior faculty members) have fewer opportunities to serve on meaningful department and university committees.95 The 1999 MIT study expressed concern that women faculty were “excluded from any substantial power within the University.”96
A final issue related to the workplace environment was uncovered in a recent study at Rutgers University, which suggested that some women faculty’s outside offers are less likely than those of men to yield serious responses from university administrators, and it is more likely that those women will move to other universities.97
Surveys of female faculty members illuminate specific climate issues. In a national survey of more than 1,000 university faculty members carried out by the Higher Education Research Institute, women were more likely than men to feel that colleagues devalued their research, that they had fewer opportunities to participate in collaborative efforts, and that they were constantly being scrutinized.98 Other researchers found that men tended to devalue women’s contributions to an effort.99 In another study, exit interviews of faculty women who “voluntarily” left a large university indicated that one of the key reasons for their departure was the lack of respect that they had been given by their colleagues.100 Preston found that a majority of female professors perceived that because of their sex they had not been respected or treated appropriately.101 Similarly, in a survey of Professional
|
94 |
Trower and Bleak (2004), ibid. |
|
95 |
Columbia University (2005). http://www/cumc.columbia.edu/dept/ps/facultycouncil/docs/TaskForceonWomen Faculty Final Report 02_24_05.doc. University of Colorado at Boulder (2001), ibid; MIT (1999), ibid. |
|
96 |
Massachusetts Institute of Technology (1999), ibid. |
|
97 |
Rutgers University (2001). A Study of Gender Equity in the Faculty of Arts and Sciences, http://fas.rutgers.edu/onlineforms/gender_report.pdf. |
|
98 |
HS Astin and LJ Sax (1996). Developing scientific talent in undergraduate women. In The Equity Equation: Fostering the Advancement of Women in the Sciences, Mathematics and Engineering, eds. CS Davis, AB Ginorio, BB Hollenshead, and PM Rayman. San Francisco: Jossey-Bass Publishers. |
|
99 |
L Chliwniak (1997). ASHE-ERIC Higher Education Report ED 410 847. Washington, DC: ERIC Clearinghouse. |
|
100 |
SA Wenzel and C Hollenshead (1998). Former Women Faculty: Reasons for Leaving One Research University. Washington, DC: ERIC Document Service. |
|
101 |
AE Preston (2004). Leaving Science: Occupational Exit from Scientific Careers. New York: Russell Sage Foundation. |
Opportunities for Women in Research and Education grant recipients, women faculty reported that they had limited opportunities to participate in department or decision-making processes, had heard their research trivialized and discounted by other faculty members, had received little guidance about department procedures, and were ill informed about the tenure process.102 The Yale Women Faculty Forum has developed a specific exit survey and interview process (Box 3-6) that can serve as a model for others; the survey has led to the creation of specific professional development courses for postdoctoral scholars and junior faculty.
When asked why they left academic science and engineering, men overwhelmingly focus on low pay and the lack of career advancement, while women offered three main reasons: desire for more interesting work, lack of mentor or guidance, and difficulty shouldering family and career responsibilities.103 There is reason to believe that many women (and men) experience those discontents and do not leave the field, which can translate into lack of job satisfaction for more senior employees.
Departments vs. Centers
In light of the findings for faculty employed in university departments, it is interesting to note that participation in academic centers may offer different career opportunities for women scientists and engineers. In a nationally representative dataset on scientists and engineers working in research universities, Corley and Gaughan104 found that women were as likely as men to join centers and do so at a similar stage in their career. Most of the male-female differences observed in disciplinary settings, such as lower proportions of women in leadership positions, were sustained in centers, but women appeared to have greater research equality. Men and women in centers spend the same amount of time in writing grant proposals, conducting research, supervising graduate students, and administering grants. Corley and Gaughan suggest that centers may potentially serve as a leveling field for men and women academics, but much work remains to be done, particularly at the leadership level (Tables 4-3, 4-4, and 4-5). Women in centers are younger on the average and less likely to be tenured than their male colleagues. There are also fewer women of color in centers than in university departments.
|
102 |
SV Rosser (2004). The Science Glass Ceiling. New York: Routledge. |
|
103 |
AE Preston (2004), ibid. See also P Moguerou (2002). Job Satisfaction among US PhDs: The Effects of Gender and Employment Sectors (Working Paper), http://www.rennes.inra.fr/jma2002/pdf/moguerou.pdf. |
|
104 |
E Corley and M Gaughan (2005). Scientists’ participation in university research centers: What are the gender differences? Journal of Technology Transfer 30:371-381. |
|
EXPERIMENTS AND STRATEGIES BOX 3-6 Task Force on the Retention and Promotion of Junior Faculty, Yale Women Faculty Foruma One way to determine the reasons for leaving an academic position is simply to ask. To a certain degree, this is done in the longitudinal Survey of Doctoral Recipients, carried out by the National Science Foundation. However, institutions can gather more detailed information that can help modify existing policies or shape new initiatives focused on faculty retention. One such effort has been spearheaded by the Yale University Women Faculty Forum Task Force on Retention and Promotion of Junior Faculty. The Task Force designed an exit survey and distributed it to those tenure-track ladder faculty who departed in 2004 and 2005.b There was a 43% response rate; the task force performed follow-up interviews with many of the respondents. The task force collected basic demographic information, and asked respondents a series of questions about their employment plans, their experience at Yale, and for their rating of departmental environment. Among the survey questions were:
|
ECONOMIC IMPACT OF FACULTY ATTRITION
Even while turnover has its benefits in terms of bringing in new talent and ideas, replacing faculty members who leave can represent a substantial cost to universities, so it is worthwhile to invest in policies and practices that encourage faculty retention. Start-up costs associated with hiring new professors are often high. In addition to the costs incurred by a recruitment committee, average start-up costs for a new professor range from about $110,000 for an assistant professor in physics at a public nonresearch university to nearly $1.5 million for a senior faculty member in engineering at a private research institution.105 The Task Force on Faculty Recruitment
|
105 |
RG Ehrenberg, MJ Rizzo, and GH Jakubson (2003). Who bears the growing cost of science at universities? (Working Paper 9627). Cambridge, MA: National Bureau of Economic Research, http://www.nber.org/papers/w9627. |
After collating the survey and interview responses, the task force met with the college and graduate school deans, provosts, and the director of the Office of Institutional Research (OIR). OIR provided statistics on tenure and promotion that previously were not readily available. Following this meeting, the Dean of the Graduate School asked all department chairs to report on their mentoring practices for junior faculty. Since then, Yale has instituted a new position, Deputy Provost for Science and Technology and Faculty Development, to oversee the implementation of a core curriculum for the professional development of postdoctoral scholars and junior faculty. The first series of courses are being developed for the 2006-2007 academic year.
|
and Retention at UC-Boulder reports that in general, replacement costs are much greater than retention costs.106 It estimates that it costs $200,000-$400,000 to replace a natural sciences or engineering faculty member at a public research university, whereas “only a fraction of these costs would go a long way” in programs to help retain existing faculty.107 Tables 3-11 and 3-12 provide detailed listings of estimated start-up costs for new faculty hires.
Costs associated with hiring new faculty fall into several categories.
|
106 |
University of Colorado at Boulder (2001). Faculty Recruitment and Retention Task Force Report, http://www.colorado.edu/AcademicAffairs/fac_recruit/fac_recruit.doc. |
|
107 |
University of Colorado at Boulder (2001), ibid. |
TABLE 3-11 Average Start-up Packages for Assistant Professors in Selected Fields Starting in 2000-2001 at Public Research I Universities
|
Field |
Start-up Equipment |
Other Supporta |
Moving Allowance |
Total Startup |
|
Biology |
$190,000 |
$27,000 |
$4,000 |
$221,000 |
|
Chemical engineering |
$225,000 |
$164,000 |
$5,000 |
$394,000 |
|
Chemistry/biochemistry |
$231,000 |
$14,000 |
$5,000 |
$250,000 |
|
Computer science |
$51,000 |
$35,000 |
$4,000 |
$90,000 |
|
Economics |
$6,000 |
$17,000 |
$5,000 |
$28,000 |
|
Geology |
$119,000 |
$0 |
$4,000 |
$123,000 |
|
Physics |
$156,000 |
$20,000 |
$4,000 |
$180,000 |
|
Political science |
$4,000 |
$5,000 |
$3,000 |
$12,000 |
|
Psychology |
$35,000 |
$9,000 |
$3,000 |
$47,000 |
|
Sociology |
$5,000 |
$4,000 |
$4,000 |
$13,000 |
|
aIncludes graduate student support ($140,000) and summer salary ($24,000) for chemical engineering; other disciplines also include support for postdoctoral scholars, renovations, and travel, but many schools left off such “other support” in the survey. SOURCE: University of Colorado at Boulder (2001). Faculty Recruitment and Retention Task Force Report, http://www.colorado.edu/AcademicAffairs/fac_recruit/fac_recruit.doc. |
||||
There are costs associated with establishing search and recruitment committees and costs associated with relocation allowances, infrastructure, and support (for example, for laboratory renovations, offices, and equipment that might be required in support of new faculty). Those costs are included in the estimates discussed previously (and detailed in Tables 3-11 and 3-12). In addition, there is a substantial secondary cost associated with the loss of faculty and hiring of new faculty: that of research and grant productivity. In many cases, new faculty do not immediately bring the type of research-grant award support that productive, established faculty might. Callister reports that “it can take 10 years for a new faculty member in science or engineering to develop enough of a positive revenue stream from grants and to recoup start-up costs. If a faculty member leaves before startup costs are recovered, the university loses money and must start over again.”108 In monetary terms, that can be substantial. The UC-Boulder task force estimated that a productive faculty member “may bring about $100K per year” in external support to the university, external support that would take a new faculty member several years to generate.109
TABLE 3-12 Start-up Costs Associated with New Professors
|
|
|
Private Research 1 Average (N) |
Private Nonresearch 1 Average (N) |
Public Research 1 Average (N) |
Public Nonresearch 1 Average (N) |
||||
|
AA |
Physics and astronomy |
395,746 (9) |
147,944 (18) |
320,932 (42) |
169,491 (56) |
||||
|
AA |
Biology |
403,071 (14) |
199,754 (26) |
308,210 (38) |
172,582 (55) |
||||
|
AA |
Chemistry |
489,000 (20) |
221,052 (29) |
441,155 (43) |
210,279 (71) |
||||
|
AA |
Engineering |
390,237 (19) |
152,101 (20) |
213,735 (52) |
112,875 (46) |
||||
|
HA |
Physics and astronomy |
563,444 (9) |
254,071 (14) |
481,176 (41) |
248,777 (47) |
||||
|
HA |
Biology |
437,917 (12) |
208,886 (22) |
430,270 (37) |
217,082 (49) |
||||
|
HA |
Chemistry |
580,000 (17) |
259,348 (23) |
584,250 (40) |
284,269 (60) |
||||
|
HA |
Engineering |
416,875 (16) |
209,057 (21) |
259,494 (50) |
146,831 (43) |
||||
|
AP |
Physics and astronomy |
701,786 (7) |
90,000 (2) |
740,486 (29) |
359,783 (23) |
||||
|
AP |
Biology |
957,143 (7) |
481,458 (12) |
651,087 (23) |
438,227 (31) |
||||
|
AP |
Chemistry |
983,929 (14) |
532,046 (11) |
989,688 (32) |
550,349 (33) |
||||
|
AP |
Engineering |
1,441,667 (9) |
326,694 (14) |
408,443 (38) |
223,292 (23) |
||||
|
HP |
Physics and astronomy |
1,000,000 (4) |
418,333 (3) |
1,110,577 (24) |
455,882 (17) |
||||
|
HP |
Biology |
1,575,000 (5) |
555,500 (10) |
856,250 (16) |
709,444 (27) |
||||
|
HP |
Chemistry |
1,172,222 (9) |
575,000 (8) |
1,187,115 (26) |
648,913 (23) |
||||
|
HP |
Engineering |
1,807,143 (7) |
452,000 (34) |
472,086 (34) |
254,597 (23) |
||||
|
NOTES: Responses were tabulated from the Cornell Institute of Higher Research Institute Survey of Start-Up Costs and Laboratory Space Allocation Rules that was mailed to 3-5 chairs of selected biological science, physical science, and engineering departments at each reseach and doctoral university during the summer of 2002. AA: average start-up costs for new assistant profersors. HA: high-end start-up costs for new assistant professors. AP: aveage start-up costs for senior faculty. HP: high-end start-up costs for senior faculty. SOURCE: RG Ehrenberg, MJ Rizzo, GH Jakubson (2003). Who Bears the Growing Cost of Science at Universities? (Working Paper 9627). Cambridge, MA: National Bureau of Economic Research, http:www.nber.org/papers/c9627. |
|||||||||
Because science and engineering faculty incur costs continuously, some researchers have suggested that the aggregate costs required by new faculty (and not merely the initial start-up costs) should be considered in analyzing the cost of faculty turnover. Joiner110 has suggested an economic model for calculating the cost of turnover based on net present value (NPV). This model is commonly used in business to project the value of projects. It views faculty as long-term investments by considering all positive and negative cash flows for faculty members over time. Applying the model to faculty costs allows projections of the yearly costs of faculty salary, fringe and personal benefits, supplies and equipment, facility renovation, and other factors that are typically part of the costs accrued by universities in support of faculty (either new or existing). At the same time, the positive cash flows provided by a faculty member to the university (grant support, clinical revenues, and so on) are estimated. In concert, those two parts of the NPV model yield an estimate of the net cost (or financial yield) of a faculty member to a university.111
Using the NPV model, one could estimate the length of time a faculty member must remain at an institution for the institution to see a financial return on its investment. From a strictly economic perspective, if a faculty member leaves an institution prematurely (before the NPV model shows a positive yield), the institution loses money. In essence the NPV model dictates that “a dollar today is worth more than a dollar tomorrow.”112 Existing faculty are likely to have a positive NPV, whereas new faculty are likely to show a negative net cost. Accordingly, this model suggests that it is in the best financial interest of the university to direct efforts at retaining faculty. Some effective retention practices are outlined in Box 3-7.
CASE STUDY: CHEMISTRY113
To examine the issue of faculty recruitment in more detail, the committee focused on chemistry, a field with a relatively high proportion of women PhDs. Information on the age, sex, and training of chemistry faculty members was obtained from the American Chemical Society’s 2001 DGR. The study was limited to faculties in the departments of chemistry, chemistry and biochemistry, or chemical biology at 86 Research I institutions. Only
|
EXPERIMENTS AND STRATEGIES BOX 3-7 The University of Washington Faculty Retention Toolkita “Faculty retention is critical to the health of a university department both for morale reasons and also for economic reasons …” Recognizing that, the University of Washington has developed a toolkit designed to assist department chairs in retaining faculty of all ranks. The toolkit contains nine specific measures that when applied together act to encourage faculty satisfaction and productivity. The measures are designed to be applied to all faculty in a department but are noted to be “particularly important to women and underutilized minorities.” The toolkit contains the following measures:
|
TABLE 3-13 2001 Chemistry Faculty Members, by Country of Doctorate
|
|
Total |
Men |
Women |
|
All |
2,476 |
2,218 |
261 (10.5%) |
|
Foreign PhD |
305 |
284 |
21 (6.9%) |
|
SOURCE: American Chemical Society (2001). Directory of Graduate Research. Washington, DC: American Chemical Society. |
|||
data on persons holding the rank of assistant, associate, or full professor were ascertained. Persons for whom there was no biographical information on training or rank were excluded from the study.114 The hiring data clearly show that chemistry faculty who have done their graduate work at Research I universities are overwhelmingly preferred; in addition, women faculty are drawn from a smaller pool of institutions than men.
Of the 2,476 faculty members at the Research I institutions, 10.5% were female (Table 3-13). 12.3% of the faculty members earned their doctorates at a non-US institution; of these 6.9% were women—a smaller fraction than they were of all the faculty members. The top foreign institutions training the greatest number of future faculty members were Cambridge University, University College of London, and Oxford University.
The median and average age of men faculty members were 49 years and 50 ± 11.8 years, respectively. The women faculty members were on average younger, with a median age of 42 years and an average age of 44 ± 9.2 years. It should be noted that a number of individuals did not give their date of birth (20 men and 11 females); therefore, they could not be included in these calculations.
Since 1981 there has been an increase in the hiring/retention of women. A comparison of the number of men and women faculty members who received their doctorates during the same years indicates that the growth in the number of women faculty members has mirrored that of men who received their doctorate in the same time interval (Figure 3-7).
In 2001, women held 18.3% of the positions at the rank of assistant professor and 17.9% of associate professor (Table 3-14) at Research I universities. A much lower percentage, 6.4%, of the full professor positions were held by women.
Less than 4% of chemistry doctorates were found to hold faculty
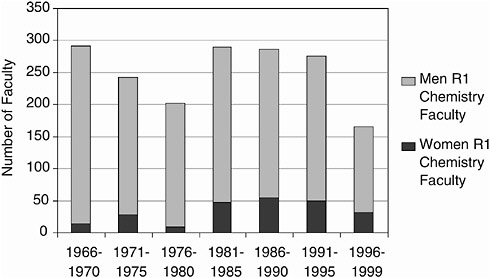
FIGURE 3-7 Comparison of the number of men and women chemistry faculty members at RI institutions.
SOURCE: American Chemical Society (2001). Directory of Graduate Research. Washington, DC: American Chemical Society.
positions at Research I institutions. With the exception of the years 1971-1975, a higher percentage of men than women who earned chemistry PhDs ever were employed on Research I university faculties (Table 3-15). It appears that after all the efforts to increase the diversity of faculties, women with doctorates are still lagging behind men in attaining faculty positions at Research I institutions.
There is a strong preference by Research I chemistry departments to hire graduates from a small subset of universities. Ten of the top 11 institutions were common to both men and women faculty (Table 3-16). Eleven
TABLE 3-14 Chemistry Faculty, by Sex and Rank, 2001
|
Rank |
Total |
Men |
Women |
|
Assistant professor |
464 |
379 |
85 (18.3%) |
|
Associate professor |
408 |
335 |
73 (17.9%) |
|
Full professor |
1,605 |
1,502 |
103 (6.4%) |
|
SOURCE: American Chemical Society (2001). Directory of Graduate Research. Washington, DC: American Chemical Society. |
|||
TABLE 3-15 Proportion of Chemistry Doctorates Who Obtain Chemistry Faculty Positions at Research I Institutions, by Sex and Year of PhD
|
Years |
Chemistry PhDs Granted |
Chemistry PhDs Who Obtain an R1 Faculty Position |
|
Women |
|
|
|
1966-70 |
686 |
14 (2.0%) |
|
1971-75 |
928 |
28 (3.0%) |
|
1976-80 |
1,038 |
8 (0.8%) |
|
1981-85 |
1,488 |
47 (3.2%) |
|
1986-90 |
2,231 |
54 (2.4%) |
|
1991-95 |
2,964 |
50 (1.7%) |
|
1996-99 |
2,545 |
31 (1.2%) |
|
Men |
|
|
|
1966-70 |
8,689 |
278 (3.2%) |
|
1971-75 |
8,730 |
214 (2.5%) |
|
1976-80 |
6,805 |
195 (2.9%) |
|
1981-85 |
7,163 |
244 (3.4%) |
|
1986-90 |
7,732 |
233 (3.0%) |
|
1991-95 |
7,931 |
226 (2.8%) |
|
1996-99 |
7,412 |
135 (1.8%) |
|
SOURCES: Chemistry PhDs: National Science Foundation (1966-2001). Survey of Earned Doctorates. Arlington, VA: National Science Foundation; data accessed through WebCASPAR. Chemistry Faculty: American Chemical Society (2001). Directory of Graduate Research. Washington, DC: American Chemical Society. |
||
departments graduated 54.6% of the US-trained men future RI faculty; Harvard University and the University of California, Berkeley, trained by far the most. For women, 11 departments graduated 51.7% of the US-trained women future RI faculty members, and Berkeley trained by far the most.
During the years 1988-1997, women received 26.4% of the doctorates in chemistry. A lower proportion of women doctorates obtained faculty positions at Research I institutions than did men doctorates (Table 3-17). Of those Research I universities that hired more than 5 faculty, 4 hired above the pool, 7 hired at about the pool, and 19 hired substantially below the available pool of women chemistry PhD graduates.
Programs designed to increase the representation of women chemistry faculty need to take into account cuts in the number of full-time faculty slots at doctorate-granting institutions, as demonstrated by the larger proportion but smaller number of women faculty (Table 3-18). This shrinkage of the tenure track is a general phenomenon. The academic employment of
TABLE 3-16 Institutions Training the Greatest Number of Chemistry Faculty at Research I Institutions, by Sex and Year of PhD
|
Men Faculty Membersa |
Women Faculty Membersb |
||
|
Institution |
Faculty Membersc |
Institution |
Faculty Membersc |
|
Harvard |
179 |
Berkeley |
32 |
|
Berkeley |
175 |
California Institute of Technology |
15 |
|
MIT |
123 |
Harvard |
10 |
|
California Institute of Technology |
96 |
MIT |
10 |
|
Wisconsin |
92 |
Yale |
10 |
|
Stanford |
82 |
Cornell |
10 |
|
University of Illinois, Urbana-Champaign |
75 |
University of Illinois, Urbana-Champaign |
8 |
|
Columbia |
68 |
UCLA |
8 |
|
Chicago |
62 |
Stanford |
7 |
|
Yale |
52 |
Columbia |
7 |
|
Cornell |
51 |
Chicago |
7 |
|
Total: |
1,055 |
Total: |
124 |
|
a54.6% of US-trained male faculty members. b51.7% of US-trained female faculty members. cNumber of PhDs trained at institution who subsequently hold faculty position at RI institution. SOURCE: American Chemical Society (2001). Directory of Graduate Research. Washington, DC: American Chemical Society. |
|||
science and engineering PhDs increased from 118,000 in 1973 to 258,300 in 2003, full-time faculty positions grew more slowly than postdoctoral and other full- and part-time positions, and growth was slower than in the government and business sectors.115
CONCLUSION
Individual efforts can have dramatic effects but sustained change is unlikely unless there is a transformation of the process by which students and faculty are educated, trained, recruited, and retained. To increase the numbers of women in science and engineering education and academic careers, policy action should focus on specific lever points: the transition to
TABLE 3-17 Number of Faculty Hired at Selected Research I Institutions, by Sex, 1988-1997
|
Hiring Institutiona |
Number of Faculty Hired |
|||
|
Men |
Women |
Total |
% Women |
|
|
University of California, Berkeley |
49 |
19 |
68 |
27.9 |
|
Harvard University |
32 |
3 |
35 |
8.6 |
|
California Institute of Technology |
27 |
6 |
33 |
18.2 |
|
MIT |
25 |
0 |
25 |
0.0 |
|
Stanford University |
23 |
5 |
28 |
17.9 |
|
University of Wisconsin, Madison |
19 |
2 |
21 |
9.5 |
|
University of Illinois, Urbana-Champaign |
18 |
2 |
20 |
10.0 |
|
Yale University |
15 |
5 |
20 |
25.0 |
|
University of California, Los Angeles |
13 |
4 |
17 |
23.5 |
|
University of Chicago |
12 |
4 |
16 |
25.0 |
|
Columbia University |
12 |
1 |
13 |
7.7 |
|
Cornell University |
12 |
6 |
18 |
33.3 |
|
North Carolina State University |
10 |
2 |
12 |
16.7 |
|
University of Texas, Austin |
10 |
0 |
10 |
0.0 |
|
Northwestern University |
8 |
1 |
9 |
11.1 |
|
University of Pennsylvania |
8 |
0 |
8 |
0.0 |
|
University of Arizona |
7 |
0 |
7 |
0.0 |
|
University of Michigan, Ann Arbor |
7 |
1 |
8 |
12.5 |
|
University of Minnesota |
7 |
2 |
9 |
22.2 |
|
Ohio State University |
6 |
0 |
6 |
0.0 |
|
University of California, Irvine |
5 |
1 |
6 |
16.7 |
|
University of California, San Diego |
5 |
1 |
6 |
16.7 |
|
Princeton University |
4 |
2 |
6 |
33.3 |
|
University of Colorado, Boulder |
3 |
3 |
6 |
50.0 |
|
Pennsylvania State University |
5 |
0 |
5 |
0.0 |
|
Purdue University |
5 |
0 |
5 |
0.0 |
|
University of Southern California |
5 |
0 |
5 |
0.0 |
|
Rochester University |
4 |
1 |
5 |
20.0 |
|
Texas A&M University |
4 |
1 |
5 |
20.0 |
|
Iowa State University |
3 |
2 |
5 |
40.0 |
|
aOnly Research I universities that produced more than 5 faculty members are included. SOURCE: American Chemical Society (2001). Directory of Graduate Research. Washington, DC: American Chemical Society. |
||||
college, graduate school faculty interactions, application and recruitment to faculty positions, and retention of faculty.
Increasing the number of women and underrepresented minority-group faculty substantially will require assistance from faculty, individual departments, and schools; oversight and leadership from provosts and presidents; and sustained normative pressure, possibly from external sources. As dis-
TABLE 3-18 Women PhD Chemists Working Full-Time at PhD-Granting Institutions, by Rank and Sex, 1990-2005
cussed in the previous chapter, the first step is to understand that women are as capable as men of contributing to the science and engineering enterprise. As discussed in the next chapter, the science and engineering community needs to come to terms with the biases and structures that impede women from realizing their potential. The data show that policy changes are sustainable only if they create a “new normal,” a new way of doing things. The community needs to work together, across departments, through professional societies, and with funders and federal agencies, to bring about gender equity so that our nation can perform at its full potential.


