
2
Consumption Patterns and Composition of Seafood
This chapter provides a discussion of seafood consumption in terms of trends over time, major types of seafood, and current intake among the general population and various subgroups. This is followed by a discussion of future trends in seafood supplies that may have an impact on seafood selections. The discussion then reviews information on the consumption and sources of nutrients, particularly the omega-3 fatty acids eicosapentaenoic acid (EPA) and docosahexaenoic acid (DHA), because seafood is their primary source in the US diet. Finally, the overall nutrient profiles of seafood are compared to those of other foods in the diet.
SEAFOOD CONSUMPTION
Trends over Time
Trends in seafood consumption can be tracked using national food supply data. These data are especially useful because the methodology for collecting and analyzing them has remained consistent for nearly 100 years. Per capita seafood consumption is calculated by the National Marine Fisheries Service (NMFS) of the Department of Commerce using a disappearance model. This model estimates, on an annual basis, the total US supply of imported and landed seafood converted to raw edible weight, minus exports and other decreases in supply. The edible supply determined by this method is then divided by the total population to estimate per capita consumption (Source: http://www.nmfs.noaa.gov). The estimate can be considered an upper bound of seafood consumption, because some amount
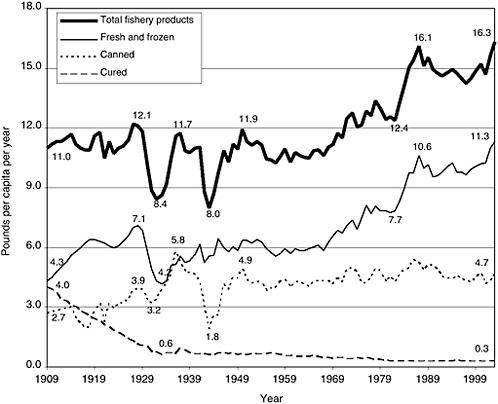
FIGURE 2-1 Trends in US consumption of total fishery products, by type (boneless, trimmed [edible] weight), in pounds per capita per year, 1909–2003. Figures are calculated on the basis of edible raw meat. Excludes edible offal, bones, and viscera for fishery products. Excludes game consumption for fishery product. Calculated from data not rounded.
SOURCE: ERS, 2004.
of the product is wasted at the household level. As shown in Figure 2-1, seafood consumption has increased since 1909, with notable exceptions during the Depression and the Second World War. In 2003, per capita seafood consumption was 16.3 pounds per person (Source: http://www.ers.usda.gov/data/foodconsumption/spreadsheet.mtfish.xls). As can be seen from Figure 2-1, the increase in seafood consumption results from an increase in consumption of fresh and frozen forms rather than canned and cured seafood.
Major Types of Seafood
There are several ways to consider the major types of seafood consumed, as shown in Tables 2-1 through 2-3. NMFS data are useful for
TABLE 2-1 NMFS Disappearance Data Ranked by Seafood Type for 2004 and 1994
|
|
2004 |
1994 |
||
|
Rank |
Fish |
Estimated Per Capita Consumption (pounds) |
Fish |
Estimated Per Capita Consumption (pounds) |
|
1 |
Shrimp |
4.2 |
Canned tuna |
3.3 |
|
2 |
Canned tuna |
3.3 |
Shrimp |
2.5 |
|
3 |
Salmon |
2.2 |
Pollock |
1.5 |
|
4 |
Pollock |
1.3 |
Salmon |
1.1 |
|
5 |
Catfish |
1.1 |
Cod |
0.9 |
|
6 |
Tilapia |
0.7 |
Catfish |
0.9 |
|
7 |
Crab |
0.6 |
Clams |
0.5 |
|
8 |
Cod |
0.6 |
Flatfish |
0.4 |
|
9 |
Clams |
0.5 |
Crab |
0.3 |
|
10 |
Flatfisha |
0.3 |
Scallops |
0.3 |
|
NOTES: The figures are calculated on the basis of raw, edible meat, that is, excluding such offals as bones, viscera, and shells. Excludes game fish consumption. aIncludes flounder and sole. SOURCE: NFI, 2005. |
||||
examining the top species entering retail distribution channels in a given year. Table 2-1 shows estimated US per capita consumption calculated from disappearance data by type of seafood for 1994 and 2004. Over this decade, shrimp and tuna remained the most frequently consumed seafood; the top
TABLE 2-2 Percentage of Persons (Aged 2 and Older) Reporting Having Eaten Different Types of Seafood in Last 30 Days, 1999–2000
|
Rank |
Seafood Type |
Percent Consuming |
|
1 |
Shrimp |
84.6 |
|
2 |
Tuna |
49.1 |
|
3 |
Crab |
25.3 |
|
4 |
Breaded fisha |
23.6 |
|
5 |
Salmon |
20.2 |
|
6 |
Clams |
15.2 |
|
7 |
Catfish |
14.9 |
|
8 |
Scallops |
13.2 |
|
9 |
Lobster |
12.3 |
|
10 |
Oysters |
10.1 |
|
aBreaded fish, although not identified by type, is commonly pollock, which explains its high ranking among the top 10 seafoods consumed. SOURCE: CDC/NCHS, 1999/2000. |
||
TABLE 2-3 Proportion of Total Seafood Consumed on a Given Day, for Various Types of Seafood, 1999–2000
|
Rank |
Seafood Type |
Percent Consumed |
|
1 |
Tuna |
22.1 |
|
2 |
Shrimp |
16.1 |
|
3 |
Salmon |
8.9 |
|
4 |
Mix of fish |
8.1 |
|
5 |
Crab |
7.5 |
|
6 |
Cod |
5.1 |
|
7 |
Flounder |
4.5 |
|
8 |
Catfish |
4.2 |
|
9 |
Don’t know type |
3.4 |
|
10 |
Clams |
2.4 |
|
SOURCE: DGAC, 2005. |
||
ten seafood types were consistent, except that tilapia replaced scallops. The data represented in Table 2-1 does not take into account possible regional differences in seafood consumption. Rupp et al. (1980) reported that most regional differences in seafood consumption were attributable to freshwater and shellfish. Generally, consumption of freshwater species was greater in inland compared to coastal regions. Miller and Nash (1971) reported that overall shellfish consumption was greater in coastal regions, but the species consumed varied between northern and southern coastal areas, e.g., consumption of clams was greater in New England whereas consumption of oysters was greater in South Atlantic and Pacific states.
Another way of considering the top seafood is to compare the percentage of the population having eaten different types of seafood. In 1999–2000, the National Health and Nutrition Examination Survey (NHANES) queried respondents about their frequency of consumption of various seafood types in the previous 30 days. Table 2-2 provides a ranking of these by the percentage reporting consumption at least once. Consistent with the NMFS data, shrimp and tuna are the types consumed by the largest percentage of respondents, and crab, salmon, clams, catfish, scallops, and cod are included among the top choices. “Breaded fish” is not identified by type, and could represent some double-counting with other types, but is of interest for its relatively high use and caloric density.
Finally, another indication of the top types of seafood can be gleaned from the 1999–2000 NHANES 24-hour recalls of dietary intake. While respondents report seafood consumption in various ways—consumed with or without other ingredients added—the seafood portion alone can be examined by disaggregating all the ingredients using the US Department of Agriculture’s (USDA) FoodLink database. Table 2-3 provides the major types of seafood consumed in the United States, using food intake data from
all respondents aged 2 years and over. The types of seafood accounting for the greatest proportion consumed on a given day were tuna, about 22 percent; shrimp, about 16 percent; salmon, about 9 percent; mixed fish, about 8 percent; and crab, about 7 percent (DGAC, 2005).
The congruence of disappearance and consumption data on the types of seafood consumed in the diet of the US population provides a solid basis from which to make recommendations for consumer choices. Notably, the four fish (shark, swordfish, king mackerel, and tilefish) identified in federal advisories (US EPA/FDA, 2004) as those which pregnant women should avoid eating are not among those that are widely consumed by the general population.
It should also be noted that tuna consumption shown on Tables 2-1 to 2-3 represents an aggregate of both “light” and “white” tuna. According to the USDA, approximately 75 percent of tuna consumed is light and 25 percent is white (DGAC, 2005). Substantial differences exist between light and white tuna, in both fatty acid composition and potential toxicants (see Box 2-1). The significance of this aggregation will become evident in the following discussions.
Current Seafood Intake by the General Population
Food intake data obtained using 24-hour recalls from a representative sample are generally considered the best source of point estimate consumption data for a population. As shown in Table 2-4, about 16 percent of individuals consume some seafood on a given day, with the average quantity consumed being 89 grams (g) or approximately 3 ounces. These are quantities reported as eaten, so they generally represent cooked weights. Adult males and pregnant/lactating women whose intake was at or above the 95th percentile of quantities consumed reported intakes exceeding 280 g or about 10 ounces for days they consumed seafood.
The percentage of individuals consuming seafood varies among age groups, with children and adolescents being least, and those aged 40 to 59 years most, likely to consume seafood on a given day. Within each age category, there is little difference between the percentage of males and females consuming seafood. If the entire population consumed two 3-ounce servings (4 ounces raw) per week, the average quantity consumed per person per day would be expected to be 24 g per day (28 g per ounce × 6 ounces per week/7 days per week). Table 2-4 shows that no groups averaged this level of intake, and few groups even came close. These data suggest that seafood consumption for most individuals in the population is below targeted intake levels. Further, the committee recognizes that because of limitations in the supply of available seafood along with reported seafood consumption pat-
|
BOX 2-1 Tuna: White vs. Light Tuna is the most popular fish used for canning and is the second most consumed type of seafood in the United States. Japan and the United States consume 36 and 31 percent, respectively, of the global tuna catch. Tuna is a predatory fish that, if consumed in large quantities, may contain levels of methylmercury that exceed recommended safe levels. Although many different tuna species are fished, the most popular commercial varieties are described below. White Tuna Albacore—high in fat and rich in EPA/DHA; it has the whitest flesh and is typically referred to as white tuna; it is eaten both canned and fresh. Albacore generally contains more methylmercury than other types of tuna and may also contain more lipophilic compounds. Northern Bluefin—high in fat and EPA/DHA; it is a slow-growing and thus rarer species than albacore and has a very high-quality meat; its major market is Japan, where it is used for sashimi. Southern Bluefin—stocks are in decline and thus it is harder to obtain than other tunas. It is the most expensive fresh tuna. Light Tuna Skipjack—leaner than albacore tuna; it is the most commonly used tuna for canning. Yellowfin—larger and leaner than albacore; it has pale pink flesh and is the second most popular species of tuna used in canning. Bigeye—similar to yellowfin; it has a milder flavor than skipjack or yellowfin and is frequently used in canning. Most canned tuna sold in the United States is available as “solid,” also called “fancy” (a solid piece of loin, cut to fit the can); or “chunk” (a mixture of cut pieces). Canned tuna comes packed in either oil or water and is labeled either “white” or “light.” Chunk light tuna packed in water is the most popular form of canned tuna sold in the United States. The source for most of this tuna is skipjack, although individual cans may contain more than one species of tuna. Albacore or “white” tuna is almost always packed in water in solid form. NOTES: A standard of identity is used to define the species of fish that may be canned under the name “tuna” (21 CFR 161.190[a]). There is also a standard for fill-of-container of canned tuna (21 CFR 161.190[c]). These standards provide for various styles of pack, including solid pack, chunk or chunk style, flakes, and grated tuna. Provision is also made for type of packing media (water or oil), certain specified seasonings and flavorings, color designations, and methods for determining fill-of-containers (Source: http://www.cfsan.fda.gov/~dms/qa-ind4g.html). SOURCE: Derived from US Tuna Foundation (http://www.tunafacts.org/abouttuna/index.html). |
TABLE 2-4 Total Seafood: Percentage of Persons Using Food and Quantities Consumed in a Day
terns for most Americans, it is unlikely that targeted intake levels will be achieved on a population-wide scale.
Figure 2-2 provides an indication of where people are most likely to consume seafood. According to data from the 1999–2000 NHANES, about 58 percent of seafood is consumed at home or in someone else’s home, 25 percent is consumed in a restaurant, and 8 percent at work or school. Only about 4 percent is consumed at a fast-food restaurant, though some at-home consumption could include seafood brought into the house from a fast-food outlet.
|
20–39 |
40–59 |
60 and older |
Pregnant/ Lactating Women |
Females, Age 15 to 45 |
|||
|
Males |
Females |
Males |
Females |
Males |
Females |
||
|
1372 |
1844 |
1345 |
1361 |
1512 |
1549 |
709 |
3658 |
|
16.6 |
17.2 |
19.3 |
19.4 |
17.8 |
18.2 |
19.3 |
16.4 |
|
110.7 |
83.3 |
112.3 |
82.1 |
101.8 |
76.7 |
97.7 |
81.9 |
|
7.4 |
6.4 |
7.8 |
6.4 |
7.5 |
5.2 |
15.7 |
5.8 |
|
3.1 |
0.1 |
4.6 |
0.1 |
2.8 |
3.6 |
0.1 |
0.1 |
|
8.5 |
4.9 |
16.8 |
1.5 |
16.8 |
11.3 |
0.1 |
3.6 |
|
29.6 |
26.9 |
49.4 |
27.9 |
41.9 |
25.6 |
37.3 |
24.5 |
|
72.8 |
58.5 |
90.0 |
55.8 |
83.4 |
56.2 |
60.8 |
55.8 |
|
151.1 |
95.6 |
137.3 |
118.7 |
118.2 |
105.2 |
119.7 |
98.6 |
|
257.7 |
172.5 |
237.2 |
178.5 |
220.6 |
166.0 |
268.6 |
174.2 |
|
292.6 |
268.6 |
294.9 |
252.8 |
352.9 |
192.2 |
306.9 |
262.5 |
|
18.4 |
14.3 |
21.6 |
15.9 |
18.1 |
14.0 |
18.8 |
13.4 |
|
1.6 |
1.6 |
1.7 |
1.9 |
1.8 |
0.9 |
3.4 |
1.4 |
Current Seafood Intake by Population Subgroups
Results from several studies indicate differences in seafood consumption among specific ethnic groups (Burger et al., 1999; Burger, 2002; Sechena et al., 2003; Sharma et al., 2003, 2004; Arnold and Middaugh, 2004; Ballew et al., 2004). Some of these population groups may have higher exposure to contaminants as a result of their seafood consumption practices. For example, they may consume more fish, compared to the general population, from waters in locations known to be contaminated. While data from studies of consumption practices are not directly comparable because of
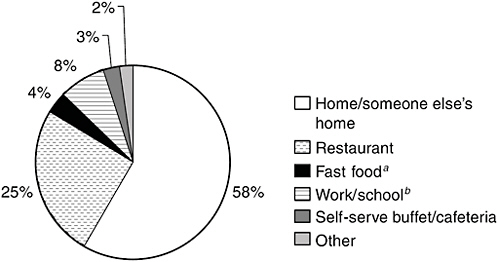
FIGURE 2-2 Distribution of seafood consumption by place it was consumed.
aIncludes food eaten at takeout restaurant, in store, and in car.
bIncludes food eaten by children in day care.
SOURCE: CDC/NCHS, 1999/2000.
methodological and reporting differences, they are useful for gleaning some insights into differences in consumption among different groups.
Multiethnic Cohort Study
The Multiethnic Cohort (MEC) Study is a large, population-based study designed to assess variations in specific rates of cancer occurrence among various ethnic groups and to characterize both environmental and genetic factors contributing to cancer incidence. Conducted between 1993 and 1996, the study collected comprehensive lifestyle and dietary data on the cohort (Sharma et al., 2003, 2004). The cohort reflected a range of educational levels, although cohort members were more educated than the general population.
Study participants in Hawaii and Los Angeles, California, included population samples from five self-identified ethnic groups—African Americans, Latinos, Japanese Americans, Native Hawaiians, and Whites—aged 45 to 75 years, who completed a mailed self-administered quantitative Food Frequency Questionnaire (FFQ) that was developed specifically for the study population (Sharma et al., 2004). The study objectives included providing prospective data on exposures and biomarkers thought to alter cancer risk; data collected from the questionnaires included information on dietary and other lifestyle and health practices (Kolonel et al., 2004). Table 2-5 shows
TABLE 2-5 Mean Seafood Intake Consumed Per Week Among Various Ethnic Groups, in the Multiethnic Cohort Study (1993–1996)
|
Ethnic Group |
Mean + SDa, Amount Consumed Per Week (ounces) |
|
African Americans |
|
|
Men (n=11,772) |
4.9±4.9 |
|
Women (n=20,130) |
4.2±4.2 |
|
Latinos, born in Mexico, South or Central America |
|
|
Men (n=10,180) |
4.9±5.6 |
|
Women (n=10,903) |
3.5±4.9 |
|
Latinos, born in United States |
|
|
Men (n=10,613) |
3.5±4.2 |
|
Women (n=11,255) |
2.8±3.5 |
|
Japanese Americans |
|
|
Men (n=25,893) |
7.0±6.3 |
|
Women (n=28,355) |
5.6±4.9 |
|
Native Hawaiians |
|
|
Men (n=5979) |
9.1±9.1 |
|
Women (n=7650) |
7.7±7.7 |
|
Whites |
|
|
Men (n=21,933) |
4.9±4.9 |
|
Women (n=25,303) |
3.5±3.5 |
|
NOTE: The daily amounts reported in the study were converted to weekly amounts for this table. aSD = Standard Deviation. SOURCES: Derived from Sharma et al., 2003, 2004. |
|
information collected from the MEC study on consumption of seafood by specific ethnic groups. The study reported food intakes in terms of ounces of lean meat equivalents, which for seafood can generally be thought of as ounces of cooked seafood consumed. The daily amounts reported in the study were converted to weekly amounts for Table 2-5. While these data are not representative of every ethnic group in the United States, and there is large variation in intakes among all groups; the means suggest there may be higher intakes among Native Hawaiians and Japanese Americans than among African Americans, Latinos, and Whites.
Asian American Populations
Among Asian American and Pacific Island members of the population in the contiguous United States, seafood consumption is an important aspect of cultural behavior. Self-harvesting and consuming seafood are seen as healthy activities that echo a culturally familiar lifestyle, but may also be
an economic necessity. Asian American and Pacific Island groups consume greater amounts, different types, and different parts of seafood than the general population (Sechena et al., 2003).
A large population of Laotian immigrants (Hmong) who settled in Wisconsin have been studied to determine how their fishing and seafood consumption habits differ from those of the general US population. Hutchison and Kraft (1994) found that individuals in Hmong households in Green Bay, Wisconsin, consumed an average of 30 fish meals per year compared to 18 fish meals per year consumed by Wisconsin anglers in the general population. About one-third of the fish caught were reported to come from lakes where fishing advisories warned against eating locally caught fish, suggesting that this group is at greater risk from exposure to contaminants in fish than the general population.
Some members of the Asian American population have undergone acculturation resulting in food choices that are more similar to those of the general US population than population groups from their country of origin (Kudo et al., 2000; Kim and Chan, 2004). Kudo et al. (2000) studied the eating patterns of Japanese immigrants and their US-born descendants. Their findings show dietary changes among succeeding generations of Japanese American females, and suggest that acculturation-related changes may contribute to decreased intake of many traditional foods, including fish.
American Indian/Alaskan Native and First Nations Populations
Many indigenous peoples, particularly those who live in Alaska and northern Canada, maintain a subsistence life-style and diet. The dietary practices of these populations are an important part of their self-definition, culture, health, and well-being, as well as a part of the socioeconomic structure of their communities.
A survey of coastal First Nations communities in British Columbia indicated that, although traditional dietary patterns have changed considerably since the introduction of Europeans to the Americas, seafood and other marine food sources remain an important part of the culture and nutritional resources of this population group (Mos et al., 2004). The survey showed that fishing and gathering of seafood was practiced regularly among 46 percent of respondents and that traditional methods were used 94 percent of the time. Among the types of seafood consumed by First Nations communities, salmon was the most popular; 95 percent of respondents reported consuming salmon each year and an average of 42 percent of all seafood meals consisted of salmon.
Availability of data on seafood consumption practices among Alaskan Natives and other Northern Dwellers is limited. Further, traditional foods that are consumed in Alaska vary by region, local preference, and
seasonal availability. The range of traditional foods available includes fish, marine mammals, shellfish, ascidians (sea squirts), sea cucumbers, and seaweed. Also included are nonmarine game meats, berries, and edible plants (Kuhnlein et al., 2000). Specific examples of wild-caught foods commonly consumed by Northern Dwellers include caribou meat, arctic char, Beluga (whale), muktuk, geese, whitefish, and trout (see Glossary for definitions) (Kuhnlein et al., 2000).
Muckle et al. (2001) reported that among Inuit women of childbearing age, about 80 percent consumed fish at least once per week and the average frequency of consumption of fish meals was 3.3 times per week. This population also consumed traditional products including beluga whale fat, muktuk, and seal fat, meat, and liver; their consumption of these foods increased during pregnancy.
Kuhnlein et al. (2004) report that since the introduction of nonnative foods to the Canadian Arctic at the turn of the 20th century, the use of native (traditional) foods has declined such that, among adults, only 10–36 percent of dietary energy is derived from traditional foods. Additionally, Receveur et al. (1997) found that traditional food consumption among Dene/Métis communities was associated with greater intake of iron, zinc, and potassium, and lower intake of sodium, fat, saturated fat, and sugar. Considered in conjunction with the cultural integration and importance of dietary traditions, advice to indigenous peoples to change their longstanding dietary patterns in order to reduce exposure to contaminants may not only not be beneficial, but could have deleterious health effects (Marien and Patrick, 2001).
Sport and Subsistence Fishers
The number of subsistence fishers in the United States and the amount of seafood they consume is difficult to estimate due to the challenge of identifying members of this population and a lack of data collected on them. By and large, individuals who engage in sport and subsistence fishing tend to consume more fish than the general population (Burger, 2002). Among anglers (those who crab and/or fish) in the Newark Bay Complex area of New Jersey, Blacks and Hispanics ate more fish than Whites or Asians (Burger, 2002). Similarly, Burger et al. (1999) noted that Blacks living along the Savannah River in South Carolina consumed both larger portions of seafood as well as higher total amounts compared to Whites. In that study, levels of intake were also related to education: those who did not graduate from high school ate seafood more often, consumed more total seafood, and consumed more intact fish than those with at least a high school degree.
While Alaskan Natives fish for sustenance (Ballew et al., 2004), others, e.g., the Newark Bay Complex group (Burger, 2002), angled primarily
for recreation, relaxation, and communing with nature, and more than 30 percent did not eat the crab or fish they caught. Thus, quantities obtained from fishing do not provide an accurate indicator of consumption.
FUTURE SEAFOOD SUPPLIES
Changes in Supply and Demand
The nation’s seafood supply is changing in ways that are likely to have a significant impact on consumer choice in the future. Changes in amounts, types, sources, and cost of seafood are predicted to continue in the next decades due largely to increasing demand. Over the past two decades the US population has grown by about 20 percent, and consumer demand for seafood fluctuated between about 14.5 and 16.5 pounds per person (see Figure 2-1). As mentioned previously, per capita seafood consumption was 16.6 pounds in 2004 (NMFS, 2005a), which represents almost 4.7 billion pounds of seafood.
The demand for seafood in the United States now exceeds domestic supplies, and fulfilling that demand requires more dependence on international sources. Seafood on the international market currently accounts for over 75 percent of the world marine fisheries’ catch, and a trend of increasing consumption is expected to continue (Watson and Pauly, 2001). The world production of edible fishery products, defined as both captured and farmed fish, reached a total of 103 million metric tons in 2003, which provided an estimated annual per capita supply of 16.3 kilograms or 35.9 pounds (live-weight equivalents) (FAO, 2004). Predictions about future world seafood supplies suggest that, at current rates of consumption, the world seafood supply will not keep pace with demand. The deficit is forecast to be 9.4 million metric tons by 2010, increasing to 10.9 million tons by 2015 (FAO, 2004). Although a recommendation to consume two 3-ounce servings of seafood per week may be beneficial to consumers (discussed in Chapter 3), if the entire population increased current consumption to meet this proposed consumption level, the supply of seafood would likely not be able to support the increased demand.
Impact of Aquaculture on Seafood Supplies
Aquaculture is one alternative that may contribute to closing the gap between diminishing seafood supplies and increasing demand. World production of seafood from farms or aquaculture operations is growing more rapidly than production of all other food-producing animals in the world (FAO, 2004). Between 1970 and 2002, the percentage of total seafood product weight provided by aquaculture production increased from 3.9 to almost
30 percent (FAO, 2004). This represents an increase of approximately one percent per year; however, that rate cannot keep pace with anticipated increases in seafood demand. Furthermore, the total aquaculture production figures can be deceiving in that the major portion of world aquaculture production involves freshwater species, e.g., carp (FAO, 2004). This fish is not a common consumer selection in most developed nations, particularly the United States.
The top ten seafood types consumed in the United States (shown in Table 2-1) are marine (or saltwater) species, although not all are wild-caught. Current seafood consumption patterns are beginning to lead to reductions in supply for some species that will influence future availability and price. For example, flatfish (e.g., flounder, sole, and halibut), among the top ten types of seafood consumed in 1990, are less prevalent today.
Aquacultured seafood (e.g., salmon, catfish, and shrimp) is now supplementing the supply for some of these seafood choices of long-standing popularity. The recent increase in per capita consumption of shrimp over tuna was in part due to the increasing supply and lower price resulting from aquaculture. Aquaculture has also contributed to the 100-fold increase in salmon consumption and introduced a new selection, tilapia, to the top ten per capita seafood consumed in 2004.
An emerging concern about aquaculture is that it is largely used for production of carnivorous species such as salmon, and the feed used is based on fish meal. The source of fish meal is considered an industrial product (wild-caught fish that is not used for human consumption) obtained from capture fisheries (FAO, 2002). Pound for pound, however, the amount of wild-caught fish needed to produce fish meal exceeds by more than two times the amount of fish produced by aquaculture for human consumption (Naylor et al., 2000).
Future Trends
Future trends in availability for the most popular seafood consumed in the United States can be estimated from comparisons of annual production over the past 10 years (Table 2-6). These estimates are based on total reported catch from 1995 through predictions for 2005.
While the NMFS and the eight regional Fishery Management Councils report that 2004 assessments of domestic stocks indicated that fishery management strategies have resulted in increases in some stocks to a sustainable yield, most of the top ten seafood choices were not among them (NMFS, 2005b). Limited availability of these popular seafood types may translate into more resource competition and higher prices.
The additional competition of recreational fishing has a further impact on seafood supplies. Coleman et al. (2004) concluded that the less-regulated
TABLE 2-6 General Trends and Predictions for the Supply and Sources of Popular Fish Consumed in the United States from 1995 through 2005
|
Seafood Type |
Supply Trend |
Domestic Supply |
Imported Supply |
||
|
Catch |
Farmed |
Catch |
Farmed |
||
|
Salmon |
Increasinge |
Limited |
Limited |
Increasing |
Increasing |
|
Tilapia |
Increasing |
Limited |
Increasing |
Limited |
Increasing |
|
Catfisha |
Increasing |
Limited |
Limited |
Increasing |
Increasing |
|
Cod |
Limitedf |
Limited |
N/A |
Limited |
Increasing |
|
Flatfish/Solesb |
Limited |
Limited |
N/A |
Limited |
Increasing |
|
Tunac |
Limited |
Limited |
N/A |
Limited |
N/A |
|
Haddock |
Limited |
Limited |
N/A |
N/A |
N/A |
|
Halibut |
Limited |
Limited |
N/A |
N/A |
N/A |
|
O. perch |
Limited |
Limited |
N/A |
Limited |
N/A |
|
Pollock |
Limited |
Limited |
N/A |
Limited |
N/A |
|
O. roughy |
Decliningf |
N/Ag |
N/A |
Limited |
N/A |
|
Rockfishes |
Declining |
Declining |
N/A |
N/A |
N/A |
|
K. mackereld |
Limited |
Limited |
N/A |
N/A |
N/A |
|
Swordfishd |
Limited |
Limited |
N/A |
Limited |
N/A |
|
Tilefishd |
Declining |
Declining |
N/A |
N/A |
N/A |
|
Sharksd |
Limited |
Limited |
N/A |
Declining |
N/A |
|
NOTE: The listings include some of, but are not limited to, the most popular fish relative to consumption totals based on annual fishery reports and other sources. aCatfish can include domestic cultured varieties as well as imported varieties. bFlatfish can include flounders and sole. cTuna includes all major commercial species; tuna is also “farmed” in some countries through the capture of smaller fish, which are fed in pens. dThe four fish targeted by the FDA/US EPA advisory on methylmercury (FDA/US EPA, 2004). eIncreasing = More annual supply can be available than is currently produced either from underfished resources and/or aquaculture (existing or emerging). fSupply is described as either limited or declining due to overfishing (the domestic resources are near or exceed steady state annual yield as estimated by NMFS [2005]). gN/A = The resource is not available in the respective situation or data is not available per the listing. SOURCES: FAO, 2004; NMFS, 2005a,b; SAFMC, 2005; Personal communication, W. Swingle, Gulf of Mexico Fishery Management Council, January 2006; Personal communication, G. Waugh, Deputy Executive Director, South Atlantic Fishery Management Council, January 10, 2006. |
|||||
recreational fishery is exerting a large impact on certain popular seafood selections. They reported that in 2002, the recreational catch of fish “populations of concern” (i.e., popular types that were at risk for overfishing) accounted for 64, 38, 59, and 12 percent of the catch in the Gulf of Mexico, South Atlantic, Pacific, and Northeastern coastal waters, respectively. Some of these recreationally caught and consumed types, e.g., king mackerel,
have been identified in advisories as fish that pregnant women should not consume. In the Gulf of Mexico, the regional fishery management plans allocate 68 percent of the king mackerel harvest to recreational fishermen (GMFMC, 2006).
Table 2-6 shows that several popular species are overfished and supplies are declining. Among capture fisheries worldwide, 28 percent of fish stocks have been estimated to be depleted or overexploited (FAO, 2002). In the United States, over 18 percent of the 236 fish stocks or stock complexes with known overfishing status have a mortality rate that exceeds the overfishing threshold (i.e., subject to overfishing) (NMFS, 2005b). Supply predictions for shark (Baum et al., 2003), tilefish, king mackerel, and swordfish (identified in the joint FDA/US EPA methylmercury advisory) suggest that they will likely decrease. In addition, changes in the supply of other wild-caught seafood will also influence seafood selections for all segments of the population in the future.
NUTRIENT PROFILES OF SEAFOOD COMPARED TO OTHER FOODS IN THE DIET
Foods with similar nutrient profiles are often grouped together for the purpose of making dietary recommendations. Seafood is grouped with meats, poultry, eggs, nuts, legumes, and seeds as major contributors (supplying >50 percent) of protein, niacin, zinc, and vitamin B6 to the diet. These foods are also substantial contributors (supplying >10 percent) of vitamins E and B12, thiamin, riboflavin, phosphorus, magnesium, iron, copper, potassium, and linoleic acid. Among these foods, however, higher levels of selenium and the omega-3 fatty acids EPA and DHA and generally lower levels of saturated fats are unique to seafood. Although EPA and DHA are found in other protein-rich foods (i.e., poultry and eggs), fish that are high in EPA/DHA (e.g., salmon, lake trout, and white [albacore] tuna) have the highest concentration per serving among food sources. Table 2-7 provides a comparison of the availability of some macro- and micronutrients, including the omega-3 fatty acids EPA (20:5 n-3) and DHA (22:6 n-3) in three types of seafood, as well as chicken, beef, and eggs, and the alpha-linolenic acid (ALA; 18:3 n-3) in walnuts.
EPA and DHA
An important reason for choosing seafood over other protein food sources is that it is a primary source of the omega-3 fatty acids EPA and DHA. The benefits of these two fatty acids are described in detail in Chapter 3. The following discussion provides information about sources and consumption patterns of EPA/DHA.
TABLE 2-7 Nutrients in Selected Seafoods and Other Comparable Foods
|
Food |
Content per 100 g |
||
|
Energy (kcal) |
Protein (g) |
Total Fat (g) |
|
|
FISH |
|
|
|
|
Tuna, canned, light, packed in water |
116 |
25.51 |
0.82 |
|
Tuna, canned, white, packed in water |
128 |
23.62 |
2.97 |
|
Shrimp, mixed species, cooked, moist heat |
99 |
20.91 |
1.08 |
|
Salmon, Atlantic, farmed, cooked, dry heat |
206 |
22.10 |
12.35 |
|
Pollock, Atlantic, cooked, dry heat |
118 |
24.92 |
1.26 |
|
Catfish, channel, farmed, cooked, dry heat |
152 |
18.72 |
8.02 |
|
Cod, Atlantic, cooked, dry heat |
105 |
22.83 |
0.86 |
|
Crab, blue, cooked, moist heat |
102 |
20.20 |
1.77 |
|
Halibut, Atlantic and Pacific, cooked, dry heat |
140 |
26.69 |
2.94 |
|
BEEF |
|
|
|
|
Ground beef, 80% lean, patty, cooked, broiled |
271 |
25.75 |
17.82 |
|
Eye of round roast, all grades, trimmed to 1/8” fat, cooked |
208 |
28.31 |
9.65 |
|
Top sirloin, all grades, trimmed to 1/8” fat, cooked, broiled |
243 |
26.96 |
14.23 |
|
PORK |
|
|
|
|
Cured ham, boneless, regular, roasted |
178 |
22.62 |
9.02 |
|
Pork loin, center rib, boneless, cooked, roasted |
252 |
26.99 |
15.15 |
|
Ground fresh pork, cooked |
297 |
25.69 |
20.77 |
|
POULTRY |
|
|
|
|
Chicken breast, meat and skin, cooked, roastedb |
197 |
29.80 |
7.78 |
|
Chicken breast, meat only, cooked, roastedb |
165 |
31.02 |
3.57 |
|
Turkey, meat and skin, cooked, roasted |
208 |
28.10 |
9.73 |
|
Turkey, ground, cooked |
235 |
27.36 |
13.15 |
|
SAUSAGES AND LUNCHEON MEATS |
|
|
|
|
Frankfurter, meat |
290 |
10.26 |
25.76 |
|
Frankfurter, beef |
330 |
11.24 |
29.57 |
|
Turkey roll, light meat |
147 |
18.70 |
7.22 |
|
Bologna, beef and pork |
308 |
15.20 |
24.59 |
|
OTHER |
|
|
|
|
Egg, poachedb |
147 |
12.53 |
9.90 |
|
Egg, omegac |
125 |
10.00 |
10.00 |
|
Walnuts, English |
654 |
15.23 |
65.21 |
|
Seeds, flaxseed |
534 |
18.29 |
42.16 |
|
aTotal 18:3 fatty acid. bEPA/DHA levels in chicken and egg are based on existing published data; changes in the use of fishmeal in feed sources may impact levels detected in the future. cDerived from Sindelar et al., 2004. —No data available. SOURCE: USDA National Nutrient Database for Standard Reference, Release 18 (unless otherwise specified). |
|||
|
SFA (g) |
EPA (g) |
DHA (g) |
ALA (g) |
Ca (mg) |
Fe (mg) |
Zn (mg) |
Se (µg) |
B-6 (mg) |
|
0.234 |
0.047 |
0.223 |
0.002a |
11 |
1.53 |
0.77 |
80.4 |
0.350 |
|
0.792 |
0.233 |
0.629 |
0.071a |
14 |
0.97 |
0.48 |
65.7 |
0.217 |
|
0.289 |
0.171 |
0.144 |
0.012a |
39 |
3.09 |
1.56 |
39.6 |
0.127 |
|
2.504 |
0.690 |
1.457 |
0.113a |
15 |
0.34 |
0.43 |
41.4 |
0.647 |
|
0.170 |
0.091 |
0.451 |
77 |
0.59 |
0.60 |
46.8 |
0.331 |
|
|
1.789 |
0.049 |
0.128 |
0.082a |
9 |
0.82 |
1.05 |
14.5 |
0.163 |
|
0.168 |
0.004 |
0.154 |
0.001a |
14 |
0.49 |
0.58 |
37.6 |
0.283 |
|
0.228 |
0.243 |
0.231 |
0.021a |
104 |
0.91 |
4.22 |
40.2 |
0.180 |
|
0.417 |
0.091 |
0.374 |
0.083a |
60 |
1.07 |
0.53 |
46.8 |
0.397 |
|
6.766 |
0.050 |
24 |
2.48 |
6.25 |
21.5 |
0.367 |
||
|
3.664 |
0.093a |
7 |
2.29 |
4.70 |
28.7 |
0.372 |
||
|
5.603 |
0.127a |
20 |
1.73 |
4.87 |
29.2 |
0.564 |
||
|
3.120 |
0.240a |
8 |
1.34 |
2.47 |
19.8 |
0.310 |
||
|
5.350 |
0.030a |
6 |
0.93 |
2.64 |
40.3 |
0.363 |
||
|
7.720 |
0.070a |
22 |
1.29 |
3.21 |
35.4 |
0.391 |
||
|
2.190 |
0.010 |
0.030 |
0.060a |
14 |
1.07 |
1.02 |
24.7 |
0.560 |
|
1.010 |
0.010 |
0.020 |
0.030a |
15 |
1.04 |
1.00 |
27.6 |
0.600 |
|
2.840 |
0.040 |
0.110a |
26 |
1.79 |
2.96 |
32.9 |
0.410 |
|
|
3.390 |
0.030 |
0.150a |
25 |
1.93 |
2.86 |
37.2 |
0.390 |
|
|
7.667 |
0.146a |
99 |
1.09 |
1.20 |
12.5 |
0.166 |
||
|
11.688 |
0.176a |
14 |
1.51 |
2.46 |
8.2 |
0.089 |
||
|
2.020 |
0.020 |
0.090a |
40 |
1.28 |
1.56 |
22.3 |
0.320 |
|
|
9.301 |
0.055a |
85 |
1.21 |
2.30 |
24.6 |
0.297 |
||
|
3.087 |
0.004 |
0.037 |
0.033a |
53 |
1.83 |
1.10 |
31.6 |
0.142 |
|
2.500 |
0.170 |
0.420 |
||||||
|
6.126 |
9.080a |
98 |
2.91 |
3.09 |
4.9 |
0.537 |
||
|
3.663 |
22.813a |
255 |
5.73 |
4.34 |
25.4 |
0.473 |
Sources of EPA and DHA
Seafood is the primary source for EPA and DHA in human diets. Estimated amounts of EPA and DHA in the top seafood types consumed are shown in Table 2-8. The figures suggest that, other than salmon, the most frequently consumed types of fish are not particularly rich sources of these fatty acids.
The fatty acid concentration of farmed fish reflects the composition of the diets they are fed (Bell et al., 2003). Fish, like mammals, have a limited ability to deposit EPA and DHA in their tissues even when they are fed diets high in ALA (Tocher et al., 2003). Thus, farmed salmon need to be fed a source of EPA and DHA (e.g., fish oil) to have a fatty acid profile similar to that of wild salmon. Feeding diets that are high in fish oil for a period prior to harvest elevates levels of EPA and DHA in farmed salmon previously fed vegetable oils during part of their growing period (Bell et al., 2003).
TABLE 2-8 Mean Levels of EPA and DHA in the Top 10 Seafood Types Consumed in the United States
|
Seafood (type)a |
# Data Points |
Standard Error |
EPA Content (g/100 g) |
DHA Content (g/100 g) |
Total n-3 Content (g/100 g) |
|
Shrimp |
11 |
N/Ab |
0.17 |
0.14 |
0.31 |
|
Light tuna |
5 |
N/A |
0.05 |
0.22 |
0.27 |
|
Salmon |
2 |
N/A |
0.69 |
1.46 |
2.15 |
|
Pollock |
0c |
N/A |
0.09 |
0.45 |
0.54 |
|
Catfish |
3 |
N/A |
0.05 |
0.13 |
0.18 |
|
Tilapia |
2 |
N/A |
0.00 |
0.11 |
0.11 |
|
Crab |
12 (EPA) 10 (DHA) |
0.021 (EPA) 0.008 (DHA) |
0.30 |
0.12 |
0.42 |
|
Cod |
0c |
N/A |
0.00 |
0.15 |
0.15 |
|
Clams |
0c |
N/A |
0.14 |
0.15 |
0.29 |
|
Flatfish |
11 |
32.5 (EPA) 22.3 (DHA) |
0.24 |
0.26 |
0.50 |
|
aShrimp = Mixed, cooked, moist heat; Light tuna = light, canned in water, drained; Salmon = Atlantic, farmed, cooked; Pollock = Atlantic, cooked, dry heat; Catfish = Channel, farmed, cooked, dry heat; Tilapia = Cooked, dry heat; Crab = Alaska king, cooked, moist heat; Cod = Atlantic, cooked, dry heat; Clams = Mixed, cooked, moist heat; Flatfish = Flounder and sole species, cooked, dry heat. bN/A means that the values are not available. cAs reported in USDA Nutrient Database Release 18 (http://www.nal.usda.gov/fnic/foodcomp/Data/SR18/sr18.html). Zeroes indicate that value was not derived analytically but was either calculated by difference or imputed from the value for some other similar food(s). SOURCES: National Fisheries Institute (http://www.aboutseafood.com/media/top_10.cfm) and USDA Nutrient Database Release 18 (http://www.nal.usda.gov/fnic/foodcomp/Data/SR18/sr18.html). |
|||||
As discussed in Chapter 1, the Dietary Guidelines Advisory Committee Report (DGAC, 2005) recommends that adults consume two portions (each 4 ounces raw/3 ounces cooked) of seafood per week. Following this recommendation would provide the consumer with a range of intake levels from 60 mg to 700 mg of EPA and DHA combined per day, depending on the type of seafood consumed.
Table 2-9 shows mean dietary intake levels of EPA, DHA, and EPA and DHA combined, for several sex/age groups from the 1999–2002 NHANES. Mean intake levels for the total population are estimated to be 35 mg of EPA and 68 mg of DHA per day. Although adults had greater intakes than children, and men greater intakes than women, none of the sex/age groups shown had average intakes of even 200 mg per day of EPA and DHA combined.
Consumption of High Compared to Low EPA/DHA Content Seafood
An analysis of NHANES data classified all seafood types as either high (> 500 milligrams per 3-ounce serving) or low (< 500 milligrams per 3-ounce serving) in EPA and DHA combined (DGAC, 2005). High EPA/ DHA seafood includes anchovy, mackerel, pompano, salmon, sardines, sea bass, swordfish, and trout. Low EPA/DHA types include carp, catfish, clams, conches, cod, crabs, croaker, flounder, frogs, haddock, halibut, lobster, mullet, octopuses/squid, oysters, perch, pike, pollock, porgy, scallops, shrimp, snapper, and whiting.
In the NHANES survey, tuna was considered separately, because although there are both high- and low-EPA/DHA varieties of tuna, respondents usually cannot distinguish between them. Therefore, 75 percent of the tuna consumed was assigned to the low EPA/DHA group and the remainder to the high EPA/DHA group in accordance with USDA figures (DGAC, 2005). Figure 2-3 shows that the greatest percentage of seafood consumed is low in EPA/DHA, and that salmon, white tuna, sea bass, and trout are the most commonly consumed types of seafood high in EPA/DHA.
Another way to consider sources of EPA/DHA is to examine which foods contribute the most to the population’s intake, a method that takes into account not only each food’s fatty acid content but also in what quantities it is consumed. Tables 2-10 and 2-11 show the foods contributing the most to EPA and DHA intakes, respectively, according to data from the NHANES 1999–2002. Not surprisingly, various seafood types are among the major contributors of both fatty acids. What might not be expected, however, is that chicken and eggs contributed measurable amounts to EPA intake over this time period. Soups, while only contributing 1.8 percent of the EPA, are a curious addition to the table. These include not only fish chowders, but soups made from chickens that have been fed fishmeal. Whether chicken
TABLE 2-9 Dietary Intake of Linolenic Fatty Acid, Eicosapentaenoic Fatty Acid (EPA), Docosahexaenoic Fatty Acid (DHA), and EPA and DHA Combined
|
Statistic |
All Individuals Aged 2 and Over |
Age (years) and Sex |
|||
|
2–5 |
6–11 |
12–19 |
|||
|
Males and Females |
Males and Females |
Males |
Females |
||
|
Number in sample |
17,107 |
1521 |
2098 |
2244 |
2261 |
|
|
g |
|
|
|
|
|
Linolenic fatty acid |
|
|
|
|
|
|
Mean |
1.41 |
0.90 |
1.16 |
1.49 |
1.23 |
|
SEM |
0.01 |
0.02 |
0.03 |
0.04 |
0.03 |
|
|
mg |
|
|
|
|
|
Eicosapentaenoic fatty acid (EPA) |
|
|
|
|
|
|
Mean |
35.26 |
11.94 |
14.16 |
16.91 |
16.78 |
|
SEM |
1.99 |
2.10 |
1.74 |
1.91 |
1.68 |
|
Docosahexaenoic fatty acid (DHA) |
|
|
|
|
|
|
Mean |
67.98 |
27.99 |
37.72 |
43.75 |
39.89 |
|
SEM |
2.66 |
3.18 |
4.09 |
3.12 |
3.23 |
|
EPA and DHA combined |
|
|
|
|
|
|
Mean |
103.25 |
39.93 |
51.87 |
60.67 |
56.66 |
|
SEM |
4.53 |
5.21 |
5.59 |
4.64 |
4.68 |
|
SOURCE: CDC/NCHS, 1999–2002. |
|||||
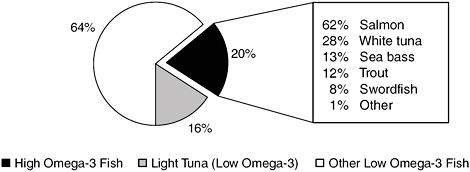
FIGURE 2-3 Consumption estimates, as a percentage of total seafood consumed, by EPA/DHA content classification. High-EPA/DHA seafood is further delineated by type; white (albacore) tuna is high in EPA/DHA but light (e.g., skipjack) tuna is not.
SOURCE: DGAC, 2005.
|
20–39 |
40–59 |
60 and older |
Pregnant/ Lactating Women |
Females, Aged 15 to 45 Years |
|||
|
Males |
Females |
Males |
Females |
Males |
Females |
||
|
1372 |
1844 |
1345 |
1361 |
1512 |
1549 |
709 |
3658 |
|
1.74 |
1.33 |
1.75 |
1.33 |
1.45 |
1.18 |
1.47 |
1.32 |
|
0.04 |
0.04 |
0.04 |
0.04 |
0.03 |
0.02 |
0.06 |
0.03 |
|
42.83 |
32.66 |
56.42 |
42.99 |
43.17 |
36.43 |
40.13 |
34.09 |
|
4.23 |
2.73 |
5.14 |
7.56 |
4.60 |
3.19 |
8.80 |
4.69 |
|
82.43 |
63.01 |
108.92 |
72.55 |
78.14 |
64.88 |
73.19 |
62.11 |
|
6.22 |
5.15 |
7.83 |
7.82 |
5.89 |
4.01 |
10.54 |
4.93 |
|
125.26 |
95.67 |
165.33 |
115.54 |
121.31 |
101.31 |
113.32 |
96.19 |
|
10.19 |
7.66 |
12.59 |
14.96 |
10.27 |
7.11 |
18.72 |
9.33 |
and egg products will continue to contribute significant amounts of DHA is uncertain because of changes in feed composition aimed at reducing amount of fishmeal used in animal feeds (Barlow, 2001).
As with farmed fish, feeding practices used in the poultry and egg industries may affect the content of EPA/DHA in these foods. Poultry feeds are predominantly vegetable- and grain-based, supplemented with animal and grain by-products (IOM, 2003), with cost driving the feed formulation. Fat sources used in poultry feed formulations can include animal fat, vegetable fat or oil, or feed-grade fat products (Hulan et al., 1989; Ratnayake and Ackman, 1989; Cantor, 1999; Gonzalez-Esquerra and Leeson, 2000). The feed ingredients most frequently used to increase the long-chain polyunsaturated fatty acid (LCPUFA) content of poultry meat include fish oil, flaxseed oil, and rapeseed (canola) oil (Komprda et al., 2005). The amount of fish meal used in a formulation has typically been about 1 percent of the total ingredients (IOM, 2003). Recent changes in fat sources used in poultry feed resulting in a lower fish meal content (Barlow, 2001) suggest a probable
TABLE 2-10 Food Sources of EPA Among the US Population, Aged 2 Years and Older, 1999–2002
|
Food Groupa |
Percent of EPA |
Cumulative Percent of EPA |
|
Salmon |
19.8 |
19.8 |
|
Shrimp |
18.8 |
38.6 |
|
Chickenb |
8.9 |
47.5 |
|
Crab |
5.6 |
53.1 |
|
Trout |
3.6 |
56.7 |
|
Tuna |
3.2 |
59.9 |
|
Sardines |
2.1 |
62.0 |
|
Catfish |
2.0 |
64.0 |
|
Soups |
1.8 |
65.8 |
|
Cod |
1.6 |
67.4 |
|
Eggs |
1.5 |
68.9 |
|
Fish, mixed types |
1.5 |
70.4 |
|
Flounder |
1.2 |
71.6 |
|
Other fishc |
20.9 |
92.5 |
|
NOTE: Species not shown contributed <1 percent each. aIncludes mixed dishes composed mainly of this item. bNew data forthcoming show most nutrient levels comparable to earlier sample, but EPA/DHA levels as undetectable. cIncludes types not specified by respondent and types other than those listed elsewhere in table. SOURCE: CDC/NCHS, 1999–2002. |
||
decrease in detectable EPA/DHA levels in poultry and egg products. New forthcoming data on chicken and eggs show levels of most nutrients are comparable to earlier samples, but EPA/DHA levels as undetectable.
When egg-producing hens are fed diets enriched with EPA and DHA, their egg lipid content reflects their diet composition (Scheideler and Froning, 1996; Van Elswyk, 1997; Cantor, 1999; Bean and Leeson, 2003). Scheideler and Froening (1996) showed that the DHA content of eggs could be increased by about 3.5 times over that of unmodified eggs by feeding hens diets containing 5 percent whole flaxseed (2.8 times for a diet containing 5 percent ground flaxseed) compared to unmodified diets for control hens, indicating that some conversion of ALA to DHA occurs in the hen. The ALA content of the eggs increased nearly eightfold under the same conditions. Similarly, hens fed a diet with 2.5 percent dried algae meal high in DHA produced eggs with about 150 mg DHA per egg (Herber and Van Elswyk, 1996), similar to the level produced by feeding 1.5 percent fish oil.
Non-Animal Sources of Omega-3 Fatty Acids It is important for consumers to understand that there are different sources of omega-3 fatty acids. EPA and DHA are not endogenously synthesized from saturated, monounsatu-
TABLE 2-11 Food Sources of DHA Among the US Population, Aged 2 and Older, 1999–2002.
|
Food Groupa |
Percent of DHA |
Cumulative Percent of DHA |
|
Chickenb |
15.6 |
15.6 |
|
Salmon |
14.3 |
30.0 |
|
Eggs |
9.4 |
39.4 |
|
Shrimp |
8.6 |
48.0 |
|
Tuna |
7.6 |
55.6 |
|
Trout |
4.9 |
60.5 |
|
Catfish |
3.1 |
63.6 |
|
Crab |
2.9 |
66.5 |
|
Cod |
1.6 |
68.1 |
|
Poultry, cold cuts/ground |
1.3 |
69.4 |
|
Sardines |
1.3 |
70.7 |
|
Fish, mixed typesc |
1.1 |
71.8 |
|
Turkey |
1.0 |
72.8 |
|
Other fish |
16.9 |
89.7 |
|
NOTE: Species not shown contributed < 1 percent each. aIncludes mixed dishes composed mainly of this item. bNew data forthcoming show most nutrient levels comparable to earlier sample, but EPA/DHA levels as undetectable. cIncludes types not specified by respondent and types other than those listed elsewhere in table. SOURCE: CDC/NCHS, 1999–2002. |
||
rated, or omega-6 fatty acids; they can only be made from the precursor omega-3 fatty acid ALA. Some current recommendations include the use of plant sources, such as walnuts and flaxseed oil, to obtain sufficient amounts of EPA and DHA in the diet (ADA, 2003). This suggestion is based on the observation that some vegetable oils contain significant amounts of ALA, and thus could be used as an alternative to direct consumption of EPA and DHA (refer to Supplemental Information, Appendix A for detailed information). However, as mentioned previously, humans do not convert EPA or DHA from ALA at rates high enough to reach recommended intake levels (Pawlosky et al., 2001). Furthermore, based on in vivo isotope studies, the rates of conversion differ between young men and women (Burdge et al., 2002; Burdge and Wootton, 2002), and between nonpregnant, pregnant, lactating and nonpregnant, and nonmenopausal women (Burdge and Wootton, 2002). Additionally, the extent to which ALA is utilized for energy rather than converted into EPA and DHA is likely driven by both the physiologic requirements for these fatty acids and by the quantity available in the diet (Burdge et al., 2002). For example, if the physiologic requirement for EPA is high, e.g., during pregnancy and lactation, and other energy needs are being met, there is likely to be more efficient utilization of ALA as a
precursor source for EPA in women. On the other hand, an adult male who is not at risk for heart disease and whose energy needs are greater than his intake of calories from other sources would preferentially utilize ALA as an energy source rather than as a source of omega-3 fatty acids.
Production of long-chain polyunsaturated fatty acids from microorganisms, including lower fungi, bacteria, and marine microalgae, appears to be a promising source of omega-3 fatty acids, especially DHA (Cohen et al., 1995). The organisms Schizochytrium sp. and Crypthecodinium cohnii are currently used in commercial production of DHA. Sijtsma and de Swaaf (2004) have estimated that 50 large bioreactors could produce up to 10 percent of the quantity of DHA currently obtained from global production of fish oil.
The production of EPA and DHA in mustard seed has recently been achieved by application of genetic engineering techniques by Wu et al. (2005). The oil in the engineered mustard seeds contained 15 percent EPA and 1.5 percent DHA. The investigators were optimistic that a higher content of DHA could be achieved in further work. Therefore, although fish are presently the principal source of EPA and DHA available for human diets, there are several alternative sources available and more in development.
Dietary Supplements as Sources of EPA and DHA
The use of fish-oil supplements has increased over the past three decades, presumably as a result of publicity regarding the many studies showing a relationship between fish-oil supplementation and reduced risk for heart disease (e.g., Blonk et al., 1990; Reis et al., 1990; Bairati et al., 1992; Bucher et al., 2002; Marchioli et al., 2002; Vanschoonbeek et al., 2003). In 1998, Nutrition Business International (1998) forecast a market growth of 14–16 percent annually for fish-oil supplements compared to the industry’s supplement average of 13 percent.
Fish oils used as food ingredients and dietary supplements are derived from a variety of different fish and are processed in different ways; consequently, their fatty acid profiles differ, especially in their content of the principal omega-3 fatty acids, EPA and DHA. The EPA and DHA content of some typical fish-oil supplements is shown in Table 2-12. The first five entries in this table are fish oils that have been determined to be generally recognized as safe (GRAS) for addition to foods and for which notices were submitted to the Food and Drug Administration (FDA).1 Some fish oils are specially processed to increase the concentration of EPA and DHA, but unmodified fish oils contain from about 10 to 30 percent of these fatty acids, respectively.
TABLE 2-12 EPA and DHA Content of Fish-Oil Supplements
|
Fish Oil |
Manufacturer |
EPA Content (g/100 g) |
DHA Content (g/100 g) |
Data Sourcea |
|
Small Planktivorous Pelagic Fish Body Oil (SPPFBO) |
Jedwards |
18.0 |
12.0 |
GRAS Notice #102, 2002 |
|
Fish Oil Concentrate |
Unilever |
20.0 |
18.0 |
GRAS Notice #105, 2002 |
|
Tuna Oil |
Clover |
6.0 |
26.5 |
GRAS Notice #109, 2002 |
|
18/12 Triglycerides |
Ocean Nutrition Canada (ONC) |
18.5 |
11.8 |
GRAS Notice #138, 2003 |
|
Salmon Oil |
Jedwards |
8.0 |
12.0 |
GRAS Notice #146, 2004 |
|
Menhaden Oil |
Unspecified |
13.1 |
6.7 |
FDA, 1997 (Federal Register 62, No. 108, Rules and Regulations) |
|
Herring Oil |
Unspecified |
6.3 |
4.2 |
USDA Nutrient Database for Standard Reference, Release 18 |
|
Salmon Oil |
Unspecified |
13.0 |
18.2 |
USDA Nutrient Database for Standard Reference, Release 18 |
|
Sardine Oil |
Unspecified |
10.1 |
10.7 |
USDA Nutrient Database for Standard Reference, Release 18 |
|
aInformation on sample number and variability not available. |
||||
A variety of fatty acids other than EPA and DHA are also found in fish oils. While these oils are generally lower in saturated fatty acids than other animal-derived fats and oils, they do contain about 20–25 percent saturated fatty acids by weight, as well as from about 20 to about 55 percent monounsaturated fatty acids (Table 2-12).
CONTAMINANTS OF CONCERN IN SEAFOOD
Methylmercury
Methylmercury is an environmental contaminant found in nearly all seafood. It is a potent neurotoxin (ATSDR, 1999; NRC, 2000; Satoh, 2003). Its origin and metabolism are discussed in a recent NRC report (NRC, 2000). Table 2-13 presents the average mercury concentrations in
TABLE 2-13 Methylmercury Concentrations in Seafood
|
Seafood Type |
Mercury Concentration (ppm)a |
n |
Sourceb |
Marketc (%) |
|||
|
Mean |
Median |
Min |
Max |
||||
|
Anchovies |
0.04 |
NA |
ND |
0.34 |
40 |
NMFS 1978 |
0.5 |
|
Bass (saltwater)d |
0.27 |
0.15 |
0.06 |
0.96 |
35 |
FDA 1990–03 |
0.6 |
|
Bluefish |
0.31 |
0.30 |
0.14 |
0.63 |
22 |
FDA 2002–03 |
0.1 |
|
Buffalo fish |
0.19 |
0.14 |
0.05 |
0.43 |
4 |
FDA 1990–02 |
0.0 |
|
Butterfish |
0.06 |
NA |
ND |
0.36 |
89 |
NMFS 1978 |
0.1 |
|
Carp |
0.14 |
0.14 |
0.01 |
0.27 |
2 |
FDA 1990–02 |
0.0 |
|
Catfish |
0.05 |
ND |
ND |
0.31 |
22 |
FDA 1990–02 |
4.8 |
|
Clams |
ND |
ND |
ND |
ND |
6 |
FDA 1990–02 |
1.7 |
|
Cod |
0.11 |
0.10 |
ND |
0.42 |
20 |
FDA 1990–03 |
4.7 |
|
Crabe |
0.06 |
ND |
ND |
0.61 |
59 |
FDA 1990–02 |
4.7 |
|
Crawfish |
0.03 |
0.03 |
ND |
0.05 |
21 |
FDA 2002–03 |
0.6 |
|
Croaker (Atlantic) |
0.05 |
0.05 |
0.01 |
0.10 |
21 |
FDA 1990–03 |
0.3 |
|
Croaker white (Pacific) |
0.29 |
0.28 |
0.18 |
0.41 |
15 |
FDA 1990–03 |
0.0 |
|
Flatfishf |
0.05 |
0.04 |
ND |
0.18 |
22 |
FDA 1990–02 |
3.6 |
|
Grouper |
0.55 |
0.44 |
0.07 |
1.21 |
22 |
FDA 2002–03 |
0.2 |
|
Haddock |
0.03 |
0.04 |
ND |
0.04 |
4 |
FDA 1990–02 |
0.6 |
|
Hake |
0.01 |
ND |
ND |
0.05 |
9 |
FDA 1990–02 |
0.3 |
|
Halibut |
0.26 |
0.20 |
ND |
1.52 |
32 |
FDA 1990–02 |
0.9 |
|
Herring |
0.04 |
NA |
ND |
0.14 |
38 |
NMFS 1978 |
2.5 |
|
Jacksmelt |
0.11 |
0.06 |
0.04 |
0.50 |
16 |
FDA 1990–02 |
0.0 |
|
Lobster (Northern/American) |
0.31 |
NA |
0.05 |
1.31 |
88 |
NMFS 1978 |
1.3 |
|
Lobster (spiny) |
0.09 |
0.14 |
ND |
0.27 |
9 |
FDA 1990–02 |
0.8 |
|
Mackerel, Atlantic (N. Atlantic) |
0.05 |
NA |
0.02 |
0.16 |
80 |
NMFS 1978 |
0.3 |
|
Mackerel, chub (Pacific) |
0.09 |
NA |
0.03 |
0.19 |
30 |
NMFS 1978 |
0.2 |
|
Mackerel, king |
0.73 |
NA |
0.23 |
1.67 |
213 |
Gulf 2000 |
0.1 |
|
Mackerel, Spanish (Gulf of Mexico) |
0.45 |
NA |
0.07 |
1.56 |
66 |
NMFS 1978 |
0.0 |
|
Mackerel, Spanish (S. Atlantic) |
0.18 |
NA |
0.05 |
0.73 |
43 |
NMFS 1978 |
0.0 |
|
Marlin |
0.49 |
0.39 |
0.10 |
0.92 |
16 |
FDA 1990–02 |
0.0 |
|
Monkfish |
0.18 |
NA |
0.02 |
1.02 |
81 |
NMFS 1978 |
0.4 |
|
Mullet |
0.05 |
NA |
ND |
0.13 |
191 |
NMFS 1978 |
0.2 |
|
Orange roughy |
0.54 |
0.56 |
0.30 |
0.80 |
26 |
FDA 1990–03 |
0.2 |
|
Oysters |
ND |
ND |
ND |
0.25 |
34 |
FDA 1990–02 |
0.8 |
|
Perch (freshwater) |
0.14 |
0.15 |
ND |
0.31 |
5 |
FDA 1990–02 |
0.0 |
|
Perch ocean |
ND |
ND |
ND |
0.03 |
6 |
FDA 1990–02 |
0.5 |
|
Pickerel |
ND |
ND |
ND |
0.06 |
4 |
FDA 1990–02 |
0.1 |
|
Pollock |
0.06 |
ND |
ND |
0.78 |
37 |
FDA 1990–02 |
11.1 |
|
Sablefish |
0.22 |
NA |
ND |
0.7 |
102 |
NMFS 1978 |
0.3 |
|
Salmon (canned) |
ND |
ND |
ND |
ND |
23 |
FDA 1990–02 |
0.9 |
|
Salmon (fresh/frozen) |
0.01 |
ND |
ND |
0.19 |
34 |
FDA 1990–02 |
7.9 |
|
Sardine |
0.02 |
0.01 |
ND |
0.04 |
22 |
FDA 2002–03 |
1.2 |
|
Scallops |
0.05 |
NA |
ND |
0.22 |
66 |
NMFS 1978 |
0.8 |
|
Scorpion fish |
0.29 |
NA |
0.02 |
1.35 |
78 |
NMFS 1978 |
0.9 |
|
Seafood Type |
Mercury Concentration (ppm)a |
n |
Sourceb |
Marketc (%) |
|||
|
Mean |
Median |
Min |
Max |
||||
|
Shad (American) |
0.07 |
NA |
ND |
0.22 |
59 |
NMFS 1978 |
0.0 |
|
Sharkg |
0.99 |
0.83 |
ND |
4.54 |
351 |
FDA 1990–02 |
0.1 |
|
Sheepshead |
0.13 |
NA |
0.02 |
0.63 |
59 |
NMFS 1978 |
0.0 |
|
Shrimp |
ND |
ND |
ND |
0.05 |
24 |
FDA 1990–02 |
15.1 |
|
Skate |
0.14 |
NA |
0.04 |
0.36 |
56 |
NMFS 1978 |
0.3 |
|
Snapper |
0.19 |
0.12 |
ND |
1.37 |
25 |
FDA 2002–03 |
0.5 |
|
Squid |
0.07 |
NA |
ND |
0.40 |
200 |
NMFS 1978 |
1.0 |
|
Swordfish |
0.97 |
0.86 |
0.10 |
3.22 |
605 |
FDA 1990–02 |
0.4 |
|
Tilapia |
0.01 |
ND |
ND |
0.07 |
9 |
FDA 1990–02 |
1.9 |
|
Tilefish (Atlantic) |
0.15 |
0.10 |
0.06 |
0.53 |
17 |
FDA 2002–03 |
0.0 |
|
Tilefish (Gulf of Mexico) |
1.45 |
NA |
0.65 |
3.73 |
60 |
NMFS 1978 |
0.0 |
|
Trout (freshwater) |
0.03 |
0.02 |
ND |
0.13 |
17 |
FDA 2002–03 |
0.7 |
|
Tuna (canned, albacore) |
0.35 |
0.34 |
ND |
0.85 |
179 |
FDA 1990–03 |
5.3 |
|
Tuna (canned, light) |
0.12 |
0.08 |
ND |
0.85 |
131 |
FDA 1990–03 |
13.4 |
|
Tuna (fresh/frozen) |
0.38 |
0.30 |
ND |
1.30 |
131 |
FDA 1990–02 |
1.8 |
|
Weakfish (sea trout) |
0.25 |
0.16 |
ND |
0.74 |
27 |
FDA 1990–03 |
0.1 |
|
Whitefish |
0.07 |
0.05 |
ND |
0.31 |
25 |
FDA 1990–03 |
0.2 |
|
Whiting |
ND |
ND |
ND |
ND |
2 |
FDA 1990–02 |
4.1 |
|
aMercury was measured as total mercury and/or methylmercury. ND—mercury concentration below the level of detection (LOD = 0.01 ppm). NA—data not available. bSource of data: FDA Surveys 1990–2003 (FDA, 2004), National Marine Fisheries Service Survey of Trace Elements in the Fishery Resource (Hall et al., 1978), A Survey of the Occurrence of Mercury in the Fishery Resources of the Gulf of Mexico (Ache et al., 2000). cMarket share calculation based on 2001 National Marine Fisheries Service published landings data (NMFS, 2002). dIncludes sea bass/striped bass/rockfish. eIncludes blue, king, and snow crab. fIncludes flounder, plaice, sole. gIncludes multiple species of shark. SOURCE: Derived from Regulatory Toxicology and Pharmacology 40(3), Carrington CD, Montwill B, Bolger PM. An intervention analysis for the reduction of exposure to methylmercury from the consumption of seafood by women of child-bearing age, 274–280, 2004, with permission from Elsevier. |
|||||||
species of fish and shellfish reported consumed by women in the 1999–2000 NHANES (Carrington et al., 2004). Mercury levels in fish do not appear to have changed appreciably over recent decades, although the data are limited (US EPA, 1997).
Persistent Organic Pollutants
Persistent organic pollutants (POPs) are lipophilic contaminant compounds and tend to bioaccumulate up the food chain. They include such
substances as dioxins, dioxin-like compounds (DLCs), and polychlorinated biphenyls (PCBs), including those with dioxin-like activity. Dioxins, dioxinlike compounds (including PCBs with dioxin-like activity) (DLCs) and PCBs are the most frequently occuring POPs in seafood. A variety of lipophilic pesticide contaminants have been found in fish from the Great Lakes (Giesy et al., 1994; Anderson et al., 1998; Chernyak et al., 2005) and both farmed and wild-caught salmon from European waters (Food Safety Authority of Ireland, 2002; Foran et al., 2004; Hites et al., 2004b; Hamilton et al., 2005). Among these contaminants, aldrin and dieldrin have been found in amounts exceeding 1 µg/kg body weight in the Great Lakes (Anderson et al., 1998; Cole et al., 2002; Schmitt et al., 1999). The Salton Sea, a large manmade lake in California, was reported to have high levels of some organochlorine compounds (OCs) in 2001 (Sapozhnikova et al., 2004). The toxicity of these compounds varies widely, and the implications for human health remain controversial.
Several investigators have found that levels of many POPs are higher in commercially available farmed fish than in wild-caught fish (Easton et al., 2002; Hites et al., 2004a,b; Foran et al., 2005). Van Leeuwen and de Boer (2004) tabulated contaminant data for PCBs, OCs, polychlorinated dibenzo-p-dioxins (PCDDs), polychlorinated dibenzofurans (PCDFs), dioxin-like PCBs, polybrominated diphenyl ethers (PBDEs), and others. Table 2-14 shows estimated DLC levels in seafood from the FDA Total Diet Study Market Basket Survey. The reported values differ from 2001 through 2004, in part because of changes in analytical detection techniques.
Impact of Toxicants on Selenium Status
Several environmental organic toxicants have a direct or indirect impact on antioxidant status or oxidative stress of various organisms (Halliwell and Gutteridge, 1999). Therefore, studies have examined what influences such compounds may have on selenoproteins involved in modulation of oxidative stress.
Dioxin
2,3,7,8-Tetrachlorodibenzo-p-dioxin (TCDD) inhibits hepatic selenium-dependent but not selenium-independent glutathione peroxidase in hamsters (Hassan et al., 1983). Supplemental dietary selenium will partially protect against TCDD toxicity in rats (Hassan et al., 1985).
Polychlorinated Biphenyls
PCB exposure causes significant increases in hepatic levels of lipid
TABLE 2-14 Total Diet Study Analyses of Dioxin-like Compounds in Seafood, 2001–2004
|
Seafood Type |
||||
|
2001 |
2002 |
2003 |
2004 |
|
|
Tuna, canned in oil |
0.0057 |
0.0050 |
N/A |
N/A |
|
Tuna, canned in water |
N/A |
N/A |
0.0110 |
0.0182 |
|
Tuna noodle casserole |
0.0334 |
0.0318 |
0.0826 |
0.0159 |
|
Fish sticks, frozen |
0.0335 |
0.0667 |
0.0126 |
0.0053 |
|
Shrimp, boiled |
0.0597 |
0.0834 |
0.0032 |
0.0151 |
|
Salmon, fillets |
0.3257 |
0.1504 |
0.2585 |
0.0795 |
|
Fish sandwich, fast-food |
0.0138 |
0.0059 |
0.0152 |
0.0078 |
|
Clam chowder, canned |
0.0054 |
0.0169 |
0.0096 |
0.0154 |
|
Catfish, cooked in oil |
N/A |
N/A |
0.2971 |
0.2055 |
|
aPCDD = Polychlorinated dibenzo-p-dioxin. bTEQ = Toxicity Equivalents (see Chapter 4 for explanation). cPg/g = Picograms of contaminant per gram of food (see Chapter 4 for explanation). dND = LOD/2 refers to the non-detect limit expressed as the limit of detection×0.5. SOURCE: USDA Total Diet Study (http://www.cfsan.fda.gov/~lrd/dioxdata.html). |
||||
peroxidation, glutathione, glutathione reductase, glucose-6-phosphate dehydrogenase, and glutathione S-transferase in rats fed diets low in selenium but not in rats fed adequate selenium (Chow and Gairola, 1981; Chow et al., 1981). Thus, dietary selenium deprivation renders rats more sensitive to PCB effects.
FINDINGS
-
Seafood is a primary source of the omega-3 long-chain polyunsaturated fatty acids (LCPUFA) eicosapentaenoic acid (EPA) and docosahexaenoic acid (DHA), but not all seafood is rich in these fatty acids.
-
Relative to other foods in the meat, poultry, fish, and egg group, fish is generally lower in saturated fatty acids and higher in EPA, DHA, and selenium than most other choices.
-
Seafood may also contain chemical contaminants (e.g., methylmercury, POPs). While there are data on the methylmercury content of many types of seafood, there are virtually no data on other contaminants and pollutants.
-
Average quantities of seafood consumed by the general US population, and by several specific population groups, are below levels suggested by
-
many authoritative groups including levels recommended by the American Heart Association for cardiovascular disease prevention.
-
Average quantities of EPA and DHA consumed by the general US population, and by several specific population groups, are also below levels recommended by many authoritative groups.
-
For many ethnic and geographic subgroups, there are insufficient data to characterize the intake levels of seafood, EPA, DHA, and other dietary constituents, and to assess the variability of those intakes.
-
Chicken and eggs, although not particularly rich sources, have contributed over 10 percent of the EPA and about 25 percent of the DHA in the US diet in recent years because of their frequent consumption. However, changes in feeding practices may be making these contributions negligible. New forthcoming data on chicken and eggs show most nutrient levels comparable to earlier samples, but EPA/DHA levels as undetectable.
-
Shrimp and tuna are the two most commonly consumed types of seafood in the United States. Shrimp and canned/packaged light tuna—the major type of tuna consumed—are not especially rich in EPA and DHA; nor are they especially high in mercury. However, albacore (white) tuna, a good source of EPA/DHA, can be higher in mercury than other tuna.
-
Shark, swordfish, king mackerel, and tilefish—the four types of seafood identified in the FDA/US EPA joint advisory as being most highly contaminated with mercury—are not among the types of seafood most frequently consumed in the United States, and supply trends suggest their future availability will be increasingly limited.
-
Forces such as consumer trends, increasing dependence on aquaculture, and increased imports are influencing the availability of many popular seafood selections.
RESEARCH RECOMMENDATIONS
Recommendation 1: Research is needed on systematic surveillance studies of targeted subpopulations. Such studies should be carried out using state-of-the-art assessment methods to determine the intake levels of seafood, EPA/DHA and other dietary constituents, and the variability of those intake levels among population groups.
Recommendation 2: Sufficiently large analytic samples of the most common seafood types need to be obtained and examined. These samples should be used to determine the levels of nutrients, toxicants, and contaminants in each species and the variability between them, which should be reported transparently.
Recommendation 3: Additional data is needed to assess benefits and risks associated with seafood consumption within the same population or population subgroup.
REFERENCES
Ache BW, Boyle JD, Morse CE. 2000. A Survey of the Occurrence of Mercury in the Fishery Resources of the Gulf of Mexico. Stennis Space Center, MS: Battelle.
ADA (American Dietetic Association). 2003. Position of the American Dietetic Association and Dietitians of Canada: Vegetarian diets. Journal of the American Dietetic Association 103(6):748–765.
Anderson HA, Falk C, Hanrahan L, Olson J, Burse VW, Needham L, Paschal D, Patterson D Jr, Hill RH Jr, and The Great Lakes Consortium. 1998. Profiles of Great Lakes critical pollutants: A sentinel analysis of human blood and urine. Environmental Health Perspectives 106(5):279–289.
Arnold SM, Middaugh JP. 2004 (December 2). Use of traditional foods in a healthy diet in Alaska: Risks in perspective (Mercury). State of Alaska Epidemiology Bulletin 8(11):1–48.
ATSDR (Agency for Toxic Substances and Disease Registry). 1999. Toxicological Profile for Mercury. Atlanta, GA: US Department of Health and Human Services, Public Health Service.
Bairati I, Roy L, Meyer F. 1992. Double-blind, randomized, controlled trial of fish oil supplements in prevention of recurrence of stenosis after coronary angioplasty. Circulation 85(3):950–956.
Ballew C, Ross A, Wells RS, Hiratsuka V, Hamrick KJ, Nobmann ED, Bartell S. 2004. Final Report on the Alaska Traditional Diet Survey. Anchorage, AK: Alaska Native Health Board, Alaska Native Epidemiology Center.
Barlow S. 2001 (October). Fishmeal and Oil—Supplies and Markets. A presentation to Group Fish Forum, St. Albans, UK, International Fishmeal and Fish Oil Organization. [Online]. Available: http://www.iffo.org.uk/Supplies.pdf#search=%22Fishmeal%20and%20oil%3A%20resources%20and%20markets%22 [accessed August 24, 2006].
Baum JK, Myers RA, Kehler DG, Worm B, Harley SJ, Doherty PA. 2003. Collapse and conservation of shark populations in the Northwest Atlantic. Science 299(5605):389–392.
Bean LD, Leeson S. 2003. Long-term effects of feeding flaxseed on performance and egg fatty acid composition of brown and white hens. Poultry Science 82(3):388–394.
Bell JG, Tocher DR, Henderson RJ, Dick JR, Crampton VO. 2003. Altered fatty acid compositions in atlantic salmon (Salmo salar) fed diets containing linseed and rapeseed oils can be partially restored by a subsequent fish oil finishing diet. Journal of Nutrition 133(9):2793–2801.
Blonk MC, Bilo HJ, Nauta JJ, Popp-Snijders C, Mulder C, Donker AJ. 1990. Dose-response effects of fish oil supplementation in healthy volunteers. American Journal of Clinical Nutrition 52(1):120–127.
Bucher HC, Hengstler P, Schindler C, Meier G. 2002. N-3 polyunsaturated fatty acids in coronary heart disease: A meta-analysis of randomized controlled trials. American Journal of Medicine 112(4):298–304.
Burdge GC, Wootton SA. 2002. Conversion of alpha-linolenic acid to eicosapentaenoic, docosapentaenoic and docosahexaenoic acids in young women. British Journal of Nutrition. 88(4):411–420.
Burdge GC, Jones AE, Wootton SA. 2002. Eicosapentaenoic and docosapentaenoic acids are the principal products of alpha-linolenic acid metabolism in young men. British Journal of Nutrition 88(4):355–363.
Burger J. 2002. Consumption patterns and why people fish. Environmental Research 90(2): 125–135.
Burger J, Stephens WL Jr, Boring CS, Kuklinski M, Gibbons JW, Gochfeld M. 1999. Factors in exposure assessment: Ethnic and socioeconomic differences in fishing and consumption of fish caught along the Savannah River. Risk Analysis 19(3):427–438.
Cantor AH, Decker EA, Collins VP. 1999. Chapter 7: Fatty acids in poultry and egg products. In: Chow CK, ed. Fatty Acids in Foods and Their Health Implications. New York: Marcel Dekker, Inc. Pp. 125–151.
Carrington CD, Montwill B, Bolger PM. 2004. An intervention analysis for the reduction of exposure to methylmercury from the consumption of seafood by women of child-bearing age. Regulatory Toxicology and Pharmacology 40(3):272–280.
CDC/NCHS (Centers for Disease Control and Prevention/National Center for Health Statistics). 1999–2000. National Health and Nutrition Examination Survey. Hyattsville, MD: US Department of Health and Human Services, Centers for Disease Control and Prevention.
Chernyak SM, Rice CP, Quintal RT, Begnoche LJ, Hickey JP, Vinyard BT. 2005. Time trends (1983–1999) for organochlorines and polybrominated diphenyl ethers in rainbow smelt (Osmerus mordax) from Lakes Michigan, Huron, and Superior, USA. Environmental Toxicology and Chemistry 24(7):1632–1641.
Chow CK, Gairola CC. 1981. Influence of dietary selenium on the hepatic and pulmonary enzymes in polychlorobiphenyls-treated rats. Cancer Detection and Prevention 4(1–4):135–139.
Chow CK, Thacker R, Gairola C. 1981. Dietary selenium and levels of L-ascorbic acid in the plasma, livers and lungs of polychlorinated biphenyls-treated rats. International Journal of Vitamin and Nutrition Research 51(3):279–283.
Cohen Z, Norman HA, Heimer YM. 1995. Microalgae as a source of omega 3 fatty acids. World Review of Nutrition and Dietetics 77:1–31.
Cole DC, Sheeshka J, Murkin EJ, Kearney J, Scott F, Ferron LA, Weber JP. 2002. Dietary intakes and plasma organochlorine contaminant levels among Great Lakes fish eaters. Archives of Environmental Health 57(5):496–509.
Coleman FC, Figueira WF, Ueland JS, Crowder LB. 2004. The impact of United States recreational fisheries on marine fish populations. Science 305(5692):1958–1960.
DGAC (Dietary Guidelines Advisory Committee). 2005. Dietary Guidelines Advisory Committee Report. Washington, DC: Department of Health and Human Services and the Department of Agriculture. [Online]. Available: http://www.health.gov/dietaryguidelines/dga2005/report/ [accessed November 29, 2005].
Easton MD, Luszniak D, Von der Geest E. 2002. Preliminary examination of contaminant loadings in farmed salmon, wild salmon and commercial salmon feed. Chemosphere 46(7):1053–1074.
ERS (Economic Research Service). 2004 (December 21). Data: Food Availability: Spreadsheets. Fish and Shellfish. [Online]. Available: http://www.ers.usda.gov/data/foodconsumption/spreadsheets/mtfish.xls [accessed December 22, 2005].
FAO (Food and Agriculture Organization). 2002. Part I: World review of fisheries and aquaculture. In: The State of World Fisheries and Aquaculture. FAO Information Division Rome, Italy: Food and Agriculture Organization. [Online]. Available: http://www.fao.org/docrep/005/y7300e/y7300e04.htm#P0_0 [accessed August 24, 2006].
FAO. 2004. Part I: World review of fisheries and aquaculture. In: The State of World Fisheries and Aquaculture. Rome, Italy: FAO Information Division. [Online]. Available: http://www.fao.org/documents/show_cdr.asp?url_file=/docrep/007/y5600e/y5600e04.htm [accessed October 10, 2005].
FDA (Food and Drug Administration). 2004. Mercury Levels in Commercial Fish and Shellfish. [Online]. Available: http://www.cfsan.fda.gov/~frf/sea-mehg.html [accessed December 5, 2006].
Food Safety Authority of Ireland. 2002. Investigation on PCDDs/PCDFs and Several PCBs in Fish Liver Oil Capsules. Hamburg, Germany: ERGO Forschungsgesellschaft mbH, Germany.
Foran JA, Hites RA, Carpenter DO, Hamilton MC, Mathews-Amos A, Schwager SJ. 2004. A survey of metals in tissues of farmed Atlantic and wild Pacific salmon. Environmental Toxicology and Chemistry 23(9):2108–2110.
Foran JA, Carpenter DO, Hamilton MC, Knuth BA, Schwager SJ. 2005. Risk-based consumption advice for farmed Atlantic and wild Pacific salmon contaminated with dioxins and dioxin-like compounds. Environmental Health Perspectives 113(5):552–556.
Giesy JP, Vergrugge DA, Othout RA, Bowerman WW, Mora MA, Jones PD, Newsted JL, Vandervoort C, Heaton SN, Auerlich RJ, Bursian SJ, Ludwig JP, Ludwig M, Dawson GA, Kubiak TJ, Best DA, Tillitt DE. 1994. Contaminants in fishes from Great Lakes–influenced sections and above dams on three Michigan rivers. I: Concentrations of organo-chlorine insecticides, polychlorinated biphenyls, dioxin equivalents, and mercury. Archives of Environmental Contamination and Toxicology 27(2):202–212.
GMFMC (Gulf of Mexico Fishery Management Council). 2006. Coastal Migratory Pelagics Fishery Management Plan. [Online]. Available: http://www.gulfcouncil.org/Beta/GMFM-CWeb/FMPs/migratory_pelagics_amendments.htm [accessed May 9, 2006].
Gonzalez-Esquerra R, Leeson S. 2000. Effects of menhaden oil and flaxseed in broiler diets on sensory quality and lipid composition of poultry meat. British Poultry Science 41(4):481–488.
Hall RA, Zook EG, Meaburn GM. 1978. National Marine Fisheries Service Survey of Trace Elements in the Fishery Resource. Seattle, WA: US Department of Commerce, National Oceanic and Atmospheric Administration, National Marine Fisheries Service.
Halliwell B, Gutteridge JMC. 1999. Free radicals, “reactive species” and toxicology. In: Free Radicals in Biology and Medicine. Oxford, UK: Oxford University Press. Pp. 544–616.
Hamilton MC, Hites RA, Schwager SJ, Foran JA, Knuth BA, Carpenter DO. 2005. Lipid composition and contaminants in farmed and wild salmon. Environmental Science and Technology 39(22):8622–8629.
Hassan MQ, Stohs SJ, Murray WJ. 1983. Comparative ability of TCDD to induce lipid peroxidation in rats, guinea pigs, and Syrian golden hamsters. Bulletin of Environmental Contamination and Toxicology 31(6):649–657.
Hassan MQ, Stohs SJ, Murray WJ, Birt DF. 1985. Dietary selenium, glutathione peroxidase activity, and toxicity of 2,3,7,8-tetrachloro-dibenzo-p-dioxin. Journal of Toxicology and Environmental Health 15(3-4):405–415.
Herber SM, Van Elswyk ME. 1996. Dietary marine algae promotes efficient deposition of n-3 fatty acids for the production of enriched shell eggs. Poultry Science 75(12):1501–1507.
Hites RA, Foran JA, Carpenter DO, Hamilton MC, Knuth BA, Schwager SJ. 2004a. Global assessment of organic contaminants in farmed salmon. Science 303(5655):226–229.
Hites RA, Foran JA, Schwager SJ, Knuth BA, Hamilton MC, Carpenter DO. 2004b. Global assessment of polybrominated diphenyl ethers in farmed and wild salmon. Environmental Science and Technology 38(19):4945–4949.
Hulan HW, Ackman RG, Ratnayake WM, Proudfoot FG. 1989. Omega-3 fatty acid levels and general performance of commercial broilers fed practical levels of redfish meal. Poultry Science 68(1):153–162.
Hutchison R, Kraft CE. 1994. Hmong fishing activity and fish consumption. Journal of Great Lakes Research 20(2):471–478.
IOM (Institute of Medicine). 2003. Dioxins and Dioxin-like Compounds in the Food Supply: Strategies to Decrease Exposure. Washington, DC: The National Academies Press.
Kim J, Chan MM. 2004. Acculturation and dietary habits of Korean Americans. British Journal of Nutrition 91(3):469–478.
Kolonel LN, Altshuler D, Henderson BE. 2004. The Multiethnic Cohort Study: Exploring genes, lifestyle and cancer risk. Nature Reviews Cancer 4(7):519–527.
Komprda T, Zelenka J, Fajmonova E, Fialova M, Kladroba D. 2005. Arachidonic acid and long-chain n-3 polyunsaturated fatty acid contents in meat of selected poultry and fish species in relation to dietary fat sources. Journal of Agricultural and Food Chemistry 53(17):6804–6812.
Kudo Y, Falciglia GA, Couch SC. 2000. Evolution of meal patterns and food choices of Japanese-American females born in the United States. European Journal of Clinical Nutrition 54(8):665–670.
Kuhnlein HV, Receveur O, Chan HM, Loring E. 2000. Assessment of Dietary Benefit: Risk in Inuit Communities. Ste-Anne-de-Bellevue, Québec: Centre for Indigenous Peoples’ Nutrition and Environment (CINE) and Inuit Tapirisat of Canada.
Kuhnlein HV, Receveur O, Soueida R, Egeland GM. 2004. Arctic indigenous peoples experience the nutrition transition with changing dietary patterns and obesity. Journal of Nutrition 134(6):1447–1453.
Marchioli R, Barzi F, Bomba E, Chieffo C, Di Gregorio D, Di Mascio R, Franzosi MG, Geraci E, Levantesi G, Maggioni AP, Mantini L, Marfisi RM, Mastrogiuseppe G, Mininni N, Nicolosi GL, Santini M, Schweiger C, Tavazzi L, Tognoni G, Tucci C, Valagussa F, GISSI-Prevenzione Investigators. 2002. Early protection against sudden death by n-3 polyunsaturated fatty acids after myocardial infarction: Time-course analysis of the results of the Gruppo Italiano per lo Studio della Sopravvivenza nell’Infarto Miocardico (GISSI)-Prevenzione. Circulation 105(16):1897–1903.
Marien K, Patrick GM. 2001. Exposure analysis of five fish-consuming populations for overexposure to methylmercury. Journal of Exposure Analysis and Environmental Epidemiology 11(3):193–206.
Miller MM, Nash DA. 1971. Regional and Other Related Aspects of Shellfish Consumption, Circular 361. Seattle, WA: National Marine Fisheries Service.
Mos L, Jack J, Cullon D, Montour L, Alleyne C, Ross PS. 2004. The importance of marine foods to a near-urban first nation community in coastal British Columbia, Canada: Toward a risk-benefit assessment. Journal of Toxicology and Environmenal Health A67(8–10):791–808.
Muckle G, Ayotte P, Dewailly E, Jacobson SW, Jacobson JL. 2001. Determinants of polychlorinated biphenyls and methylmercury exposure in Inuit women of childbearing age. Environmental Health Perspectives 109(9):957–963.
Naylor RL, Goldburg RJ, Primavera JH. Kautsky N, Beveridge MC, Clay J, Folke C, Lubchenco J, Mooney H, Troell M. 2000. Effect of aquaculture on world fish supplies. Nature 405(6790):1017–1024.
NFI (National Fisheries Institute). 2005. Top 10 U.S. Consumption by Species Chart. [Online]. Available: http://www.aboutseafood.com/media/top_10.cfm [accessed November 29, 2005].
NMFS (National Marine Fisheries Service). 2002. Fisheries of the United States 2001. Silver Spring, MD: National Oceanic and Atmospheric Administration (NOAA). [Online]. Available: http://www.st.nmfs.gov/st1/fus/fus01/2001-fus.pdf [accessed December 7, 2006].
NMFS. 2005a. Fisheries of the United States 2004. Silver Spring, MD: National Oceanic and Atmospheric Administration (NOAA). [Online]. Available: http://www.st.nmfs.gov/st1/fus/fus04/fus_2004.pdf [accessed December 22, 2005].
NMFS. 2005b. A Message from the NOAA Assistant Administrator for Fisheries. [Online]. Available: http://www.mafmc.org/mid-atlantic/StatusReport2004.pdf [accessed May 9, 2006].
NRC (National Research Council). 2000. Toxicological Effects of Methylmercury. Washington, DC: National Academy Press.
Nutrition Business International. 1998. $23 billion and counting: Nutrition industry braces for a competitive future. Nutrition Business Journal 3(9):1–5, 13, 18.
Pawlosky RJ, Hibbeln JR, Novotny JA, Salem N Jr. 2001. Physiological compartmental analysis of alpha-linolenic acid metabolism in adult humans. Journal of Lipid Research 42(8):1257–1265.
Ratnayake WMN, Ackman RG. 1989. Effect of redfish meal enriched diets on the taste and n-3 PUFA of 42-day-old broiler chickens. Journal of Science and Food Agriculture 49:59–74.
Receveur O, Boulay M, Kuhnlein HV. 1997. Decreasing traditional food use affects diet quality for adult Dene/Metis in 16 communities of the Canadian Northwest Territories. Journal of Nutrition 127(11):2179–2186.
Reis GJ, Silverman DI, Boucher TM, Sipperly ME, Horowitz GL, Sacks FM, Pasternak RC. 1990. Effects of two types of fish oil supplements on serum lipids and plasma phospholipid fatty acids in coronary artery disease. American Journal of Cardiology 66(17):1171–1175.
Rupp EM, Miller FI, Baes CF III. 1980. Some results of recent surveys of fish and shellfish consumption by age and region of U.S. residents. Health Physics 39(2):165–175.
SAFMC (South Atlantic Fishery Management Council). 2005. Council scheduled to approve amendment 13C for snapper grouper fishery during December Meeting. South Atlantic Update, Fall edition. P. 1.
Sapozhnikova Y, Bawardi O, Schlenk D. 2004. Pesticides and PCBs in sediments and fish from the Salton Sea, California, USA. Chemosphere 55(6):797–809.
Satoh H. 2003. Behavioral teratology of mercury and its compounds. Tohoku Journal of Experimental Medicine 201(1):1–9.
Scheideler SE, Froning GW. 1996. The combined influence of dietary flaxseed variety, level, form, and storage conditions on egg production and composition among vitamin E–supplemented hens. Poultry Science 75(10):1221–1226.
Schmitt CJ, Zajicek JL, May TW, Cowman DF. 1999. Organochlorine residues and elemental contaminants in US freshwater fish, 1976–1986: National Contaminant Biomonitoring Program. Reviews of Environmental Contamination and Toxicology 162:43–104.
Sechena R, Liao S, Lorenzana R, Nakano C, Polissar N, Fenske R. 2003. Asian American and Pacific Islander seafood consumption—a community-based study in King County, Washington. Journal of Exposure Analysis and Environmental Epidemiology 13(4):256–266.
Sharma S, Murphy SP, Wilkens LR, Shen L, Hankin JH, Henderson B, Kolonel LN. 2003. Adherence to the Food Guide Pyramid recommendations among Japanese Americans, Native Hawaiians, and whites: Results from the Multiethnic Cohort Study. Journal of the American Dietetic Association 103(9):1195–1198.
Sharma S, Murphy SP, Wilkens LR, Shen L, Hankin JH, Monroe KR, Henderson B, Kolonel LN. 2004. Adherence to the food guide pyramid recommendations among African Americans and Latinos: Results from the Multiethnic Cohort. Journal of the American Dietetic Association 104(12):1873–1877.
Sijtsma L, de Swaaf ME. 2004. Biotechnological production and applications of the omega-3 polyunsaturated fatty acid docosahexaenoic acid. Applied Microbiology and Biotechnology 64(2):146–153.
Sindelar CA, Scheerger SB, Plugge SL, Eskridge KM, Wander RC, Lewis NM. 2004. Serum lipids of physically active adults consuming omega-3 fatty acid-enriched eggs or conventional eggs. Nutrition Research 24(9):731–739.
Tocher DR, Fonseca-Madrigal J, Bell JG, Dick JR, Henderson RJ, Sargent JR. 2003. Effects of diets containing linseed oil on fatty acid desaturation and oxidation in hepatocytes and intestinal enterocytes in Atlantic salmon (Salmo salar). Fish Physiology and Biochemistry 26:157–170.
US EPA (US Environmental Protection Agency). 1997. Mercury Study Report to Congress: Volume 1: Executive Summary. EPA-452-R-97-003. Washington, DC: EPA. [Online]. Available: http://www.epa.gov/ttn/oarpg/t3/reports/volume1.pdf [accessed August 24, 2006].
US EPA/FDA (Food and Drug Administration). 2004. What You Need to Know About Mercury in Fish and Shellfish. EPA-823-R-04-005. [Online]. Available: http://www.epa.gov/water-science/fishadvice/advice.html or http://www.cfsan.fda.gov/~dms/admehg3.html [accessed September 8, 2005].
US Tuna Foundation. 2005. About Tuna. [Online]. Available: http://www.tunafacts.org/abouttuna/index.html [accessed October 02, 2006].
USDA (US Department of Agriculture). 2005. USDA National Nutrient Database for Standard Reference Release 18. [Online]. Available: http://www.nal.usda.gov/fnic/foodcomp/Data/SR18/sr18.html [accessed October 10, 2005].
Van Elswyk ME. 1997. Comparison of n-3 fatty acid sources in laying hen rations for improvement of whole egg nutritional quality: A review. British Journal of Nutrition 78(Suppl 1): S61–S69.
van Leeuwen S, de Boer J. 2004. Detecting organic contaminants in food: The case of fish and shellfish. In: Watson DH, ed. Pesticide, Veterinary and Other Residues in Foods. Cambridge, UK: Woodhead Publishing. Pp. 536–576.
Vanschoonbeek K, de Maat MPM, Heemskerk JWM. 2003. Fish oil consumption and reduction of arterial disease. Journal of Nutrition 133(3):657–660.
Watson R, Pauly D. 2001. Systematic distortions in world fisheries catch trends. Nature 414(6863):534–536.
Wu G, Truksa M, Datla N, Vrinten P, Bauer J, Zank T, Cirpus P, Heinz E, Qiu X. 2005. Stepwise engineering to produce high yields of very long-chain polyunsaturated fatty acids in plants. Nature Biotechnology 23(8):1013–1017.


