
10
Adaptive Evolution of Color Vision as Seen Through the Eyes of Butterflies
FRANCESCA D. FRENTIU,* GARY D. BERNARD,† CRISTINA I. CUEVAS,* MARILOU P. SISON-MANGUS,* KATHLEEN L. PRUDIC,‡ and ADRIANA D. BRISCOE*
Butterflies and primates are interesting for comparative color vision studies, because both have evolved middle- (M) and longwavelength- (L) sensitive photopigments with overlapping absorbance spectrum maxima (λmax values). Although positive selection is important for the maintenance of spectral variation within the primate pigments, it remains an open question whether it contributes similarly to the diversification of butterfly pigments. To examine this issue, we performed epimicrospectrophotometry on the eyes of five Limenitis butterfly species and found a 31-nm range of variation in the λmax values of the L-sensitive photopigments (514–545 nm). We cloned partial Limenitis L opsin gene sequences and found a significant excess of replacement substitutions relative to polymorphisms among species. Mapping of these L photopigment λmax values onto a phylogeny revealed two instances within Lepidoptera of convergently evolved L photopigment lineages whose λmax values were blue-shifted. A codon-
based maximum-likelihood analysis indicated that, associated with the two blue spectral shifts, four amino acid sites (Ile 17Met, Ala64Ser, Asn70Ser, and Ser137Ala) have evolved substitutions in parallel and exhibit significant dN/dS >1. Homology modeling of the full-length Limenitis arthemis astyanax L opsin placed all four substitutions within the chromophore-binding pocket. Strikingly, the Ser137Ala substitution is in the same position as a site that in primates is responsible for a 5- to 7-nm blue spectral shift. Our data show that some of the same amino acid sites are under positive selection in the photopigments of both butterflies and primates, spanning an evolutionary distance >500 million years.
Ever since Darwin, there has been intense interest in the evolution of complex traits, with one of the most notable examples being the evolution of the eyes. Only three phyla have evolved image-resolving eyes: arthropods, mollusks, and chordates (Land and Fernald, 1992). Although there are vast morphological and neurobiological differences among the eyes of these lineages, there are also many similarities that may provide new insight into the molecular mechanisms governing the evolution of this complex trait.
Image-resolving eyes are composed of photoreceptor cells, which contain photopigments, and they also have accessory pigment cells, which shield the photopigments from stray light. Photopigments are made up of a light-sensitive chromophore (e.g., 11-cis-retinal) and an opsin protein. Although the isolated chromophore has an absorbance spectrum maximum (λmax value) at 380 nm (Han et al., 1998), the λmax values of photopigments can vary from 360 to 600 nm through the spectral tuning of the chromophore by specific interactions with amino acids in the chromophore-binding pocket of the opsin protein. Because photopigment sensitivities represent clear adaptations to an animal’s light environment (Yokoyama, 1997), the amino acid sites of opsins involved in spectral tuning may be under positive selection, which has been most extensively studied in fish, mammals, and primates (Surridge et al., 2003; Spady et al., 2005; Yokoyama and Takenaka, 2005).
Comparing these photopigment results with those of a more distant lineage such as butterflies could provide a better understanding of the molecular mechanisms of the eye and how these molecules change under selection. The visual systems of butterflies and primates may be under similar selective pressures. Butterflies and primates share a similar light environment and contain species that are nocturnally or diurnally active and species that are fruit-feeders. Like primates that are leaf eaters, butterfly females need to discriminate among foliage types for oviposition, which may have a strong impact on their color vision (see Kelber, 1999,
2001). As well, both use vision in the detection of conspecifics and mates (Mollon, 1989). (Detection of predators is probably visual for butterflies but does not depend on color vision; it probably depends on motion vision instead.) Thus, various aspects of the color vision systems of butterflies and primates may have undergone convergent evolution (see below).
Phylogenetic analyses indicate that the opsin gene family duplicated several times before the radiation of metazoans, giving rise to as many as seven protein subfamilies (Terakita, 2005), including the ciliary and rhabdomeric opsins, each associated with a distinct photoreceptor cell type (Arendt, 2003). All photoreceptor cells expand their membranes to express opsins, but ciliary photoreceptor cells expand their ciliary side, the side closest to the cell body, and express ciliary opsins, whereas rhabdomeric photoreceptor cells expand their apical side and express rhabdomeric opsins (Arendt, 2003). In general, vertebrates have ciliary opsins that are expressed in the photoreceptor cells of the retina, whereas insects have rhabdomeric opsins that are expressed in the photoreceptor cells of the ommatidia of the compound eye.
Color vision adds to the complexity of the eye. With a single spectral class of photoreceptor, only achromatic (brightness-contrast) vision is possible. Both mammalian long-wavelength-sensitive (L) cones and butterfly L photoreceptors provide outputs for brightness processing (Kolb and Scherer, 1982; Jacobs, 1993). Color vision, on the other hand, is the ability to discriminate between different wavelengths of light, regardless of relative intensity and depends on the presence of at least two spectrally distinct classes of photoreceptors, as well as appropriate neuronal connections in the brain. Natural selection has recruited both the vertebrate ciliary opsins and the insect rhabdomeric opsins for use in achromatic and color vision. Moreover, mammals use all their cone photopigments for color vision, and although not yet fully investigated, butterflies likely use all their major spectral receptor types for color vision (Kelber and Henique, 1999; Kelber, 2001; Kelber et al., 2003).
There is variation in both the photopigment sensitivity and the range of color vision in mammals. Color vision among placental mammals is typically dichromatic based on outputs from short-wavelength-sensitive (S) and L cone pigments encoded by distinct opsin genes expressed in the cone photoreceptor cells of the vertebrate retina (Jacobs, 1993; Ahnelt and Kolb, 2000). Some primates have even evolved trichromatic color vision based on an additional middle-wavelength-sensitive (M) cone pigment, which allows them to discriminate colors in the green-to-red part of the visible light spectrum. The most parsimonious explanation for the variation in primate color vision systems is that the common ancestor of primates contained a single S opsin variant, but the ancestor was polymorphic at another locus for alleles encoding M and L cone pigments (Tan et
al., 2005). In some lineages, such as in nocturnal prosimians, either the M or the L cone pigment has been lost (Tan and Li, 1999). In other lineages, such as in diurnal New World monkeys, as many as three opsin alleles have been maintained at high frequencies by balancing selection (Mollon et al., 1984). In addition, the functionally distinct M and L allelic variants have been fixed independently at least twice (or evolved convergently) as duplicate genes in the New World monkey genus Alouatta (Kainz et al., 1998; Dulai et al., 1999) and in the common ancestor of humans, apes, and Old World monkeys.
Among insects, some butterflies have evolved red–green color vision (Kelber, 1999; Kinoshita et al., 1999), convergently with primates by gene duplication (Kitamoto et al., 1998; Briscoe, 2000, 2001), and also through the use of heterogeneously expressed filtering pigments, in combination with a single L opsin (Zaccardi et al., 2006). In both mammals and butterflies, natural selection has led to the evolution of photopigments with similarly diverse sets of spectral sensitivities in the long wavelength part of the visible light spectrum. For mammals, the L/M pigment λmax = 495–565 nm (Bowmaker and Hunt, 1999), whereas in butterflies, L pigment λmax = 500–600 nm (Briscoe and Chittka, 2001). It is fascinating that the ciliary-type L and M pigments of mammals have evolved similar spectral phenotypes as the rhabdomeric-type L pigments of butterflies, and that some primates and butterflies have evolved red–green color vision in parallel. Because the genetic mechanisms underlying this expanded sensitivity to longer wavelengths of light have been elucidated largely in mammals and primates, we investigated whether similar genetic mechanisms accounted for the parallel phenotypes found in butterflies.
To address this question, we determined the peak sensitivity of the L photopigment from a large number (n > 20) of butterflies in the family Nymphalidae. In the course of this survey, we found surprisingly large variation in the λmax values of the L photopigment in eyes of butterflies of the genus Limenitis. We therefore decided to concentrate our efforts on evaluating whether positive selection has driven the spectral diversification of these closely related photopigments. Using molecular, population-genetic, and molecular evolutionary approaches, we identified several candidate spectral tuning sites in the chromophore-binding pocket of the butterfly L opsin protein. Our combined approaches suggest that similar amino acid sites are indeed involved in the evolution of color vision in both primates and butterflies.
NYMPHALID BUTTERFLIES COMPRISE A USEFUL SYSTEM FOR STUDYING COLOR VISION
Of the five families of butterflies, we have focused our studies on the diverse family Nymphalidae, because it contains a number of species that are model systems in butterfly ecology and evolutionary biology, such as the monarch butterfly Danaus plexippus (mimicry and migration) (van Zandt Brower, 1958; Reppert, 2006), Heliconius erato (speciation) (Brower, 1994; McMillan et al., 1997), and Bicyclus anynana (evolution and development) (Beldade et al., 2005). Likewise, there are ample anatomical, molecular, and behavioral data for color vision in nymphalids.
Anatomically, the basic unit of the butterfly compound eye is the ommatidium, composed of eight elongate photoreceptor cells (R1–R8) and a small basal ninth cell (R9) (Fig. 10.1 A and B). The photopigment-containing microvillar membranes produced by all photoreceptor cells of an ommatidium are fused into a single optical-sensing structure known as a rhabdom. Molecular studies in D. plexippus, H. erato, and Vanessa cardui have shown that the photopigments are encoded by two S opsin (UV, ultraviolet; B, blue) and one L opsin gene present in the ancestor of all butterflies and moths. In the main retina of these species, the R1 and R2 photoreceptor cells express either the UV or B opsin mRNAs, and the R3–R9 photoreceptors express the L opsin mRNA (Fig. 10.1C) (Briscoe et al., 2003; Sauman et al., 2005; Zaccardi et al., 2006). Some nymphalid butterflies (e.g., H. erato and monarchs) also have colored “lateral” filtering pigments that coat the rhabdom and modify the wavelengths of light available to photoisomerize the photopigments, whereas others do not (e.g., Vanessa atalanta).
Behavioral studies have shown that H. erato, although it expresses UV, B, and only one L opsin, discriminates colors in the blue to L range tested (440–640 nm), whereas V. atalanta, despite having color vision in the 440-to 590-nm range, is unable to discriminate between longer-wavelength (590–640 nm) colors (Zaccardi et al., 2006). Thus, these two nymphalid butterflies display color vision, with the difference in color vision range between them being due to the presence or absence of heterogeneously expressed filtering pigments.
ABSORBANCE SPECTRA AND OPSIN SEQUENCES OF LIMENITIS L PHOTOPIGMENTS
To test for evidence of positive selection of spectral tuning sites in nymphalid L photopigments, we first searched for L photopigments whose λmax values varied among closely related species. The λmax values of L photopigments from a number of nymphalid species were evaluated by using epimicrospectrophotometry, a method (Bernard, 1983) that
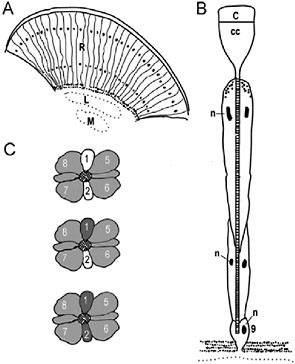
FIGURE 10.1 Butterfly compound eye and opsin expression patterns. (A) Diagram of a longitudinal section through the compound eye showing the ommatidial units. Black dots indicate location of photoreceptor nuclei. R, retina; L, lamina; M, medulla. (B) Schematic of an ommatidium. C, cornea; CC, crystalline cone; n, nuclei; 9, the ninth photoreceptor cell that sits just above the basement membrane. (C) Opsin mRNA expression patterns. The cross-sections of three ommatidia are shown. The cross-hatched area in the middle of each depicts the fused microvillous membranes of the rhabdomeres that contain the visual pigment proteins. Numbers refer to the photoreceptor cells (R1–R8), and the shades of gray refer to the opsin expression patterns: dark gray, UV opsin mRNA; white, blue opsin; light gray, long wavelength opsin. Modified from Sauman et al. (2005).
takes advantage of a mirrored tapetum underlying each ommatidium of the nymphalid eye to resolve peak absorbances of the expressed photopigments [see Materials and Methods and supporting information (SI) Methods]. Using epimicrospectrophotometry, we found that the λmax values of the L photopigments of the five Limenitis species ranged from 514 nm in Limenitis archippus archippus (Bernard, 1983) and Limenitis archippus floridensis, to 530 nm in Limenitis lorquini and Limenitis weidemeyerii, to 545 nm in Limenitis arthemis astyanax (Fig. 10.2). A spectral range of 31 nm within a single butterfly genus is remarkable compared with the other
nymphalid genera we surveyed and is similar to the 33-nm range observed for the human green and red cone pigments. This unusual spectral range among the five L pigments within the genus Limenitis provided us with a unique collection of photopigments for further analysis.
To evaluate candidate spectral tuning sites, we next determined the opsin gene sequences that correspond to the encoded L photopigment spectral phenotypes. We thus cloned the full-length L opsin cDNA from L. arthemis astyanax (GenBank accession no. AY918903) and found no evidence of gene duplication in this species, as has been found in other butterflies (Briscoe, 1998; Kitamoto et al., 1998). We also cloned partial L opsin gene sequences from each of the other four North American Limenitis species. The gene sequences ranged from 1366 to 1391 bp in length and were trimmed of introns. For all five L opsin sequences, only
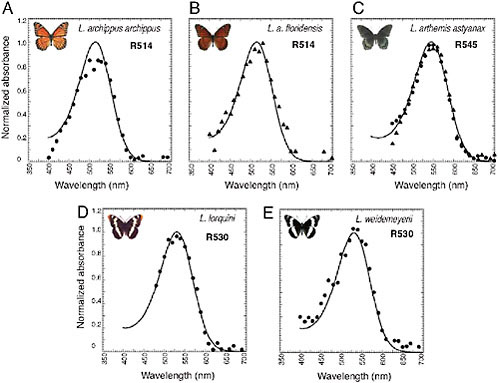
FIGURE 10.2 Normalized absorbance spectra of L photopigments in the Limenitis genus measured by epimicrospectrophotometry. Idealized spectra (solid curves) based on the 1987 Bernard template (Palacios et al., 1996). λmax values are shown in upper right corner. R545 from L. arthemis astyanax: dots represent dorsal retina, and triangles represent ventral retina.
transmembrane domains I–VI were used in subsequent analyses, because this region includes the chromophore binding pocket (SI Fig. 10.5).
There was a robust correlation between the spectral phenotypes and the number of amino acid substitutions of the L opsin proteins of Limenitis. Accordingly, the largest number of amino acid substitutions was observed between the two pigments with the largest spectral difference (31 nm, L. archippus archippus–L. arthemis astyanax, 15/263 substitutions), whereas the smallest number of substitutions was between the pigments with the smallest spectral difference (0 nm, L. archippus archippus–L. archippus floridensis, 3/263 substitutions; 0 nm, L. lorquini–L. weidemeyerii, 0/263 substitutions).
POPULATION GENETIC AND MOLECULAR EVOLUTIONARY ANALYSES SUGGEST L OPSINS ARE UNDER POSITIVE SELECTION
The large range of variation in the λmax values among the Limenitis L photopigments (514, 530, and 545 nm) is strikingly similar to that observed in the three-allele system of New World monkeys (≈530, 545, and 560 nm) (Surridge et al., 2003) and suggests that the Limenitis L photopigments may also be maintained by positive selection. We therefore undertook four population genetic and molecular evolutionary approaches, the McDonald–Kreitman (MK) test, character mapping, parallel/convergent change analysis, and branch-site test of selection, to define specific spectral tuning sites that may be under positive selection.
MK Test for Selection
Differences in the amino acid sequences of proteins among species may be due to the accumulation of neutral mutations by drift, the fixation of adaptive mutations by positive selection, or a combination of the two. We therefore used the MK test (McDonald and Kreitman, 1991) to examine whether the amino acid differences between the L. archippus archippus and L. arthemis astyanax pigments had evolved by neutral evolution. Although some demographic scenarios may result in the MK test erroneously indicating adaptive evolution (Eyre-Walker, 2002), generally this test is free of demographic concerns, because neutral and selected sites interspersed throughout a gene share the same phylogeny and have the same effective population size (McDonald and Kreitman, 1991; Nielsen, 2005).
For the MK test, we genotyped 24 L. arthemis astyanax individuals for a region (1,056–1,069 bp) on both chromosomes and identified five alleles and 11 polymorphic sites, compared with the L. archippus archippus sequence (Table 10.1). We found that the ratio of nonsynonymous to
synonymous fixed differences between species (i.e., the number of substitutions that produce an amino acid change compared with the number of substitutions that do not) deviated strongly from the ratio of nonsynonymous to synonymous polymorphisms within species (Fisher’s exact test, two-tailed P = 0.006) (Table 10.2). The higher proportion of fixed nonsynonymous substitutions (12) compared with fixed synonymous substitutions (4) rejected the hypothesis of neutral evolution and suggested that most of the observed replacement substitutions are probably due to positive selection-driven fixation of advantageous mutations. The results of this analysis indicate that the L. archippus and L. arthemis astyanax L opsin genes have evolved under positive selection for divergent functions. This allowed us to focus on specific sites within the encoded protein that are under positive selection and involved in spectral tuning.
Character Mapping of L Opsin λmaxValues
Methodological advances have been made in recent years in detecting positive selection at particular amino acids or codon sites. These statistical approaches depend on ancestral state reconstructions of either amino acid or nucleotide sequences at different branching points (nodes) along a gene tree and are greatly strengthened by the availability of functional data mapped onto the tree, which permits the a priori selection of branches for investigation. These tests are particularly compelling if convergent phenotypes have evolved along one or more independent lineages of the tree (Zhang, 2006).
To test this possibility, we first reconstructed an opsin gene tree by using L opsin gene data from 12 nymphalid, one papilionid, and one pierid butterfly species for which λmax values are also available (SI Table 10.4), by using maximum-likelihood and Bayesian algorithms. Both methods recovered identical trees with good bootstrap support (>50%) in all except the basal node (Fig. 10.3). Our phylogeny is in general agreement with the most recent phylogeny of butterflies based on molecular and morphological data (Wahlberg et al., 2005).
A character map was constructed by mapping the λmax values onto the gene tree. Visual inspection of the distribution of λmax values on the phylogeny revealed two instances of spectral convergence of L pigment λmax values. Two pigment lineages, one leading from L. arthemis astyanax to other Limenitis species (Fig. 10.3, Nodes A to B) and the lineage ancestral to the Siproeta stelenes and Junonia coenia clade (Fig. 10.3, Nodes C to D), have evolved peak spectral sensitivities that are blue-shifted (i.e., shifted to shorter-wavelength light) compared with ancestral nodes.
TABLE 10.1 Allelic Variation in 597 bp of Coding Region of L Opsin Gene in 24 L. arthemis astyanax Individuals (48 Chromosomes) and One L. archippus archippus
|
Allele* |
N |
Polymorphic Sites |
||||||||
|
|
|
|
|
|
1 |
1 |
1 |
1 |
1 |
2 |
|
|
|
1 |
5 |
9 |
2 |
8 |
8 |
9 |
9 |
0 |
|
|
|
6 |
1 |
9 |
0 |
4 |
6 |
0 |
2 |
5 |
|
1 |
28 |
A |
C |
C |
T |
T |
C |
G |
G |
G |
|
2 |
4 |
— |
— |
— |
— |
G |
A |
T |
— |
— |
|
3 |
8 |
— |
— |
— |
— |
— |
— |
— |
— |
— |
|
4 |
5 |
— |
— |
T |
— |
— |
— |
— |
— |
— |
|
5 |
3 |
— |
— |
— |
— |
— |
— |
— |
— |
— |
|
L. archippus archippus |
2 |
G |
G |
— |
A |
G |
A |
T |
T |
A |
|
Amino acid replacements |
|
N |
I |
|
|
V |
V |
A |
|
V |
|
|
↓ |
↓ |
|
|
↓ |
↓ |
↓ |
|
↓ |
|
|
|
D |
M |
|
|
F |
F† |
S |
|
I |
|
|
Position |
|
|
|
|
|
|
|
|
|
|
|
|
|
|
1 |
|
|
6 |
6 |
6 |
|
6 |
|
|
|
6 |
7 |
|
|
2 |
2 |
4 |
|
9 |
|
A dash (—) indicates identity with the most common allele. Amino acid replacements are given in single-letter notation, and position refers to the numbering of amino acid residues in the alignment. *GenBank accession nos. EF156437–EF156441. †A substitution at nucleotide position 186 may lead to a replacement (V→L) but was never observed. |
||||||||||
TABLE 10.2 MK Test Results for the L Opsins
|
|
Synonymous |
Nonsynonymous |
P Value |
|
Polymorphic* |
9 |
2 |
|
|
Fixed divergent† |
4 |
12 |
0.0063‡ |
|
*Number of polymorphic sites among 24 individuals of L. arthemis astyanax genotyped for 597 bp of L opsin coding region. †Divergent with respect to L. archippus archippus. ‡Fisher’s exact test, two-tailed P value. |
|||
Parallel/Convergent Change Analysis
Using maximum-likelihood and maximum-parsimony ancestral state reconstructions of amino acid sequences, we next asked whether statistically significant parallel and/or convergent amino acid changes occurred along the two blue-shifted opsin lineages (i.e., along Nodes A to B and C to D) (Kreitman and Akashi, 1995; Zhang and Kumar, 1997). Whether a substitution is a parallel or convergent change depends on the reconstructed amino acid in the ancestral sequences. For example, a parallel change would occur if both ancestral sequences contained the same amino acid
|
2 |
2 |
2 |
2 |
2 |
2 |
3 |
3 |
3 |
4 |
4 |
4 |
5 |
5 |
5 |
5 |
5 |
5 |
|
0 |
1 |
4 |
6 |
8 |
9 |
4 |
6 |
8 |
0 |
1 |
3 |
0 |
2 |
5 |
8 |
8 |
9 |
|
9 |
6 |
5 |
5 |
5 |
1 |
5 |
6 |
4 |
9 |
5 |
8 |
9 |
9 |
4 |
2 |
8 |
2 |
|
A |
T |
C |
G |
T |
T |
A |
C |
C |
T |
T |
C |
C |
T |
T |
C |
C |
G |
|
— |
— |
— |
— |
C |
G |
T |
A |
T |
— |
— |
— |
— |
— |
— |
— |
— |
— |
|
— |
— |
— |
— |
— |
— |
— |
— |
— |
— |
— |
— |
— |
— |
— |
T |
— |
— |
|
— |
— |
— |
— |
— |
— |
— |
— |
— |
— |
— |
— |
— |
— |
— |
— |
— |
— |
|
— |
— |
— |
— |
— |
— |
— |
— |
— |
— |
— |
T |
— |
— |
— |
T |
— |
— |
|
G |
C |
G |
A |
C |
G |
T |
— |
— |
G |
G |
— |
T |
G |
C |
— |
T |
A |
|
N |
|
A |
A |
|
|
|
|
|
S |
S |
|
A |
F |
M |
|
|
V |
|
↓ |
|
↓ |
↓ |
|
|
|
|
|
↓ |
↓ |
|
↓ |
↓ |
↓ |
|
|
|
|
S |
|
G |
T |
|
|
|
|
|
A |
A |
|
V |
V |
T |
|
|
I |
|
|
|
|
|
|
|
|
|
|
1 |
1 |
|
1 |
1 |
1 |
|
|
1 |
|
7 |
|
8 |
8 |
|
|
|
|
|
3 |
3 |
|
6 |
7 |
8 |
|
|
9 |
|
0 |
|
2 |
9 |
|
|
|
|
|
7 |
9 |
|
9 |
6 |
4 |
|
|
7 |
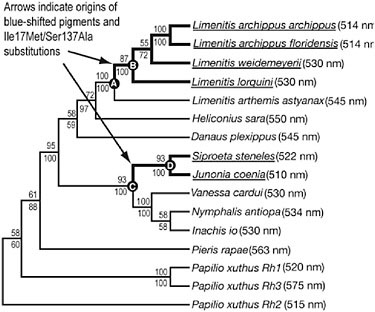
FIGURE 10.3 Character mapping of L photopigment λmax values onto an L opsin gene tree. Numbers shown above branch indicate maximum-likelihood bootstrap support values and numbers below branch show Bayesian clade credibility values. Thick black lines indicate nymphalid branches along which blue spectral shifts occurred that were investigated in the parallel/convergent change and branch-site tests of selection. Extant blue-shifted sequences are underlined. Nodes in which ancestral state reconstructions shown in Table 10.3 were performed are indicated by letters.
TABLE 10.3 Ancestral State Reconstructions Along Blue-Shifted Butterfly L Opsin Lineages Shown in the Opsin Gene Tree (Fig. 10.3)
|
Amino Acid Site |
545 nm Node A |
514–530 nm Node B |
Amino Acid Site |
530 nm Node C |
510–522 nm Node D |
|
6 |
N 0.998 |
D 1.000 |
16 |
V 0.704 |
F 0.541 |
|
17 |
I 0.998 |
M 1.000 |
17 |
I 0.997 |
M 1.000 |
|
64 |
A 0.996 |
S 1.000 |
18 |
G 0.945 |
A 0.747 |
|
70 |
N 0.998 |
S 1.000 |
131 |
L 0.994 |
F 0.981 |
|
137 |
S 1.000 |
A 1.000 |
137 |
S 1.000 |
A 1.000 |
|
|
|
|
258 |
A 0.640 |
S 0.717 |
|
Parallel amino acid changes are indicated in bold. Numbers above nodes indicate inferred λmax values. Numbers after amino acid residues indicate Bayes Empirical Bayes posterior probabilities. |
|||||
residue at a site, whereas a convergent change would occur if the ancestral sequences contained different amino acid residues at a site. Convergent changes are statistically less likely and stronger signatures of selection.
We observed two instances of parallel change associated with blue spectral shifts by using both reconstructions. At amino acid residue 17, an isoleucine-to-methionine substitution was observed, and at residue 137, a serine-to-alanine substitution was observed. The number of observed substitutions was significantly greater than expected by chance (P < 0.01) (Table 10.3). When the ancestral state reconstruction was expanded to include substitutions that occurred along the terminal branch connecting node D to the even more blue-shifted J. coenia opsin, two further parallel amino acid changes were observed associated with parallel blue spectral shifts: an alanine-to-serine substitution at amino acid residue 64 and an asparagine-to-serine substitution at amino acid residue 70.
Branch-Site Models of Selection
Although parallel/convergent change analysis depends on reconstruction of amino acid sequences, a much stronger positive selection inference can be made by using reconstruction of nucleotide sequences. One of the signatures of positive selection on a particular codon site is a much higher rate of substitution, causing amino acid replacements, dN, than the rate of silent substitutions, dS, leading to the ratio (ω) of dN/dS> 1 (Yang and Bielawski, 2000). Using branch-site models of selection, we tested whether specific amino acid sites along the two identified blue-shifted lineages are evolving in a manner consistent with positive selection. For the two
|
Amino Acid Site |
510–522 nm Node D |
510 nm J. coenia |
|
8 |
L 0.985 |
M |
|
20 |
L 0.998 |
I |
|
26 |
T 0.981 |
A |
|
40 |
T 0.882 |
S |
|
61 |
F 0.541 |
T |
|
64 |
A 0.522 |
S |
|
70 |
N 0.912 |
S |
|
93 |
F 0.997 |
C |
|
180 |
V 0.758 |
L |
blue-shifted lineages tested, the alternative model (specifically testing for positive selection) was a significantly better fit (2Δλ = 3.951, df = 1, P < 0.05) than the null model. The analysis indicated that seven sites were likely to be under positive selection (sites 6, 17, 18, 64, 70, 131, and 137). However, only three (17, 64, and 137; Fig. 10.4 and SI Fig. 10.5) had Bayes Empirical Bayes posterior probabilities >0.85, with two sites, 17 and 137, having posterior probabilities that were >0.95 (data not shown).
This result is provocative, because previous attempts to identify amino acid sites under positive selection in both butterfly and vertebrate photopigments by using similar methods have largely failed despite robust physiological data (i.e., absorbance spectra), suggesting functional divergence and the observation of parallel evolution (Briscoe, 2001; Yokoyama and Takenaka, 2005; but see Spady et al., 2005). Remarkably, four of the identified sites (17, 64, 70, and 137) were the same as those evolving in a manner consistent with positive selection in the parallel/convergent change analysis.
Homology Modeling Places L Opsin Sites Under Selection Close to the Chromophore
A homology model based on the L. arthemis astyanax sequence (Fig. 10.4) indicated that four of the sites under selection in the two blue-shifted lineages, sites 17, 64, 70, and 137, directly face the chromophore (Fig. 10.4). In particular, sites 17, 64, and 70 are situated close to the Schiff-base end of the chromophore. The amino acid sites Ile17Met, Ala64Ser, Asn70Ser, and Ser137Ala in the Limenitis sequences correspond to Met44, Phe91, Thr97, and Ala164 on bovine rhodopsin, respectively. Met44 is part of
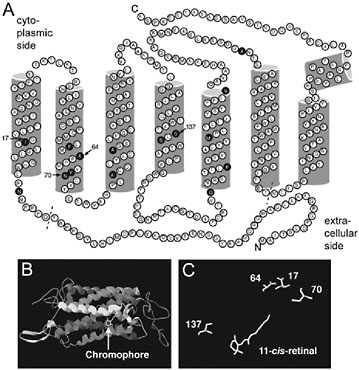
FIGURE 10.4 Topographical and homology models of L. arthemis astyanax L opsin. (A) Topographical opsin map showing amino acid differences (filled circles) between L. arthemis astyanax and L. archippus archippus opsins. The diagram is based on a model of bovine rhodopsin (Palczewski et al., 2000). Dashed line indicates boundaries of alignment used in phylogenetic analyses. The amino acid residues are numbered relative to their alignment position. Arrows, amino acid sites under positive selection. (B) Homology model of L. arthemis astyanax L opsin, with chromophore shown (arrow). (C) Candidate spectral tuning sites that directly face the chromophore (11-cis-retinal).
the region surrounding the Schiff base of the 11-cis-retinal chromophore (Palczewski et al., 2000; Okada et al., 2004), and a Met44Thr substitution in bovine rhodopsin causes a 3-nm blue shift (Andres et al., 2003). Phe91 produces a small spectral tuning effect when the equivalent site (Asp71) is mutagenized in squid retinochrome, which binds the retinal chromophore and functions as a retinal photoisomerase in squid photoreceptor cells (Terakita et al., 2000). Site 137 corresponds to Ala164 in bovine rhodopsin or Ser180/Ala180 in human L/M pigments. Intriguingly, in human cone pigments, the substitution Ser164Ala causes a 5- to 7-nm blue shift (Merbs and Nathans, 1993; Asenjo et al., 1994) and is one of the sites
polymorphic among the New World monkey alleles and under balancing selection. Therefore, the correspondence between sites implicated previously in blue spectral shifts in vertebrate opsins and those found in butterflies in this study strongly suggests that some of the same amino acid sites are involved in the evolution of L color vision in both primates and butterflies.
CONCLUSIONS
Expanded, or trichromatic, color vision in some primate lineages evolved through gene duplication and diversification of an ancestral polymorphic M/L pigment gene. Expanded color vision is advantageous over a more restricted color vision range in individuals foraging for ripe fruits and young leaves, especially under dim light (Caine and Mundy, 2000; Smith et al., 2003; Osorio et al., 2004). We have shown that, like the polymorphism observed in New World monkeys, the photopigment genes of Limenitis have evolved under positive selection. Remarkably, we have further shown that two closely related butterfly species, L. archippus and L. arthemis astyanax (which can hybridize in nature), show a commonly observed primate polymorphism. Like the primate cone pigments that contain this substitution, the butterfly photopigments are blue-shifted in sensitivity. This suggests that genetic mechanisms of spectral tuning may have evolved in parallel across 500 million years of evolution.
MATERIALS AND METHODS
Epimicrospectrophotometry
The technique was used as described (Bernard, 1983; Briscoe and Bernard, 2005). Briefly, the visual pigments of a butterfly ommatidium are contained within a rhabdom waveguide. Light propagates down the waveguide, being absorbed by rhodopsins as it goes. Light reaching the end of the rhabdom is reflected by the tapetum, a specialized tracheolar layer, back out of the eye as eyeshine. The reflectance spectrum of eyeshine was measured in dark-adapted live insects, with a series of dim monochromatic flashes set as a reference spectrum. Reflectance spectra were then measured after partial bleaching of the rhabdom of its L visual pigment after a series of photoisomerizing flashes. The rhodopsin photoproduct-free difference spectrum yields a two-way absorbance spectrum. An estimate of λmax is then obtained by least-squares fitting to template absorbance spectra (Palacios et al., 1996).
Sample Collecting
All Limenitis specimens were collected as adults in the field (L. archippus archippus, Goose Lake, Dane County, Wisconsin; L. archippus floridensis, Yankeetown, Florida, and Archbold Biological Station, Lake Placid, Florida; L. lorquini, Ash Canyon, Carson City County, Nevada; L. weidemeyerii, Willow Creek, Catron County, New Mexico, and Kelber Pass, Colorado; and L. arthemis axtyanax, Due West, South Carolina, n = 2; Madison, WI, n = 1; Amherst, MA, n = 1; and Lowndes County, Georgia, n = 1). The remaining 19 L. arthemis astyanax specimens used for the population sample were gifts from Austin Platt and were collected in Green Ridge State Forest, Maryland.
PCR, Cloning, and Sequencing
L. arthemis astyanax cDNA was synthesized from total RNA from one frozen head by using the Marathon cDNA Amplification Kit (BD Biosciences Clontech, Mountain View, CA). The full-length L opsin cDNA, including 3′ and 5′ UTRs, was obtained by amplification of 3′ RACE products by using a degenerate primer (5′-GAA CAR GCW AAR AAR ATGA-3) followed by amplification of 5′ RACE products by using a genespecific reverse primer (5′-CAG AGC CCC AAA TGG TCA CTA A-3′). The resulting products were cloned into the pGEM T-Easy Vector System II (Promega, Madison, WI) and sequenced at the University of California, Irvine, DNA core sequencing facilities.
Genomic DNA from the other Limenitis species was extracted from individual adult butterflies (one per species) by using phenol-chloroform. First, a highly conserved 300-bp part of the gene was amplified by the PCR by using degenerate primers 5′-GAA CAR GCW AAR AAR ATG A-3′ and 5′-CCR TAN ACR ATN GGR TTR TA-3′, which was cloned and sequenced as above. These sequences allowed the design of species-specific reverse primers that were used in combination with a degenerate forward primer (5′-CAY YTN ATH GAY CCN CAY TGG-3′) to amplify a 1,366- to 1,391-bp fragment. For the L. arthemis astyanax population sample, PCR products were then directly sequenced. Heterozygous individuals were identified by visual inspection. Haplotypes were confirmed by cloning into the pGEM T-easy vector as described above.
For the MK test (McDonald and Kreitman, 1991), introns were manually removed from the 1,056- to 1,069-bp region of the 24 L. arthemis astyanax and one L. archippus archippus individuals genotyped, leaving 597 bp of coding region that was aligned. The number of sites within the L. arthemis astyanax population sample that was polymorphic for synonymous and nonsynonymous substitutions was counted and com-
pared with the number of sites that was fixed between species for synonymous and nonsynonymous substitutions by using a Fisher’s exact test.
Phylogenetic Reconstruction
Sequences for Limenitis species were added to other L opsin sequences obtained from GenBank for which physiological data were also available. The resulting alignment was edited to retain only coding sequence, 263 aa in length, spanning transmembrane domains I–VI (Fig. 10.4). Phylogenetic relationships were reconstructed from nucleotide data by using maximum-likelihood and Bayesian methods, with the moth Manduca sexta L opsin sequence as an outgroup by using all three nucleotide positions. The optimal DNA substitution model for the maximum-likelihood phylogenetic analysis was determined by using a hierarchical likelihood ratio test in Modeltest (Posada and Crandall, 1998). A maximum-likelihood analysis was conducted in PHYML with TrN93 + I + G (invariant sites and gamma-distributed rates for sites) substitution model, and the reliability of the tree obtained was tested by bootstrapping with 500 replicates. Bayesian phylogenetic analyses were performed by using MrBayes 3.1 (Ronquist and Huelsenbeck, 2003). Because MrBayes 3.1 does not implement the TrN93 DNA substitution model, we used the next-less-complex (HKY85+I+G) and the next-more-complex (GTR+I+G) models in two separate analyses. Both models were run for 106 generations, with a sampling frequency of 102, using three heated and one cold chain and with a burnin of 2.5 × 10³ trees.
Parallel Change Analysis and Branch-Site Tests of Selection
The Bayesian and maximum-likelihood tree topology obtained was used to perform all selection tests. For the parallel change analysis, amino acid substitutions along each lineage in the opsin gene tree were reconstructed by using maximum parsimony in MacClade (Maddison and Maddison, 2005) and maximum likelihood in PAML (Yang, 1997). Parallel amino acid changes were detected along butterfly lineages that also displayed parallel phenotypic evolution in the L visual pigment λmax value. The statistical significance of these amino acid changes was tested by using the method (Zhang and Kumar, 1997) implemented in the program Converge.
For the branch-site test of selection, we used branch-site models (Yang and Nielsen, 2002; Zhang et al., 2005) that allow the dN/dS ratio (ω) to vary both among sites and among lineages because these models may be more likely to detect positive selection affecting only a few sites. Specifically, we used test 2 of Zhang et al. (2005) to construct a likelihood ratio test
with Model A and Model A1 (null model). Both models require a priori specification of the lineages likely to have experienced positive selection. Visual inspection of Fig. 10.3 allowed us to test two blue-shifted lineages that may have experienced positive selection. Sites that may be under positive selection in the spectrally shifted lineages were identified with a Bayes Empirical Bayes approach (Yang et al., 2005).
Homology Modeling
We used homology modeling to study the relationship between the L. arthemis astyanax opsin structure and function using the methods described (Briscoe, 2002). The full-length L. arthemis astyanax L opsin protein sequence was manually aligned with the bovine template 1U19.pdb (Okada et al., 2004), and the alignment was submitted to the Swiss-Model server (www.expasy.ch/swissmod) (Schwede et al., 2003). The atomic coordinates were then viewed with SwissPdb Viewer (www.expasy.ch/spdbv) (Guex and Peitsch, 1997), and candidate spectral tuning sites were mapped onto the 3D homology model.
ACKNOWLEDGMENTS
We thank A. P. Platt (University of Maryland, Baltimore County, Baltimore, MD), A. Porter (University of Massachusetts, Amherst, MA), and C. L. Remington (Yale University, New Haven, CT) for providing specimens; C. Wang and W. Huynh for technical assistance; and A. Kelber, D. Osorio, N. Pohl, M. Brandt, N. Aguilar-Roca, and K. Thornton for useful comments on earlier versions of this manuscript. We especially thank S. M. Reppert for insightful discussions. This work was supported by National Science Foundation Grant IOB-0346765 (to A.D.B.)


