
12
An Experimental Test of Evolutionary Trade-Offs During Temperature Adaptation
ALBERT F. BENNETT*‡ and RICHARD E. LENSKI† ‡
We used experimental evolution to test directly the important and commonplace evolutionary hypothesis that adaptation, increased fitness within the selective environment, is accompanied by tradeoff, a loss of fitness in other nonselective environments. Specifically, we determined whether trade-offs at high temperature generally and necessarily accompany genetic adaptation to low temperature. We measured the relative fitness increment of 24 lineages of the bacterium Escherichia coli evolved for 2,000 generations at 20°C and the relative fitness decrement of these lines at 40°C. Trade-offs at the higher temperature were examined for their generality, universality, quantitative relationship, and historical contingency. Considering all 24 lines as a group, a significant decline in fitness was found at 40°C (mean decline = 9.4%), indicating the generality of the trade-off effect. However, in a lineage-by-lineage analysis, only 15 of 24 showed a significant trade-off, and one lineage increased fitness at high temperature. Thus, although general, trade-offs were not universal. Furthermore, there was no quantitative association between the magnitude of adaptive fitness increment at 20°C and fitness decline at
40°C, and no effect of lineages’ historical thermal environment on either their improvement at 20°C or the extent of their trade-off at high temperature. We do not yet know the underlying mechanisms responsible for the trade-off, but they are sufficiently prevalent to drive a general effect. However, approximately one-third of the experimental lineages achieved low-temperature adaptation without detectable high-temperature trade-offs; therefore, it cannot be necessary that every change conferring benefit in cold environments has a negative effect on function in warmer environments.
Evolutionary adaptation to a new environment necessarily involves the enhancement of certain traits, leading to improved function and an increase in fitness. However, adaptation may be accompanied by deterioration in other traits, which are presumably of less or no importance in the new environment. This decline in some characters during adaptation is termed a trade-off and is often viewed as a cost or constraint associated with adaptation (e.g., Futuyma and Moreno, 1988; Stearns, 1992; Futuyma, 1998; Sibly, 2002; Novak et al., 2006).
The assumption of cost associated with gain has been a fundamental premise of biological and evolutionary thought for centuries. For example, Darwin (1859b, pp. 147–148) states that “… natural selection is continually trying to economise in every part of the organisation. If under changed conditions of life a structure before useful becomes less useful, any diminution, however slight, in its development, will be seized on by natural selection, for it will profit the individual not to have its nutriment wasted in building up an useless structure.” The assumption of trade-offs continues to be an important component of thinking about adaptive evolution: “… improvements cannot occur indefinitely, because eventually organisms come up against limitations…. At that point, improvements in one trait may be achievable only at the expense of others—there is a trade-off between the traits” (Sibly, 2002). This way of thinking has embedded itself into the models and mindsets we use to study life history and morphological and physiological evolution. For instance, in regard to environmental adaptation, Levins’ (1968) principle of allocation explicitly incorporates fitness trade-offs and consequent niche shifts. Adaptation to cold environments, for instance, is predicted to entail the loss of performance in warm environments. Subsequent models in evolutionary physiology about thermal niche structure and biological responses to climate change have usually assumed trade-offs (e.g., Lynch and Gabriel, 1987; Pease et al., 1989; but see Gilchrist, 1995).
Although evolutionary trade-offs are widely assumed, demonstrating their existence can be difficult. Several approaches have been used,
including comparative studies on different taxa, phenotypic manipulation, analysis of genetic correlations, and selection experiments, but most of these have interpretive limitations (Reznick, 1985; Futuyma and Moreno, 1988; Futuyma, 1998). Comparative studies, for instance, are essentially correlational, without access to knowledge about the ancestral condition or the evolutionary sequence of gains and losses of functions. Selection experiments, in which selection is imposed on one trait and correlated change is measured in another, are generally considered by evolutionary biologists to be the most powerful approach for demonstrating the existence of trade-offs (Futuyma, 1998; Sibly, 2002).
In this study, we use 24 experimentally evolved lineages of the bacterium Escherichia coli to analyze whether adaptation to low temperature (20°C) is accompanied by a loss of fitness at high temperature (40°C). We analyze these trade-offs from four perspectives:
-
Generality; is there a significant loss of fitness at high temperature across all lineages considered together?
-
Universality; do all of the lineages individually demonstrate a loss of fitness at high temperature?
-
Quantitative relationship; does the magnitude of adaptation influence the magnitude of trade-off? That is, do the cold-adapted lineages with the highest fitness at low temperature also have the lowest fitness at high temperature?
-
Historical contingency; does the prior thermal selective history of a lineage influence either the extent of its adaptation to low temperature or the magnitude of trade-off in fitness at high temperature?
RESULTS
Adaptation to 20°C
Table 12.1 provides the measured fitness values at 20°C of each of the 20°C evolved lineages and its immediate historical progenitor, both obtained relative to their common ancestor. The resulting changes in fitness (ΔW) at 20°C are shown in Table 12.2. The temperature that each derived line had experienced before its evolution at 20°C had no significant effect on the extent of adaptation to 20°C (F3,20 ± 0.497, P = 0.69). Given this absence of a historical effect and the absence of any other phylogenetic relationships among these lineages [star phylogeny from the common ancestral clone (Anc; Fig. 12.1)], we analyzed the significance of adaptation in all 24 lineages both individually and collectively. Mean ΔW for all 24 lines was 0.118 (±0.025 95% confidence limit, P < 0.0001), and ΔW was significantly positive (P ± 0.05 in Table 12.2) in 22 of the 24 lines.
TABLE 12.1 Fitness at 20°C of the 20°C-Selected Lineages and Their Historical Progenitors, Each Measured Relative to the Common Ancestor
|
|
−1 |
−2 |
−3 |
|
32 |
1.026 ± 0.050 |
1.081 ± 0.026 |
1.022 ± 0.019 |
|
32/20 |
1.124 ± 0.065 |
1.266 ± 0.076 |
1.121 ± 0.024 |
|
37 |
0.979 ± 0.045 |
0.997 ± 0.034 |
0.897 ± 0.042 |
|
37/20 |
1.072 ± 0.053 |
1.124 ± 0.080 |
1.050 ± 0.045 |
|
42 |
0.947 ± 0.061 |
1.005 ± 0.039 |
0.992 ± 0.059 |
|
42/20 |
1.019 ± 0.041 |
1.089 ± 0.089 |
1.128 ± 0.057 |
|
32–42 |
1.018 ± 0.035 |
1.085 ± 0.014 |
1.001 ± 0.035 |
|
32–42/20 |
1.143 ± 0.052 |
1.113 ± 0.039 |
1.191 ± 0.042 |
|
Rows are historical selective temperature regimes; columns are lineage designations (see Fig. 12.1). Entries are mean values ± 95% confidence limits, with n = 6 replicate fitness assays for each entry. |
|||
TABLE 12.2 Change in Fitness (ΔW) at 20°C of 20°C-Selected Lines Compared with Their Historical Progenitors
|
|
−1 |
−2 |
−3 |
|
32/20 vs. 32 |
0.098 |
0.185 |
0.099 |
|
|
P = 0.006 |
P < 0.001 |
P < 0.001 |
|
37/20 vs. 37 |
0.093 |
0.128 |
0.154 |
|
|
P = 0.003 |
P = 0.002 |
P < 0.001 |
|
42/20 vs. 42 |
0.073 |
0.084 |
0.136 |
|
|
P = 0.015 |
P = 0.025 |
P = 0.001 |
|
32-42/20 vs. 32-42 |
0.125 |
0.028 |
0.190 |
|
|
P < 0.001 |
P = 0.056 |
P < 0.001 |
|
Cell entries are changes in mean fitness from Table 12.1 and P values of one-tailed t tests. |
|||
Therefore, there was a general adaptation to selective temperature in this experiment, and this adaptation was also significantly manifest in >90% of the individual lineages. The mean fitness increment is not significantly different (P = 0.14) from that of six replicate lines selected at 20°C directly from Anc (Mongold et al., 1996).
Trade-Off at 40°C
Table 12.3 gives the relative fitness, measured at 40°C, of each lineage that evolved at 20°C and its immediate progenitor. The resulting change in fitness at 40°C (ΔW) is reported in Table 12.4. Changes in fitness (ΔW) were not significantly affected by historical environment (F3,20 = 0.282, P = 0.84).
|
+1 |
+2 |
+3 |
Mean |
|
1.066 ± 0.022 |
0.998 ± 0.058 |
1.030 ± 0.129 |
1.037 ± 0.032 |
|
1.173 ± 0.062 |
1.109 ± 0.054 |
1.234 ± 0.078 |
1.153 ± 0.057 |
|
1.004 ± 0.037 |
0.987 ± 0.044 |
0.994 ± 0.022 |
0.976 ± 0.042 |
|
1.126 ± 0.071 |
1.111 ± 0.041 |
1.105 ± 0.061 |
1.098 ± 0.032 |
|
0.986 ± 0.059 |
0.977 ± 0.045 |
1.033 ± 0.038 |
0.990 ± 0.030 |
|
1.053 ± 0.047 |
1.268 ± 0.092 |
1.119 ± 0.051 |
1.113 ± 0.051 |
|
0.967 ± 0.063 |
1.015 ± 0.027 |
0.998 ± 0.036 |
1.014 ± 0.041 |
|
1.068 ± 0.047 |
1.131 ± 0.046 |
0.994 ± 0.135 |
1.116 ± 0.054 |
|
+1 |
+2 |
+3 |
|
0.107 |
0.110 |
0.204 |
|
P < 0.001 |
P = 0.003 |
P = 0.003 |
|
0.122 |
0.124 |
0.111 |
|
P = 0.001 |
P < 0.001 |
P < 0.001 |
|
0.067 |
0.291 |
0.086 |
|
P = 0.022 |
P < 0.001 |
P = 0.003 |
|
0.100 |
0.117 |
−0.00 |
|
P = 0.004 |
P < 0.001 |
P = 0.466 |
The mean ΔW for all 24 lines was −0.094(±0.047 95% confidence limit, P < 0.0001). In general, therefore, there was a significant loss of fitness at high temperature, demonstrating a trade-off associated with adaptation to lower temperature. This mean fitness decrement at 40°C is not significantly different (P = 0.16) from that of six replicate lines selected at 20°C directly from Anc (Mongold et al., 1996). However, there is considerable heterogeneity in the response among the individual lineages in their performance at this high temperature. Using P ≤ 0.05 as the criterion for testing the trade-off, 15 lines had a significant decrement in fitness at 40°. Eight lines did not significantly decrease in fitness, and one (42/20 + 3) actually experienced a significant increase in fitness at 40°C (ΔW = 0.122) while it evolved at and adapted to 20°C (ΔW = 0.086). To verify the fitness

FIGURE 12.1 Phylogeny and nomenclature of the experimental lineages of E. coli used in this study. The ancestral organism (Anc) was obtained from a lineage that evolved under defined laboratory conditions at 37°C for 2,000 generations. A clone was sampled and cultured in six replicate populations that evolved in each of four thermal environments: 32°C, 37°C, or 42°C, or a daily alteration between 32°C and 42°C. After 2,000 generations, a clone was isolated from each lineage and propagated for another 2,000 generations at 20°C. Note that each of the 20°C selected lineages are equally related to Anc (separated by 4,000 generations) and are equally distant from each other (separated by 8,000 generations).
increment of 42/20 + 3 at 40°C, which went against our a priori expectation, the 40°C measurements were repeated with 12-fold replication for three lines, one that demonstrated a trade-off (42/20 − 1), one that did not significantly change fitness (42/20 + 2), and the single line that incremented fitness at high temperature (42/20 + 3). The previous results were repeated for each line: 42/20 −1 had a negative ΔW (P < 0.001), 42/20 + 2 had no significant change in fitness (P + 0.06), and 42/20 + 3 had a significantly positive ΔW (P = 0.04). Of the six lines selected at 20°C directly from Anc
(Mongold et al., 1996), four had significant decrements in fitness at 40°C, whereas two showed no significant trade-off (unpublished data).
Previous studies have noted that correlated responses are often more variable than direct responses to selection (Travisano and Lenski, 1996), and the heterogeneity in directional responses measured for fitness changes at 40°C is consistent with that pattern. To examine this issue further, we calculated the among-lineage variance components for fitness increments measured at 20°C and at 40°C and their associated confidence limits (Sokal and Rohlf, 1981). The among-lineage variance component is 0.0025 at 20°C and 0.0108 at 40°C, with 95% confidence intervals of 0.0010 to 0.0059 and 0.0057 to 0.0230, respectively. Neither of the corresponding 95% confidence intervals overlaps the point estimate at the other temperature. Hence, this difference in genetic variability among lines is significant and in the direction that supports the hypothesis of greater heterogeneity in the correlated responses than in the direct responses to selection.
The quantitative relationship between fitness gain at 20°C and fitness loss at 40°C is shown in Fig. 12.2. Although 20 of the 24 lineages fall within the trade-off quadrant (i.e., lower right section) of Fig. 12.2, there is no significant quantitative relationship between the magnitude of the selected gain and correlated loss (r = 0.006, P > 0.50).
DISCUSSION
Generality and Universality
The results of our study illustrate some of the complexities of analyzing and interpreting evolutionary patterns, even those that come from a carefully designed and replicated experiment. The general hypothesis that trade-offs occur as a result of evolutionary adaptation is certainly supported by these experimental results. Associated with the pervasive adaptation of the evolved bacteria to low temperature was a significant loss of fitness at high temperature. In the analysis of all 24 lineages together, mean ΔW at 40°C significantly declined (P < 0.0001). This trade-off is the general pattern observed and was also the general prediction that motivated this study.
However, the trade-offs were far from universal among the 24 experimental lineages. In a line-by-line analysis, only 15 followed the general pattern, and about this same proportion was also observed in six additional lineages derived from Anc adapting directly to 20°C (Mongold et al., 1996). Nine of the 24 lineages analyzed here did not significantly decline in fitness at 40°C, even with the relatively low stringency criterion of P ≤ 0.05; applying a Bonferroni correction for multiple comparisons would result in an additional five nonsignificant decrements. Although
TABLE 12.3 Fitness at 40°C of 20°C-Selected Lineages and Their Historical Progenitors, Each Measured Relative to the Common Ancestor
|
|
−1 |
−2 |
−3 |
|
32 |
0.963 ± 0.021 |
1.028 ± 0.064 |
0.980 ± 0.029 |
|
32/20 |
0.849 ± 0.063 |
0.549 ± 0.178 |
0.900 ± 0.047 |
|
37 |
1.102 ± 0.029 |
0.616 ± 0.071 |
0.993 ± 0.031 |
|
37/20 |
0.881 ± 0.067 |
0.608 ± 0.145 |
0.889 ± 0.021 |
|
42 |
1.153 ± 0.050 |
1.089 ± 0.059 |
1.117 ± 0.041 |
|
42/20 |
0.984 ± 0.054 |
0.934 ± 0.061 |
0.974 ± 0.033 |
|
32–42 |
1.056 ± 0.040 |
1.079 ± 0.058 |
1.064 ± 0.067 |
|
32–42/20 |
0.916 ± 0.100 |
0.963 ± 0.044 |
1.010 ± 0.057 |
|
Contents and notations are as in Table 12.1. |
|||
TABLE 12.4 Change in Fitness (ΔW) at 40°C of 20°C-Selected Lines Compared with Their Historical Progenitors
|
|
−1 |
−2 |
−3 |
|
32/20 vs. 32 |
−0.114 |
−0.478 |
−0.080 |
|
|
P < 0.001 |
P < 0.001 |
P = 0.003 |
|
37/20 vs. 37 |
−0.220 |
−0.007 |
−0.104 |
|
|
P < 0.001 |
P = 0.454 |
P < 0.001 |
|
42/20 vs. 42 |
−0.169 |
−0.156 |
−0.144 |
|
|
P < 0.001 |
P < 0.001 |
P < 0.001 |
|
32-42/20 vs. 32-42 |
−0.140 |
−0.116 |
−0.053 |
|
|
P = 0.004 |
P = 0.001 |
P = 0.088 |
|
Contents and designations are as in Table 12.2. |
|||
one might be tempted to “explain away” these nonsignificant results as false negatives that reflect limited statistical power, that explanation was rejected, as follows. For 3 of the 24 lines, their correlated fitness changes at 40°C were positive rather than negative and, in one case, the correlated improvement was significant. To avoid the possibility of a false positive in the unexpected direction, additional fitness assays were performed (with twice the original level of replication) for that exceptional line, as well as for two others that showed significant and nonsignificant trade-offs. The very same patterns emerged in these new and independent assays for all three strains, including confirmation of the unexpected gain in fitness at 40°C in the line of interest. Hence, contrary to the general pattern and prediction, one line significantly increased in fitness at high temperature while adapting to low temperature.
|
+1 |
+2 |
+3 |
Mean |
|
0.488 ± 0.066 |
1.064 ± 0.037 |
0.982 ± 0.049 |
0.917 ± 0.224 |
|
0.527 ± 0.145 |
1.046 ± 0.043 |
0.919 ± 0.051 |
0.798 ± 0.222 |
|
1.008 ± 0.056 |
0.919 ± 0.065 |
1.047 ± 0.041 |
0.947 ± 0.182 |
|
0.941 ± 0.039 |
0.947 ± 0.037 |
0.952 ± 0.026 |
0.870 ± 0.138 |
|
1.113 ± 0.040 |
1.136 ± 0.044 |
1.082 ± 0.073 |
1.115 ± 0.028 |
|
1.077 ± 0.067 |
1.114 ± 0.052 |
1.204 ± 0.109 |
1.048 ± 0.107 |
|
1.104 ± 0.039 |
1.079 ± 0.059 |
1.114 ± 0.067 |
1.083 ± 0.024 |
|
1.003 ± 0.237 |
0.984 ± 0.077 |
0.942 ± 0.083 |
0.970 ± 0.038 |
|
+1 |
+2 |
+3 |
|
0.039 |
−0.018 |
−0.063 |
|
P = 0.271 |
P = 0.214 |
P = 0.023 |
|
−0.068 |
0.028 |
−0.094 |
|
P = 0.014 |
P = 0.182 |
P < 0.001 |
|
−0.036 |
−0.021 |
0.122 |
|
P = 0.133 |
P = 0.221 |
P = 0.019 |
|
−0.101 |
−0.095 |
−0.172 |
|
P = 0.152 |
P = 0.016 |
P = 0.001 |
Therefore, although the trade-off pattern is general, it cannot be universal. Which is more important in considering and discussing evolutionary trade-offs? Is the glass two-thirds full, one-third empty, or partly inverted? The prediction must be that trade-offs will generally occur, but they may fail to happen in some or even many individual instances, and correlated responses may sometimes even be opposite in sign to those expected under the trade-off hypothesis.
Quantitative Relationship Between Direct and Correlated Responses
The previous section dealt with the qualitative aspects of the trade-off hypothesis, as indicated by the sign of the correlated response. Levins’ (1968) principle of allocation also predicts a quantitative association between the magnitude of adaptation to one environment and its trade-off
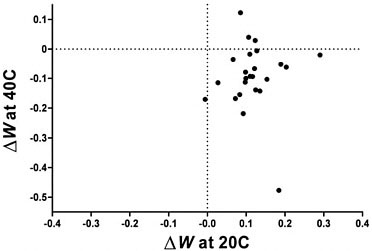
FIGURE 12.2 Correlation between change in fitness measured at 20°C and at 40°C after experimental evolution at 20°C. Although 20 of 24 points lie in the quadrant associated with an evolutionary trade-off (fitness gain at 20°C and loss at 40°C), the correlation between them is not significant (r = 0.006, n = 24, P > 0.50).
in another. Commonsensical notions of trade-off would also seem to make a similar prediction: the greater the magnitude of fitness gain at lower temperature, the greater the anticipated loss of fitness at high temperature. However, no such correlation was observed; trade-offs, when they occur, appear random with respect to the degree of adaptation to 20°C (Fig. 12.2). For example, line 42/20 + 2 had the highest fitness gain at 20°C, but it did not have even a statistically significant trade-off at high temperature. One factor contributing to the absence of any compelling quantitative relationship is the divergence in the direction of the correlated fitness response measured at 40°C, as discussed in the previous section. Another factor is that the genetic variation among the lines is much lower for the direct fitness response at 20°C than for the correlated response measured at 40°C, making it more difficult to detect the underlying quantitative relationship, if any.
Historical Contingency
The 24 lineages that evolved at 20°C for 2,000 generations had previously evolved in the same medium under one of four different thermal regimes: constant 32°C, 37°C, or 42°C or a daily alteration between 32°C and 42°C (Bennett et al., 1992). Hence, we could test whether this prior selective history influenced their subsequent evolution at 20°C. However,
there is no evidence of an effect of historical thermal environment on the extent of their adaptation to low temperature or on the fitness tradeoff observed at high temperature. Lineages previously adapted to 32°C, for example, adapted no more or less to 20°C than did lineages previously adapted to 42°C. This negative result was previously reported for these lineages on the basis of fewer replicate assays of fitness measures (Mongold et al., 1996). The genetic adjustments made during adaptation to their historical thermal environments evidently neither helped nor hindered subsequent adaptation to 20°C. Likewise in regard to trade-offs, prior adaptation to diverse temperatures did not differentially predispose or prevent trade-offs.
Investigating the Nature of Trade-Offs
The basis of some trade-offs is readily apparent as a result of differential allocation of time, space, or energy, as described earlier in the quote from Darwin (1859b). The cause of other trade-offs may be less obvious and can involve antagonistic pleiotropy, mutation accumulation, or both, in genes encoding functions under relaxed selection (Cooper and Lenski, 2000; Cooper et al., 2001a). Within this experimental series, there are several lineages that have achieved low-temperature adaptation without high-temperature trade-offs. Therefore, it cannot be the case that every mutational change conferring benefit in cold necessarily has a negative effect on performance in heat. For the majority of the lineages that do demonstrate trade-offs, two different population-genetic mechanisms might be responsible for the decline of fitness at high temperature, antagonistic pleiotropy, or mutation accumulation (Rose and Charlesworth, 1980; Rose, 1991; Holt, 1996; Cooper and Lenski, 2000). Investigation of the genetic bases underlying low-temperature adaptation in these lineages is now in progress, and the implications of the genetic mechanisms for performance at high temperature are therefore presently unknown. In the future, however, it may be feasible to identify and revert modified alleles to their ancestral states and then directly measure their quantitative impact on both adaptation and trade-off. Under antagonistic pleiotropy, such reversion should simultaneously decrease fitness at low temperature and increase it at high temperature. Under mutation accumulation, by contrast, reversion should repair function at high temperature without a simultaneous decrement in low-temperature function. The diversity of quantitative associations between adaptation and trade-off (including the complete absence of the latter) could result from either mechanism or some combination of both. Previous studies on trade-offs in thermal and catabolic performance using the progenitor experiment to this evolution experiment have favored antagonistic pleiotropy over mutation accumu-
lation (Cooper and Lenski, 2000; Cooper et al., 2001a,b, 2003). Whatever mechanisms are operating in our system, they result in a general, but not universal, trade-off effect.
The Utility of an Experimental Approach to Evolution
We believe that our study again demonstrates the power of an experimental approach to test and inform evolutionary theory (Bennett and Lenski, 1999). It forces the restatement of a qualitative assumption into a quantitative hypothesis and then allows rigorous testing of that hypothesis. Experiments can provide a sufficient number of replicated lineages, measurements, and controls so the hypothesis in question can be statistically evaluated. The evolving lineages can also generate enough biological novelty so the diversity of adaptations to a common environment and their underlying physiological and genetic bases can be studied further (Bennett, 2003).
METHODS
Study Organisms
The 24 lineages of E. coli used in this study were originally derived by Mongold et al. (1996). All of these lines evolved from a single ancestral strain (here designated Anc), which itself was obtained from a lineage that had evolved on minimal glucose medium in serial dilution culture for 2,000 generations at 37°C (Lenski et al., 1991). The 24 lines founded by Anc were maintained in the same medium and serial transfer regime for another 2,000 generations with six replicate populations propagated in each of the following thermal conditions: constant 32°C, 37°C, or 42°C or a daily alteration between 32°C and 42°C (Bennett et al., 1992). Clonal isolates of these 24 lines, each derived from a single colony, were then cultured for another 2,000 generations at 20°C (Mongold et al., 1996). That temperature corresponds to the lower boundary of the thermal niche of Anc, where the boundary was defined operationally by its ability to sustain itself at a stable population density in the face of a 100-fold daily dilution (Bennett and Lenski, 1993). The phylogeny and nomenclature of these lineages are shown in Fig. 12.1. Each of the 20°C adapted lines is independent of each other; they have not shared a common ancestor for 4,000 generations and are therefore phylogenetically separated from each other by 8,000 generations. Clonal isolates of all lines, including Anc and the intermediate lineages adapted to diverse temperatures, are stored frozen at −80°Cand were used in these analyses. The 20°C adapted lines have diverse evolutionary thermal histories, and therefore the effect of
historical adaptive environment on rate and extent of adaptation to low temperature can be undertaken as well (Travisano et al., 1995; Mongold et al., 1996).
Experimental Measurements
The performance metrics used here are the fitnesses of a derived line relative to the common ancestor, measured at both the low selected temperature of 20°C and a high temperature (40°C); 40°C was conservatively used as the high temperature instead of the upper thermal niche boundary of Anc of 42°C (Bennett and Lenski, 1993), because four of six 20°C-adapted lines were incapable of growth at 42°C, but all six were able to grow and maintain themselves in serial dilution culture at 40°C (figure 3 in Mongold et al., 1996). The rationale and methodology for measuring relative fitness (W) are given in Lenski (1991). Here it is calculated and expressed as the ratio of the number of doublings of a derived line relative to that of its ancestor when the two are grown together and compete for the same pool of nutrients.
Details for the measurement of W in this system have been reported (Lenski et al., 1991; Bennett et al., 1992). Briefly, both an evolutionary derived line and the ancestor are taken from storage at −80°C, separately inoculated into flasks containing rich LB medium, and incubated at 37°C for 1 day. These cultures are then diluted into minimal glucose medium [Dulbecco’s medium (DM) supplemented with 25 μg of glucose per milliliter] and incubated at 37°C for another day. They are then diluted again into fresh DM and incubated at the experimental test temperature (20°C or 40°C in this study). Flasks were incubated in New Brunswick incubator shakers (New Brunswick Scientific, Edison, NJ) at 20°C and 37°C and at 40°C in a New Brunswick water bath shaker. These preliminary incubations ensure that the bacteria are growing and are phenotypically acclimated to the medium and the experimental temperature. On the next day, both the derived line and the ancestor are diluted together into a common flask; a small sample is immediately plated onto agar for enumeration, and the flask is incubated at the experimental test temperature for 1 day, during which time the bacteria experience a lag phase, exponential growth, depletion of the nutrients, and stationary phase. After 24 h, a sample from the mixed culture is then plated again, colonies of each competitor are counted, and the ratio of the number of doublings of the derived and ancestral types is calculated from the change in densities of the two types relative to the initial sample taken immediately after mixing. The ancestor used in this experiment exists in two genetically marked forms, one capable of using the sugar arabinose and the other not. These two forms differ in their colony color on tetrazolium–arabinose indicator agar, but the marker itself is neutral in
the minimal glucose medium used for the competition assays (Lenski et al., 1991). Competitions are always performed between reciprocally marked ancestral and derived lines, such that the colony color serves only as a marker to distinguish evolutionary derivation. In these experiments, each determination of W was done with six replicate measurements, and the mean and 95% confidence limits are reported.
Analyses
Change in fitness (ΔW) is measured by comparing W of a 20°C line relative to Anc with that of its immediate historical progenitor, also assessed relative to Anc. (Direct competitions are not possible because both competitors share the same genetic marker state.) For example, the extent of adaptation of the 32/20 − 1 line to 20°C is determined by W of 32/20 − 1 at 20°C minus W of 32 − 1 at 20°C. Values of ΔW significantly >0 in the selective environment (20°C) indicate evolutionary adaptation, whereas values significantly <0 in the nonselective environment (40°C) indicate a trade-off.
Adaptation by each derived line to 20°C was analyzed by a one-tailed t test on the six replicate measurements of ΔW at 20°C. Mean ΔW of each of the 24 derived lines at 20°C was used to determine the generality of the adaptive response (one-tailed t test on 24 lines). Trade-off by each derived line at 40°C was analyzed with a one-tailed t test on the six experimental replicate measurements of ΔW at 40°C, except as noted, when we explored, independently tested, and confirmed the finding that one lineage in fact showed a correlated improvement at this temperature. Mean ΔW of each of the 24 derived lines at 40°C was used to determine the generality of the trade-off response (one-tailed t test on 24 lines). The quantitative nature of the trade-off was analyzed by determining the correlation coefficient between ΔW at 20°C and ΔW at 40°C for each of the 24 lineages. The effects of historical thermal environment on adaptation to 20°C and trade-off at 40°C were analyzed with one-way ANOVAs on historical temperature (32°C, 37°C, 42°C, or 32–42°C).
ACKNOWLEDGMENTS
We thank Pamela McDonald for assistance with these experiments and Catherine Loudon for statistical assistance. We appreciate the comments of two anonymous reviewers, which greatly improved the manuscript. This research was supported by the National Aeronautics and Space Administration (NASA) Astrobiology Institute (NASA Grant 632731, “Center for Genomic and Evolutionary Studies on Microbial Life at Low Temperatures”).


