
1
Introduction
1.1
SCOPE
We live in an age of technological abundance. Computers, the Internet, satellites, and many other tools provide us with unprecedented ability to collect, store, analyze, and distribute information on all aspects of the planet we inhabit, the communities in which we live, and the daily activities that we perform. We have access to high-resolution images of our neighborhoods; we can obtain driving directions through cell phones; we can track the movement of pets, people on probation, and vehicles with Global Positioning System (GPS) tracking devices; and we can plan new developments using geographic information systems (GIS). In all of these examples the data and tools exploit our ability to know where events, activities, individuals, streets, or buildings are to be found on the Earth’s surface. In other words, they include information that might be presented in the form of a map. Today, we term such data and tools geospatial to distinguish them from other types of data and tools, and they are essential in virtually all aspects of human activity, from the operations of government agencies and private corporations to the daily lives of the general public. They are encountered in the form of paper maps, in-car navigation systems, Internet sites, the software and databases of local government and utility companies, the sophisticated analytical, mapping, and visualization tools that support decision making in many private- and publicsector organizations, and many other forms. Because of their usefulness for so many diverse applications—from zoning and taxation, to environmental management, to the national census, and of course, emergency
response—communities at all levels have made massive investments in acquiring geospatial information, converting it to digital form, and maintaining computer-based systems for accessing and using it. Often, multiple applications need the same geospatial data sets, allowing for efficiencies or redundancies in data development, depending on the amount of coordination between organizations.
This report is about the geospatial data and tools that are available for one particular application, that of preparing for and responding to emergencies. It discusses how those resources are utilized and the impediments that may exist to their greater and more effective utilization. Although in testimony the committee was told that “successful emergency response starts with a map,” the experience of recent disasters such as Hurricane Katrina and the attacks of September 11, 2001, has shown that the geospatial data and tools that exist within our communities have not been integrated effectively into disaster planning, response, and recovery (Sidebar 1.1). There are many reasons for this, and they are explored in this report. The committee also examines the consequences of underutilization, which are often disastrous, in the form of loss of life, damage to property, and damage to the environment. The report’s recommendations point to steps that can be taken to address this serious issue at local, national, and international levels through increased utilization and more effective integration of geospatial data and tools into emergency management processes. As MacFarlane (2005, p. 124) notes in a report on the use of geographic information systems in emergency management in the United Kingdom, “The principles, both technical and operational, … are established … and the technical enablers are all proven. It will now require vision and leadership to realize the gains.” Closer to home, a recent report from the National Governors Association concluded that “despite the promise of GIS technology for strengthening homeland security and its growing popularity across government, its use is not yet ubiquitous. To be useful during an emergency, the mapping tools and underlying data must be in place before the event occurs. While an emergency operations center (EOC) would require the tools and data other government agencies use every day, many states still lack an organizational and operational connection between the EOC and those other agencies. Often executive leadership is necessary to make these connections” (National Governors Association, 2006, p. 7).
1.2
STATEMENT OF TASK AND APPROACH
The committee was charged with assessing the status of the use of geospatial data, tools, and infrastructure in disaster management and making recommendations to increase and improve that use. Specifically, the study tasks were to
-
Assess the value of geospatial data and tools in disaster planning and disaster response;
-
Identify the status of and needs for decision support tools that assimilate model predictions and data for mapping vulnerability to catastrophe, scenario testing, disaster planning, and logistical support;
-
Identify the mission-critical data requirements for effective decision making;
-
Examine technical and institutional mechanisms that enable rapid discovery, access, and assemblage of data from diverse sources;
-
Assess training needs for developers and users of spatial decision support systems; and
-
Examine potential conflicts between issues of security and the need for open access to data.
The committee met four times to gather the information needed for the study and write the report. The first two meetings included presentations by various federal agencies and private industry organizations that described how geospatial data and tools are currently being used for emergency management and discussed issues related to their use. The third meeting was a workshop consisting of five discussion panels. The 25 panelists included a broad range of specialists in various aspects of emergency management from city, county, state, and federal government, private industry, academia, nongovernmental organizations, and the United Nations. (See Appendix D.) Breakout sessions with these experts were also held to obtain further insights on the study tasks. After acquiring and synthesizing a general overview of the value of and needs for geospatial data and tools in emergency management through these meetings, published documents, and the expertise of its members, the committee focused on the status of their use (i.e., how much and how effectively they are currently being used and what is preventing better utilization). Recommendations were then developed to address each of these challenges.
The report is structured as follows. The remainder of this chapter defines the major terms used in the report. Chapter 2 presents three scenarios, one real and two hypothetical, to illustrate how geospatial data and tools are currently used in emergency response and how better utilization could improve response. Chapter 3 goes into more detail about disasters and emergency response, to provide context and describe the needs of emergency responders, and reviews how current federal-level emergency management policies address geospatial data and tools. Chapter 4 then presents issues and challenges that are impeding the effective use of geospatial data and tools and provides recommendations for addressing these challenges. Chapter 5 provides guidelines that can be used by emergency managers to review their “geospatial preparedness” to respond to disasters. Finally, Chapter 6 offers some thoughts for the future.
|
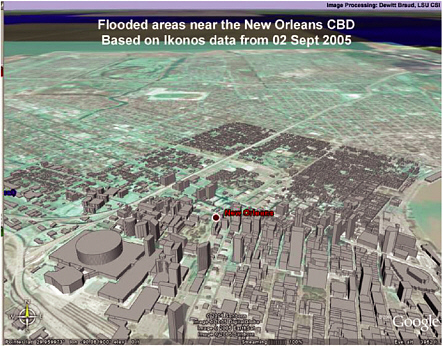
Sidebar 1.1 Google Earth Google Earth,a an Internet-based service originally developed by Keyhole, became instantly popular when it was rebranded and released by Google in early 2005. It allows users to view the Earth as a whole, zooming from global to local scales, using high-resolution imagery that shows individual buildings and vehicles, and to simulate a magic carpet ride over any part of the Earth’s surface. By releasing an application programmer interface (API), Google enabled thousands of individuals to add their own data and their own applications, and to make them easily accessible to anyone. In many ways, Google Earth represents a dramatic improvement in the accessibility of geospatial data and tools, allowing the general public to explore the Earth’s surface in ways that had previously been available only to geospatial professionals. In the immediate aftermath of Hurricane Katrina, high-resolution images began to appear on the Google Earth site, showing in detail the impacts of the disaster. People from all over the world could explore the impacted area, seeing the levee breaks in New Orleans, the extent of the flooding, the damage to buildings, and the impacts on the environment. Images from Google Earth appeared on television newscasts around the world. Within the impacted area, however, where computers were damaged, electrical power networks were destroyed, and Internet communications were disrupted, it was impossible for emergency managers to make use of Google Earth’s data and tools for days and in some cases weeks or months. Paradoxically, access to geospatial data and tools resembled a donut—abundant far away from the impact area, but almost nonexistent where it was most needed in the donut’s center. |
1.3
TERMS AND DEFINITIONS
1.3.1
Emergency Management
In this report, the term emergency is used to mean a sudden, unpredictable event that poses a substantial threat to life or property. Emergencies vary in magnitude, depending on the degree of threat, and they also vary in duration and in the geographic extent of their impacts. A disaster
|
Google Earth screen capture showing oblique high-resolution view of New Orleans central business district in foreground depicting post-Katrina flooding. From Andrew Curtis, Louisiana State University (LSU), a PowerPoint presentation on January 25, 2006, at the National Centre for Geocomputation (http://ncg.nuim.ie/ncg/events/20060125/). Image courtesy LSU World Health Organization Collaborating Center for Remote Sensing and GIS for Public Health (WHOCC) Laboratory. Image processing of IKONOS satellite imagery by DeWitt Braud, LSU Coastal Studies Institute. Google Earth KMZ file and image produced by Jason K. Blackburn, Ph.D., LSU WHOCC. Image courtesy Google Earth™ mapping service, used with permission. |
is defined as a calamitous event that overwhelms the impacted community’s ability to respond effectively. Catastrophes are very large disasters that often require concerted national and international response efforts. All three terms were used in the committee’s Statement of Task, but to avoid confusion only emergency and disaster are used in this report, the latter when it is desirable to emphasize severity or magnitude and the tendency of such events to overwhelm communities. The terms event and incident are used interchangeably throughout the report.
Disasters suddenly result in extensive negative economic and social consequences for the populations they affect, typically including physical injury, loss of life, property damage, physical and emotional hardship, destruction of physical infrastructure, and failure of administrative and operational systems. All disasters threaten the general welfare of some populace; thus, government intervention is warranted to minimize the negative consequences of disaster and, ultimately, to restore order. Disasters are often classified by cause (Alexander, 2000; Burton et al., 1993; Cutter, 2001): natural (e.g., floods, droughts, landslides, volcanoes, hurricanes, earthquakes, winter storms, tsunami), technological (e.g., chemical spills or releases, computer failures, train derailments, plane crashes, power outages, bridge collapses), or social (e.g., riots, willful acts such as arson or terrorism). However contemporary conceptual frameworks focus on the common elements of disaster incidents regardless of type or cause, referring to the full breadth of incidents as “all-hazard.”
Emergency management is the organization and management of resources and responsibilities for dealing with all aspects of emergencies. Four phases of emergency management are generally recognized: preparedness, response, recovery, and mitigation. Emergency management involves plans, structures, and arrangements established to engage the normal endeavors of government and voluntary and private agencies in a comprehensive and coordinated way to respond to the whole spectrum of emergency needs.
An emergency operations center is a facility established to serve as a focus for response and recovery support. EOCs vary dramatically in their configuration and purpose. They may house key emergency management staff and also provide the main access point for geospatial data and tools, producing maps and other hard-copy geospatial products for distribution to teams in the field. Other EOCs may contain only liaisons that help with coordination and provision of resources, and in such cases, the locus of decision making may be elsewhere—for example, at the Joint Field Office for federal assets and at various command posts for local assets.
Chapter 3 provides a more comprehensive discussion of all aspects of emergency management and describes the importance of geospatial data and tools in each aspect.
1.3.2
Geospatial Data and Tools
All disasters have a temporal and geographic footprint that identifies the duration of impact and its extent on the Earth’s surface. The term geospatial is used to refer to those interdependent resources—imagery, maps, data sets, tools, and procedures—that tie every event, feature, or entity to a location on the Earth’s surface and use this information for
some purpose. Location must be expressed in some standard and readily understood form, such as latitude-longitude, street address, or position in some coordinate system. GPS is today a very cost-effective way of associating an event, feature, or entity with a location and, thus, of making data geospatial. Consistent use of such associations across a range of data sets makes possible their integration for a variety of purposes, including display as maps and use for analysis and modeling.
Although location is an essential part of any item of geospatial data, it is the ability to link a location to the properties of events, features, or entities at that location that gives geospatial data their value. (To be consistent with practice among geospatial professionals, the term feature is used throughout this report to refer to any event, feature, or entity whose location and attributes are recorded in a geospatial data set.) These properties are collectively termed attributes and may include the owner of a parcel of land, the population of a neighborhood, the temperature of a point in a burning building, or the wind speed and direction at a point in a hazardous plume.
The terminology of geospatial data and tools is highly specialized, and efforts have been made throughout this report to minimize the use of technical terms and, where appropriate, to clarify their meaning. Particular resources and capabilities are referenced at points, both to serve as examples and to provide additional insight for the more technically proficient reader. Those who wish to explore this field in more depth should consult one of the many introductory texts, such as those by Clarke (2003), DeMers (2005), Longley et al. (2005), and Worboys and Duckham (2004).
Throughout this document, three types of geospatial data are discussed: framework data, foundation data, and event-related data. Framework data comprise the seven geographic themes that are most commonly produced and used by most organizations in their day-to-day geospatial activities,1 and which potentially provide a set of landmarks on the Earth’s surface to which other data can be tied (for example, if an event occurs at a street intersection and the location of that street intersection is known in the framework, then the location of the event is also known). The Federal Geographic Data Committee (FGDC) identifies these seven themes as geodetic control, orthoimagery, elevation, transportation, hydrography, governmental units, and cadastral information, since all of these are used in various contexts as frameworks within which other features can be located (see Sidebar 1.2). Although they fall outside the range of data themes in framework data, foundation data are also routinely col-
|
Sidebar 1.2 Framework Data Layers The Federal Geographic Data Committee has identified seven themes as forming the geospatial data framework:
SOURCE: http://www.fgdc.gov/framework/. |
lected to support the day-to-day operations of private- or public-sector organizations or agencies. Foundation data themes typically relate to a specific organization’s mandate and thus complement the framework data themes. Examples of foundation data include maps or data sets of soils, land use, weather, underground pipes, or overhead power lines. Given the diversity of such themes, foundation data are a valuable resource for emergency management and will reflect the state of an area prior to a disaster event, providing an essential baseline. Finally, eventrelated data include all those items collected specifically to respond to and recover from a particular disaster event. Such data include the locations of casualties, the locations of response resources, and imagery and inventories of property and environmental damage. They might also include data gathered in real time from sensors monitoring event-related phenomena such as earthquake aftershocks or chemical plumes, since such data can be important in managing response.
Throughout this report, the committee differentiates between data and information. The latter term connotes usefulness for some purpose, as when
field observations of damage are checked and compiled into maps that are designed to be used by first responders, or when raw measurements of atmospheric conditions are converted into predictions of hurricane tracks. Geospatial information is typically what is produced when geospatial tools and procedures are applied to geospatial data.
To make effective use of a geospatial data resource, a user needs access to that data resource’s metadata. Simply, metadata are “data about data” and describe the content, quality, condition, level of geographic detail, and other characteristics of geospatial data resources,2 whether these are images, paper maps, or digital data sets (see Sidebar 1.3 and Figure 1.1).
Metadata allow one person to describe a geospatial data set to another person, allow users to search for geospatial data sets within on-line catalogs, allow various kinds of automated processing of geospatial data, and allow producers of geospatial data to track and manage the production process. Metadata help to ensure that data are used appropriately; without metadata, data may be improperly applied, resulting in inappropriate conclusions or decisions. Thus, metadata play a critical role in all aspects of geospatial data use. When agencies have agreed to share data resources to provide an integrated resource for emergency management, it is essential that accurate metadata exist for each resource.
Remote sensing describes the collection of data from a wide range of automated systems, including satellites and aircraft equipped with imaging sensors, ground-based sensors for detecting biological and chemical agents, and ground-based surveillance cameras. Imaging sensors may be passive, relying on radiation reflected or emitted from the scene, or active, emitting signals and detecting their echoes to build images of three-dimensional structures. Many such systems have important applications in emergency management and are cited at various points in this report.
Geographic information systems are software systems used to capture, store, manage, analyze, and display geospatial data resources (see Figure 1.2). The “geographic” element of the name refers to the use of location, specifically a coordinate system, as an organizing principle for these data resources. Essentially, GIS integrate numerous functions that can be applied to geospatial data into a single, integrated tool set, just as Microsoft Word integrates numerous functions that can be applied to the creation and editing of text. GIS are among the most important and widely used of geospatial tools, and their functions allow emergency managers to integrate geospatial data, create maps, produce statistical summaries, and perform many other essential functions.
|
Sidebar 1.3 Example of Metadata High-Resolution Shoreline Data (2007) Identification Information: Citation: Citation Information: Originator: National Oceanic and Atmospheric Administration (NOAA), National Ocean Service (NOS), National Geodetic Survey (NGS) Publication Date: 2007 Title: High-Resolution Shoreline Data (2007) Geospatial Data Presentation Form: vector digital data Publication Information: Publication Place: Silver Spring, Md. Publisher: NOAA’s Ocean Service, National Geodetic Survey (NGS) Online Linkage: http://www.ngs.noaa.gov/RSD/shoredata/NGS_Shoreline_Products.htm Description: Abstract: These data provide an accurate high-resolution shoreline compiled from remote-sensing data. The vector shoreline data may be suitable as a geographic information system (GIS) data layer. This metadata describes information for both the line and point shapefiles. The NGS attribution scheme Coastal Cartographic Object Attribute Source Table (C-Coast) was developed to conform the attribution of various sources of shoreline data into one attribution catalog. C-COAST is not a recognized standard but was influenced by the International Hydrographic Organization’s S-57 Object-Attribute standard so that the data would be more accurately trans- |
Computer-assisted design (CAD) systems are widely used to create and manage three-dimensional digital models of buildings and other engineering structures. They have proven invaluable in modeling the collapse of structures such as the twin towers of the World Trade Center in order to provide direction for rescue efforts. When accurately registered to the Earth’s surface, CAD data can be usefully combined with other geospatial data.
Many web sites now provide access to large collections of geospatial data sets, which can be discovered, assessed, and possibly downloaded by remotely located users. Such sites are known as clearinghouses, geolibraries, archives, or geoportals. The last term reflects the most recent advances in this field, since a geoportal provides a single point of entry to
|
lated into S-57. When complete, the data will be made available on-line: http://www.ngs.noaa.gov/RSD/shoredata/NGS_Shoreline_Products.htm. Purpose: The shoreline and associated data layers were originally intended to support the NOAA nautical chart production. These data sets have been cleaned and reformatted to support the efforts of supplying accurate shoreline data layers for a coastal GIS database. These data sets may be beneficial for performing change analysis for erosion and accretion studies, landuse planning, determination of boundary extent, and other types of decision making. Time Period of Content: Time Period Information: Range of Dates/Times: Beginning Date: 20061001 Ending Date: 20070930 Currentness Reference: publication date Status: Progress: planned Maintenance and Update Frequency: As needed Spatial Domain: Bounding Coordinates: West Bounding Coordinate: 141 East Bounding Coordinate: −61.1 North Bounding Coordinate: 74.8 South Bounding Coordinate: −14.6 SOURCE: NOAA Data Explorer. Available at http://oceanservice.noaa.gov/dataexplorer/welcome.html [accessed on October 24, 2006]. |
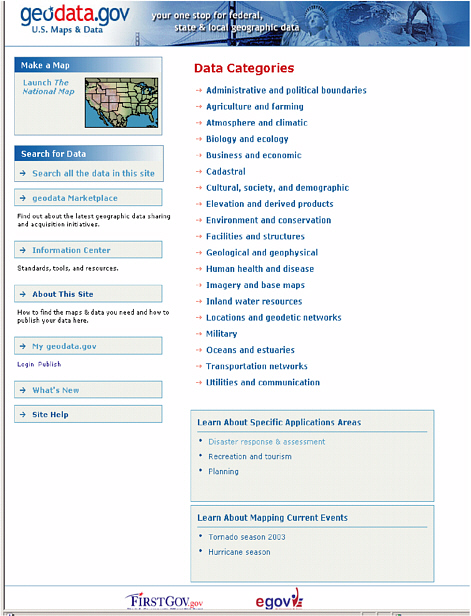
resources that may be located in many different repositories. The Geospatial One-Stop3 (GOS) is a geoportal sponsored as part of the administration’s E-Government Initiative and designed to provide a single point of entry to geospatial data and web-based tools (Figure 1.3).
Spatial decision support systems (SDSS) are designed to provide the essential information needed by decision makers when those decisions involve location. For example, an SDSS might be used to design evacuation routes, to select optimum locations for response teams, or to allocate evacuees to shelters. SDSS are in effect specialized GIS, designed to be
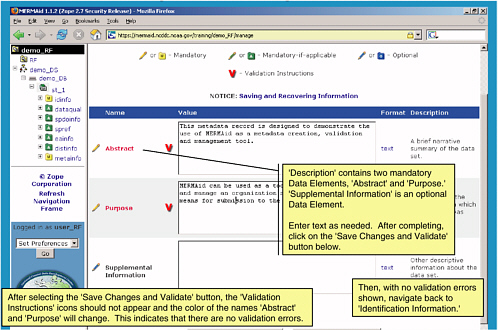
FIGURE 1.1 Example of the metadata development tool called Metadata Enterprise Resource Management Aid (MERMAid) by the National Oceanic and Atmospheric Administration. SOURCE: http://www.ncddc.noaa.gov/Metadata/docs/pdfv112 [accessed on October 24, 2006].
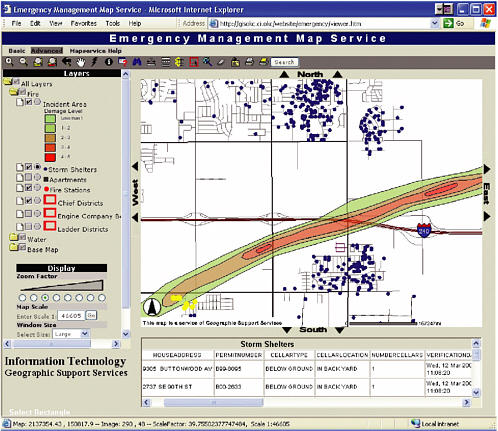
FIGURE 1.2 Example of a screen shot from a GIS that can be used for emergency management. SOURCE: Schad Meldrum, City of Oklahoma City.
used by decision makers to perform specific functions that often involve comparisons between many possible alternatives. They allow the decision maker to consolidate, summarize, model, and transform data to support such tasks as analytical reporting, visualization, and trend analysis.
Geospatial tools are software and hardware systems that perform specific operations on geospatial data. They include GIS and SDSS, as well as more limited tools and equipment designed specifically for such functions as the analysis and processing of images, the reformatting of data, or the acquisition of GPS measurements. They also include web-based tools and sites that offer limited mapping and analysis functions through the user’s own web browser.
Geospatial infrastructure is the set of institutions, people and skills, standards, educational programs, and other arrangements that provide the context within which geospatial data and tools are used. In the United
States, the National Spatial Data Infrastructure refers to those elements of geospatial infrastructure that were instituted beginning in the early 1990s in response to reports of the National Research Council (NRC, 1993), Executive Order 12906,4 the Office of Management and Budget’s Circular A16,5 and the ongoing efforts of the Federal Geographic Data Committee.6
Interoperability is the ability of products, tools, systems, or processes to work together to accomplish a common task. In the context of this report, the term refers specifically to geospatial data and tools. Often, the focus of interoperability is on the software systems that are used to capture, store, process, analyze, and display geospatial data, and on the data sets that must be exchanged between them. Because these systems have often been developed by different vendors using their own proprietary standards, there are frequently problems in exchanging data between them. Different agencies may also use different standards, different classification systems, or different terms to describe the same things. Thus, one way to move toward interoperability is through the application of open, vendor-neutral, nonproprietary standards that are developed in a voluntary consensus-based process.
Interoperability describes an ideal world in which problems of exchange have been addressed, allowing data and tools to be shared freely and rapidly. In a broader sense, however, interoperability must deal not only with data and tools but with differences that may exist between components of computer hardware, the networks that link them, and the communications technologies that operate on those networks.7 In the broadest possible sense, interoperability also refers to the processes, policies, and personnel of organizations and institutions, and this broadest sense is particularly pertinent to effective emergency management.
Geospatial preparedness reflects the overall capability and capacity necessary to enable all levels of government and the private sector to assemble and utilize geospatial data resources, GIS software and hardware, and SDSS to perform essential emergency management functions in order to minimize loss of life and property.


