
2
Thinking About Worst Cases: Real and Hypothetical Examples
To better understand the benefits of the use of geospatial data and tools in emergency management, this chapter presents a series of scenarios—one real, two hypothetical—to illustrate how geospatial data and tools are or could have been used to support both preparedness and response. The chapter begins with a description of the role played by geospatial data and tools in the response to the September 11, 2001, attacks on the World Trade Center and the lessons learned from that experience. It then uses two hypothetical cases to describe geospatial preparedness as it currently exists, possible scenarios of post-event response and recovery, and the lessons that might be learned by thinking through such scenarios. These three events were chosen to exemplify the difference in experiences between slower-onset events with significant warning time, such as a hurricane, and rapid-onset events such as terrorist attacks and earthquakes that occur without warning. The settings for the events— metropolitan New York and Southern California—were selected to demonstrate the issues associated with complex urban systems with multiple jurisdictions, significant and vulnerable property and infrastructure, and large and diverse populations. While the second and third events are hypothetical, they nevertheless draw on experiences from events that have occurred in the past 15 years or so, such as Hurricane Katrina in 2005.
As befits the context, the emphasis in all three cases is on the role played by geospatial data and tools. The descriptions focus on how geospatial data and tools were or would have been used in all four phases of management: preparedness, response, recovery, and mitigation (see
Section 3.1 for a complete discussion of these stages). By examining cases such as these we can explore the value of the use of geospatial data and tools, the gap between today’s typical levels of geospatial preparedness on the one hand, and what could be done to lessen the impact and consequences of disasters on the other. Although the second and third scenarios are hypothetical, they almost inevitably will become real at some date in the future.
2.1
THE SEPTEMBER 11, 2001, ATTACK ON THE WORLD TRADE CENTER
2.1.1
Background
The terrorist attack that took place on September 11, 2001, in New York City resulted in thousands of lives lost, the collapse of the twin towers of the World Trade Center as well as damage to adjacent buildings, and extensive disruption of transportation and other lifeline systems, economic activity, and social activities within the city and the surrounding area. When the final accounting takes place, this attack will almost certainly constitute one of the most deadly and costly disaster events in U.S. history. In a very real sense, the September 11th tragedy, the nature of the damage that occurred, the challenges that the city’s emergency response faced, and the actions that were undertaken to meet those demands can be seen as a proxy—albeit a geographically concentrated one—for what a major earthquake can do in a complex, densely populated modern urban environment. Like an earthquake, the terrorist attack occurred with virtually no warning. As would be expected in an earthquake, fires broke out and many structures collapsed. As has been observed in major urban earthquakes and other disasters (e.g., Hurricane Katrina), structures housing facilities that perform critical emergency functions were destroyed, heavily damaged, or evacuated for life-safety reasons. Thus, the attack and its aftermath provide a useful laboratory for exploring a variety of engineering and emergency management issues and for learning lessons that can be applied in many other contexts.
The initial attack caused the collapse of the two main towers of the World Trade Center, but flaming debris from the impact of the first jet ignited a fire in a fuel tank in Building 7, weakening the structure so significantly that this building also collapsed, destroying one of the most sophisticated emergency operations centers (EOCs) in the country. Housed in the EOC were geospatial tools and municipal data that had been carefully accumulated over years to respond to numerous types of emergencies. Backup data, which were stored in another part of the same
building, were also lost. Another copy of the data was stored on computers in the Department of Information Technology and Telecommunications building two blocks north of the World Trade Center, but this building was abandoned shortly after the twin towers collapsed and the data were rendered useless when dust and fumes from the collapsing buildings permeated the area and all power and communications were lost. Thus, despite extensive efforts to prepare for such events by establishing the EOC, the first maps distributed in support of the response were produced from a database stored at Hunter College, used primarily for research and teaching, which fortuitously was available for use in response.
A combination of factors culminated in an unprecedented use of geospatial data and tools. First, the devastation was beyond the imaginative capabilities of emergency management professionals—there was simply no appropriate script for such an event—and the demand for information proved to be immense. Second, Manhattan is unique in the United States because of the density of its high-rise buildings, the complexity of its infrastructure, and the value of its real estate. Because of this, and the logistical needs that follow, the City of New York had already undertaken intense mapping efforts, resulting in the production of highly accurate geospatial databases. Third, even though this was a very large disaster, the scale of events in New York was highly localized, with primary impacts concentrated in a small geographic area that could be mapped and imaged comparatively easily and quickly. These three factors combined to make both imagery and maps particularly useful.
The geospatial operations center was moved to Pier 92 on Friday, September 14th, and organized into the Emergency Mapping and Data Center (EMDC). Equipment and software were donated by numerous vendors, and New York State contracted for and provided the city with aerial imagery, detailed elevation data, and thermal data on a daily basis for six weeks. Eventually, more than 100 volunteers assisted in responding to more than 3,000 individual requests for geospatial information in support of the search and recovery efforts at the World Trade Center site. Responders were able to track mobile offices, medical support teams, heat from the fires, hazards, debris, and the daily progress of the search teams using geospatial data and tools.
2.1.2
Lessons Learned
It is clear that the primary responders, the New York Fire Department (FDNY), were able to make extensive use of maps and remote-sensing data during this disaster (see Figures 2.1, 2.2, and 2.3 for examples). Geospatial data and tools played a major role in rapidly integrating, ana-
lyzing, and visualizing data for emergency response, including the following:
-
Providing aerial imagery, detailed elevation data, and thermal data on a daily basis to support damage assessment and ongoing response effort;
-
Tracking daily progress of the search teams;
-
Tracking mobile offices and medical support teams;
-
Mapping heat from the fires, hazards, and debris; and
-
Providing key information on subways, telecommunications, and other infrastructure layers as well as fuel and coolant storage tanks.
Significant lessons were learned from the World Trade Center response effort, which as noted earlier was unprecedented in many ways,
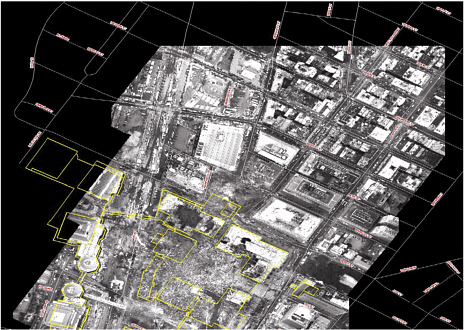
FIGURE 2.1 Aerial imagery with building footprints and street names overlaid on it. Picture provided with the permission of the New York City Office of Emergency Management.
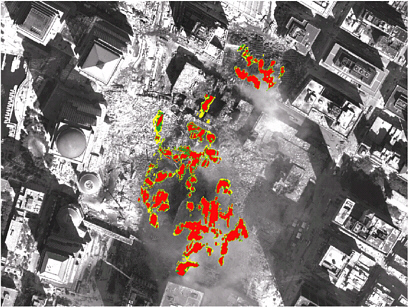
FIGURE 2.2 Aerial imagery with thermal data (hot spots) overlaid on it. This picture is provided with the permission of the New York State Office of Cyber Security and Critical Infrastructure Coordination.
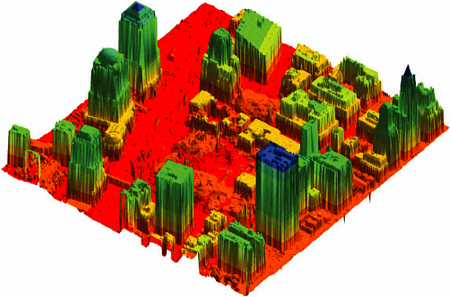
FIGURE 2.3 Aerial imagery depicting detailed elevation data obtained through the use of LIDAR (light detection and ranging) technology. This picture is provided with the permission of the New York State Office of Cyber Security and Critical Infrastructure Coordination.
and at least two detailed analyses have been published (Galloway, 2003; Thomas et al., 2003).1 Several of these lessons relate to the use of geospatial data and tools, including
-
The need for emergency management personnel to be aware of the value of geospatial information;
-
The need for geographic information system (GIS) professionals who respond to emergencies to understand the needs of emergency responders and to have trained to meet those needs;
-
The value of providing close geospatial support to first responders, sometimes referred to as a mobile or away team, which can be of assistance in providing the latest information, laying out search grids, analyzing data found, and transmitting event data back to the emergency operations center documenting the latest conditions at the incident site;
-
The need to reduce the lag time in processing remote-sensing imagery, to avoid reducing its value for search and rescue and damage assessments;
-
The need to have backup data for emergency management operations securely stored in widely distributed geographic locations;
-
The need to have a preestablished list of geospatial professionals to provide support when needed during a catastrophe;
-
The need to avoid duplication of effort and the confusion that results when the same products are generated by multiple groups; and
-
The problems of relying on connectivity to the Internet in the immediate aftermath of a disaster, when it can be more efficient to distribute data by hand using physical storage media.
2.2
A HYPOTHETICAL CATEGORY 3 HURRICANE MAKING LANDFALL ON LONG ISLAND, NEW YORK
2.2.1
Background
It is late September, and a Category 4-5 hurricane has formed in the warmer-than-normal Atlantic Ocean and begins moving northward at a significant distance off the eastern seaboard of the United States. The entire East Coast of the United States from Jacksonville, Florida, to Montauk, New York, experiences high winds and surf, but no significant damage. The National Hurricane Center’s forecasting models anticipate that it will weaken and turn easterly as it heads northward.
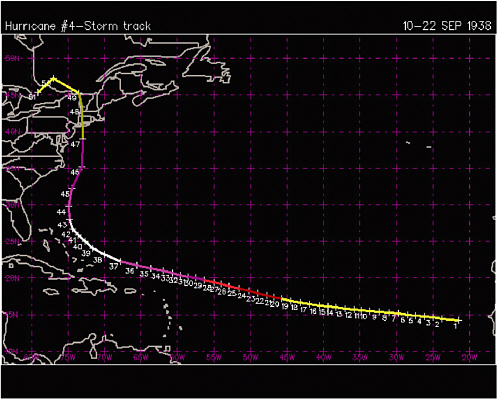
FIGURE 2.4 The track of the Great Hurricane of 1938, known as the Long Island Express, as it moved across the Atlantic Ocean and up the eastern seaboard. SOURCE: Figure created by Daniel Vietor, Unisys Corporation. Data from Atlantic Hurricane Database Re-analysis Project, National Oceanic and Atmospheric Administration.
Approximately 200 miles west of Bermuda, as predicted, the hurricane turns eastward. Its strength gradually drops to a Category 3 storm. Then, without warning, it turns northward again, intensifies, and begins to follow a track eerily similar to that of the great hurricane of 1938 known as the “Long Island Express” (Mandia, 2005) (Figure 2.4). Preparedness activities accelerate as the latest estimates predict landfall within the next 24 to 36 hours somewhere between New Jersey and Massachusetts. The storm accelerates as it continues northward, and landfall is now predicted in just over 12 hours. As the storm moves over cooler waters it again decreases in intensity to a Category 3 hurricane and makes landfall near Bellport, Long Island.
The hurricane quickly crosses over Long Island and makes a second landfall west of New Haven, Connecticut. Most of the south shore of Long
Island, the northern shore of Great South Bay, lower Manhattan, coastal Connecticut, and portions of Jersey City and Bayonne are covered by 7-10 feet of water. More than 8 feet of water accumulates at the entrance to the Lincoln Tunnel and floods the subway and rail tunnels. The region’s three major airports, La Guardia, Kennedy, and Newark Liberty, are under water. Manhattan is virtually isolated, with bridges damaged by the high winds, and tunnels and bridge access routes flooded. Wind damage extends inland for hundreds of miles.
2.2.2
Pre-event Geospatial Preparedness
As the hurricane approaches, residents secure their homes, mandatory local evacuations ensue, and shelters are opened and staffed by Red Cross personnel. Natural disaster response plans (state, regional, county, and municipal) include geospatial data such as
-
Locations of population and infrastructure, detailed maps providing estimates of the number of residents in each small area;
-
Locations of critical infrastructure potentially impacted by the impending storm;
-
Shelter locations, capacity, and service areas;
-
Track of the hurricane overlaid on maps of populations at risk;
-
Likely storm-surge inundation zones delineated using SLOSH (Sea, Lake, and Overland Surges from Hurricanes) models (storm surge), distributed to coastal counties and New York City (Figure 2.5);
-
Road networks and capacity, egress routes, and traffic control points for the main state and county roads;
-
Critical infrastructure data (pipelines, power generation) are available on a secure, on-line site for state officials, but not widely available to county or local governments; and
-
The locations of special-needs residents, such as those in nursing, adult care, correction, mental health, and youth facilities that were identified in the hurricane plans. Hospital capacity data are also available, but are not current.
2.2.3
Likely Post-event Response
Once the hurricane has made landfall, telephone and network communications fail and most communities are unable to communicate with each other and with state or federal officials. Cell phones and radios do not function. Responders are unaware of evolving and new threats across the area, such as major flooding. They only know what they confront, but have no way to report those conditions. They begin to work on solving
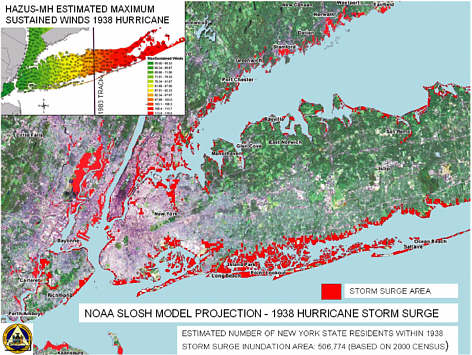
FIGURE 2.5 This graphic is intended to provide an example of the results of a SLOSH model. SOURCE: New York State Emergency Management Office GIS. Surge heights modeled by the National Oceanic and Atmospheric Administration.
problems where they are, but do not know how to locate additional resources or where to take the victims they rescue. By day two, responders have limited, intermittent radio communications, but there is so much radio traffic that they cannot be sure that the dispatch center hears what they report since they are never answered.
Because of the winds and the flooding, many streets are impassable while others no longer have valid signage or operational traffic control. Emergency responders have an urgent need for maps to organize search and rescue and initial response. Responders trying to rescue victims cannot get information about water depths, locations of high ground, and locations of dry streets so they can figure out where to launch boats and viable routes to and from launch sites. Responders feel disoriented even in areas with which they are very familiar because street signs and landmarks have been obliterated. After the fact, they realize that much better routes had been open and available, but they had no way of knowing this because they had little overhead intelligence other than from helicopters.
They thus have trouble getting aerial views of the disaster area so they can locate victims, prioritize rescue efforts, and direct ambulances. If they could see the current condition of the road system, they could deploy more efficiently and accurately, rather than by trial and error. They would also be able to identify open hospitals and other useful sites (e.g., sites where food and water are available). In short, they simply do not have a good clear picture of what things look like unless they go by boat or high-water truck. They do not have a web-based instant satellite or other realtime tool to use, even though their computers at the local EOC are up and could have been used.
As soon as they are able to fly, available state and local police helicopters are sent up with digital cameras to try to capture the damage. Reports of the extent of the damage are fairly good in New York City, but vary widely across Long Island. Requests are made by New York City and the counties on Long Island for immediate digital imagery to analyze the extent of the damage. Satellite imagery is not yet available because of cloud cover and because satellite overpasses are infrequent. Instead, requests for airborne imagery are made to New York State, to local imagery contractors, and to the federal government, leading to multiple flights over the area. The first digital imagery is provided five days later, although national news organizations showed visual images of the devastation from their news choppers much earlier. Given the time delay, local governments continue to use simple, digital cameras on the ground and in helicopters to record events as the recovery begins.
Some of the parties have previously shared copies of their framework data with New York State and have agreed which data will be used for analysis during the emergency. In the event that certain network or infrastructure restrictions limit data transfer, a secure site has been established at the U.S. Geological Survey (USGS) Center for Earth Resources Observation and Science (EROS) in Sioux Falls, South Dakota, to receive, store securely, and permit the sharing of incident data with authorized parties.
A request is made from Suffolk County on Long Island for additional GIS support. The state sends its “away” team to assist the county. This team is composed of skilled GIS professionals and brings with it a server filled with hundreds of state and local data sets, laptops, and a plotter. It is flown to the county by helicopter. It quickly sets up and begins producing maps and responding to inquiries for geospatial information such as coordinates for locations where rescues are still required. Other support is provided as needed from the state GIS team in the state emergency operations center. The teams fill many gaps for the county; however, their lack of connectivity with county networks results in delays in getting the information to the appropriate responders on the ground. Similar experiences are common in other affected counties and neighboring states.
Shortly after the first reports of the disaster are disseminated by the media, offers of assistance begin to flood in. Vendors of geospatial data and tools offer assistance of various kinds, some of it potentially helpful. However, no mechanisms exist for sorting through the offers, or for making use of the proffered data and tools in the chaotic situation that initially prevails. The Federal Emergency Management Agency (FEMA) deploys to this incident and sets up a Joint Field Office (JFO) with a GIS unit in the plans section. However this process takes several days and comes too late to be very helpful in the critical early stages of response.
2.2.4
What Could Have Been Done Better?
Few first responders have computer systems that allow them to share data directly with each other and the emergency managers in their jurisdictions. In some cases, emergency management officials do not even use the same geospatial data and tools as other agencies in their own jurisdiction, even in jurisdictions where enterprise-wide standards have been adopted. Such problems of interoperability may create barriers to communication between fire and police departments, emergency managers, and others and may result in many lost opportunities to take advantage of what responders on the scene are observing. Despite the promise of technology, therefore, much documentation of damage must still be done using paper forms.
Many of the geospatial data have been placed into various on-line servers by the respective agencies, to facilitate real-time access and updating by their own staffs as the emergency unfolds. All counties, New York City, and the states involved have GIS software, but it is not clear whether their data and systems can be shared or with whom. Overall, then, the picture is one of a patchwork of overlapping resources, developed in response to a variety of scenarios, some of which may involve sharing and integration of data between agencies and across jurisdictions. During an event of this magnitude, affecting such a large area and so many governments and jurisdictions, this patchwork of arrangements and geospatial preparedness would be wholly inadequate. While data and tools might be interoperable within one jurisdiction, the need for agencies to collaborate in unprecedented ways across jurisdictional boundaries will clearly pose problems, even if communication systems remain operable.
Critical gaps become evident in the geospatial data available for response, echoing the experience of Hurricane Katrina. For example, knowledge of the number and locations of households without private automobiles is a critical geospatial data need for evacuation planning. The availability, capacity, and locations of public transportation such as school buses, which could assist in evacuation, should be known. Planners
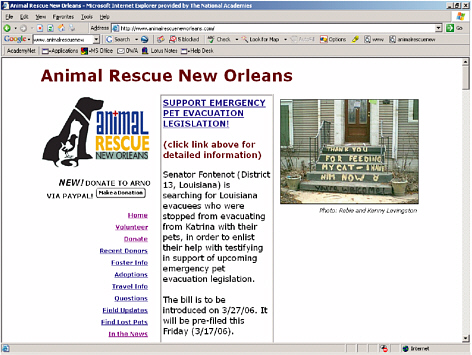
FIGURE 2.6 Web site reflecting the issues of pet evacuation during Hurricane Katrina. SOURCE: Animal Rescue New Orleans, http://www.animalrescueneworleans.com. Used with permission.
should anticipate the number and geographic distribution of household pets that would need sheltering. More importantly, the presence of pets in a household is a key determinant of a resident’s willingness to comply with evacuation orders (see Figure 2.6), and geospatial data on the distribution of pets could therefore be very helpful in emergency preparedness. The notification and education of the public for evacuation and sheltering could be more effective if geospatial information such as maps were available in the form of pamphlets, on billboards, or in the local phone book.
Rapid procurement of digital imagery is critical during response. The area must be flown over and imaged almost immediately after the storm passes in order to capture the extent of the damage—such needs are predictable whatever the nature and extent of the event and should therefore be planned as part of geospatial preparedness. Furthermore, the digital data and images must be processed quickly to be of any use to emergency managers—certainly within 24 hours. This means that states and counties must have preexisting negotiated contracts with vendors or federal agencies that can be activated quickly to gather the field data.
While access to data within agencies was generally advanced, making extensive use of on-line servers, very little data sharing took place between agencies in advance of the disaster, and few of the problems associated with data sharing had been worked out. As a result, sharing had to be achieved ad hoc in the aftermath, when speed is critical, and problems had to be solved on the fly, leading inevitably to delays. Such delays could be minimized if sharing arrangements were worked out as part of geospatial preparedness. The expansion of existing data layers and incorporation of local data into an already robust, sharable database could help improve communications between the federal, state, and local emergency response communities.
The geospatial tools that would permit rapid analysis of data must be available to all agencies in all jurisdictions. For example, the timing of evacuations is critical and must be done in sequence in order to prevent massive traffic jams; geospatial tools exist to plan and manage such evacuations by identifying routes, simulating driver behavior, and planning traffic controls, but such tools are not widely available within the appropriate agencies. A secure on-line spatial decision support system designed for use by people with minimal GIS skills would facilitate emergency response decision making and provide a useful tool for local responders.2 Tools that automatically provide Global Positioning System (GPS) coordinates to users would allow damage reports to be georeferenced quickly and easily, avoiding the need to wait until a trained GIS professional is available to perform the task.
The use of geospatial data and tools should have been fully integrated into emergency response across this region. Emergency responders need to be trained in the use of these data and tools, and steps have to be taken to incorporate them into the decision-making process. In addition, geospatial professionals who will be used to respond to such an emergency have to be identified, and around-the-clock contact information should be obtained for them as part of geospatial preparedness. It is also helpful to identify in advance the availability of volunteer geospatial expertise. Such expertise exists in many universities and in national and international volunteer relief organizations.3 For example, the Computer Aided Design and GIS Research Laboratory at Louisiana State University was able to provide essential geospatial services in the aftermath of Hurricane Katrina.4
|
2 |
During Hurricane Katrina, the State of Louisiana and New Orleans police shared 911 data on the location of victims through the simple-to-use web-based Homeland Security Information Network (HSIN). |
|
3 |
See, for example, http://www.giscorps.org/, http://www.mapaction.org. |
|
4 |
Land-parcel data, one of the framework themes, are essential in managing disasters and in assessing damage, along with building footprints and the locations of infrastructure (power, telecommunications, water, sewage, and steam-heating networks). GPS-enabled handheld devices for damage assessment will speed up the process of response and recovery as communities seek federal disaster aid. These computers should be programmed with “drop-down” menus to make it easy for staff to record data on storm damage, et cetera. Ideally, this equipment would have secure, wireless capability so that data can be forwarded electronically from the site to a location where they can be integrated with other data, to provide decision makers with a clear picture of the type and extent of impact in a given area. Doing this easily and quickly requires not only good planning, but also well-thought-out and frequent training.
Obtaining good data on the storm impact is important, but equally important is the distribution of these data to other response partners. If the Internet is accessible, this can be done most quickly through a secure, on-line application that provides web-based services, but if it is not, then other more traditional means of physical dissemination such as hand delivery will have to be used. Making the data available through a node of the National Spatial Data Infrastructure (NSDI) would allow them to be retrieved easily by authorized personnel across the country and would ensure compliance with standards. Smaller amounts of data might be emailed to a preestablished list of responders in neighboring counties and municipalities, state government, and the federal government.
Because of the large number of evacuees, the distribution of supplies and equipment to impacted areas must be well coordinated. The need for food, water, and so forth, for shelters housing large numbers of evacuees can be known in advance based on the population programmed for each shelter. However, the length of time that evacuees are required to stay in a shelter might vary depending on the damage to their home neighborhoods. Inventories can be managed and replenished if tools such as barcoding devices can be used to provide data to a central database, where they can be combined with preestablished geospatial data to support faster and more effective decision making. Finally, it is critical that all communities develop and maintain geospatial data on special-needs populations such as the elderly, infirm, or those without cars. These residents will require special planning and additional resources to move them out of harm’s way.
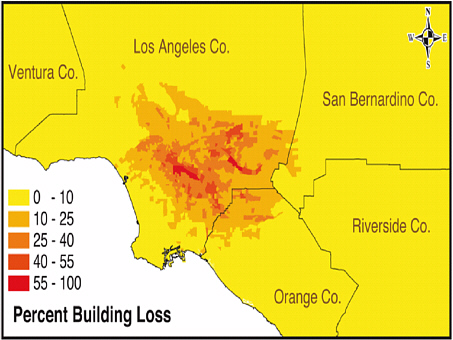
FIGURE 2.7 Damage based on the Puente Hills earthquake scenario. SOURCE: Southern California Earthquake Center (2005). Available on-line at http://www.scec.org/core/public/image.php/13085-2162 [accessed on October 6, 2006]. Reprinted with permission of Earthquake Engineering Research Institute.
2.3
A HYPOTHETICAL SOUTHERN CALIFORNIA EARTHQUAKE
2.3.1
Background
It is another beautiful April Wednesday in Southern California with temperatures in the 70s. Roughly at midday, and without any warning, a rupture occurs on the Puente Hills fault, causing a magnitude 7.2 earthquake. Nearly 9.9 million people live in the Los Angeles Basin, and it is safe to assume that most of them feel the earthquake. Given the time of day, location, and magnitude, the early estimate of the number of fatalities is 7,600, with casualties running between 56,000 and 268,000.5 The ground motion and shaking destroy more than 40 percent of the commercial and industrial facilities in the immediate area, as well as critical facilities such as hospitals and schools (Figure 2.7). Power and transmission
|
5 |
The Southern California Earthquake Center projects losses of up to $250 billion for earthquakes on the Puente Hills fault under Los Angeles; see http://www.scec.org/research/050525puentehills.htm and Field et al. (2005). |
lines are destroyed, and the basic transportation infrastructure is seriously compromised. Residential structures are also affected, resulting in upwards of 735,000 displaced households. Ruptured gas lines create the potential for fires, which break out sporadically in the affected area. The water supply is disrupted, with significant damage to the aqueducts bringing water from Northern California, the Owens Valley, and the Colorado River.
Short-term public sheltering is required for 211,000 people who are unable to move out of the area or to find alternative accommodation. Communications are difficult, given the 182 different languages spoken in the region; coupled with the loss of the major communications infrastructure, this poses significant rescue and relief challenges. Aftershocks continue for the next few days and keep the city on edge.
2.3.2
Pre-event Geospatial Preparedness
As part of their disaster preparedness, both the City of Los Angeles and the much larger County of Los Angeles have geospatial data and tools that are frequently used and constantly maintained, and emergency management personnel are regularly trained in their use. Examples of geospatial data helpful in preparedness for this event include the following:
-
Locations of transportation routes, including road capacity, traffic flows based on time of day, and workarounds (alternate routing should there be an accident or some other traffic delay) are available in real time. Aerial reconnaissance from traffic helicopters operated by both public safety agencies and the major news media provide situational updates as required.
-
Demographic data exist at fine levels of geographic detail, stored in databases and providing information on numbers of people and numbers of households, age characteristics, race and ethnicity, language spoken at home, number of persons with disabilities, number of households without cars, and number of persons living in poverty. These data are available at the block level for the city and county.
-
Data on the locations of potable water lines, wastewater treatment facilities, sewer lines, natural gas lines, oil storage facilities, electric lines, communications lines, and cell phone towers (often termed lifeline data) have been culled from both private- and public-sector sources. In addition, geospatial data on critical infrastructure, including bridges, over-passes, dams and reservoirs, aqueducts, day care facilities, hospitals, schools, nursing homes, and urgent care centers, have been gathered and regularly maintained. Capacity data for hospitals are available, but there
-
is no up-to-date occupancy data. The same is true for schools, nursing homes, and day care facilities.
-
Communication systems capable of reporting the user’s location, accessing and displaying maps, and performing other simple functions on geospatial data are available on a limited basis for selected city and county emergency managers, but are not widely distributed to local first responders.
-
Building inventory data is integrated with cadastral data for the entire county. Although residential areas are clearly identifiable, there is no consistent determination of the building’s commercial or industrial usage.
-
The locations of hazardous materials treatment, storage, and disposal facilities are available, but the exact quantity and type of materials at each location are not known. The city has a primary EOC that has all of the geospatial data on-site, backed up at three additional locations scattered throughout the region, but there is no backup facility outside the region.
2.3.3
Likely Post-event Geospatial Response
Most of the buildings near the epicenter have been completely destroyed, and the suspected area of damage extends outward for more than 50 miles (see Figures 2.8 and 2.9). The EOC sustained partial damage but

FIGURE 2.8 Apartment building collapse, Northridge, California, 1994. Photo credit, Susan Cutter.
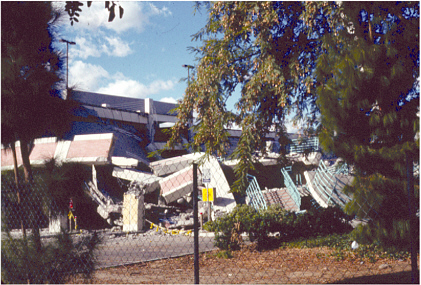
FIGURE 2.9 Parking garage collapse, Northridge, California, 1994. Photo credit, Susan Cutter.
is functional in the short term. Sporadic reports begin coming into the EOC of catastrophic building failures within the county, especially among the older commercial and industrial buildings east of downtown Los Angeles. Power outages are widespread, and communications are spotty. Cell phone service is interrupted and, when available, is overloaded. Ruptured gas mains continue to pose fire hazards, and fires are burning out of control in some portions of the affected areas. Mass casualties are reported, and many of the major surface roads have suffered extensive damage.
Almost immediately, city and county officials begin airborne surveillance by helicopter. First responders begin fanning out to assist in search and rescue in their immediate vicinities, but there is little coordination. Search grids are laid out, but this has to be done by hand using paper maps because no power is available to run computers, printers, or copiers. Communications between first responders are limited, and mutual assistance from surrounding communities is not forthcoming due to the geographic extent of the damage.
Emergency power generation quickly enables some computer systems to become operational, providing access to geospatial data and tools. The region has an extensive network of trained geospatial professionals, especially among its HAZUS working group.6 Calls go out to mobilize this
|
6 |
HAZUS is FEMA’s geospatial tool for estimating potential losses from disasters; see http://www.fema.gov/hazus/. |
resource to help in the response. Since many responders cannot get to the EOC, secondary sites are established at major research universities where power is available, allowing some geospatial data and tools to be shared over the Internet.
2.3.4
What Could Have Been Done Better?
The mass casualties and injuries turn out to have been underestimated since the population estimates were based on nighttime residence (derived from census data), not on where people worked or attended school, and casualty rates in places of work and in schools turned out to be generally higher than in residential buildings. Having access to daytime as well as nighttime population data would be very helpful in responding to daytime disasters such as this. While HAZUS can generate daytime and nighttime impact values so that an archive of scenarios can be built, immediate access to daytime population estimates is just as important as access to census block data in case the scenarios do not cover actual conditions. Similarly, better data on individual buildings and the total numbers of people at work or visiting on any given workday would improve urban search-and-rescue efforts.
Ample geospatial resources were available elsewhere in Southern California, notably from universities and the private sector, which assisted greatly in the disaster response. However, these resources were not as effective as they might have been because of the lack of geospatial data backup at locations outside the affected area, and many of the data sets had to be reconstructed from other sources. The trained volunteer labor, however, proved useful.
Mobile, handheld devices for search and rescue and initial damage assessments by first responders would enhance the disaster response, especially if these could be enabled with simple geospatial data and tools, including GPS. Since many of the most damaged structures were commercial and industrial buildings whose footprints could extend to entire blocks, more precise locational information on inhabitants would be useful for search and rescue. For example, it would be useful to know the number of occupants of each room on each floor. Also important is knowledge of the exact location of potentially hazardous materials within these buildings, if any, so that fire and hazardous material (hazmat) teams can anticipate and deal with them effectively.
Remote-sensing imagery to gauge the magnitude and extent of damage, monitor particulate plumes from fires, and search for potential leakages in the numerous dams in the region could enhance response. Heroic efforts to acquire, process, and distribute imagery have been made by
satellite operators, emergency managers, and geospatial professionals during recent disasters such as Hurricane Katrina or the events of September 11, 2001. Yet despite its potential, the immediate use of remote sensing remains difficult and limited, particularly due to a lack of equipment, training, and rapid access to suitable imagery, and this continues to thwart effective emergency response. To date, vendors and governments appear to have been unable to secure appropriate contracts for image acquisition and processing in anticipation of emergencies, leading to unacceptable delays in rapid damage assessment when events occur. These factors will continue to reduce and delay the use of remote sensing as a source of geospatial data during the response phase of disasters.
2.4
SUMMARY
All three of these cases, whether real or hypothetical, afford an opportunity to illustrate the value of geospatial data and tools in emergency management, to give examples of the current status of geospatial preparedness, and to ask what could be done better. Although these cases focus primarily on the initial response phase, geospatial data and tools also play vital roles in short- and long-term recovery. Both discussions of hypothetical scenarios included lists of geospatial data types that proved useful, and it is not surprising perhaps that the lists are remarkably similar—the geospatial data needed to respond to large-scale disasters will always include standard framework and foundation data sets, as well as extensive event-related data, although their availability and quality will vary markedly in practice. While the hypothetical scenarios were chosen to illustrate the differences between an event for which there was warning (the hurricane) and one for which there was none (the earthquake), in practice both scenarios proceeded in similar fashion. Geospatial data and tools played a significant role in the warning process, but problems such as lack of data interoperability, lack of training, and lack of effective communication rapidly reduced any benefits that advanced warning might have produced.
Virtually every aspect of emergency management requires knowledge of where: the location of the event itself, the magnitude of its impact on every part of the surrounding area, the locations of the assets that will be needed in the immediate response, the locations of infrastructure and evacuation routes—the list is endless. Effective emergency management also requires access to tools that can process such data to generate products of use to responders: maps of the area showing the search grid, images showing damage, lists of locations flagged for inspection, or predictions of the spread of wildfires or smoke plumes. The response phase of emergency management requires speed, in the form of fast access to up-to-
the-minute data, rapid generation of key products, and rapid delivery to the personnel who need the products most. Accurate information delivered quickly can save lives, reduce damage, and reduce the costs associated with emergency response. Yet speed can be achieved only if responders are adequately prepared, through training, planning, and the coordinated development of procedures.
To assess the current status of geospatial readiness, one needs to ask the following questions. Are there significant gaps in the integration of geospatial data and tools into emergency management, and is the rapid delivery of geospatial information to key responders and decision makers during an emergency sufficiently straightforward? Do problems arise when disasters span many jurisdictions, because of lack of interoperability of geospatial data and tools and lack of foresight and experience in working together? Would better integration of geospatial information into the emergency management workflow improve decision making at all levels? Is there a need for better training in the use of geospatial data and tools among emergency management officials, and are geospatial professionals sufficiently trained in emergency management processes and practices? Is the rapid delivery of geospatial information a critical issue, and can emergency management workflows and standard operating procedures be redesigned to take advantage of this information? Finally, would regularly scheduled simulation exercises help all parties to learn how to meet each others’ needs? These questions are very closely related to the committee’s charge and are investigated in detail in the following chapters.
As noted elsewhere (Bruzewicz, 2003; Cutter, 2003; ESRI, 2001; FGDC, 2001; Goodchild, 2003; Greene, 2002), there are substantial challenges and constraints in using geospatial data to prepare for the worst cases. Many of them have already appeared in the examples described above and in the literature. In Chapter 3 the nature of disaster management and the relevant national policy context are reviewed in detail. Then the challenges and gaps in our current ability to prepare and respond with appropriate geospatial data and tools are summarized, as gathered from the literature and from testimony offered to the committee. In Chapter 4 the implications of these challenges and gaps are assessed in the light of current technology and anticipated future developments.


