
1
Epidemiology of Tobacco Use: History and Current Trends
Since at least the colonial era, tobacco has been a popular commodity in the United States, with tobacco use increasing almost exponentially from the 1800s to the mid-1960s (DHHS 2000a). The invention of the cigarette fueled this dramatic rise in tobacco consumption, and cigarette smoking quickly outpaced the use of any other form of tobacco product (Brandt 2007). When tobacco use peaked in the mid-1960s, more than 40 percent of the U.S. adult population smoked cigarettes (National Center for Health Statistics 2005). This chapter reviews the growth of tobacco use over the 20th century, and the dramatic reversal of that trend beginning in 1965. The chapter examines recent trends in the epidemiology of smoking over the past four decades, takes a close look at the characteristics of smokers and those who have quit smoking, and discusses variations in the prevalence rate of smoking by sociodemographic characteristics and state of residence. Finally, the chapter highlights some possible threats to continued progress in reducing smoking in the United States.
GROWTH OF THE TOBACCO PROBLEM
In the late 19th and early 20th centuries, Americans consumed tobacco primarily in the form of chewing tobacco and cigars. According to Giovino, the per-capita consumption of tobacco products in the early 1880s was approximately 6 pounds of tobacco per person aged 18 and older; 56 percent of that tobacco was in the form of chewing tobacco, whereas only 1 percent took the form of manufactured cigarettes (Giovino 2002). For several reasons, cigarettes became the preferred tobacco product of Americans over
the 20th century; in particular, cigarettes served as a more efficient vehicle for the absorption of nicotine and a less expensive form of tobacco. Also, by the 1880s, cigarette production had been mechanized with the advent of the Bonsack machine, which made it possible to produce additional units for little or no additional cost, and the prices of cigarettes were cut in half (Chaloupka et al. 2002; Giovino 2002). The lower price made cigarettes more accessible to a wider clientele (DHHS 2000b). By the 1950s, manufactured cigarettes represented 80 percent of per-person tobacco consumption (Giovino 2002).
In 1900, on a per-capita basis, American adults smoked approximately 54 cigarettes per year. That number increased almost exponentially until its peak in 1963, when an estimated 4,345 cigarettes were consumed per adult in that year alone, as shown in Figure 1-1 (ALA 2006). This growth in consumption occurred for many reasons, but was driven largely by the mass production of cigarettes; the mildness, packaging, addictiveness, and convenience of the product; glamorization of smoking in movies and on television; and persuasive advertising campaigns (Chaloupka et al. 2002; DHHS 2000a; Giovino 2002).
The milder flavor of the Turkish and domestic blended tobacco products also increased the appeal of cigarettes to a wider clientele. In the early twentieth century, cigarette manufacturers developed new blends using American-grown tobacco, such as sugared burley tobaccos (Giovino 2002). Manufacturers also used new methods of curing the tobacco, including flue
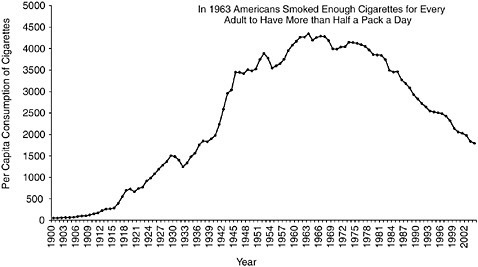
FIGURE 1-1 Per capita consumption of cigarettes among adults ages 18 years and older from 1900 to 2004.
SOURCES: (ALA 2004, 2006; Capehart 2004).
curing. This process results in a product called “bright tobacco,” which has a high sugar content and a medium nicotine content (IOM 2001). These production changes created cigarettes that were milder and less alkaline than other forms of tobacco. The more acidic nature of these cigarettes allowed the nicotine in their smoke to be efficiently absorbed by the lungs. This feature provided cigarettes an advantage over cigars, as cigar smoke is absorbed in the mouth rather than in the lungs. More nicotine is absorbed with cigarettes compared to cigars due to the much larger surface area of the lung compared to the mouth. In addition, nicotine more quickly gets into the brain via the carotid artery following pulmonary absorption compared to buccal absorption, in which it travels through the liver before getting to the brain. Furthermore, as cigarettes are inhalable, they require less skill to use than cigars (DHHS 2000b; Giovino 2002). Thus people who may have abstained from smoking because they were intimidated by the cigar were drawn to the ease of smoking a cigarette (DHHS 2000b). The efficient absorption of nicotine has the added effect of making cigarettes more addictive than other forms of tobacco (Giovino 2002). These two features combined in order to drive high addiction rates among soldiers in World War I, to whom cigarettes were distributed without charge (Burns et al. 1997; DHHS 2000a; Schoenberg 1933).
Intensity and innovation in advertising have been hallmark features of the cigarette industry throughout its history. In 1913, Camel became the first cigarette brand to gain nationwide popularity, following a mass marketing campaign by the R. J. Reynolds Company that introduced this “American blend” cigarette to the American public through a teaser advertisement (R.J. Reynolds 2006). Other companies followed suit, especially after World War I, as heavy advertising propelled the demand for cigarettes on a national scale (Schoenberg 1933). Ernster reported that Lucky Strike drew women’s attention with the diet slogan “Reach for a Lucky Instead of a Sweet” (Ernster 1985). Throughout the 1930s and 1940s, meanwhile, the Brown and Williamson Company included health claims in its ads for Kool, the first menthol cigarette distributed nationwide, claiming that smoking menthol cigarettes could protect against colds and soothe the throat (IOM 2001; R.J. Reynolds 2006).
The boom period of tobacco consumption occurred between the 1920s and the mid-1960s (DHHS 2000b). During this period, tobacco users shifted from the traditional practices of using chewing tobacco, inhaling snuff, and smoking cigars and pipes, to smoking cigarettes, and the number of tobacco users increased as the rising number of initiates, including many women, became cigarette smokers (DHHS 2000b; Giovino 2002). The manufactured cigarette was convenient because it was already rolled and, along with the safety match, it provided an easy, portable, and disposable indulgence (DHHS 2000b).
Over the 20th century, cigarette consumption fell only a few times before 1965: during the Great Depression, at the end World War II, and in 1953 and 1954 (Giovino 2002). The drop in consumption during the Great Depression was directly related to the decline in real disposable income,1 whereas the declines in the early 1950s followed the first real claims of tobacco’s harmful effects on health, which linked smoking to the development of cancer (Giovino 2002; Hamilton 1972; Havrilesky and Barth 1969). Hamilton (1972) showed that the reduction in consumption in the mid-1950s was attributable to the health scare associated with the use of tobacco products and that the effect of this public concern negated any market boost that might have come from advertising. Other studies suggest that the positive health claims in cigarette advertising made during this period might have had an indirect negative effect on tobacco consumption by giving the impression that protection was needed, thereby reinforcing the health scare (IOM 2001).
To mollify the public’s growing concern about the health effects of smoking, tobacco companies introduced filtered cigarettes in the 1950s and the so-called low-tar cigarettes in the 1960s. Filters reduce tar and nicotine yields on government test machines. The market share of filtered cigarettes jumped from less than 5 percent in 1953 to almost 20 percent 2 years later. By 1960, more than half of all cigarettes consumed had filters (Giovino 2002). In 2004 and 2005, 99 percent of cigarettes on the market had filters (FTC 2007). The market share of low-tar cigarettes, those purportedly yielding less than or equal to 15 milligrams of tar, increased from 2 percent to more than 55 percent in the 20 years between 1967 and 1987. By 2003, almost 85 percent of cigarettes distributed within the United States were low-tar products (FTC 2005; Giovino 2002).
Some manufacturers added chemicals to cigarettes to improve their flavor and aroma. One such chemical was menthol, an additive with an anesthetizing effect that was claimed to sooth the throat (Gardiner 2004; IOM 2001). Because menthol did indeed make the passage of tobacco smoke into the throat a smoother experience, consumers inhaled more deeply. In 1963, 16 percent of cigarettes sold in the United States contained menthol. The market share of menthol cigarettes peaked at slightly under 30 percent in the 1980s (FTC 2005; Giovino 2002; Giovino et al. 2004).
DECLINE IN TOBACCO USE: 1965–20052
Despite the development of new products purportedly reducing smokers’ exposure to tobacco toxins, Americans have greatly reduced their tobacco consumption since the publication of the first Surgeon General’s report on the harmful effects of cigarette smoking in 1964. In fact, cigarette consumption has declined substantially since the mid-1960s (see Figure 1-1 for annual trends). By 1983, the annual per-capita consumption of cigarettes had declined approximately 20 percent from the 1963 level to 3,494 cigarettes per adult; by 2004, it had declined an additional 49 percent to 1,791 cigarettes, its lowest level in 67 years (ALA 2006; Capehart 2005). The halving of per-capita consumption of cigarettes over the last 20 years stems from a decline in smoking prevalence coupled with a decline in the number of cigarettes smoked per day among those who smoke.3
The percentage of adults who currently smoke (see Box 1-2 for a definition of this and other terms) has also declined in the past 40 years, as indicated in Figure 1-2. In 1965, 41.9 percent of Americans ages 18 years and over, or approximately 52.2 million adults, smoked either every day or on some days (National Center for Health Statistics 2005). The percentage of adults who are current smokers declined steeply between 1965 and 1991, with an estimated 39 percent drop in the prevalence of cigarette smoking. By 2005, the prevalence of adult cigarette smoking had declined to half the 1965 rate. An estimated 20.9 percent of American adults, or 45.1 million people, were current smokers in 2005 (CDC 2006b).
The reduction in the prevalence of current smokers was driven by an increase in the rate of smoking cessation as well as a decrease in the rate of smoking initiation. Between 1965 and 2005, the percentage of adults who once smoked and who had quit more than doubled from 24.3 to 50.8 percent, as shown in Figure 1-3 (CDC 2006b; TIPS 2005a). Furthermore, the percentage of adults who have never smoked more than 100 lifetime cigarettes increased by approximately 23 percent from 1965 (44 percent) to 2005 (54 percent) (CDC 2005c; TIPS 2005b).
Smoking initiation among adolescents and young adults has also declined since the mid-1960s, as estimated by the National Survey on Drug Use and Health (NSDUH) (SAMHSA 2005). In 1965, among adolescents aged 12 to 17 years, 125.5 of every 1,000 smoked a cigarette for the first time. In 2003, 102.1 per 1,000 youths in the same age range had smoked a cigarette for the first time (Figure 1-4). The reduction in smoking initiation saved more than half a million adolescents from having a first cigarette between 1965 and 2004. Young adults (individuals ages 18 to 25 years) have
|
2 |
See Box 1-1 for a list of commonly used data sets regarding tobacco use. |
|
3 |
As discussed in a subsequent section, mean number of cigarettes per day consumed by current smokers rose steadily until 1979, when the trend reversed. |
|
BOX 1-1 Commonly Used Data Sets
|
traditionally been less likely to initiate smoking behavior than adolescents, but their initiation rates also declined, from an annual level of 89.4 first-time smokers per 1,000 people in 1965 to one of 67.5 per 1,000 in 2003 (SAMHSA 2005). It should be noted, however, that despite this overall decline in initiation since 1965, trends over the past twenty years are not entirely encouraging. Developments in youth and young adult initiation over the past two decades are discussed in further detail later in the chapter when the committee more closely reviews recent developments.
Industry Response
These reductions in smoking over the past half century represent hard-won successes for tobacco control programs, because efforts to reduce tobacco consumption have frequently been countered by the tobacco industry in ways designed to maintain its customer base. Just as it did in the early part of the 20th century, the tobacco industry has recently attempted to use pricing, new product development, and advertising to counteract health-driven declines in tobacco consumption (Chaloupka et al. 2002).
|
BOX 1-2 Definition of Terms
|
||||||||||
The tobacco industry has dramatically increased its investment in advertising and promotional expenditures since the 1960s. From 1963 to 2003, total advertising and promotional expenditures by the five largest tobacco manufacturers increased from $1.5 billion (indexed for inflation) to $15.15 billion, the largest amount ever reported to the Federal Trade Commission (FTC 2005). Expenditures have risen particularly dramatically in recent years; the $15.15 billion spent in 2003 represents a 48 percent increase over the $10.25 billion spent in 2000, and an increase of 170 percent over the $5.62 billion spent in 1990 (FTC 2005).
It should be noted, however, that the allocation of these advertising and promotional expenditures has changed substantially in recent years. As
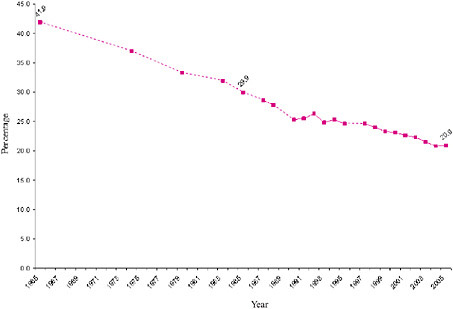
FIGURE 1-2 Current smoking prevalence among adults, selected years from 1965 to 2005 (all years for which NHIS data on annual smoking prevalence are available are included). Solid lines represent changes in smoking prevalence between consecutive years. Dotted lines represent approximate changes in smoking prevalence between nonconsecutive years. For years 1965 to 2004, age-adjusted data are provided. For 2005, crude data are provided.
SOURCES: (CDC 2006b; National Center for Health Statistics 2006).
the industry’s advertising opportunities have become increasingly limited, tobacco companies have dedicated significant portions of their marketing budgets to price discounts and other promotions at the retail level (Chaloupka et al. 2002; White et al. 2006). As discussed further below, the main target of these price-oriented promotions is current smokers.
Manufacturers have also developed new products with the hopes of countering prevalent health concerns. Marketing campaigns have promoted purportedly low-tar, low-nicotine, and low-yield products, catering to perceptions that such cigarettes are safer or less harmful than the alternatives (Giovino et al. 1996). Taking advantage of the increasing popularity of these purportedly low-yield products, the R.J. Reynolds Company repositioned the Winston brand in 1997, claiming that its product was made with “100 percent tobacco” and “no additives” (Arnett 1999). Manufacturers have also promoted menthol-containing products, in response to consumer perceptions that such cigarettes were less harmful than nonmenthol brands (Gardiner 2004; IOM 2001; Pollay and Dewhirst 2002).
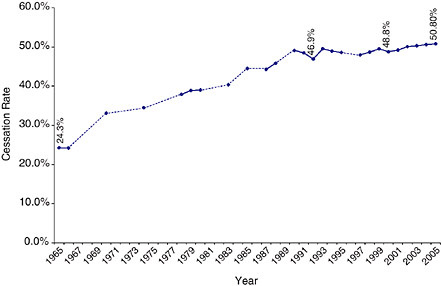
FIGURE 1-3 Cessation rate among adult EVER smokers selected years from 1965 to 2005 (all years for which NHIS data on annual cessation prevalence are available are included). Solid lines represent changes in cessation prevalence between consecutive years. Dotted lines represent approximate changes in cessation prevalence between nonconsecutive years.
SOURCES: (TIPS 2005a; CDC 2003, 2004b, 2005a,b, 2006b).
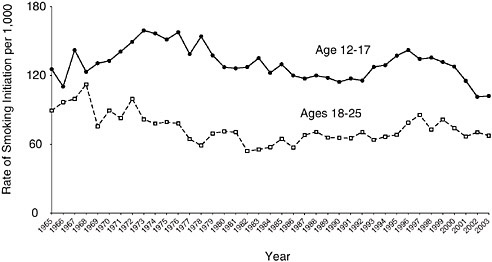
FIGURE 1-4 Smoking initiation rates among adolescents and young adults, 1965 to 2003.
SOURCE: (SAMHSA 2005).
Cigarette manufacturers also sought to expand the market for their products by recruiting women and youth smokers. Marketing efforts toward women increased dramatically in the late 1960s and early 1970s (Ernster 1985; Pierce et al. 1994). Products such as Virginia Slims grew popular through campaigns that depicted stylish, independent, and healthy women. In the 1980s and 1990s, manufacturers also turned increasingly to advertising directed toward youth to grow their market. For example, in 1988 R.J. Reynolds introduced the Joe Camel cartoon character, which quickly proved to be powerfully appealing to adolescents (DiFranza et al. 1991; Pierce et al. 1999). Between 1989 and 1993, Camel’s market share among adolescents increased by 64 percent (CDC 1994). Moreover, although advertising in magazines with high youth readership has declined since tobacco companies committed to avoid targeting youth as a condition of the Master Settlement Agreement, cigarette companies continue to promote their products in magazines that reach high percentages and numbers of young readers (FTC 2005; Krugman et al. 2005).
In addition to the techniques mentioned above, the tobacco industry has frequently turned to pricing strategies to increase tobacco consumption. The real price of cigarettes declined between 1955 and 1980 (Gruber 2001; IOM 1994). A doubling of the federal excise tax between 1982 and 1983 and an increase in the wholesale price of cigarettes preceded an estimated 5 percent decline in per-capita consumption between 1983 and 1984 (Chaloupka et al. 2002; Gruber 2001; IOM 1994). The tobacco industry responded by offering “branded generics,” discounted cigarettes marketed specifically at young adults who were more likely to quit smoking in response to the price increase. Many smokers switched to discounted generic brands, and the decline in consumption slowed by the early 1990s as the market share of discounted brands rose to nearly 40 percent (Chaloupka et al. 2002; Gruber 2001).
On April 2, 1993, a day referred to as Marlboro Friday, Philip Morris, Inc., led the industry in cutting the prices of premium brand cigarettes by offering Marlboros for a 40-cent-per-pack discount (Chaloupka et al. 2002; Gruber 2001; IOM 1994). The wholesale price of Marlboro’s premium cigarettes dropped from 123 cents per pack to 84 cents per pack to compete with discounted brands, which cost only 83 cents per pack, and deeply discounted brands, listed at 57 cents (Bulow and Klemperer 1998). That price cut helped to recapture the market for premium brands and to boost Philip Morris’s profits, as more than 80 percent of the company’s sales were in premium brands in 1997 (Bulow and Klemperer 1998).
After the Master Settlement Agreement in November 1998, the price of all brands was increased, in large part to cover the cost of the settlement. As a result, the price of premiums returned to their pre-Marlboro Friday nominal price (Bulow and Klemperer 1998). Premium brands have maintained
their dominance in the market over the past decade, actually gaining market share throughout the 1990s (Bulow and Klemperer 1998). Part of the reason for this increase in market share is the effect of discounting (Bulow and Klemperer 1998). In 2003, of the $15.15 billion reportedly spent on adverting and promotion, $10.8 billion (approximately 71 percent) was allocated to price discounts paid to retailers or wholesalers. These discounts allowed for reduced prices for consumers (FTC 2005). The percentage of disposable income that smokers spent on cigarettes fell from 1993 through 1998 but rose consistently through 2002 (Capehart 2004). The effect of price on consumption is discussed in more detail in Chapter 5.
RECENT TRENDS: A CLOSER LOOK
Wide-angle comparisons of measures of smoking behavior between 1965 and 2005 clearly show that the rates of tobacco consumption and smoking prevalence have declined among adults, the rate of smoking initiation has declined among adolescents, and the rate of smoking cessation has increased. However, a closer look at the trends over the past two decades tells a somewhat more complex story of both modest progress and some backsliding. For instance, although smoking prevalence has continued to decline in the new millennium, it appears that progress in some areas may now be stalling. These recent trends are examined more closely in this section.
Adult Prevalence
In 1985, nearly 30 of every 100 American adults were current smokers; by 2005, that figure had fallen to approximately 21 in 100 adults (CDC 2006b; National Center for Health Statistics 2005). That said, a closer look at the trend reveals a steep decline in the number of adults who were current smokers from 1985 through 1990, a slight increase in 1991-1992, and a relatively flat, although downward-sloping, curve from 1992 through 2005, as illustrated in Figure 1-2 (CDC 2006b; Mendez and Warner 2004; National Center for Health Statistics 2005). Moreover, although a reduction in the prevalence of adults who are current smokers occurred each year during the first half of this decade, data for 2005 reveals no change in adult prevalence from the previous year (CDC 2006b; TIPS 2006).
Data on the prevalence of smoking among men ages 25 to 64 years and women ages 35 to 64 each display a flattening of this downward-trending curve from the early 1990s through the mid-2000s for both genders (see Figures 1-5 and 1-6). Mendez and Warner were optimistic that smoking prevalence would continue to fall on course, as it had in the early 2000s, but they concluded that major reductions, such as those presented in the
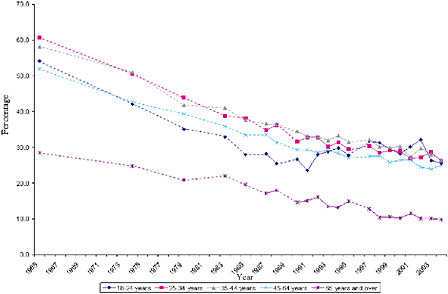
FIGURE 1-5 Age-specific prevalence rates among adult males, selected years, 1965 to 2003 (all years for which NHIS data on annual smoking prevalence are available are included). Solid lines represent changes in smoking prevalence between consecutive years. Dotted lines represent approximate changes in smoking prevalence between nonconsecutive years.
SOURCE: (National Center for Health Statistics 2006).
Healthy People 2010 target, were unrealistic (Mendez and Warner 2004). Predictive models of smoking prevalence reduction are presented and discussed further in Chapters 3 and 5 of this report.
Prevalence of Smoking Among Youth
From 1999 to 2006, the prevalence of daily smoking4 among 12th graders decreased dramatically, according to data from the Monitoring the Future survey. In 1999, the prevalence of daily smoking among 12th graders (23.1 percent) was roughly equal to that among adults (23.3 percent); by 2006, the rate of daily smoking for 12th graders had fallen to 12.2 percent5 (Johnston et al. 2006). This is a genuinely noteworthy decline. However, because trends in youth smoking behavior tend to fluctuate substantially, it is important to view this recent trend within a broader time frame. When
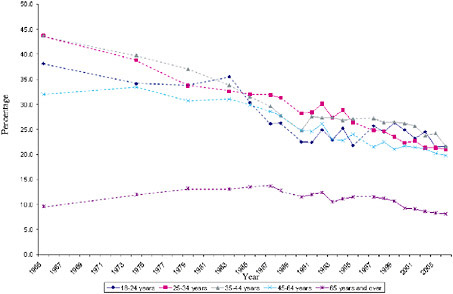
FIGURE 1-6 Age-specific prevalence rates among adult females, selected years, 1965 to 2003 (all years for which NHIS data on annual smoking prevalence are available are included). Solid lines represent changes in smoking prevalence between consecutive years. Dotted lines represent approximate changes in smoking prevalence between nonconsecutive years.
SOURCE: (National Center for Health Statistics 2006).
the decline in the prevalence of daily smoking among youth is viewed over a 15-year perspective, the long-term decline can be seen to be more modest. Comparison of the rates of daily smoking among 12th graders in 2006 with those in 1992, for example, reveals that daily smoking prevalence has dropped from 17.2 to 12.2, a 5 percentage point net decrease (Johnston et al. 2006), showing that much of the decline in youth prevalence rates in this century has simply offset the significant increase in youth smoking that had occurred in the 1990s. A similar pattern is shown by trends in 30-day prevalence (current smoking) among high school youth (see Figure 1-7 for the 12th grade data).
Not all indicators show a continuing downward trend, however. Daily smoking did not decline at all among 8th graders and 10th graders in 2006 (Johnston et al. 2007). Moreover, 2005 data from a separate source, the Centers for Disease Control and Prevention’s Youth Behavior Risk Surveillance System (YRBSS), show a slight rise in the prevalence of use among high school youth (combining grades 9 through 12) between 2003 and 2005, from 21.9 to 23 percent (CDC 2006a).
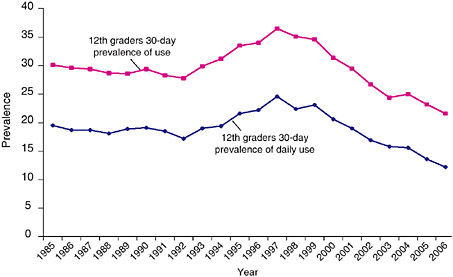
FIGURE 1-7 Smoking prevalence among 12th graders for selected years, 1985 to 2005.
SOURCE: (Johnston 2005, 2006, 2007).
In sum, there has been an impressive decline in the prevalence of youth smoking in the 21st century. However, trends of various measures of youth cigarette smoking from the last 15 years indicate that youth smoking rates tend to fluctuate considerably more than adult rates, and that it is likely that this recent decline will flatten out, or even turn upward again. In any case, the endemic level of youth smoking remains disturbingly high.
Intensity of Consumption
On average, smokers are smoking less than they did three decades ago; daily consumption among smokers began falling in 1979 (see Figure 1-8). Decreased daily consumption among smokers appears to be attributable largely to reduced smoking among heavy smokers; specifically, as shown in Figure 1-9, the percentage of smokers consuming more than 25 cigarettes per day was significantly smaller in 2004 than it was in 1993. Meanwhile, the percentage of smokers consuming between 5 and 14 cigarettes per day has increased since 1993, and the percentage of smokers consuming between 15 and 24 cigarettes per day has remained relatively flat over this time period (CDC 2005b).
The combined effect of the declining prevalence of adult smokers and the declining quantity smoked has led to a substantial decline in per-capita consumption over the last 20 years. Overall, per-capita consumption among
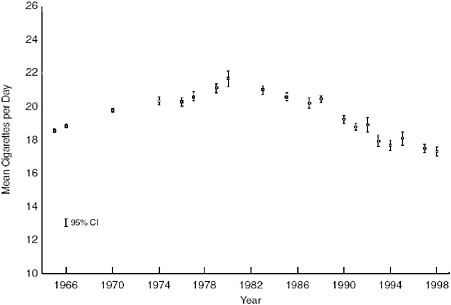
FIGURE 1-8 Mean number of cigarettes per day for all current smokers in each NHIS Survey Year. NOTE: Average number of cigarettes per day standardized to the age and race distribution of NHIS 1965. Brackets indicate 9 percent confidence intervals on the estimates.
SOURCE: (Burns et al. 2003).
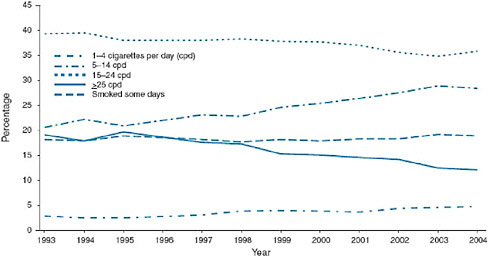
FIGURE 1-9 Percentage of daily smokers and smokers who smoked some days by number of cigarettes smoked, 1993 to 2004.
SOURCE: (CDC 2005b).
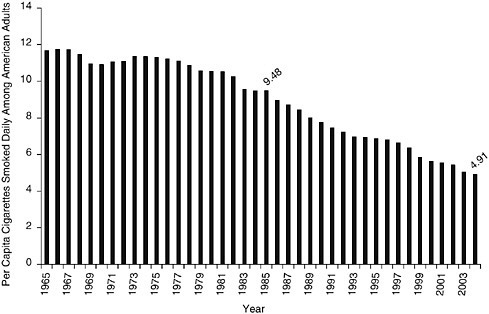
FIGURE 1-10 Daily per capita consumption of cigarettes among adults ages 18 and over, 1985 to 2004.
SOURCE: Calculations based on figures from ALA, 2006.
adults has decreased more than 48 percent since 1985, although it has declined unevenly from year to year, with annual changes ranging from 0.75 percent between 1994 and 1995 to 7.9 percent between 1998 and 1999 (following the Master Settlement Agreement and price increases) (ALA 2006) (see Figure 1-10).
Initiation
Recent data from the National Survey on Drug Use and Health (NSDUH) on smoking initiation rates6 among adolescents (ages 12–17 years) reveal a striking decline from 1996 through 2005. As suggested earlier, however, this recent decline must be seen in the context of the significant increases in initiation rates among youth that occurred in the early 1990s (see Figure 1-4). Thus, what might initially appear to be a sign of dramatic recent progress merely signals only slight reductions in smoking initiation rates among youth over the past decade. In 2001, for example, the smoking initiation rate was 115.3 per 1,000 youth, almost equal to the rate in 1992.
Moreover, the modest successes in reducing smoking initiation rates among adolescents during the past two decades have been offset by net increases in initiation among young adults (between 18 and 25 years of age) during the same time period. Figure 1-4 reveals that between 1985 and 2003, smoking initiation rates among young adults increased 4.3 percent, from 64.7 per 1,000 individuals to 67.5 per 1000 (SAMHSA 2005). The reduction in smoking initiation among adolescents and the increase in smoking initiation among young adults thus indicate delayed smoking initiation rather than pure abstinence, which could signify a moving target for antismoking campaigns. This conclusion is supported by prevalence data as well (Johnston et al. 2006).
Smoking Cessation
The rate at which smoking cessation increased in the 1960s and 1970s has slowed over time, as evidenced by the flattening of Figure 1-3. A comparison of the annual smoking cessation rates7 between 1992 and 2005 reveals that the largest annual increase occurred between 1992 and 1993, at 5.32 percent. During four periods (1993–1994, 1994–1995, 1995–1996, and 1999–2000), the smoking cessation rate actually declined from the previous year. The rates of cessation increased approximately 4 percent in the first five years of the 2000s. In 2000, 48.8 percent of adult ever smokers had quit smoking (TIPS 2005a). In 2005, 50.8 percent of adults who had ever smoked had quit smoking (CDC 2006b). Cessation seems to be approaching an asymptote, however, because the rate has increased an average of only 0.50 annually since 2002 (CDC 2004b, 2005a, 2005b, 2006b).
Correlates of Current Smoking
Tobacco use varies among individuals according to socioeconomic and demographic characteristics as well as by geography. Although smoking prevalence has declined overall since the 1960s, large disparities in rates of tobacco use among racial and ethnic groups and by socioeconomic status persist. The most vulnerable subpopulations—young people who start smoking early, individuals who are poor or uneducated, and some racial and ethnic minorities—are at the highest risk of being lifelong smokers. This section compares the differences in the prevalence of current smoking compared by age, race, sex, educational attainment, poverty status, and
geographic location. This section also highlights the subpopulations most in need of targeted efforts.
Age
Figures 1-5 and 1-6 show the trends in age-specific smoking prevalence among males and females, respectively (National Center for Health Statistics 2005). Older individuals (ages 65 years and older) are much less likely than young adults to be current smokers. This trend has been consistent for four decades. However, prevalence rates among adults younger than age 65 years have tended to converge. According to NSDUH data, young adults ages 18 to 25 years had the highest rate of current use of any tobacco product (44.3 percent) (SAMHSA 2006).
The oldest age group (those ages 65 years and older) comprises people who were in their youth when smoking prevalence and consumption were highest. The low prevalence of current smoking among individuals in this age group reflects the combined effect of smoking cessation efforts and smoking-related mortality. Figure 1-11 shows the trends in smoking cessation rates8 among four age groups. Individuals age 65 years and older are most likely to have been former smokers, and the cessation rate among individuals in that group has risen dramatically since 1965. However, quit rates have actually declined among adults ages 25 to 44 years since the mid-1990s and have flattened among those ages 18 to 24 years.
Understanding the natural history of smoking (also referred to as the “smoking career”) would help tobacco control programs identify the critical ages to be targeted for interventions. Unfortunately, few studies have followed the trajectory of the natural history of smoking from initiation to cessation. Compared with the careers of users of illegal drugs, which peak in the 20s and then trail off by the mid-30s, careers of cigarette smokers follow a different trajectory. This is partly because tobacco is more addictive than most other drugs, and smokers do not mature out of consuming tobacco, possibly because tobacco use doesn’t interfere with adult functioning, such as employment (Bachman et al. 2001; Kandel 2002). Unlike age-specific prevalence rates for illegal drug use, those for tobacco use remain elevated and flat beyond the late 20s (Chassin et al. 2000; 1996; Kandel 2002). Chen and Kandel (1995) monitored a cohort of adolescents and found that more than half of males and just under half of females were still smoking at ages 34 and 35, whereas 25.3 percent of males and 14.3 percent of females were using marijuana and 18.2 percent of males and 12.7 percent of females were using other illicit drugs at that same age.
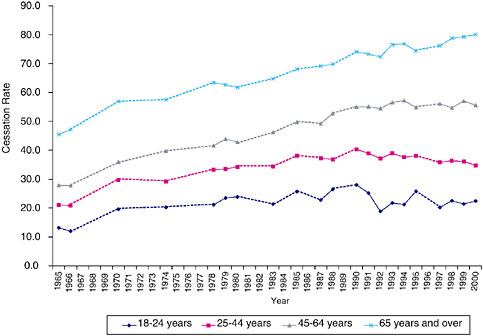
FIGURE 1-11 Age-specific cessation rates of ever smokers, selected years, 1965 to 2000 (all years for which NHIS data on prevalence of cessation are available are included). Solid lines represent changes in cessation prevalence between consecutive years. Dotted lines represent approximate changes in cessation prevalence between nonconsecutive years.
SOURCE: (TIPS 2005a).
It is difficult to predict how long a middle-aged smoker, for example, will continue before quitting, because smoking careers are highly dependent on the age at initiation, the quantity smoked, and the presence of nicotine dependence. Moreover, the quantity smoked, as well as the presence of nicotine dependence, is correlated with the age at initiation. With all else being equal, the older that a person is when he or she starts smoking, the likelihood that he or she will quit is higher and the probability that he or she will become dependent is lower (Hyland et al. 2004; Kandel 2002). Those who are dependent are more than twice as likely as nondependent smokers to continue smoking (Breslau et al. 2001). Hyland and colleagues (2004) found that there was a gradient in the cessation rate by age of initiation: 37.3 percent of those who started smoking when they were age 15 or younger had quit, 41.3 percent of those who started smoking when they were ages 16 to 19 years had quit, and 47.6 percent of those who started smoking when they were older than age 19 years had quit.
Race and Ethnicity
For the majority of years that smoking prevalence has been tracked by race, only African Americans and whites were compared. During many of those years, African American adults were reportedly more likely to be current smokers than were whites. Data from the National Health Interview Survey (NHIS) indicate that this differential may be reversing, starting with a convergence of the rates in the late 1990s and slightly lower rates among African Americans than among whites in the early 2000s. This is likely due to a drop in African American adolescent smoking, which continued into young adult years (CDC 1998). Race-specific smoking rates among adults are presented in Table 1-1. In 2004, approximately 22 percent of non-Hispanic whites and 20 percent of non-Hispanic African Americans were current smokers.
Data collected over the past decade and a half allow the rates of smoking among additional racial and ethnic groups to be identified and compared. Hispanics are less likely to be current smokers than non-Hispanic whites and non-Hispanic African Americans. An estimated 15.0 percent of Hispanic adults were current smokers in 2004, an 11 percent reduction in prevalence since 2002 (CDC 2004b, 2005b). Although Hispanics are less likely than non-Hispanics to be current smokers, Hispanic smokers are less likely to quit. In 2000, the rate of Hispanic smokers who had quit was 42.9 percent, whereas the rate was 49.2 percent among non-Hispanic smokers of all races (ALA 2006).
American Indian and Alaska Natives have the highest prevalence of current smoking in the United States. According to the 2004 NHIS, more than one-third of American Indian and Alaska Native adults currently smoke cigarettes. (Note that the estimates of the prevalence for the American Indian and Alaska Native population are based on small sample sizes and have wide variances. They should be interpreted with some caution.)
Asians have the lowest prevalence of current smoking among adults compared with those for all other racial and ethnic groups. In 2004, 11.3 percent of Asians were current smokers. Asians were 85 percent less likely than the general population of adults to be smokers. Asian women have
TABLE 1-1 Current Smoking Prevalence (Percent) by Race, 2002–2004
|
|
2004 |
2003 |
2002 |
|
Non-Hispanic white |
22.2 |
22.7 |
23.6 |
|
Non-Hispanic African American |
20.2 |
21.3 |
22.6 |
|
Hispanic |
15 |
16.4 |
16.7 |
|
American Indian or Alaska Native |
33.4 |
39.7 |
40.8 |
|
Asian |
11.3 |
11.7 |
13.3 |
|
SOURCE: (CDC 2004a, 2005b, 2005c). |
|||
the lowest prevalence of smoking of any group highlighted in the data: less than 5 percent in 2004 (CDC 2004b, 2005b).
Ethnic differences in smoking behavior are subsumed within the broad racial categories, concealing important differentials that could reflect a negative effect of American acculturation (Shelley et al. 2004). Data from the NSDUH reveal disparities in the rates of smoking among some Asian and Hispanic subgroups (CDC 2004a). In 1999 and 2000, Korean Americans were more likely to smoke than the general population (27.2 versus 26.5 percent), and the prevalence of smoking among Vietnamese-Americans was equal to the overall rate. Among Hispanics, Puerto Ricans were the most likely to smoke, with a prevalence rate of 30.4 percent. Puerto Ricans were the only group of Hispanics to be more likely to smoke than non-Hispanic whites or African Americans (CDC 2004a). Chinese American men were reported to have high rates of smoking in regional studies but not in the national survey (Shelley et al. 2004).
Racial differences in smoking status tend to obscure the depth of racial disparities in health that stem from tobacco smoking. Even though African Americans are no more likely to smoke than whites, they are more likely to from suffer smoking-related mortality than whites (CDC 1998; Gadgeel et al. 2001). Some have suggested that the smoking-related mortality differential between African Americans and whites is because African Americans overwhelmingly smoke menthol cigarettes, which are potentially more addictive (e.g., [IOM 2001]). In 2000, 68.9 percent of African American smokers aged 12 years and older smoked menthol cigarettes, whereas 22.4 percent of white smokers and 29.2 percent of Hispanic smokers smoked menthol cigarettes (Giovino et al. 2004).
Smoking cessation rates for African Americans are lower than those for whites (37.4 percent versus 50.3 percent in 2000) (ALA 2006), although these data might reflect the lag in smoking cessation among African Americans compared to whites. A recent study shows that promotional offers from the tobacco industry may be working to keep African American smokers from quitting. White and colleagues (2006) found that 43.0 percent of African American smokers reported that they used a promotional offer “every time I saw one,” whereas the rates were 39.1 percent for whites, 24.3 percent for Hispanics, 31.9 percent for Asian/Pacific Islanders, and 39.6 percent for other groups. Also, African Americans who smoked menthol brands (Newport or Kool) were more than twice as likely to use the promotional coupons as African Americans who smoked other brands (White et al. 2006).
Gender
Men are more likely to smoke than women. On average, men are also more likely to be heavy smokers and to smoke more cigarettes per day
(Giovino 2004). The greater prevalence of smoking among men is evident among groups subdivided by race and ethnicity and has persisted for decades. The gender gap in smoking has narrowed considerably since the 1970s, however (Giovino 2004). Since the mid-1980s, the prevalence of smoking among men and women has declined at similar rates. The difference in quit rates between men and women has also narrowed over time, particularly since the mid-1990s, and the rates are converging (Giovino 2004).
In 2004, 23.4 percent of men and 18.5 percent of women were current smokers.9 The gender difference is even larger within racial subgroups. Among Hispanics, for example, men are almost twice as likely as women to be smokers (prevalences of 18.9 percent among men and 10.9 percent among women). The rate of smoking among Asian men is almost four times higher than that among Asian women: 17.8 versus 4.8 percent. Differences in current smoking prevalence by gender are smaller among non-Hispanic whites, African Americans, and American Indians and Alaska Natives than among Asians or Hispanics, but are still evident (CDC 2005b).
Educational Attainment and Income
Smokers are increasingly likely to be poor and uneducated. As a result, smoking has contributed significantly to the disparity in the rates of mortality between those with lower levels and those with higher levels of educational attainment (Wong et al. 2002). According to NHIS, adults aged 25 years and over with a general educational development (GED) diploma were more likely to be current smokers than those with any other level of education (CDC 2004b). More than 40 percent of adults with a GED were current smokers in 2005. This group was followed by those who have completed 9 to 11 years of schooling, just under one-third of whom were current smokers. In general, current smoking prevalence decreased with increasing years of education (CDC 2006b).
Individuals whose household incomes are below the poverty threshold are significantly more likely to be smokers than those with incomes at or above the poverty level. In 2005, an estimated 29.9 percent of individuals living below the poverty level reported being a current smoker whereas 20.6 percent of those who had income levels at or above the threshold reported being a current smoker (CDC 2006b).
Dichotomous measures of socioeconomic status (SES) conceal the gradient effect of SES on smoking that has persisted over decades. Gilman and
colleagues (2003) found graduated rates of smoking behavior measures by several indicators of adult and childhood SES,10 showing that the smoking risk decreased and the rate of cessation increased among those at successively higher levels of SES. They also found that those with lower SES were more likely to initiate smoking, progress to become regular smokers, and sustain a smoking career than those with higher SES.
Figure 1-12 shows the smoking prevalence by four levels of income among the five major racial/ethnicity groups in the United States and among the total population, as estimated by Barbeau and colleagues (2004). The researchers based their findings on data from the 2000 NHIS, which revealed an overall weighted smoking prevalence rate of 25.9 percent. They found that when the smoking rates among all races and ethnicities are taken into account, smoking is the most prevalent among those who are poor (34.7 percent) and nearly poor (34.2 percent), lower among the middle income group (31.4 percent), and the lowest among the higher income subpopulation (20.7 percent). Within the total population and among whites and African Americans, there is a clear gradient in smoking prevalence level of income. Those in the higher income classification (representing individuals with annual incomes at 300 percent of the poverty level or higher and comprising 45 percent of the total sample) were significantly less likely to smoke than those at lower income levels. The gradient effect was much less pronounced among the lower-income classifications, although individuals in the middle (those with annual incomes between 200 and 299 percent of the poverty level) income category were less likely to be current smokers than those in the poor and near-poor categories. This phenomenon held true across the total population and among whites and African Americans (Barbeau et al. 2004).
The gradient effect is not evident among other racial/ethnic groups, however. Higher income was not protective against smoking for American Indians and Alaska Natives or Hispanics. For Asians, those in the highest and lowest income categories demonstrated a significantly reduced prevalence of smoking, whereas those in the middle-income category had the highest smoking rates of all groups divided by income levels (Barbeau et al. 2004).
The effects of income and education on smoking behavior are not clear-cut. Data from the 1999 and 2000 National Household Survey on Drug Abuse (NHSDA; NHSDA was renamed the National Survey on Drug Use and Health [NSDUH] in 2002) indicate an interaction between income and educational attainment and their effects on smoking prevalence. Figure 1-13 shows the difference in the ranking of smoking prevalence by educational attainment and various family income levels (SAMHSA 2002). College
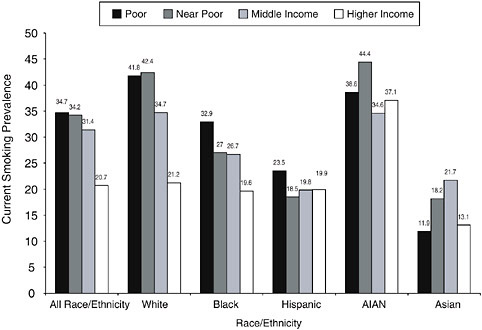
FIGURE 1-12 Adult smoking prevalence rates by race/ethnicity and poverty status.
SOURCE: (Barbeau et al. 2004).
graduates at all income levels are less likely to smoke. People with some college education with the lowest levels of family income (less than $20,000 annually) are the most likely to be smokers, but at higher levels of income, their smoking rates are below those of people with no college education (high school graduates and those who did not graduate from high school). Those who did not graduate from high school with lower income levels are less likely to be smokers than high school graduates and people with some college education. At the high levels of income, however, those who did not graduate from high school are the most likely to smoke.
State of Residence
Smoking prevalence and cessation vary widely by region and state. Regional smoking prevalence rates range from approximately 17 percent in the West to more than 23 percent in the Midwest, according to data from the Tobacco Use Supplement of the Current Population Survey for 2001–2002 (Hartman et al. 2004). Among the four regions defined here, the South has the second highest prevalence of smoking, but it contains three of the six states where smoking is the most prevalent (Kaiser Family Foundation 2006). The West had the highest quit rate according to these data: 39.5 percent of
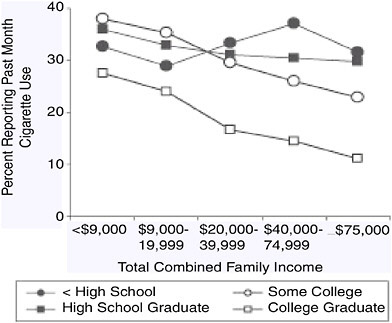
FIGURE 1-13 Prevalence of current cigarette use by family income and educational attainment.
people who have ever smoked reported having some cessation activity11 in the past year, including quitting. The least cessation activity occurred in the South, where 31.2 percent of ever smokers had cessation activity in the past year. Figures 1-14 and 1-15 provide trends in smoking prevalence and smoking cessation by U.S. state and territory in 2004, respectively.
In 2004, the prevalence of current smoking among adults in 49 states, the District of Columbia, Puerto Rico, and the Virgin Islands was estimated by using data from the Behavior Risk Factor Surveillance Survey (CDC 2005c). Hawaii was excluded from the analysis because of insufficient data. Among the 52 locations for which smoking behavior was described, the current smoking rates varied widely. In the states ranking the highest among current smokers, more than a quarter of the adult population currently smokes. Those states include Kentucky (27.6 percent), West Virginia (26.9
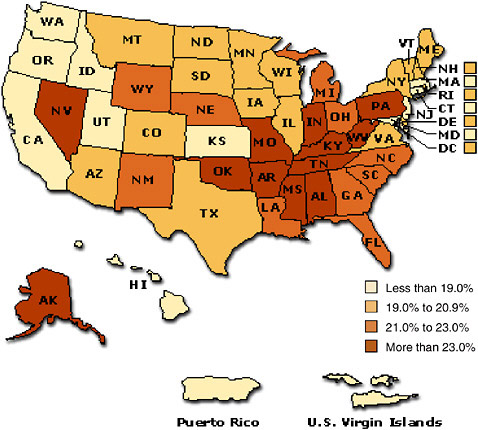
FIGURE 1-14 Smoking prevalence among adults by state or territory, 2005.
SOURCE: (Kaiser Family Foundation 2006). Located at: http://www.statehealthfacts.org/cgi-bin/healthfacts.cgi?previewid=292&action=compare&category=Health+Status&subcategory=Smoking&topic=Adult+Smoking+Rate.
percent), Oklahoma (26.1 percent), Tennessee (26.1 percent), Ohio (25.9 percent), and Arkansas (25.7 percent). The states that ranked the lowest in current smoking had prevalence rates of less than 15 percent. Only two of the contiguous 48 states met this criterion: California with 14.9 percent and Utah with 10.5 percent. Puerto Rico and the Virgin Islands also had very low current smoking prevalence rates: 12.7 and 9.5 percent, respectively.
State-level cessation rates ranged from 42.5 percent in Kentucky to 62.5 percent in Connecticut. Kentucky, the state with the highest smoking prevalence rate, also had the lowest quit rate (CDC 2005c). Of the six states with the lowest quit rates, three (Tennessee with 45.9 percent, Ohio with 49.0 percent, and Kentucky with 46.1 percent) also ranked in the top six in smoking prevalence. All six of the states ranking the highest among current
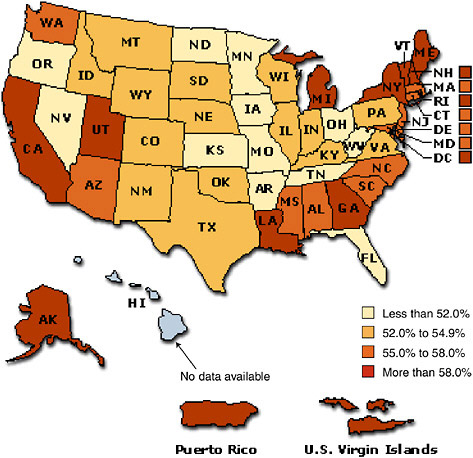
FIGURE 1-15 Smoking cessation prevalence among adults by state or territory, 2004.
SOURCE: (Kaiser Family Foundation 2006). Located at: http://www.statehealthfacts.org/cgi-bin/healthfacts.cgi?previewid=3&action=compare&category=Health+Status&subcategory=Smoking&topic=Attempts+to+Quit+Smoking.
smokers had quit rates of less than 50 percent. In the states with the highest quit rates, 60 percent or more of individuals who had ever smoked had quit. These included Utah (60.1 percent), Vermont (60.5 percent), California (62.0 percent), and Connecticut (62.5 percent). All four of these states had smoking prevalence rates at or below 20.0 percent.
Many factors contribute to the differences in the smoking cessation prevalence and smoking cessation rates among states, including the demographic and social characteristics of the state populations. The communities with large percentages of poor populations and populations with low levels of education tend to have the highest prevalence of smoking (Dell et al.
2005). As discussed in Chapter 5, it is likely that variations in the levels of tobacco control activities among the states also account for some of these variations in smoking prevalence. It is widely accepted that California’s lower prevalence is attributable at least in part to the intensity of tobacco control efforts in that state (CDC 1996). Kuiper and colleagues (2005) present evidence that comprehensive state programs reduce the prevalence of smoking among adults and adolescents at the state and national levels. Jemal and colleagues (2003) examined comprehensive smoking cessation programs among 33 states and found that the intensity of the program had a very large negative correlation with the prevalence of current smoking (r = −0.81, p < 0.0001) and a large positive correlation with the quit rate (r = 0.82, p < 0.0001) among adults ages 30 to 39 years. The impact of comprehensive state tobacco control programs is discussed in more detail in Chapter 5 of this report.
States with a high prevalence of smoking among adults also have high rates of smokers who made no attempt to change their behavior in the last year (Burns and Warner 2003), suggesting that environment plays a role in sustaining smoking behavior or promoting cessation efforts.
Comorbidity
Several recent studies have documented a relationship between mental illness and smoking among adults and adolescents (Black et al. 1999; Lasser et al. 2000; Upadhyaya et al. 2002). As used by Lasser and colleagues (2000), the term “mental illness” in this context is defined very broadly to include major depression, bipolar disorder, dysthymia, panic disorder, agoraphobia, social phobia, simple phobia, generalized anxiety disorder, alcohol abuse, alcohol dependence, drug abuse, drug dependence, antisocial personality, conduct disorder, or nonaffective psychosis (Lasser et al. 2000). Adults who currently experience symptoms of these disorders smoke more than 44 percent of the cigarettes consumed in the United States (Lasser et al. 2000). Lasser and colleagues also found that adults with a lifetime history of mental illness (broadly defined as above) were more likely to be current smokers than adults with no history of mental illness. Adults with mental illnesses manifesting within the past month were the most likely to smoke and the least likely to quit. Figure 1-16 compares the smoking prevalence and cessation rates by mental illness status. The study also revealed that those with a larger number of mental illness comorbidities have a greater likelihood of smoking and a greater tendency to smoke heavily.
EMERGING CHALLENGES
Although the prevalence of smoking among adults continues a 40-year decline, some recent trends suggestive of a flattening in rates of adult smok-
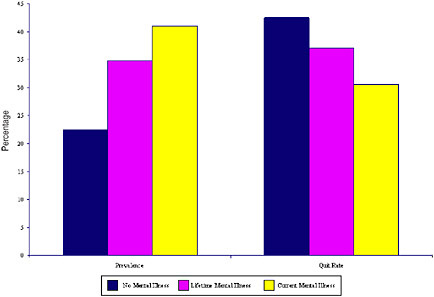
FIGURE 1-16 Current smoking prevalence and quit rates among individuals ages 15 to 54 years by mental illness status.
SOURCE: (Lasser et al. 2000).
ing and cessation raise an important question: Are tobacco control programs confronting a hardening target? The term “hardening” is used in this context to refer to the residual smokers who either resist cessation efforts or who have more difficulty quitting than former smokers (Burns and Warner 2003). For the purposes of this report, the key question is the one posed by a recent National Cancer Institute monograph: Is achieving abstinence harder, and do changes to interventions need to be made? This chapter has identified several subpopulations that appear to pose an elevated risk of lifelong smoking. Because these groups are more likely to continue to smoke despite cessation efforts, it seems likely that more aggressive efforts may be needed to reach them and to change their behavior.
Another potentially worrisome trend is the increase in initiation by young adults (18–24) and a possible increase in occasional smoking that may be associated with it. Such an increase was shown in one national survey (CDC 2005b), but not in another, (see Figure 1-9). Occasional smokers differ from heavier or hard-core smokers in many ways: occasional smokers are more highly educated whereas hard-core smokers have lower levels of education; occasional smokers are more likely to be racial and ethnic minorities whereas hard-core smokers are more likely to be white; and hard-core smokers tend to begin smoking at an earlier age (Augustson and Marcus 2004). Whether an increase in occasional smoking, if it is occurring, signals a more difficult challenge for tobacco control is not altogether clear. Percentage
SUMMARY
The phenomenal increase in tobacco use over the course of the 20th century was finally reversed in the wake of the publication of the Surgeon General’s important report in 1964. The data reviewed in this chapter suggest that the gradual decline in tobacco use since 1965 can be divided into two phases, the first running from 1965 to about 1980 and the second running from 1980 to the present. During the initial period, there was a sharp decline in smoking prevalence, accompanied by a modest increase in the average number of cigarettes smoked per day by smokers. Since then, however, the continued decline in smoking prevalence has been accompanied by a substantial decline in cigarettes smoked per day among those who smoke. As will be explained in Chapters 3 and 5, the committee believes that a substantial portion of the declines in smoking prevalence and smoking intensity over the past 25 years is attributable to tobacco control interventions, especially price increases and the emergence of a strong antismoking social norm.
In the committee’s opinion, the data suggest that the Surgeon General’s 1964 report and the dissemination of information on the adverse health effects of smoking had a strong impact on smoking prevalence. However, industry efforts to respond to the health threat of smoking by promoting filtered and so-called “light” cigarettes tended to counteract the effects of antismoking messages and to sustain smoking by those who smoked the most heavily. This interpretation would explain the increase in smoking intensity during this initial phase of tobacco control activity. During the second phase of tobacco control efforts, however, the tobacco industry’s dominance of the playing field was finally challenged by strong advocacy at the local and state levels and by significant increases in price. These efforts not only sustained the downward trend in prevalence but also helped to cut down on the intensity of smoking among a significant portion of smokers.
If this overall interpretation is correct, it suggests that continued implementation of strong tobacco control interventions will be needed to sustain progress. However, it also tends to highlight some important warning signs. First, tobacco control efforts will need to address the needs of a residual population of smokers who are particularly difficult to influence (e.g., smokers with mental illness). Second, a disturbing increase in later-onset, less frequent smoking by 18- to 25-year-olds could portend a growing cohort of new smokers who may be overlooked by traditional prevention programs for teens and by traditional cessation programs developed for older smokers. Finally, the volatile and frequently high rate of initiation of smoking among teens poses a continuing obstacle to society’s long-term goal of reducing the public health burden of tobacco use.
REFERENCES
ALA (American Lung Association). 2004. Trends in Tobacco Use. New York: American Lung Association.
ALA. 2006. Trends in Tobacco Use. New York: American Lung Association.
Arnett JJ. 1999. Winston’s “No Additives” campaign: “straight up”? “No bull”? Public Health Reports 114(6):522-527.
Augustson E, Marcus S. 2004. Use of the current population survey to characterize subpopulations of continued smokers: a national perspective on the “hardcore” smoker phenomenon. Nicotine and Tobacco Research 6(4):621-629.
Bachman JG, O’Malley PM, Johnston LD, Schulenberg JE, Ludden AB, Merline AC. 2001. The Decline of Substance Use in Young Adulthood: Changes in Social Activities, Roles, and Beliefs. Research Monographs in Adolescence. Mahwah, NJ: Lawrence Erlbaum Associates, Inc.
Barbeau EM, Krieger N, Soobader MJ. 2004. Working class matters: socioeconomic disadvantage, race/ethnicity, gender, and smoking in NHIS 2000. American Journal of Public Health 94(2):269-278.
Black DW, Zimmerman M, Coryell WH. 1999. Cigarette smoking and psychiatric disorder in a community sample. Annals of Clinical Psychiatry 11(3):129-136.
Brandt AM. 2007. The Cigarette Century: The Rise, Fall, and Deadly Persistence of the Product That Defined America. New York: Basic Books.
Breslau N, Johnson EO, Hiripi E, Kessler R. 2001. Nicotine dependence in the United States: prevalence, trends, and smoking persistence. Archives of General Psychiatry 58(9):810-816.
Bulow J, Klemperer P. 1998. The tobacco deal. Brookings Papers on Economic Activity. Microeconomics 1998:323-394.
Burns DM, Lee L, Shen LZ, Gilpin E, Tolley HD, Vaughn J, Shanks TG. 1997. Cigarette smoking behavior in the United States. Changes in Cigarette Related Disease Risks and Their Implication for Prevention and Control. Smoking and Tobacco Control Monograph No. 8. Bethesda, MD: DHHS, National Institutes of Health, National Cancer Institute. Pp. 13-112.
Burns DM, Major JM, Shanks TG. 2003. Changes in Number of Cigarettes Smoked per Day: Cross-Sectional and Birth Cohort Analyses Using NHIS. Those Who Continue to Smoke: Is Achieving Abstinence Harder and Do We Need to Change Our Approach? Smoking and Tobacco Control Monograph 15. Bethesda, MD: U.S. Department of Health and Human Services, National Institutes of Health, National Cancer Institute. Pp. 83-99.
Burns DM, Warner KE. 2003. Smokers who have not quit: is cessation more difficult and should we change our strategies? Those Who Continue to Smoke: Is Achieving Abstinence Harder and Do We Need to Change Our Approach? Smoking and Tobacco Control Monograph 15. Bethesda, MD: U.S. Department of Health and Human Services, National Institutes of Health, National Cancer Institute. Pp. 11–32.
Capehart T. 2004. The Changing Tobacco User’s Dollar. Washington, DC: Economic Research Service, U.S. Department of Agriculture.
Capehart T. 2005. Tobacco Outlook: Tobacco Acreage Plunges for 2005 Crop Year. Washington, DC: Economic Research Service, U.S. Department of Agriculture.
CDC (Centers for Disease Control and Prevention). 1994. Changes in the cigarette brand preferences of adolescent smokers—United States, 1989–1993. MMWR (Morbidity and Mortality Weekly Report) 43(32):577-581.
CDC. 1996. Cigarette smoking before and after an excise tax increase and an antismoking campaign—Massachusetts, 1990–1996. MMWR (Morbidity and Mortality Weekly Report) 45(44):966-970.
CDC. 1998. Tobacco use among US racial/ethnic minority groups, A report of the Surgeon General, 1998, Executive Summary. Tobacco Control 7:198–209.
CDC. 2003. Cigarette smoking among adults—United States, 2001. MMWR. (Morbidity and Mortality Weekly Report) 52(40):953–980.
CDC. 2004a. Prevalence of cigarette use among 14 racial/ethnic populations—United States, 1999–2001. MMWR. (Morbidity and Mortality Weekly Report) 53(3):49–52.
CDC. 2004b. Cigarette smoking among adults—United States, 2002. Journal of the American Osteopathic Association 104(8):324–327.
CDC. 2005a. Cigarette smoking among adults—United States, 2003. MMWR (Morbidity and Mortality Weekly Report) 54(20):509–528.
CDC. 2005b. Cigarette smoking among adults—United States, 2004. MMWR (Morbidity and Mortality Weekly Report) 54(44):1121-1124.
CDC. 2005c. State-specific prevalence of cigarette smoking and quitting among adults—United States, 2004. MMWR (Morbidity and Mortality Weekly Report) 54(44):1124-1127.
CDC. 2006a. Cigarette use among high school students—United States, 1991–2005. MMWR (Morbidity and Mortality Weekly Report) 55(26 ):724-726.
CDC. 2006b. Tobacco use among adults—United States, 2005. MMWR (Morbidity and Mortality Weekly Report) 55(42):1145-1148.
Chaloupka FJ, Cummings KM, Morley CP, Horan JK. 2002. Tax, price and cigarette smoking: evidence from the tobacco documents and implications for tobacco company marketing strategies. Tobacco Control 11(Suppl 1):I62-I72.
Chassin L, Presson CC, Pitts SC, Sherman SJ. 2000. The natural history of cigarette smoking from adolescence to adulthood in a midwestern community sample: multiple trajectories and their psychosocial correlates. Health Psychology 19(3):223-231.
Chassin L, Presson CC, Rose JS, Sherman SJ. 1996. The natural history of cigarette smoking from adolescence to adulthood: demographic predictors of continuity and change. Health Psychology 15(6):478-484.
Chen K, Kandel DB. 1995. The natural history of drug use from adolescence to the mid-thirties in a general population sample. American Journal of Public Health 85(1):41-47.
Dell JL, Whitman S, Shah AM, Silva A, Ansell D. 2005. Smoking in 6 diverse Chicago communities—a population study. American Journal of Public Health 95(6):1036-1042.
DHHS (U.S. Department of Health and Human Services). 2000a. Reducing Tobacco Use: A Report of the Surgeon General. Atlanta, GA: DHHS, CDC, National Center for Chronic Disease Prevention and Health Promotion, Office on Smoking and Health.
DHHS. 2000b. Reducing Tobacco Use: A Report of the Surgeon General. Atlanta, GA DHHS.
DiFranza JR, Richards JW, Paulman PM, Wolf-Gillespie N, Fletcher C, Jaffe RD, Murray D. 1991. RJR Nabisco’s cartoon camel promotes camel cigarettes to children. Journal of the American Medical Association 266(22):3149-3153.
Ernster VL. 1985. Mixed messages for women. A social history of cigarette smoking and advertising. New York State Journal of Medicine 85(7):335-340.
FTC (Federal Trade Commission). 2005. Cigarette Report for 2003. Washington, DC: FTC.
FTC. 2007. Cigarette Report for 2004 and 2005. Washington, DC: FTC.
Gadgeel SM, Severson RK, Kau Y, Graff J, Weiss LK, Kalemkerian GP. 2001. Impact of race in lung cancer: analysis of temporal trends from a surveillance, epidemiology, and end results database. Chest 120(1):55-63.
Gardiner PS. 2004. The African Americanization of menthol cigarette use in the United States. Nicotine and Tobacco Research 6(Suppl 1):S55-S65.
Gilman SE, Abrams DB, Buka SL. 2003. Socioeconomic status over the life course and stages of cigarette use: initiation, regular use, and cessation. Journal of Epidemiology and Community Health 57(10):802-808.
Giovino GA. 2002. Epidemiology of tobacco use in the United States. Oncogene 21(48): 7326-7340.
Giovino GA. 2004. Epidemiology of Tobacco Use in the United States. PowerPoint Presentation presented to the IOM meeting Reducing Tobacco Use.
Giovino GA, Sidney S, Gfroerer JC, O’Malley PM, Allen JA, Richter PA, Cummings KM. 2004. Epidemiology of menthol cigarette use. Nicotine and Tobacco Research 6(Suppl 1):S67-S81.
Giovino GA, Tomar SL, Reddy MN, Peddicord JP, Zhu B-P, Escobedo LG, Eriksen MP. 1996. Attitudes, knowledge, and beliefs about low-yield cigarettes among adolescents. National Cancer Institute. The FTC Cigarette Test Method for Determining Tar, Nicotine, and Carbon Monoxide Yields of U.S. Cigarettes (Smoking and Tobacco Control, Monograph 7). Bethesda, MD: National Institutes of Health. Pp. 39-57.
Gruber J. 2001. Tobacco at the crossroads: the past and future of smoking regulation in the United States. The Journal of Economic Perspectives 15(2):193-212.
Hamilton JL. 1972. The demand for cigarettes: advertising, health scare, and the cigarette advertising ban. Review of Economics and Statistics 54:401-411.
Hartman A, Willis G, Lawrence D, Gibson JT. 2004. The 2001–2002 Tobacco Use Supplement to the Current Population Survey (TUS-CPS): Representative Survey Findings. Web Page. Available at: http://riskfactor.cancer.gov/studies/tus-cps/results/data9899/cps_results.pdf.
Havrilesky T, Barth R. 1969. Tests of market share stability in the cigarette industry 1950– 1966. The Journal of Industrial Economics 17(2):145-150.
Hyland A, Li Q, Bauer JE, Giovino GA, Steger C, Cummings KM. 2004. Predictors of cessation in a cohort of current and former smokers followed over 13 years. Nicotine and Tobacco Research 6(Suppl 3):S363-S369.
IOM (Institute of Medicine). 1994. Growing Up Tobacco Free: Preventing Nicotine Addiction in Children and Youth. Washington, DC: National Academy Press.
IOM. 2001. Clearing the Smoke: Assessing the Science Base for Tobacco Harm Reduction. Washington, DC: National Academy Press.
Jemal A, Cokkinides VE, Shafey O, Thun MJ. 2003. Lung cancer trends in young adults: an early indicator of progress in tobacco control (United States). Cancer Causes and Control 14(6):579-585.
Johnston LD, O’Malley PM, Bachman JG, Schulenberg JE. 2006. Monitoring the Future: National Results on Adolescent Drug Use: Overview of Key Findings, 2005. (NIH Publication No. 07-6202). Bethesda, MD: National Institute on Drug Abuse. P. 71.
Johnston LD, O’Malley PM, Bachman JG, Schulenberg JE. 2007. Monitoring the Future: National Results on Adolescent Drug Use: Overview of Key Findings, 2006. (NIH Publication No. 07-6202). Bethesda, MD: National Institute on Drug Abuse.
Kaiser Family Foundation. 2006. Percent of Adults Who Are Smokers, 2004. Web Page. Available at: http://www.statehealthfacts.kff.org/cgi-binhealthfacts.cgi?action=compare&category=Health+Status&subcategory=Smoking&topic=Smoking+Rate; accessed April 3, 2006.
Kandel DB. 2002. Natural History of Smoking and Nicotine Dependence. In The Royal Society of Canada, ed. Proceedings of the Royal Society of Canada 2002 Symposium on Addictions: Impact on Canada. Ottawa, Ontario: Royal Society of Canada.
Krugman DM, Quinn WH, Sung Y, Morrison M. 2005. Understanding the role of cigarette promotion and youth smoking in a changing marketing environment. Journal of Health Communication 10(3):261-278.
Kuiper NM, Nelson DE, Schooley M. 2005. Evidence of Effectiveness: A Summary of State Tobacco Control Program Evaluation Literature. Atlanta, GA: DHHS, CDC, National Center for Chronic Disease Prevention and Health Promotion, Office on Smoking and Health.
Lasser K, Boyd JW, Woolhandler S, Himmelstein DU, McCormick D, Bor DH. 2000. Smoking and mental illness: a population-based prevalence study. Journal of the American Medical Association 284(20):2606-2610.
Mendez D, Warner KE. 2004. Adult cigarette smoking prevalence: declining as expected (not as desired). American Journal of Public Health 94(2):251-252.
National Center for Health Statistics. 2005. Health, United States, 2005. Hyattsville, MD: U.S. Government Printing Office.
National Center for Health Statistics. 2006. Health, United States, 2006. Hyattsville, MD: U.S. Government Printing Office.
Pierce JP, Gilpin EA, Choi WS. 1999. Sharing the blame: smoking experimentation and future smoking-attributable mortality due to Joe Camel and Marlboro advertising and promotions. Tobacco Control 8(1):37-44.
Pierce JP, Lee L, Gilpin EA. 1994. Smoking initiation by adolescent girls, 1944 through 1988. An association with targeted advertising. Journal of the American Medical Association 271(8):608-611.
Pollay RW, Dewhirst T. 2002. The dark side of marketing seemingly “Light” cigarettes: successful images and failed fact. Tobacco Control 11(Suppl 1):I18-I131.
R.J. Reynolds. 2006. R.J. Reynolds Tobacco Company History. Web Page. Available at: http://www.brownandwilliamson.com/company/profileHistory.aspx; accessed April 5, 2006.
SAMHSA (Substance Abuse and Mental Health Services Administration). 2002. The NHSDA Report: Tobacco Use, Income, and Educational Level. Web Page. Available at: http://oas.samhsa.gov/2k2/Tob/tob.pdf; accessed May 19, 2006.
SAMHSA. 2005. Table 4.18A Numbers (in Thousands) of Persons Who Initiated Cigarette Use in the United States, Their Mean Age at First Use, and Rates at First Use (Per 1,000 Person-Years of Exposure): 1965-2003, Based on 2002-2004 NSDUHs. Web Page. Available at: http://oas.samhsa.gov/NSDUH/2k4nsduh/2k4tabs/Sect4peTabs1to50.htm#tab4.18a; accessed May 18, 2006.
SAMHSA. 2006. Results from the 2005 National Survey on Drug Use and Health: National Findings. Web Page. Available at: http://oas.samhsa.gov/nsduh/2k5nsduh/2k5results.pdf; accessed November 28, 2006.
Schoenberg EH. 1933. The demand curve for cigarettes. The Journal of Business of the University of Chicago 6(1):15-35.
Shelley D, Fahs M, Scheinmann R, Swain S, Qu J, Burton D. 2004. Acculturation and tobacco use among Chinese Americans. American Journal of Public Health 94(2):300-307.
TIPS (Tobacco Information and Prevention Source). 2005a. Percentage of Adult Ever Smokers Who Are Former Smokers (Prevalence of Cessation), Overall and by Sex, Race, Hispanic Origin, Age, and Education, National Health Interview Surveys, Selected Years-United States, 1965–2000. Web Page. Available at: http://www.cdc.gov/tobacco/research_data/adults_prev/adstat4print.htm; accessed October 26, 2006.
TIPS. 2005b. Percentage of Adults Who Were Current, Former, or Never Smokers, Overall and by Sex, Race, Hispanic Origin, Age, and Education, Ever Smokers Who Are Former Smokers (Prevalence of Cessation), Overall and by Sex, Race, Hispanic Origin, Age, and Education, National Health Interview Surveys, Selected Years-United States, 1965–2000. Web Page. Available at: http://www.cdc.gov/TOBACCO/research_data/adults_prev/adstat1.htm; accessed December 1, 2006.
TIPS. 2006. Smoking Prevalence Among U.S. Adults. Web Page. Available at: http://www.cdc.gov/tobacco/research_data/adults_prev/prevali.htm; accessed December 7, 2006.
Upadhyaya HP, Deas D, Brady KT, Kruesi M. 2002. Cigarette smoking and psychiatric comorbidity in children and adolescents. Journal of the American Academy of Child and Adolescent Psychiatry 41(11):1294-1305.
White VM, White MM, Freeman K, Gilpin EA, Pierce JP. 2006. Cigarette promotional offers who takes advantage? American Journal of Preventive Medicine 30(3):225-231.
Wong MD, Shapiro MF, Boscardin WJ, Ettner SL. 2002. Contribution of major diseases to disparities in mortality. New England Journal of Medicine 347(20):1585-1592.


