
ATTACHMENT 1
EXPERIMENTAL OBJECTIVES OF DNA MICROARRAY STUDIES
Kevin K. Dobbin, Ph.D.
Biometric Research Branch
National Cancer Institute
National Institutes of Health
Bethesda, Maryland
Good gene expression microarray studies have clear objectives. These objectives will typically not be to confirm hypotheses about individual genes or pathways, because this could often be done more effectively with lower throughput assays. Instead, the hypotheses will be more general and include hundreds or thousands of genes. Having clear objectives is important for study design because no one design is best for every set of objectives, and so the choice of study design should be guided by the objectives.
Three common types of objectives in microarray studies are class comparison, class prediction and class discovery. In class comparison studies, the goal is to identify genes differentially expressed among predefined classes of samples. For example, Hossain et al. (2000) measured gene expression before and after toxic exposure to identify mechanisms of action of the toxicant, and Lu et al. (2001) compared liver biopsies from individuals in China with chronic arsenic exposure to those from healthy individuals to identify how the toxicant altered gene expression. In class prediction studies, one also has predefined classes but the goal is to develop a method for predicting class membership from gene expression data. An example of class prediction appears in Thomas et al. (2001), where a multi-gene predictor of toxic outcome was developed. In class discovery studies, one does not have predefined classes, but instead the classes are constructed during the course of the data analysis, typi-
cally by cluster analysis methods. One can cluster either the samples or the genes. Samples are typically clustered to identify structure in an otherwise homogeneous collection of samples, or to identify a novel taxonomy for the samples. An example of clustering genes in a study appears in Huang et al. (2001), where gene expression was measured at key time points after a toxic insult in order to gain insight into genetic regulation.
LEVELS OF REPLICATION
Because of the complexity of the microarray assay, replication can be performed at many different levels. But for experimental design purposes, it is important to distinguish between two general types of replicates, technical replicates and biologic replicates. Technical replicates occur when the same sample is measured multiple times. For example, one may pipette out multiple RNA samples from the same test tube and run each on a different array. Biologic replicates occur when different samples are measured on different arrays. For example, when studying populations of humans or animals, biologic replicates occur when each array is associated with a different person or animal. In cell culture experiments, the analogue to biologic replication occurs when one re-grows the cells under the same condition for each array (independent replication).
Figure 1-1 shows the effect of replication level choice on class comparison estimates. Here the number of arrays from each of two classes is fixed at 12. On the x-axis is the number of technical replicates performed on each sample; for example, a 1 corresponds to having one array performed for each of 12 samples; and a 2 corresponds to having two arrays performed for each of 6 samples. The open circles represent the accuracy of the individual sample estimates and the closed squares the accuracy of the class estimates. The figure shows that as the number of technical replicates per sample increases, so that the accuracy of each individual sample measurements gets better, the accuracy of the class estimates simultaneously gets worse. But the more accurate the class estimates are, the better the quality of the gene list. Hence the best gene list will result from the design that assigns one sample to each array with no technical replication.
Independent biologic replicates are required for valid statistical inference, because one needs some estimate of the variation in expres-
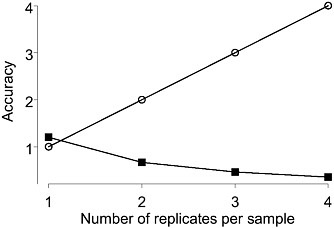
FIGURE 1-1 Accuracy (inverse of the variance of the mean estimate) of sample estimates (open circles) and class estimates (closed squared) as the number of technical replicates per sample increases from 1 to 4. Fixed number of 12 arrays per each of two class assumed. Source: Dobbin et al. 2003.
sion in the population. If, for example, one only has one sample from each of two classes, then one cannot assess the statistical significance of observed fold changes without knowing whether these are outside the range of the normal biologic variations observed in the populations. In general, the higher the level of replication the better, so that biologic replicates are preferable to technical replicates. While technical replicates can be informative in some cases, for instance for quality control, in general systematic technical replication on all samples results in poor study design. One obvious exception is when there are a limited number of samples available.
Spotted arrays typically use two dyes. This permits two expression measurements to be made at each spot. This is important because spot-to-spot variation tends to be large in spotted arrays, and may drown out the gene expression differences one is trying to detect. Having two measurements at each spot makes it possible, by designing and analyzing the study properly, to eliminate the spot variation from the gene expression comparisons.
Experimental designs that have been used for microarray studies include reference designs, balanced block designs, all pairs designs, loop designs, and variations on loop designs. For the experimental objectives under discussion here, usually a reference design or a balanced block design will be the best to use. Figure 1-2 shows an example of a reference design and of a balanced block design. The reference design uses a common reference sample which is applied to every array and is always tagged with the same dye (in the figure, this is Cy3, but it could also be Cy5). Each sample under study is tagged with the other dye and paired with one of the reference samples on an array. With this design, the expression level of each sample relative to the reference sample is measured for each gene. This permits one to also assess the expression level of any sample relative to any other sample by connecting them together using these relations to the reference. The balanced block design does not use a reference sample. With just two classes, the balanced block design pairs together one sample from each class on each array. For any class, one tags half the samples from that class with each dye.
Table 1-1 shows the relative efficiency of the balanced block design compared to the reference design for a class comparison experiment. A relative efficiency of 2.4 means that 2.4 times as many arrays are required for a reference design to equal the accuracy of a balanced block design. This is the relative efficiency for two classes, and it depends on the ratio of technical to biologic variation (Dobbin and Simon 2002). As the number of classes increases, the relative efficiency decreases, but the balanced block design will always be more efficient than the reference design.
The balanced block design does have some drawbacks. Because there is no common reference to connect all the samples, samples on different arrays cannot be compared effectively. This means, for example, that cluster analysis of the samples will perform very poorly with this type of design (it will essentially not be possible). It also means that if there is more than one way to classify the samples (for example, in cancer one can classify by tumor grade or by tumor stage), then the balanced
TABLE 1-1 Relative Efficiency of the Balanced Block (BB) Design Compared with the Reference (R) Design
|
Number of Classes Being Compared |
Relative Efficiency (BB/R) |
|
2 |
2.4 |
|
3 |
1.8 |
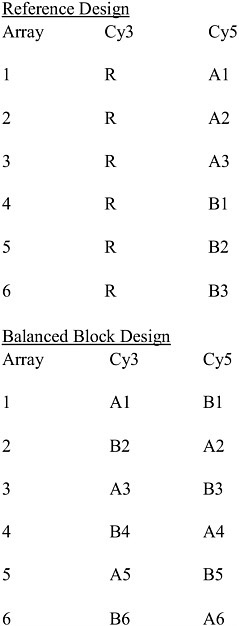
FIGURE 1-2 Examples of a reference design and a balanced bock design. There are two classes, A and B. For example, “A1” indicates biologic sample 1 from class A. “R” indicates the reference sample, which is subsampled multiple times. Cy3 and Cy5 are dyes (green and red, respectively) used to label the samples. Source: Adapted from Dobbin et al. 2003.
block design may make some of these alternative comparisons impossible or inefficient. Another potential drawback is that data from different block design experiments cannot be effectively combined together, whereas if the same reference sample is used the data from different experiments can be combined for analysis.
For class discovery experiments in which one is classifying the samples, the reference design appears to be the best choice, although it is possible that a better design will be found. Block designs are not appropriate.
DYE BIAS IN DUAL LABEL ARRAYS
Dye bias is the tendency of some genes to fluoresce more brightly in one dye than the other. If such bias is not removed in the preprocessing and normalization of the data, then it has the potential to introduce bias into comparisons of interest. This type of dye bias can be called gene-specific dye bias and it has been shown to exist in numerous studies under a wide range of normalization and data analysis techniques (Dobbin et al. 2005).
Gene-specific dye bias cancels out of class comparisons in reference and balanced block designs. It will also not affect cluster analysis in reference design experiments if a Euclidean distance metric is used. Dye bias can affect comparisons in other types of designs, or comparisons with the reference sample in a reference design.
POOLING RNA SAMPLES
RNA samples are sometimes pooled prior to labeling and hybridization in order to either avoid RNA amplification in cases when RNA samples are insufficient for the microarray assay, or reduce the cost of the experiment by using fewer arrays. When pooling, RNA pools should be independent, so that no two pools have a sample in common.
Table 1-2 shows an example of the tradeoff between the number of arrays required and the number of samples required for a class comparison experiment when one pools RNA samples. Each row of the table represents an experiment which uses a different pooling level, and the number of arrays and sample sizes are calculated so that each experiment has the same type I and type II error rates.
As can be seen from the table, pooling may make sense when sam-
ples are cheap relative to microarrays. If the samples are valuable, then pooling will probably not make sense. One does lose information on individual samples when one pools, so, for example, human samples are rarely pooled. But it may be a viable alternative to RNA amplification when individual RNA samples are too small.
SAMPLE SIZE DETERMINATION
For class comparison studies, sample size formulas are available. In these studies, the statistical significance of the differential expression for each gene is tested using a test such as a t-test. Sample size methods for these univariate tests can be used to estimate the sample size requirements for a study. Examples of formulas for single and dual-label arrays, and various designs, appear in Dobbin and Simon (2005).
Sample size guidelines and methodologies for class prediction in microarray studies have been suggested (Mukherjeee et al. 2003; Dobbin and Simon 2007). Determining sample size for cluster analysis is more problematic.
TABLE 1-2 Example of the Tradeoff Between Number of Arrays Required and Number of Samples Required for Various Pooling Levels
|
Number of Samples Pooled on Each Array |
Number of Arrays Required |
Number of Samples Required |
|
1 |
25 |
25 |
|
2 |
17 |
34 |
|
3 |
14 |
42 |
|
4 |
13 |
52 |
|
Source: Adapted from Dobbin and Simon 2005. |
||
REFERENCES
Dobbin, K.K., and R.M. Simon. 2002. Comparison of microarray designs for class comparison and class discovery. Bioinformatics 18(11):1438-1445.
Dobbin, K.K., and R.M. Simon. 2005. Sample size determination in microarray experiments for class comparison and prognostic classification. Biostatistics 6(1):27-38.
Dobbin, K.K., and R.M. Simon. 2007. Sample size planning for developing classifiers using high dimensional DNA microarray data. Biostatistics 8(1):101-117.
Dobbin, K.K., J.H. Shih, and R.M. Simon. 2003. Questions and answers on design of dual-label microarrays for identifying differentially expressed genes. J. Natl. Cancer Inst. 95(18):1362-1369.
Dobbin, K.K., E.S. Kawasaki, D.W. Petersen, and R.M. Simon. 2005. Characterizing dye bias in microarray experiments. Bioinformatics 21(1):2430-2437.
Hossain, M.A., C.M.L. Bouton, J. Pevsner, and J. Laterra. 2000. Induction of vascular endothelial growth factor in human astrocytes by lead. Involment of a protein kinase C/activator protein 1complex-dependent and hypoxia-inducible factor 1-independent signaling pathway. J. Biol. Chem. 275(36):27874-27882.
Huang, Q., R.T. Dunn, II, S. Jayadev, O. DiSorbo, F.D. Pack, S.B. Farr, R.E. Stoll, and K.T. Blanchard. 2001. Assessment of cisplatin-induced nephrotoxicity by microarray technology. Toxicol Sci. 63(2):196-207.
Lu, T., J. Liu, E.L. LeCluyse, Y.S. Zhou, M.L. Cheng, and M.P. Waalkes. 2001. Application of cDNA microarray to the study of arsenic-induced liver diseases in the population of Guizhou, China. Toxicol. Sci. 59(1):185-192.
Mukherjee, S., P. Tamayo, S. Rogers, R. Rifkin, A. Engle, C. Campbell, T.R. Golub, and J.P. Mesirov. 2003. Estimating dataset size requirements for classifying DNA microarray data. J. Comput. Biol. 10(2):119-142.
Thomas, R.S., D.R. Rank, S.G. Penn, G.M. Zastrow, K.R. Hayes, K. Pande, E. Glover, T. Silander, M.W. Craven, J.K. Reddy, S.B. Jovanovich, and C.A. Bradfield. 2001. Identification of toxicologically predictive gene sets using cDNA microarrays. Mol. Pharmacol. 60(6):1189-1194.


