National Academies Press: OpenBook

Earth Science and Applications from Space: National Imperatives for the Next Decade and Beyond (2007)

Chapter: Appendix C Blending Earth Observations and Models -- The Successful Paradigm of Weather Forecasting

« Previous: Appendix B Biographical Information for Committee Members and Staff
Suggested Citation:"Appendix C Blending Earth Observations and Models -- The Successful Paradigm of Weather Forecasting." National Research Council. 2007. Earth Science and Applications from Space: National Imperatives for the Next Decade and Beyond. Washington, DC: The National Academies Press. doi: 10.17226/11820.
×

C
Blending Earth Observations and Models—The Successful Paradigm of Weather Forecasting

The development of modern operational weather forecasting, founded on scientific understanding, global observations, and mathematical computer models, is one of the great success stories of Earth science and offers a paradigm for the use of Earth observations in many other applications of benefit to society. The first part of this appendix describes how observations are used in models and in data-assimilation systems to produce diagnostic status assessments and forecasts and illustrates why observations of different variables (such as temperature and winds) and different types of observations of the same variable (such as temperature) are valuable. Direct study of observations clearly is central in many scientific investigations and applications.

The second part of this appendix, titled “The Diversity of Meteorological and Oceanographic Observations,” illustrates the wide diversity of in situ and satellite observations for operational meteorology and oceanography. The improvements in the observing systems inrecent decades have contributed substantially to improvements in scientific knowledge and in forecast capability on short (1–3 day) and medium (3–10 days) timescales and have made possible the creation of new forecast capabilities for variations in the ocean atmosphere on time scales of months to years, such as the El Niño-Southern Oscillation (ENSO).

USE OF OBSERVATIONS IN MODELS AND DATA-ASSIMILATION SYSTEMS

Blending Earth Observations and Models

The global era of numerical weather prediction began with the 1979 Global Weather Experiment (GWE), which provided unprecedented and comprehensive observations of the global atmosphere for an entire year, using in situ and satellite data, for the purposes of scientific investigation and to determine the limits of atmospheric predictability. Many elements of the GWE observation program, both satellite and in situ, have continued as operational programs since 1979. Joint use of the satellite and in situ data for diagnostic and prediction purposes posed substantial scientific challenges that were not satisfactorily resolved in operational practice until the mid-1990s with the development of four-dimensional variational data-assimilation systems.

Suggested Citation:"Appendix C Blending Earth Observations and Models -- The Successful Paradigm of Weather Forecasting." National Research Council. 2007. Earth Science and Applications from Space: National Imperatives for the Next Decade and Beyond. Washington, DC: The National Academies Press. doi: 10.17226/11820.
×

The scientific challenges of using both satellite and in situ data included the fact that the satellite data represent measurements of outgoing radiation at satellite level, which have a complicated dependence on multiple aspects of atmospheric structure, whereas in situ data typically provide a direct measurement of one aspect of atmospheric structure. Moreover, the satellite data constitute a continuous stream along a swath below the satellite orbit but may not exactly reproduce its view of a particular point for many hours, or perhaps several days. In addition, depending on the viewing geometry and frequency band used by a satellite instrument, clouds and precipitation may limit observational capability. Furthermore, satellite and in situ data have very different error characteristics, which also complicate the inference of information.

Optimal estimation of the evolving state of the atmosphere over a period (say, 1 day) requires one to use not only the observations available in that time window but also earlier observations and knowledge of the laws governing atmospheric evolution. These laws are highly nonlinear and are expressed in the forecast equations of an atmospheric model. To begin the interpretation of the observations received between 1200 UTC yesterday and 1200 UTC today, one projects yesterday’s best estimate at 1200 UTC forward to 1200 UTC today by using the forecast model to provide an a priori estimate for calculation of today’s best estimate. The evolving a priori state is sampled through the 24 hours by a simulated observation network to provide the a priori estimate of the actual observations. The estimate of the observations (the expected values of the observations) includes simulations of the actual in situ observations and simulations of the observations of the actual fleet of satellites operating during the period.

The mismatch between the actual observations and expected observations (simulated from the a priori forecast) is used in an iterative variational procedure to adjust the starting point for the forecast so that the trajectory of the forecast (the evolving model state) is increasingly close to the observations. The iterative nature of the calculation has many advantages, not least that one can make accurate use of observations that are nonlinear in the model variables and that many types of observations can contribute to the estimation. The algorithm is known as four-dimensional variational data assimilation (4D-Var), and the underlying Bayesian inference theory is closely related to such algorithms as the Kalman filter. The substantial computer costs are justified by the benefits of the calculation. A prime output of the calculation is the best estimate of the atmospheric state at 1200 UTC today. However, there are many other benefits, especially that it is a systematic resource for determining random and systematic errors in the observations, in the model, and in the procedure itself.

Current practice in operational data assimilation has evolved to its present state for two important reasons. First the observations available at 1200 UTC today cannot provide a global picture, because of gaps in the spatial coverage (both in the horizontal and in the vertical), gaps in temporal coverage, gaps in the range of observed variables, and uncertainties and variations in the errors and sampling characteristics of different observing systems. The numerical model uses yesterday’s best estimate and observations taken within the assimilation window to fill the observational gaps by transporting information from data-rich to data-sparse areas. The second reason is related to a basic result in estimation theory. Suppose that one seeks a best estimate of the state of a system by using two sources of information with accuracies1 represented by A1 and A2. Theory says that in the best combination of the two estimates, the two sources of information are weighted by their accuracies, and the accuracy A of the resulting combination is given by

1

Technically, the accuracy of an observation is given by the inverse of an error covariance matrix associated with the observation, which is a measure of the error or uncertainty of the observation and how the errors are correlated spatially.

Suggested Citation:"Appendix C Blending Earth Observations and Models -- The Successful Paradigm of Weather Forecasting." National Research Council. 2007. Earth Science and Applications from Space: National Imperatives for the Next Decade and Beyond. Washington, DC: The National Academies Press. doi: 10.17226/11820.
×

Two important implications follow:

  1. The information in the statistical combination of the two sources of information is more accurate than that in either source alone; that is, the accuracy of the overall estimate, A, is greater than either A1 or A2.

  2. An increase in accuracy of either source of information will improve the accuracy of the combined estimate.

Both implications are valid whether the information in A1 and A2 comes from different measurements made in the assimilation window or from earlier measurements projected forward using the numerical model. Because well-observed areas the accuracy of the 24-hour forecast is comparable with the observation accuracy on the scales resolved by model, one gets the well-established result that the accuracy of the best estimate provided by the data-assimilation process is higher than the accuracy of either the observations alone or the forecast alone. A vital feature of the diagnostic data-assimilation products is that they are multivariate and therefore satisfy the natural requirements for dynamic, thermodynamic, and chemical consistency.

The sequence of best estimates derived in that way can be generated with any desired time resolution, from hourly to 3-hourly, 6-hourly, 12-hourly, or 24-hourly. The sequence of best estimates of global atmospheric distributions of trace constituents, dynamic fields (winds and pressures), and thermodynamic fields (temperatures, radiation, clouds, rainfall, turbulence, and intensity) is a key product for many diagnostic and status-assessment products. The latest product in the sequence, the best estimate for 1200 UTC today in the example, is a key product for the production of predictive products.

An important aspect of the data-assimilation procedure is that on scales of 5 years or so, sustained scientific efforts usually deliver important improvements in the quality of the satellite data (for example, from improved calibrations and cross-calibrations), in the quality of the algorithms used to interpret the satellite measurements to geophysical quantities, in the quality of the assimilating models, and in the quality of the assimilation algorithms. Those developments prompt demands for reinterpretations or reanalyses of the instrumental record with the best available science. Several extended reanalyses covering periods of up to 50 years have been created to meet such research needs; computer resources limit the spatial resolution of the analyses. However, there is also a demand for high-resolution reanalyses of shorter periods; there is likely to be heavy international demand for reanalyses of atmospheric dynamics and composition for the commitment period for the Kyoto protocol (2008–2012).

Operational Dialogues on the Quality of Observations, Models, and Assimilations

For every observation presented to an operational data-assimilation system, the assimilation system can provide an a priori estimate of the expected measurement that is totally independent of the actual measurement, as well as an a posteriori “best estimate” of what the measurement should have been. Given the millions of satellite measurements available every day, daily or monthly statistics of the differences between actual and expected satellite measurements form a treasure trove for monitoring the performance of the data-assimilation system (including the forecast model) and monitoring the performance of the observing system (Hollingsworth et al., 1986). The statistical material has become the basis of an active dialogue between data users and data producers that over the last 20 years has repeatedly demonstrated its value to all participants. Indeed, the benefits for all concerned have been so large that the dialogue has been systematized into a world wide structure, which reports monthly under the aegis of WMO.

Suggested Citation:"Appendix C Blending Earth Observations and Models -- The Successful Paradigm of Weather Forecasting." National Research Council. 2007. Earth Science and Applications from Space: National Imperatives for the Next Decade and Beyond. Washington, DC: The National Academies Press. doi: 10.17226/11820.
×
Research Dialogues on Scientific Understanding of Remotely Sensed Measurements

A fine example of the value of the dialogue between experts on new instruments, data-assimilation methods, and in situ observations is the discussion of the performance of the forward radiative-transfer models used in the AIRS physical-retrieval algorithms. Strow et al. (2005) used ground truth from several sensors to assess the uncertainties in the AIRS infrared forward model. Global temperature and humidity fields from operational weather-prediction centers were made available to those researchers and to the AIRS science team in near real time. In the early days of the AIRS experiment, rapid comparisons of the differences between the measured and expected radiances (based on the model forecast fields) identified biases in the differences, some of which were attributable to bias in the models and some to errors in the AIRS retrieval algorithms. The instrument issues identified in the initial comparisons with the model data were definitively resolved with field data. As a result of the dialogue between the research teams and the operational teams, selected elements of the AIRS radiance data were introduced into operational use within 18 months of launch, in October 2003, and continue to be used for weather forecasting and seasonal forecasting.

THE DIVERSITY OF METEOROLOGICAL AND OCEANOGRAPHIC OBSERVATIONS

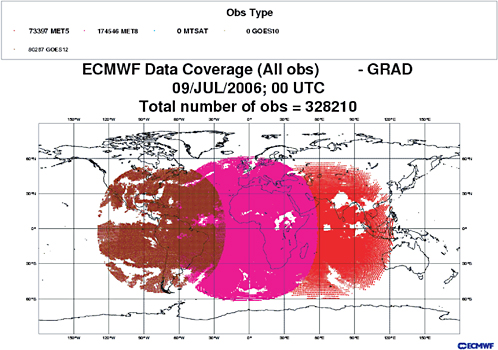
A wide range of atmospheric and ocean data are available and used in current operational practice, and many more data are available for scientific research. Figures C.1 through C.12 show the distribution of routine observations available in a 6-hour period centered on 0000 UTC on a randomly chosen date (July 9, 2006) from the indicated observing systems.

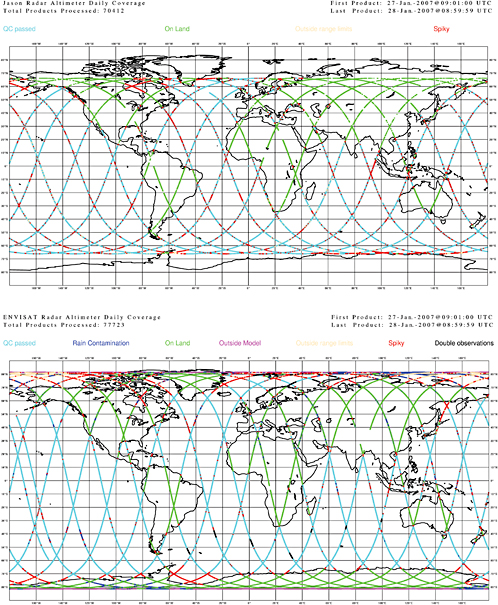
Figure C.13 shows, for a randomly chosen day, an example of radar altimeter coverage in a 24-hr period from the Jason and Envisat missions. The data are used to measure changes in “significant wave height” on the ocean surface and surface wind speed.

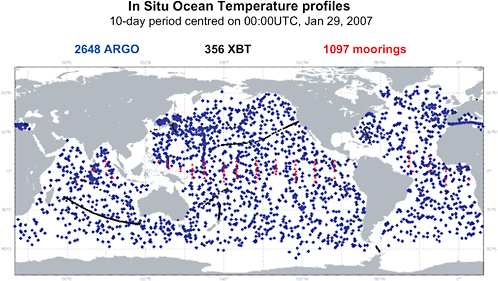
Figure C.14 shows, for a randomly chosen month, the distribution of Argo floats (purple). The Argo system provides profiles of ocean temperature and salinity. Also shown are ocean profile measurements from the TOGA-TAO array of moored buoys (red) and ocean profiles (black) from XBT (expendable bathy-thermograph) measurements made by ships of opportunity.

The diversity, complexity, and coverage of the observing systems used in current operational practice are impressive.

REFERENCES

Hollingsworth, A., D.Shaw, P.Lonnberg, L.Illari, K.Arpe, and A.J.Simmons. 1986. Monitoring of observation and analysis quality by a data assimilation system. Mon. Wea. Rev. 114:861–879.

Strow, L.L., S.E.Hannon, S.De-Souza Machado, H.E.Motteler, and D.C.Tobin. 2005. Validation of the Atmospheric Infrared Sounder radiative transfer algorithm. J. Geophys. Res. 111(D9):D09S06, doi:10.1029/2005JD006146.

Suggested Citation:"Appendix C Blending Earth Observations and Models -- The Successful Paradigm of Weather Forecasting." National Research Council. 2007. Earth Science and Applications from Space: National Imperatives for the Next Decade and Beyond. Washington, DC: The National Academies Press. doi: 10.17226/11820.
×

FIGURE C.1 Reports from land stations and ships. SOURCE: Courtesy of European Centre for Medium-Range Weather Forecasts.

Suggested Citation:"Appendix C Blending Earth Observations and Models -- The Successful Paradigm of Weather Forecasting." National Research Council. 2007. Earth Science and Applications from Space: National Imperatives for the Next Decade and Beyond. Washington, DC: The National Academies Press. doi: 10.17226/11820.
×

FIGURE C.2 Reports from ocean buoys, including both drifting buoys (red) and moored buoys (blue). SOURCE: Courtesy of European Centre for Medium-Range Weather Forecasts.

Suggested Citation:"Appendix C Blending Earth Observations and Models -- The Successful Paradigm of Weather Forecasting." National Research Council. 2007. Earth Science and Applications from Space: National Imperatives for the Next Decade and Beyond. Washington, DC: The National Academies Press. doi: 10.17226/11820.
×

FIGURE C.3 Temperature and humidity measurements from weather balloons. SOURCE: Courtesy of European Centre for Medium-Range Weather Forecasts.

Suggested Citation:"Appendix C Blending Earth Observations and Models -- The Successful Paradigm of Weather Forecasting." National Research Council. 2007. Earth Science and Applications from Space: National Imperatives for the Next Decade and Beyond. Washington, DC: The National Academies Press. doi: 10.17226/11820.
×

FIGURE C.4 Wind measurements from weather balloons and ground-based microwave profilers (blue and green). SOURCE: Courtesy of European Centre for Medium-Range Weather Forecasts.

Suggested Citation:"Appendix C Blending Earth Observations and Models -- The Successful Paradigm of Weather Forecasting." National Research Council. 2007. Earth Science and Applications from Space: National Imperatives for the Next Decade and Beyond. Washington, DC: The National Academies Press. doi: 10.17226/11820.
×

FIGURE C.5 Aircraft reports of wind and temperature. SOURCE: Courtesy of European Centre for Medium-Range Weather Forecasts.

Suggested Citation:"Appendix C Blending Earth Observations and Models -- The Successful Paradigm of Weather Forecasting." National Research Council. 2007. Earth Science and Applications from Space: National Imperatives for the Next Decade and Beyond. Washington, DC: The National Academies Press. doi: 10.17226/11820.
×

FIGURE C.6 Ozone retrievals using measurements from U.S. missions NOAA 14/16/17 and from European ERS-2 and Envisat missions. SOURCE: Courtesy of European Centre for Medium-Range Weather Forecasts.

Suggested Citation:"Appendix C Blending Earth Observations and Models -- The Successful Paradigm of Weather Forecasting." National Research Council. 2007. Earth Science and Applications from Space: National Imperatives for the Next Decade and Beyond. Washington, DC: The National Academies Press. doi: 10.17226/11820.
×

FIGURE C.7 Microwave brightness temperature measurements from AMSU-A instruments on NOAA 15/16/18 and from HSB instrument on Aqua. SOURCE: Courtesy of European Centre for Medium-Range Weather Forecasts.

Suggested Citation:"Appendix C Blending Earth Observations and Models -- The Successful Paradigm of Weather Forecasting." National Research Council. 2007. Earth Science and Applications from Space: National Imperatives for the Next Decade and Beyond. Washington, DC: The National Academies Press. doi: 10.17226/11820.
×

FIGURE C.8 Infrared radiance measurements from AIRS instrument on NASA’s Aqua mission for estimation of air and sea-surface temperature, humidity, ozone, and CO2. SOURCE: Courtesy of European Centre for Medium-Range Weather Forecasts.

Suggested Citation:"Appendix C Blending Earth Observations and Models -- The Successful Paradigm of Weather Forecasting." National Research Council. 2007. Earth Science and Applications from Space: National Imperatives for the Next Decade and Beyond. Washington, DC: The National Academies Press. doi: 10.17226/11820.
×

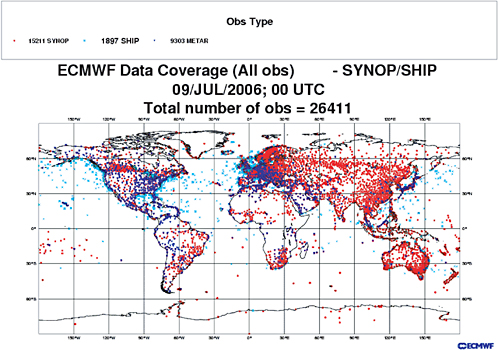
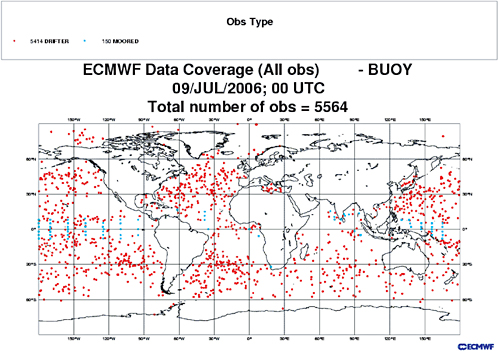
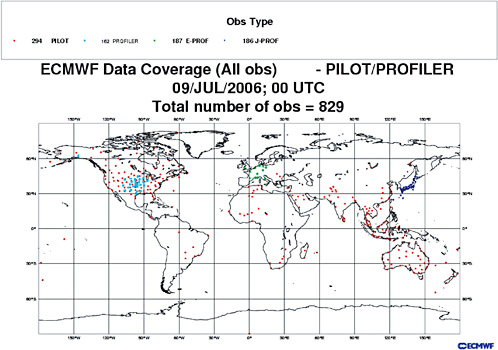
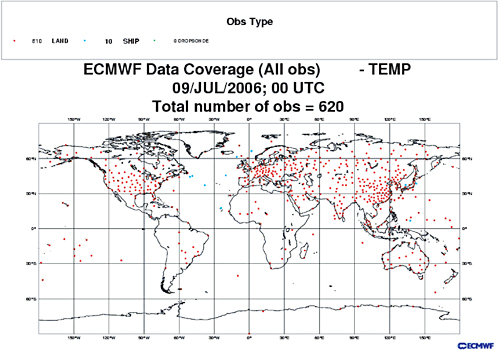
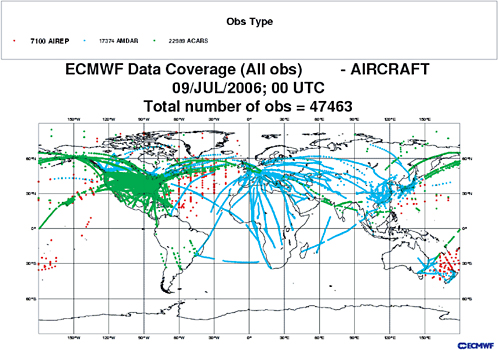
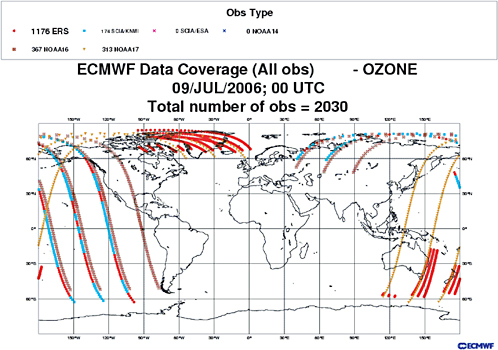
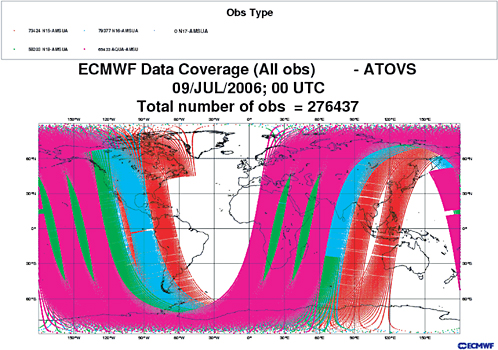
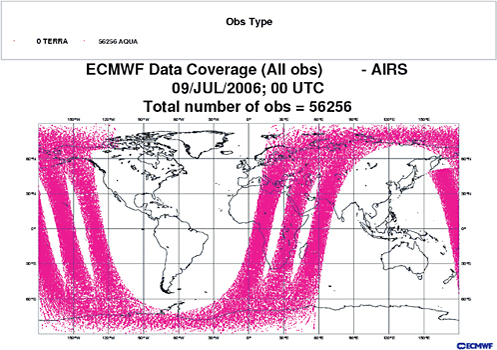
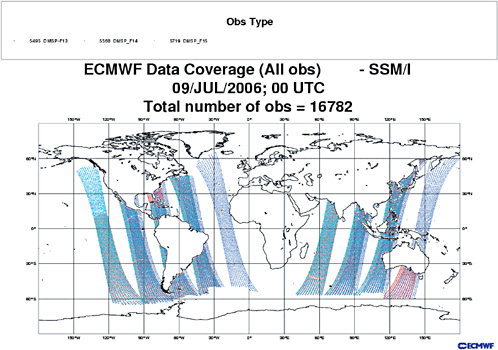
FIGURE C.9 Microwave brightness temperature measurements from SSM/I instruments on DMSP series FP-13, FP-14, FP-15, used for estimating, among other things, total column humidity, ocean-surface wind speed, surface rain intensity, and cloud liquid-water content. SOURCE: Courtesy of European Centre for Medium-Range Weather Forecasts.

Suggested Citation:"Appendix C Blending Earth Observations and Models -- The Successful Paradigm of Weather Forecasting." National Research Council. 2007. Earth Science and Applications from Space: National Imperatives for the Next Decade and Beyond. Washington, DC: The National Academies Press. doi: 10.17226/11820.
×

FIGURE C.10 Normalized radar backscatter measurements from ocean surface made by QuikSCAT and ERS-2 missions, which are used to infer surface wind speed and direction over ocean. SOURCE: Courtesy of European Centre for Medium-Range Weather Forecasts.

Suggested Citation:"Appendix C Blending Earth Observations and Models -- The Successful Paradigm of Weather Forecasting." National Research Council. 2007. Earth Science and Applications from Space: National Imperatives for the Next Decade and Beyond. Washington, DC: The National Academies Press. doi: 10.17226/11820.
×

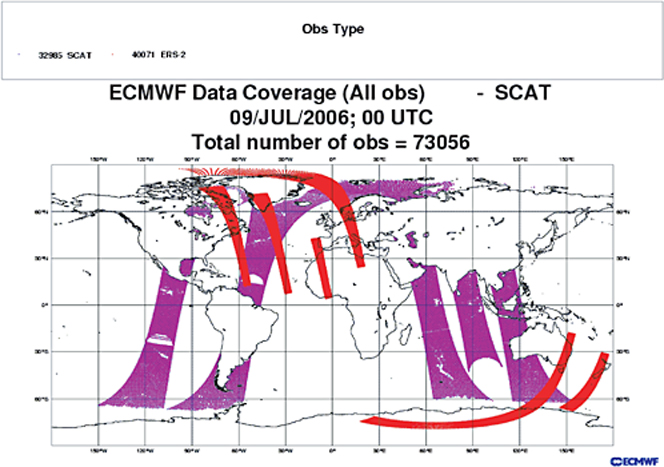
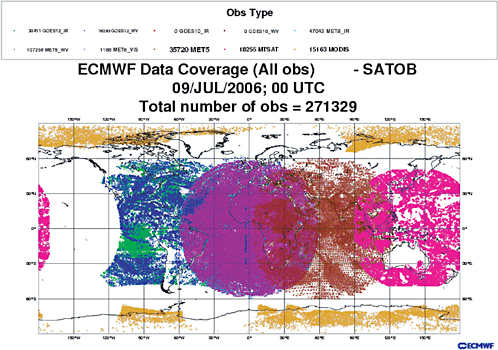
FIGURE C.11 Atmospheric motion vectors estimated (between 50°S and 50°N) from geostationary time-lapse imagery in infrared window and water-vapor bands from U.S. GOES-12 mission, from European METEOSAT 5 and 8 missions, and from Japanese MTSAT mission. In high polar latitudes, plot also shows atmospheric motion vectors estimated from time-lapse imagery in infrared water-vapor band from MODIS instrument on NASA’s Terra mission. SOURCE: Courtesy of European Centre for Medium-Range Weather Forecasts.

Suggested Citation:"Appendix C Blending Earth Observations and Models -- The Successful Paradigm of Weather Forecasting." National Research Council. 2007. Earth Science and Applications from Space: National Imperatives for the Next Decade and Beyond. Washington, DC: The National Academies Press. doi: 10.17226/11820.
×

FIGURE C.12 Measurements of atmospheric radiance in infrared, used for temperature and humidity estimation, from GOES-12 mission, and from METEOSAT 5 and 8 missions. SOURCE: Courtesy of European Centre for Medium-Range Weather Forecasts.

Suggested Citation:"Appendix C Blending Earth Observations and Models -- The Successful Paradigm of Weather Forecasting." National Research Council. 2007. Earth Science and Applications from Space: National Imperatives for the Next Decade and Beyond. Washington, DC: The National Academies Press. doi: 10.17226/11820.
×

FIGURE C.13 Radar altimeter coverage in a 24-hour period from Jason and Envisat missions. SOURCE: Courtesy of Saleh Abdalla and Peter Janssen, European Centre for Medium-Range Weather Forecasts.

Suggested Citation:"Appendix C Blending Earth Observations and Models -- The Successful Paradigm of Weather Forecasting." National Research Council. 2007. Earth Science and Applications from Space: National Imperatives for the Next Decade and Beyond. Washington, DC: The National Academies Press. doi: 10.17226/11820.
×

FIGURE C.14 Buildup of Argo: Data coverage for February 2005. SOURCE: Courtesy of Magdalena Alonso Balmaseda, European Centre for Medium-Range Weather Forecasts.

Suggested Citation:"Appendix C Blending Earth Observations and Models -- The Successful Paradigm of Weather Forecasting." National Research Council. 2007. Earth Science and Applications from Space: National Imperatives for the Next Decade and Beyond. Washington, DC: The National Academies Press. doi: 10.17226/11820.
×
Page 392
Suggested Citation:"Appendix C Blending Earth Observations and Models -- The Successful Paradigm of Weather Forecasting." National Research Council. 2007. Earth Science and Applications from Space: National Imperatives for the Next Decade and Beyond. Washington, DC: The National Academies Press. doi: 10.17226/11820.
×
Page 393
Suggested Citation:"Appendix C Blending Earth Observations and Models -- The Successful Paradigm of Weather Forecasting." National Research Council. 2007. Earth Science and Applications from Space: National Imperatives for the Next Decade and Beyond. Washington, DC: The National Academies Press. doi: 10.17226/11820.
×
Page 394
Suggested Citation:"Appendix C Blending Earth Observations and Models -- The Successful Paradigm of Weather Forecasting." National Research Council. 2007. Earth Science and Applications from Space: National Imperatives for the Next Decade and Beyond. Washington, DC: The National Academies Press. doi: 10.17226/11820.
×
Page 395
Suggested Citation:"Appendix C Blending Earth Observations and Models -- The Successful Paradigm of Weather Forecasting." National Research Council. 2007. Earth Science and Applications from Space: National Imperatives for the Next Decade and Beyond. Washington, DC: The National Academies Press. doi: 10.17226/11820.
×
Page 396
Suggested Citation:"Appendix C Blending Earth Observations and Models -- The Successful Paradigm of Weather Forecasting." National Research Council. 2007. Earth Science and Applications from Space: National Imperatives for the Next Decade and Beyond. Washington, DC: The National Academies Press. doi: 10.17226/11820.
×
Page 397
Suggested Citation:"Appendix C Blending Earth Observations and Models -- The Successful Paradigm of Weather Forecasting." National Research Council. 2007. Earth Science and Applications from Space: National Imperatives for the Next Decade and Beyond. Washington, DC: The National Academies Press. doi: 10.17226/11820.
×
Page 398
Suggested Citation:"Appendix C Blending Earth Observations and Models -- The Successful Paradigm of Weather Forecasting." National Research Council. 2007. Earth Science and Applications from Space: National Imperatives for the Next Decade and Beyond. Washington, DC: The National Academies Press. doi: 10.17226/11820.
×
Page 399
Suggested Citation:"Appendix C Blending Earth Observations and Models -- The Successful Paradigm of Weather Forecasting." National Research Council. 2007. Earth Science and Applications from Space: National Imperatives for the Next Decade and Beyond. Washington, DC: The National Academies Press. doi: 10.17226/11820.
×
Page 400
Suggested Citation:"Appendix C Blending Earth Observations and Models -- The Successful Paradigm of Weather Forecasting." National Research Council. 2007. Earth Science and Applications from Space: National Imperatives for the Next Decade and Beyond. Washington, DC: The National Academies Press. doi: 10.17226/11820.
×
Page 401
Suggested Citation:"Appendix C Blending Earth Observations and Models -- The Successful Paradigm of Weather Forecasting." National Research Council. 2007. Earth Science and Applications from Space: National Imperatives for the Next Decade and Beyond. Washington, DC: The National Academies Press. doi: 10.17226/11820.
×
Page 402
Suggested Citation:"Appendix C Blending Earth Observations and Models -- The Successful Paradigm of Weather Forecasting." National Research Council. 2007. Earth Science and Applications from Space: National Imperatives for the Next Decade and Beyond. Washington, DC: The National Academies Press. doi: 10.17226/11820.
×
Page 403
Suggested Citation:"Appendix C Blending Earth Observations and Models -- The Successful Paradigm of Weather Forecasting." National Research Council. 2007. Earth Science and Applications from Space: National Imperatives for the Next Decade and Beyond. Washington, DC: The National Academies Press. doi: 10.17226/11820.
×
Page 404
Suggested Citation:"Appendix C Blending Earth Observations and Models -- The Successful Paradigm of Weather Forecasting." National Research Council. 2007. Earth Science and Applications from Space: National Imperatives for the Next Decade and Beyond. Washington, DC: The National Academies Press. doi: 10.17226/11820.
×
Page 405
Suggested Citation:"Appendix C Blending Earth Observations and Models -- The Successful Paradigm of Weather Forecasting." National Research Council. 2007. Earth Science and Applications from Space: National Imperatives for the Next Decade and Beyond. Washington, DC: The National Academies Press. doi: 10.17226/11820.
×
Page 406
Suggested Citation:"Appendix C Blending Earth Observations and Models -- The Successful Paradigm of Weather Forecasting." National Research Council. 2007. Earth Science and Applications from Space: National Imperatives for the Next Decade and Beyond. Washington, DC: The National Academies Press. doi: 10.17226/11820.
×
Page 407
Suggested Citation:"Appendix C Blending Earth Observations and Models -- The Successful Paradigm of Weather Forecasting." National Research Council. 2007. Earth Science and Applications from Space: National Imperatives for the Next Decade and Beyond. Washington, DC: The National Academies Press. doi: 10.17226/11820.
×
Page 408
Suggested Citation:"Appendix C Blending Earth Observations and Models -- The Successful Paradigm of Weather Forecasting." National Research Council. 2007. Earth Science and Applications from Space: National Imperatives for the Next Decade and Beyond. Washington, DC: The National Academies Press. doi: 10.17226/11820.
×
Page 409
Next: Appendix D Request for Information from Community »
Earth Science and Applications from Space: National Imperatives for the Next Decade and Beyond Get This Book
×
Buy Cd-rom | $59.00
MyNAP members save 10% online.
Login or Register to save!
Download Free PDF

Natural and human-induced changes in Earth's interior, land surface, biosphere, atmosphere, and oceans affect all aspects of life. Understanding these changes requires a range of observations acquired from land-, sea-, air-, and space-based platforms. To assist NASA, NOAA, and USGS in developing these tools, the NRC was asked to carry out a "decadal strategy" survey of Earth science and applications from space that would develop the key scientific questions on which to focus Earth and environmental observations in the period 2005-2015 and beyond, and present a prioritized list of space programs, missions, and supporting activities to address these questions. This report presents a vision for the Earth science program; an analysis of the existing Earth Observing System and recommendations to help restore its capabilities; an assessment of and recommendations for new observations and missions for the next decade; an examination of and recommendations for effective application of those observations; and an analysis of how best to sustain that observation and applications system.

  1. ×

    Welcome to OpenBook!

    You're looking at OpenBook, NAP.edu's online reading room since 1999. Based on feedback from you, our users, we've made some improvements that make it easier than ever to read thousands of publications on our website.

    Do you want to take a quick tour of the OpenBook's features?

    No Thanks Take a Tour »
  2. ×

    Show this book's table of contents, where you can jump to any chapter by name.

    « Back Next »
  3. ×

    ...or use these buttons to go back to the previous chapter or skip to the next one.

    « Back Next »
  4. ×

    Jump up to the previous page or down to the next one. Also, you can type in a page number and press Enter to go directly to that page in the book.

    « Back Next »
  5. ×

    Switch between the Original Pages, where you can read the report as it appeared in print, and Text Pages for the web version, where you can highlight and search the text.

    « Back Next »
  6. ×

    To search the entire text of this book, type in your search term here and press Enter.

    « Back Next »
  7. ×

    Share a link to this book page on your preferred social network or via email.

    « Back Next »
  8. ×

    View our suggested citation for this chapter.

    « Back Next »
  9. ×

    Ready to take your reading offline? Click here to buy this book in print or download it as a free PDF, if available.

    « Back Next »
Stay Connected!