
Long-Term Trends in Global Passenger Mobility
ANDREAS SCHÄFER*
University of Cambridge
Cambridge, United Kingdom
Anticipating changes in travel demand on aggregate levels is critical for industries making decisions about meeting the demand for vehicles and fuel and for governments planning infrastructure expansions, predicting transport-sector (greenhouse-gas) emissions, and evaluating mitigation policies. In this paper, I show that only a few variables are necessary to explain past levels and project internally consistent future levels of aggregate, world-regional travel demand and transport modes. I then highlight the enormous challenges that must be met to reduce greenhouse-gas emissions, especially from passenger aircraft, the fastest growing transport mode.
DETERMINANTS OF AGGREGATE TRAVEL DEMAND AND TRANSPORT MODES
Growth in per capita income and population are the two single most important factors in passenger mobility. During the past 50 years, global average per capita income has increased slightly more than threefold, and world population has more than doubled. This combined growth, by a factor of 7.4, has translated into a nearly proportional increase in passenger mobility. The nearly direct rela-
tionship can be explained by so-called travel budgets, roughly constant averages of expenditure shares of money and time.
Although the amount of time spent traveling is highly variable on an individual level, large groups of people spend about 5 percent of their daily time traveling. The stability of the aggregate “travel-time budget,” first hypothesized in similar form for urban travelers by the late Yacov Zahavi (1981), is illustrated in Figure 1 for a wide range of income levels. On average, residents in African villages, the Palestinian Territories, and the suburbs of Lima spend between 60 and 90 minutes per day traveling, the same as for people living in the automobile-dependent societies of Japan, Western Europe, and the United States.
A similar transition, from variability at disaggregate levels to stability at aggregate levels, can be observed for travel-expenditure shares (i.e., the percentage of income dedicated to travel). Zahavi observed that households that rely exclusively on nonmotorized modes of transport and public transportation spend only about 3 to 5 percent of their income on travel; that percentage rises to 10 to 15 percent for people who own at least one motor vehicle. Figure 2 shows that the aggregate “travel-money budget,” here defined as total travel expenditures divided by the gross domestic product (GDP), follows a similar pattern, rising from about 5 percent of GDP at motorization rates close to zero cars per 1,000 capita (nearly all U.S. households in 1909 and the least developed countries
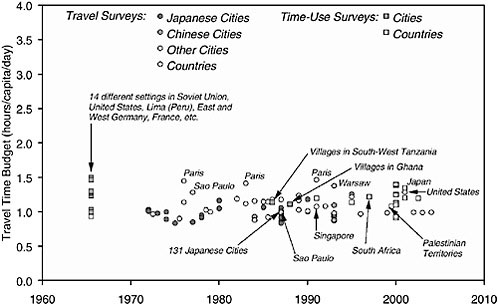
FIGURE 1 Average daily travel time as a function of per capita GDP.
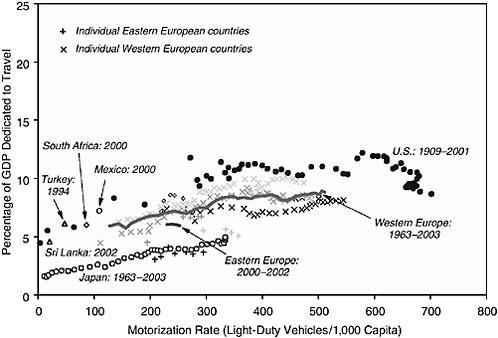
FIGURE 2 Travel expenditures as a fraction of income for annual travel distance.
today) to around 10 percent of GDP at about 300 cars per 1,000 capita (industrialized countries today), an ownership level of about one car per household of three to four people. In addition, travel demand and choice of transport mode depend on average door-to-door speed and travel costs to the consumer. The drastic decrease in the cost of air travel in the past decades has contributed to the rising share of that transport mode.
THE PAST FIVE DECADES IN WORLD TRAVEL DEMAND
To study the historical development and project the future development of global travel demand, we estimated a unique data set of passenger mobility for 11 world regions, covering passenger-kilometers (km) traveled (PKT) using four major modes of transport (light-duty vehicles, buses, railways, and aircraft) and spanning 51 years (1950 to 2000).1 The overall relationship between GDP per capita and per person PKT is shown in Figure 3. The saturating travel-money budget, described above, helps explain how rising GDP translates into rising travel demand.
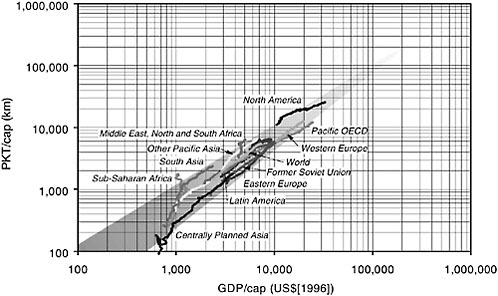
FIGURE 3 Passenger-km per capita by per capita GDP for 11 world regions and the entire world from 1950 to 2000.
Over the past five decades, Earth’s inhabitants have increased their travel demand from an average of 1,400 to 5,500 km, using a combination of automobiles, buses, railways, and aircraft. Since the world population grew nearly 2.5-fold during the same period, world PKT increased by one order of magnitude, from nearly 3.6 to some 33 trillion PKT. The biggest increase in PKT, by a factor of more than 20, occurred in the developing world, where the combined growth in per capita GDP and population was largest.
However, the “mobility gap” between developing and industrialized regions remains substantial. In 2000, residents in North America, the Pacific Organisation for Economic Co-operation and Development (Japan, Australia, and New Zealand), and Western Europe traveled 17,000 PKT per capita on average, five times as much as people in the developing world. These differences are even larger on a world-regional scale. Residents of North America, the region with the highest level of mobility, traveled 25,600 km per year, while people in sub-Saharan Africa (not including South Africa) traveled just 1,700 km.
GDP is the most important, but not the only, determinant of per-person PKT. As Figure 3 shows, the average travel per person differs significantly at different income levels, mainly because of different costs for transportation, but also because of the size of purchasing power parity (PPP) adjustments in the socioeconomic data set (Heston et al., 2002).
While the travel-money budget translates rising per capita GDP into rising
PKT per capita, the fixed travel-time budget requires that the increasing travel demand be satisfied in the same amount of time. Since each transport mode operates within a known range of speeds, the increasing per-person travel demand can only be satisfied by shifting toward increasingly rapid transport.
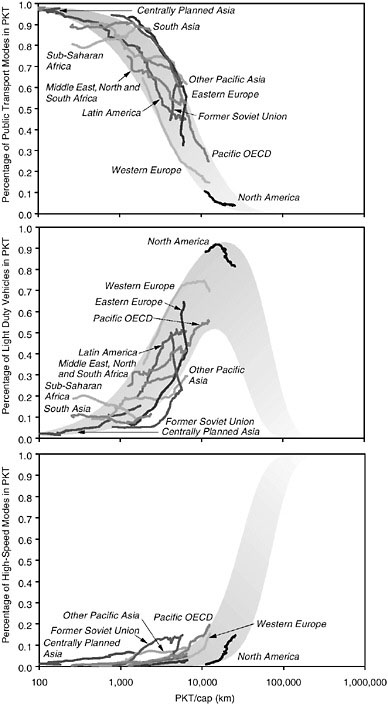
Figure 4 shows the continuous shifts toward faster modes of transport, from low-speed public transportation (the aggregate of buses and low-speed railways), to light-duty vehicles (automobiles and personal trucks, but, for simplicity, referred to as automobiles), to high-speed modes of transportation (aircraft and high-speed rail), again for a 51-year historical time horizon. Three distinct phases of dominance by a single transport mode can be seen. Low-speed public transportation is dominant for mobility levels of up to 1,000 km/cap; light-duty vehicles between 1,000 and 10,000 km/cap; and high-speed transport modes at even higher levels of mobility.
Similar to differences in total mobility, differences in travel costs and in urban land-use characteristics can lead to different levels in shares for transport modes at a given level of PKT per capita. However, the impact of policy measures on choice of transport mode is limited—at least on the aggregate levels shown. In Eastern Europe and the former Soviet Union, access to private automobiles was severely restricted until the transition toward a market economy in the early 1990s. Nevertheless, the modal trajectories have evolved largely within the shaded envelopes.
THE NEXT FIVE DECADES IN WORLD TRAVEL DEMAND
If travel-expenditure shares remain approximately stable, future increases in per capita GDP will continue to cause a rise in PKT. At the same time, the fixed travel-time budget will continue to push travelers toward faster modes of transport. The highest level of travel demand would be achieved if travelers used the fastest mode of transport for their entire daily travel-time budget 365 days a year. Assuming that aircraft gradually increase their current average “door-to-door” speed from about 260 km/h (including transfers to and from the airport) to 660 km/h, the current average airport-to-airport speed for domestic flights in the United States, and a travel-time budget of 1.2 h/d for 365 d/y, the annual per-person traffic volume would result in approximately 289,000 km. At that high mobility level, most travel would be international. Prices would adjust, and so would income levels.
Hence, regional differences in per capita traffic volume at a given GDP per capita, mainly resulting from differences in land use and prices, would decline, and the 11 trajectories would ultimately converge into a single point in the far future. Given historical development, it is assumed that the GDP per capita value of that “target point” would correspond to US$(2000) 289,000. (Sensitivity analyses show that the exact location of the target point has almost no impact on the levels projected for 2050.)
This imaginary world of high-speed transportation helps in projecting future levels of PKT by approximating each of the 11 world-regional trajectories in Figure 3 by one and the same type of regression equation and by constraining one parameter of that equation so that the simulated trajectory must pass through the target point.2 Future levels are then determined by the predicted levels of GDP/cap and population. The world-regional GDP per capita projections used here are derived from recent reference runs of the MIT Joint Program on the Science and Policy of Global Change Systems model, after slightly reducing the growth rates of industrialized regions and the reforming economies of Eastern Europe and the former Soviet Union and slightly increasing those of developing countries to match the mean values of past projections more closely (Nakicenovic, 2000; Paltsev et al., 2005). Overall, PPP adjusted gross world product per capita is projected to nearly double from US$(2000) 7,500 in 2000 to US$(2000) 14,200 in 2050. In addition to the 50 percent growth in world population, as suggested by the medium variant of the United Nations population projections (2004), gross world product would rise by a factor of nearly three.
Based on these changes in socioeconomic conditions, the stable relationship between growth in GDP and traffic volume implies that world-travel demand will increase approximately in proportion to the projected level of income, from 33 trillion passenger-km in 2000 to 105 trillion in 2050. Because of their projected higher growth in income and population, developing regions will contribute a rising share, ultimately accounting for 60 percent of world passenger-traffic volume in 2050, up from about 50 percent in 2000. (Higher growth rates of GDP in developing regions will further increase their absolute and relative importance in traffic volume.)
Given fixed travel time, future shares of low-speed public transportation modes, light-duty vehicles, and high-speed transportation systems must remain largely within the shaded envelopes in Figure 4. (The target point condition requires that high-speed transportation account for the entire traffic volume in a hypothetical world where the target point can be reached.) The precise shift in shares of transport modes, necessary to satisfy the projected travel demand through 2050, can be derived in a number of ways, but perhaps most convincingly by estimating the parameters of the functional form of statistical consumer-choice models. However, in this application, those models would require time-series data (ideally for 1950 to 2000) on speeds and travel costs for each transport
mode. These data can be derived for the United States and, to a limited extent, for a few European countries and Japan, but they are not available for most countries in the world.
Without these data, we can perform simplified projections by determining plausible future shares in each modal envelope at the projected level of per capita PKT, depending on whether a particular region is an early adopter or a latecomer to the diffusion of automobiles. Latecomers achieve lower shares of light-duty vehicle travel, here assumed to develop along the lower boundary of the automobile envelope in Figure 4, as they have already “leapfrogged” into high-speed travel and thus develop along the higher boundary of the high-speed transportation envelope in the same figure. (For a general introduction to diffusion theory, see Grübler, 1990.)
By contrast, future shares of high-speed transportation in the three industrialized regions and two reforming economies are estimated as the mean value of the upper and lower boundary of the envelope at the projected level of per capita GDP. The projection for the industrialized regions are then retrospectively compared to estimates from more sophisticated statistical-choice models, for which more complete speed and cost data are available. For example, the estimate of a detailed statistical-choice model for North America yields a 2050 share of 55 percent for high-speed transportation, which compares to 56 percent using the simplified approach. The use of statistical-choice models also allows us to conduct sensitivity tests (e.g., with regard to the stability of the travel-time budget). Should the travel-time budget increase from 1.2 to 1.5 hours per person per day (a 25 percent increase), the projected 2050 share of high-speed transportation would decline from 55 percent to 44 percent (a 20 percent decline). Although the decline in the 2050 share of high-speed transportation is significant, a 44 percent share still corresponds to three times the share for that transport mode in 2000.
In the industrialized world, light-duty vehicles and high-speed transportation modes will account for nearly the entire traffic volume in 2050 and for roughly equal shares. By contrast, in reforming economies and developing regions, automobiles will supply most of the PKT, followed by low-speed public transportation. In both meta-regions, however, high-speed transportation is also on the rise, accounting for nearly 20 percent of the 2050 passenger-traffic volume. Globally, the traffic shares of automobiles and low-speed public transport modes will decline by about 6 and 12 percentage points, respectively, below the 2000 level by 2050. At the same time, the relative importance of high-speed modes will increase from 10 percent to about 30 percent. Figure 5 summarizes the global development in PKT by major mode of transport for 1950, 2000, and 2050 (projected).
The simplified model necessarily has a number of limitations. Perhaps most important, the mode shifts in Figure 4 represent only the aggregate of two markets and do not capture substitutions in the urban and intercity transport seg-
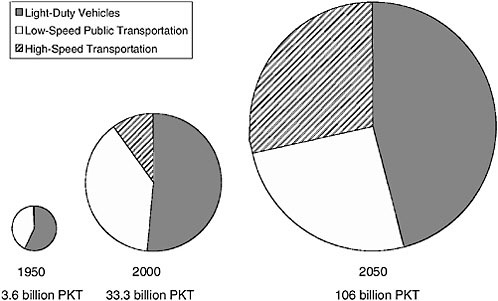
FIGURE 5 Global passenger-km traveled, by major mode of transport, in 1950, 2000, and 2050 (projected). Size of pies corresponds to PKT, which has been multiplied by nearly 10 times through 2000 and is likely to be multiplied by a factor of 30 by 2050. For comparison, GDP has grown by factors of 7 and 20, respectively.
ments. In the urban transportation segment, light-duty vehicles become more important to the cost of low-speed public transportation. By contrast, in intercity transport, automobiles are displaced by high-speed transportation modes. By disaggregating the data set into these two transportation markets and estimating (the functional form of) a nested, discrete-choice model, we could project plausible levels of shares for transport modes over time periods of more than 50 years. (Whether these projections will ultimately be achieved in reality is a different subject, which raises questions about whether such models are more valuable as tools for understanding interactions between humans and technology than for making exact predictions of the future.)
Another limitation is that the projection of future passenger mobility was performed in an unconstrained world. However, a separate analysis of potentially limiting factors, including the resource base of oil products, the need for higher aircraft speeds, the potential substitution of travel by telecommunication, increasing travel congestion, and so on, suggests that none of these constraints is likely to be binding in the next five decades. At some point in the future, however, the finite characteristics of our planet will necessarily have an impact on transportation systems.
IMPLICATIONS
The growth in travel demand and the shift toward faster transport modes have a number of implications. Two of the most important are for the amount of travel time spent in different transport modes and the impact on energy use and greenhouse-gas emissions.
Figure 6 shows the daily per-person travel distance by mode of transport (left) and the associated daily travel time (right) for 1950, 2000, and 2050 (projected) in North America (essentially the United States and Canada). Over the past 50 years, the daily travel distance has more than doubled, from 30 km to 70 km, while per-person travel time has likely remained stable (no time-use data are available for 1950). Over the next five decades, based on our projection of per capita GDP, daily mobility will double again, to 140 km, with high-speed transportation accounting for 56 percent. However, despite the growing demand for high-speed transport, travelers will continue to spend most of their travel time on the road. Although automobile travel time will decrease only slightly, the main change in travel-time allocation will be a net substitution of high-speed transportation for low-speed public transportation. A traveler in 2050 will spend an average of 12 minutes per day in the air or on high-speed railways (compared to two minutes today). If the per-person travel-time budget increases to 1.5 hours per day, the average daily high-speed travel time will decrease to about 9 minutes.
Although total travel time may not be affected by the increase in travel demand, energy use and greenhouse-gas emissions will change. All factors being
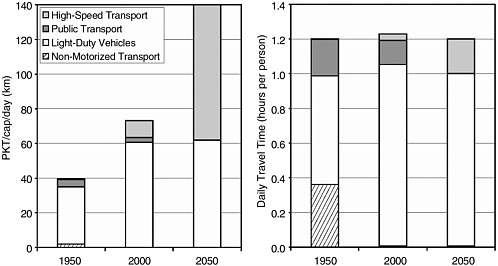
FIGURE 6 Daily per-person travel distance by mode of transport (left) and associated daily travel time (right) for 1950, 2000, and 2050 (projected) in North America.
equal, rising travel demand will cause a proportional increase in passenger-travel energy use. Given that (synthetic) oil products are likely to continue dominating the future fuel supply of the transportation system, over the next five decades, directly released greenhouse-gas emissions will also rise, roughly in proportion to travel demand. (The increase in life-cycle greenhouse-gas emissions could be greater if there is a significant shift toward unconventional oil, such as extra-heavy oil, oil sands, shale oil, or synthetic oil from natural gas or, especially, coal.) Changes in passenger-travel energy intensity (i.e., energy use per PKT) will also influence levels of passenger-travel energy use and greenhouse-gas emissions.
In the absence of more fuel-efficient transport modes, three trends will determine future levels of energy intensity. First, any increase in travel speed will cause an increase in energy intensity. Based on current and average U.S. data, a complete shift from low-speed public transportation to light-duty vehicles in urban travel would increase energy intensity by 25 percent. For intercity travel, a complete shift from low-speed public transportation to light-duty vehicles would increase energy intensity by almost 60 percent. A shift toward air travel would increase it by another 40 percent. In the United States, most of these changes have already taken place. If the ongoing shift from automobile intercity travel toward aircraft continues, intercity passenger-travel energy intensity will increase by 15 to 20 percent by 2050.
Second, the change to air travel for intercity transport will also increase the relative importance of urban automobile travel, which is more energy intense than intercity automobile travel because of varying engine loads and low occupancy rates. Thus, this shift will cause an increase in average automobile-travel energy intensity. However, even though the energy intensity of urban travel is twice that of intercity travel, it will probably only increase 10 percent or less, because nearly all PKT by automobiles already occurs over relatively short distances.
Third, the substitution of air transportation for intercity automobile travel mainly occurs at trip distances of less than 1,000 km, distances at which aircraft energy use is mainly determined by the energy-intensive takeoff and climb stages. Aircraft energy intensity at such stage lengths can be twice as high as for trips of more than 1,000 km (Babikian et al., 2002).
In North America, the strong growth in air travel suggests that the combined effect of these three trends is determined mainly by the change in aircraft energy intensity resulting from the relative growth in different market segments. However, because the average energy intensity of total air travel is lower than for automobiles and low-speed public transport modes operating in urban areas, the overall effect of these changes is likely to be negligible. Thus, total energy use and greenhouse-gas emissions will rise roughly in proportion to the growth in PKT (i.e., by 2050, 130 percent over the 2000 level, based on our assumptions of GDP growth). In Western Europe, the combination of these trends may result in
TABLE 1 Projected Percentage Change in Aircraft Energy Use by 2050
passenger-travel energy intensity rising by 2050 by as much as 20 percent above the level for 2000.
The situation is fundamentally different, especially in developing countries, where the substitution of automobiles for low-speed public transportation is just beginning. Combined with a future decline in vehicle occupancy rates (mainly a consequence of increasing female participation in the labor force), the impact of these trends on passenger-travel energy intensity may be 50 to 100 percent. Compensating for this increase in energy intensity in developed countries already requires sophisticated fuel-saving technology.
In the passenger-transport sector, air travel accounts for the fastest growth in energy use and greenhouse-gas emissions. In addition to the projected ninefold increase in global air-travel demand, future levels of air-travel greenhouse-gas emissions will depend on which technologies are used, assuming that (synthetic) oil products continue to fuel air transportation. Table 1 shows the major opportunities for reductions in aircraft energy use for a given travel demand based on recent studies. Even if aircraft energy use is reduced by 33 to 56 percent by 2050, the 2000 level of carbon dioxide emissions would still be multiplied by a factor of four to six. Thus, controlling greenhouse-gas emissions from transportation will remain a significant challenge for generations to come.
REFERENCES
Babikian, R., S.P. Lukachko, and I.A. Waitz. 2002. Historical fuel efficiency characteristics of regional aircraft from technological, operational, and cost perspectives. Journal of Air Transport Management 8(6): 389–400.
Grübler, A. 1990. The Rise and Fall of Infrastructures. Heidelberg, Germany: Physica-Verlag.
Heston, A., R. Summers, and B. Aten. 2002. Penn World Table Version 6.1, Center for International Comparisons at the University of Pennsylvania (CICUP), October 2002. Available online at: http://pwt.econ.upenn.edu/php_site/pwt_index.php.
Jamin, S., A. Schäfer, M.E. Ben-Akiva, and I.A. Waitz. 2004. Aviation emissions and abatement policies in the United States: a city pair analysis. Transportation Research D 9(4): 294–314.
Lee, J.J., S.P. Lukachko, I.A. Waitz, and A. Schäfer. 2001. Historical and future trends in aircraft performance, cost, and emissions. Annual Review of Energy and the Environment 26: 167– 200.
Nakicenovic, N., ed. 2000. Special Report on Emissions Scenarios. Intergovernmental Panel on Climate Change. Cambridge, U.K.: Cambridge University Press.
Paltsev, S., J.M. Reilly, H.D. Jacoby, R.S. Eckaus, J. McFarland, M. Sarofim, M. Asadoorian, and M. Babiker. 2005. The MIT Emissions Prediction and Policy Analysis (EPPA) Model: Version 4. MIT Joint Program on the Science and Policy of Global Change, Report 125. Cambridge, Mass.: MIT Press. Available online at: http://web.mit.edu/globalchange/www/reports.html#pubs.
Schäfer, A. 1998. The global demand for motorized mobility. Transportation Research A 32(6): 455– 477.
Schäfer, A., and D.G. Victor. 2000. The future mobility of the world population. Transportation Research A 34(3): 171–205.
United Nations. 2004. World Population Prospects: The 2004 Revision Population Database. United Nations Population Division. Available online at: http://esa.un.org/unpp/.
Zahavi, Y. 1981. The UMOT-Urban Interactions. DOT-RSPA-DPB 10/7. Washington, D.C.: U.S. Department of Transportation.
FURTHER READING
Marchetti, C. 1994. Anthropological invariants in travel behavior. Technological Forecasting and Social Change 47: 75–88.
Zahavi, Y., and A. Talvitie. 1980. Regularities in travel time and money expenditures. Transportation Research Record 750: 13–19.


