
Energy and Environmental Impacts of Personal Mobility
MATTHEW J. BARTH
University of California, Riverside
Personal mobility is critical for a progressive society. The freedom to travel anywhere at anytime with few restrictions is a precondition for a vibrant economy. However, mobility is often restricted by limitations in the transportation infrastructure. For example, when many people use the infrastructure at the same time, congestion invariably occurs. One can look at this phenomenon as a resource-management problem. If resources (i.e., the transportation infrastructure) are limited and demand is high, congestion is likely to occur. Two ways of solving this problem are (1) by providing additional resources and/or (2) reducing demand.
In the United States, the transportation system has primarily been developed around the automobile, and the majority of personal trips are made by driving cars to various destinations. Statistics show that only a small percentage of the U.S. travel demand is satisfied by public transit. Instead, we have invested billions of dollars into building a large network of roadways that allow people to drive automobiles almost anywhere. Since the major buildup of roads from the 1950s through the 1990s, it has become significantly more difficult to construct new roadways because of higher population densities and subsequent land-use restrictions. Instead, transportation officials are now investigating intelligent transportation systems and other means to increase the capacity of existing roadways through computer, communications, and control technologies (DOT, 2001). The theory is that by improving overall capacity, congestion on the roadways would be reduced.
Nevertheless, studies have shown that roadway congestion continues to get worse. For example, the Texas Transportation Institute (TTI) conducts an Annual Mobility Study that includes estimates of traffic congestion in many large cities and the impact on society (Schrank and Lomax, 2005). The study defines congestion as “slow speeds caused by heavy traffic and/or narrow roadways due to construction, incidents, or too few lanes for the demand.” Because traffic volume has increased faster than road capacity, congestion has gotten progressively worse, despite the push toward alternative modes of transportation, new technologies, innovative land-use patterns, and demand-management techniques.
Some of the major concerns raised by roadway congestion are impacts on energy consumption and air quality. The TTI Annual Mobility Study estimates that billions of gallons of fuel are wasted every year because of congestion (Schrank and Lomax, 2005). In addition, heavy congestion often leads to greater mobile-source emissions. One way to estimate the energy and emissions impacts of congestion is to examine velocity patterns of vehicles operating under different levels of congestion. Roadway congestion is often categorized by the “level of service” (LOS) (TRB, 1994). For freeways (i.e., uninterrupted flow), LOS can be represented as a ratio of traffic flow to roadway capacity. There are several different LOS values that are represented by the letters A through F. For each LOS, a typical vehicle-velocity trajectory will have different characteristics.
Examples of these velocity trajectories are shown in Figure 1 (EPA, 1997). Under LOS A, vehicles typically travel near the highway’s free-flow speed, with few acceleration/deceleration perturbations. As LOS conditions get progressively worse (i.e., LOS B, C, D, E, and F), vehicles travel at lower average speeds with more acceleration/deceleration events. For each representative vehicle-velocity trajectory (such as those shown in Figure 1), it is possible to estimate both fuel consumption and pollutant emissions. For automobiles, we are most often concerned about emissions of carbon monoxide (CO), hydrocarbons (HCs), oxides of nitrogen (NOx), and particulate matter.
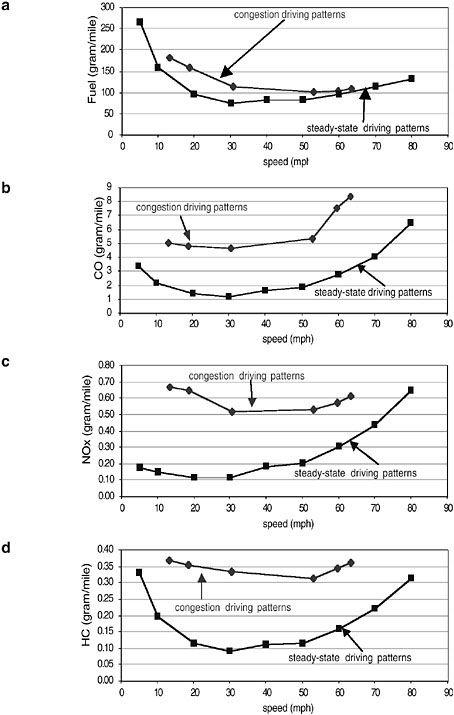
Figure 2 shows examples of automobile fuel consumption and emission rates that correspond to the average speeds of the representative velocity trajectories shown in Figure 1. Fuel consumption and emission rates are normalized by distance traveled, given in units of grams per unit mile. As expected, when speeds are very low, vehicles do not travel very far; therefore, grams per mile emission rates are quite high. In fact, when a car is not moving, we get an infinite-distance normalized emission rate. Conversely, when vehicles travel at higher speeds, they experience higher engine load requirements and, therefore, have higher fuel consumption and emission rates. As a result, this type of speed-based emission-factor curve has a distinctive parabolic shape, with high emission rates on both ends and a minimum rate at moderate speeds of around 45 to 50 mph.
Figure 2 shows a fuel-consumption and emissions curve for a vehicle (an average “composite” vehicle representing the 2005 vehicle fleet in southern Cali-
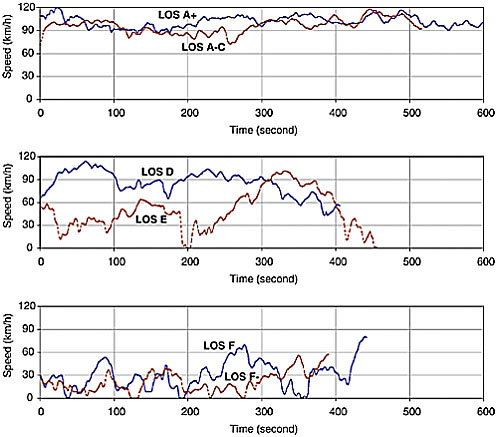
FIGURE 1 Sample vehicle-velocity trajectories for different LOS on a freeway (based on EPA facility-cycle development). Source: EPA, 1997.
fornia) traveling at a perfectly constant, steady-state speed. Of course, vehicles moving in traffic must do some amount of “stop-and-go” driving, and the associated accelerations and decelerations lead to higher fuel consumption and emissions. The constant, steady-state speed line in Figure 2 shows the lower bound of fuel consumption and emissions for any vehicle traveling at that speed.
Several important results can be derived from this information:
-
In general, whenever congestion brings the average vehicle speed below 45 mph (for a freeway scenario), there is a negative net impact on fuel consumption and emissions. Vehicles spend more time on the road, which results in lower fuel economy and higher total emissions. Therefore, in this scenario, reducing congestion will improve fuel consumption and reduce emissions.
-
If congestion brings average speeds down from a free-flow speed of about
-
65 mph to a slower speed of 45 to 50 mph, congestion can actually improve fuel consumption and lower emissions. If relieving congestion increases average traffic speed to the free-flow level, fuel consumption and emissions levels will go up.
-
If the real-world, stop-and-go velocity pattern of vehicles could somehow be smoothed out so an average speed could be maintained, significant fuel consumption savings and emissions reductions could be achieved.
A similar analysis can be performed for roadway travel on arterials and residential roads (i.e., interrupted flow patterns). These analyses are a bit more complicated, but they too show that any measure that keeps traffic flowing smoothly for longer periods of time (e.g., operational measures, such as synchronization of traffic signals) improves overall fuel economy and lowers emissions. It is important to note that fuel/emissions congestion effects are much more pronounced for heavy-duty trucks, which tend to have much lower power-to-weight ratios than cars.
Three general areas can be addressed for decreasing congestion and improving mobility and accessibility: supply, demand, and land use. Supply management techniques include adding resources and capacity to the transportation infrastructure. Examples include building additional roads and adding lanes to existing roads to increase roadway capacity; building bike paths or lanes and walkways to promote these alternative modes of transportation; improving transit facilities and services, as well as intermodal facilities and services, to encourage people to use mass transit more often; improving overall system operations (e.g., responding quickly to roadway incidents); and implementing intelligent transportation system techniques to improve travel efficiency.
Demand management could involve pricing mechanisms to limit the use of resources; providing a much greater range of alternative modes of transportation; encouraging alternative work locations and flexible work schedules; and encouraging or even requiring employers to provide travel-support programs. Land-use management would require better urban design, mixed-use land development, increased housing and industry density, innovative planning and zoning, and growth management.
It is important that these different areas should be addressed together, rather than separately. If supply alone is increased, this will likely induce additional demand. On the other hand, providing demand management without increasing supply could limit economic growth. Therefore, the best way to approach the problem of traffic congestion is to address all three areas together.
Within these three general areas are several specific programs that can reduce congestion and also help reduce energy consumption and emissions. The following list is not exhaustive, but it provides examples of some things that are being done today and some that could be done in the future.
Intelligent Speed Adaptation (ISA) typically consists of an onboard system
that monitors the location and speed of a vehicle, compares it to a defined set speed, and takes corrective action, such as advising the driver and/or limiting the top speed of the vehicle. Researchers in Europe are actively investigating ISA systems and are currently evaluating their effects on safety, congestion, and environmental impacts (Servin et al., 2006).
Carsharing is a new mobility strategy that offers an alternative to individual vehicle ownership by providing a fleet of vehicles that can be shared throughout the day by different users. Carsharing improves overall transportation efficiency by reducing the number of vehicles required to meet total travel demand (e.g., Barth and Shaheen, 2002).
Public transit is seldom used in the United States because it has typically been inflexible and unreliable. However, new Enhanced Transit Systems, such as Bus Rapid Transit (BRT) and other systems that provide intermodal linkages of standard transit routes, are becoming available (Levinson et al., 2003).
Smart Parking is a strategy that can lead to significant savings in fuel consumption and reductions in emissions. Smart parking uses advanced technologies to direct drivers to available parking spaces at transit stations (and other locations). This encourages the use of mass transit, reduces driver frustration, and reduces congestion on highways and arterial streets (Rodier et al., 2005).
Transit-Oriented Developments (TODs) promote the use of mass transit by integrating multiple transit options in high-density developments that include residential, commercial, and retail areas. TODs have been demonstrated to increase the use of mass transit and pedestrian traffic and reduce the use of private vehicles (Cervero et al., 2004).
Innovative Modes of Transportation can be used in addition to automobiles to satisfy travel demand. New travel modes can include the Segway™ huma transporter, electric bicycles, and neighborhood electric vehicles.
SUMMARY
Roadway congestion and associated environmental impacts will continue to get worse unless a number of alternatives are introduced. Although a certain amount of congestion can have a positive impact on fuel consumption and vehicle emissions by slowing traffic, severe congestion has the opposite effect. A number of transportation innovations can be implemented to improve overall personal mobility with minimal energy and environmental impacts.
REFERENCES
Barth, M., and S. Shaheen. 2002. Shared-use vehicle systems: a framework for classifying carsharing, station cars, and combined approaches. Transportation Research Record No. 1791: 105– 112.
Cervero, R., R. Arrington, J. Smith-Heimer, and R. Dunphy. 2004. Transit-Oriented Development in the United States: Experiences, Challenges, and Prospects. Washington, D.C.: Transit Cooperative Research Program.
DOT (U.S. Department of Transportation). 2001. The National ITS Architecture: A Framework for Integrated Transportation into the 21st Century. CD book from U.S. Department of Transportation, ITS Joint Program Office. Available online at: www.itsa.org/public/archdocs/ national.html.
EPA (Environmental Protection Agency). 1997. Development of Speed Correction Cycles. Technical Document #M6.SPD.001, June 1997, prepared by Sierra Research. Washington, D.C.: EPA.
Levinson, H., S. Zinnerman, J. Clinger, S. Rutherford, and R. Smith. 2003. Bus Rapid Transit Systems. Transit Cooperative Research Programs Report #90, Transportation Research Board, The National Academies. Washington, D.C.: Transportation Research Board.
Rodier, C., S. Shaheen, and A. Eaken. 2005. Transit-based smart parking in the San Francisco Bay Area, California: assessment of user demand and behavioral effects. Transportation Research Record 1927: 167–173.
Schrank, D., and T. Lomax. 2005. The 2005 Urban Mobility Report. Texas Transportation Institute, Texas A&M University System. Available online at: http://mobility/tamu.edu.
Servin, O., K. Boriboonsomsin, and M. Barth. 2006. An Energy and Emissions Impact Evaluation of Intelligent Speed Adaptation. Pp. 1257–1262 in Proceedings of the 2006 IEEE Intelligent Transportation Systems Conference, Toronto, Canada. Piscataway, N.J.: IEEE.
TRB (Transportation Research Board). 1994. Highway Capacity Manual. Special Report 209. Washington, D.C.: National Academy Press.


