
CHAPTER TWO
Flood Mapping
This chapter provides a brief description of how floods are analyzed and floodplain maps constructed. It compares the Federal Emergency Management Agency (FEMA) floodplain mapping process with the more traditional process used by the U.S. Army Corps of Engineers for flood damage reduction studies.
A FEMA floodplain or flood hazard map shows the land area that would be inundated during a 100-year flood—a flood event that has a 1 percent probability of occurring in any given year. Figure 2.1 shows such a map for Bexar County, Texas, which contains the City of San Antonio. The blue area is inundated during the 1 percent flood event, the white area shows the urbanized area of the City of San Antonio and its surrounding communities, the yellow and black dashed line is the boundary of Bexar County, and the flood map is displayed over a gray-shaded relief map of digital elevation data from the National Elevation Dataset. FEMA Map Modernization involves creating maps such as Figure 2.1 for the nation’s higher-flood-risk areas, which will cover greater than 92 percent of the population and 65 percent of the land area of the nation.
Interpretation of the floodplain map in Figure 2.1 is different from interpretation of other kinds of maps—the figure does not depict something that is readily visible like a street map or a land use map. It is an actuarial map in the sense that it shows the area that would be flooded at a given risk in any year. San Antonio suffered flooding from severe storms in 1998 and 2002, but in neither case would the resulting flood inundation map appear exactly as shown in Figure 2.1 because storm rainfall varies sufficiently in time and space and the inundation map that results from each severe storm is unique. Indeed the time of maximum flood inundation varies in space across the county so there is never a single occasion when all the streams are flooded to a specific recurrence interval event—what is plotted on the floodplain map is the extent of the 1 percent annual chance flood inundation no matter when it occurs during the design storm event.
Moreover, it is difficult to observe flood inundation directly because this requires the capacity to do remote sensing from aircraft or satellites. Dense cloud cover and severe weather during storm events often prevent such observations. What can be collected are “high-water marks”—the height of flood debris deposits beside stream channels or the level of high-water lines on walls. These data are used subsequent to a severe flood to calibrate computer models simulating the flood event, along with observed flood hydrographs. Fig-ure 2.2 shows the flood hydrograph, or graph of flood discharge versus time, for the flood of July 2002 in Leon Creek, one of the principal drainage areas in San Antonio, as measured at the U.S. Geological Survey (USGS) gauging station located where Leon Creek crosses Interstate Highway 35.
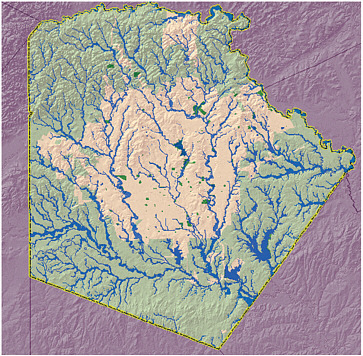
FIGURE 2.1 Floodplain map of Bexar County, Texas. The blue area is area inundated during the 1 percent annual flood event; the white area shows the urbanized area of the City of San Antonio and its surrounding communities. The yellow and black dashed line is the boundary of Bexar County. The flood map is displayed over a gray-shaded relief map of digital elevation data from the National Elevation Dataset. SOURCE: San Antonio River Authority. Reprinted with permission.
2.1
FLOOD MODELING
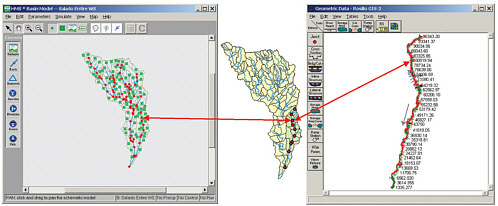
The floodplain map for a county is created by constructing flood simulation models for each stream reach under investigation. FEMA flood maps are created for streams with a drainage area that typically exceeds 1 square mile and has risk that warrants a map based on input from the local community officials and FEMA regional staff. Where flood simulation models already exist, they may be used as is or updated with new framework data to support a flood mapping study. Figure 2.3 shows flood modeling for Salado and Rosillo Creeks, two of the watersheds within San Antonio. The left-hand side of Figure 2.3 shows a Hydrologic Engineering Center—Hydrologic Modeling System (HEC-HMS) flood hydrology model for the whole of the Salado Creek watershed, of which Rosillo Creek is a
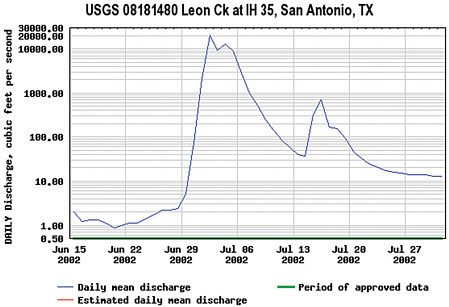
FIGURE 2.2 Flood flow hydrograph for Leon Creek at Interstate Highway 35, San Antonio, Texas, for the July 2002 flood. SOURCE: USGS National Water Information System.
tributary, and the right-hand side of this figure shows a HEC-RAS (River Analysis System) flood hydraulic model of Rosillo Creek. The Hydrologic Engineering Center of the U.S. Army Corps of Engineers (USACE) in Davis, California, is the principal source for flood simulation models used in FEMA flood map studies.
The Hydrologic Modeling System is a computer program that transforms storm rainfall input to streamflow discharge output using watershed characteristics such as drainage area, slope, length of the longest flow path, and land cover and soil type, to modulate the conversion of storm rainfall to streamflow. For a FEMA flood map study, the storm input is a rainfall event, determined by statistical analysis to have a 1 percent chance of being equaled or exceeded in any year. The HEC-HMS program takes this storm and transforms it into a flood hydrograph such as that shown in Figure 2.2, computed at each of the points indicated by a red dot in the center of Figure 2.3. This calculation determines the maximum flow or discharge of water that the creek will experience during this storm event at each computed location.
The HEC River Analysis System is a computer program that takes the maximum flood discharge at each point along a river reach and transforms it into a water surface elevation
at each location in the reach where it has a stream cross section, indicated by the red lines and annotated stream locations in the right-hand side of Figure 2.3. The RAS is used for about 80 percent of the new streams in FEMA studies, but many models other than the RAS exist to complete the FEMA studies. A typical result for one cross section is shown in Figure 2.4. Elevation on the left-hand side of this diagram is in feet, and the black dots and lines in the diagram are the ground surface elevations at this cross-section location.
2.2
FLOOD DAMAGE
The damage that floods cause is a function of the depth of flood inundation, the frequency with which floods occur, and the buildings and human beings that the flood affects. Buildings located in the interior of the floodplain near the stream are flooded more frequently and at greater depth than those on the periphery near the floodplain boundary. Indeed, the floodplain boundary itself is the location the floodwaters reach, on average, at least once in a hundred years. Flood damage mitigation projects are planned and carried out by cities and counties, often in collaboration with the USACE, which bears half the cost of the projects. In planning flood damage mitigation projects, the USACE uses the HEC-HMS
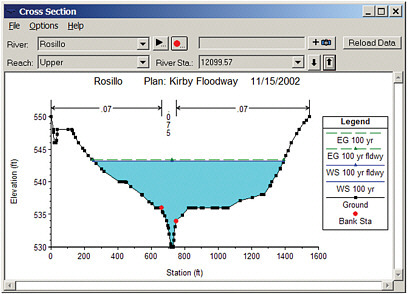
FIGURE 2.4 Floodwater surface elevation computed using HEC-RAS model for one cross section on Rosillo Creek, San Antonio, Texas. SOURCE: San Antonio River Authority.
hydrology and the HEC-RAS hydraulic models in the manner previously described; the USACE also estimates the flood damage using the Flood Damage Assessment (FDA) model (HEC-FDA). A complete inventory of the structures in the floodplain is entered into HEC-FDA, along with the elevation of the first floor of each structure. The cost of flood damage to each structure is calculated as a percentage of the value of the structure and its contents, the percentage varying with the type of structure and the depth to which it is flooded. This process is repeated for a series of flood severities, typically the 2-, 5-, 10-, 25-, 50-, 100-, 250- and 500-year events (corresponding to floods that have 50, 20, 10, 4, 2, 1, 0.4, and 0.2 percent chance of occurring in any year). The flood damage is summed over each structure in the floodplain and integrated over all flood severities to arrive at an annual average damage cost in the flooded region. To this total is added the cost of other sources of flood damage, such as disruption and damage to the transportation system, to form an estimate of the total expected annual flood damage. The benefits of a flood damage mitigation project are measured by the corresponding reduction in expected annual flood damage, and the optimal project alternative selected is that which maximizes benefits minus the cost of the project construction.
A previous National Academies report on Risk Analysis and Uncertainty in Flood Damage Reduction Studies examined the uncertainty in the USACE hydrologic, hydraulic, and economic analysis methods (NRC, 2000). The report concluded that the procedures for accounting for uncertainty in the hydrologic and hydraulic components of the process were sound but limitations existed in the procedure for uncertainty in economic analysis, in part because of spatial correlation of the errors in elevation of the first floors of buildings.
2.3
FLOOD MAPPING
The floodplain map is constructed by using the water surface elevation to identify the “wetted part” on each cross-section line along the stream, then joining the ends of these wetted parts taking into account the contour of the land surface so as to define the flood hazard zone, as shown in Figure 1.1. Contours of the Base Flood Elevation (BFE) are drawn over the flood hazard zone to document the vertical water surface elevation at that location. The process of constructing a hydrologic model of flood discharge, a hydraulic model floodwater surface elevation, and a flood hazard zone map is repeated for each stream reach; then the individual flood hazard zone maps are joined to create the floodplain map for the county or community.
The FEMA flood mapping process uses a simplified form of flood analysis employed in the USACE flood damage reduction studies. The flood hydrology and hydraulic modeling components are similar, but the third component in the USACE process is the conduct of an economic analysis of flood damage, while in the FEMA process it is the construction of a floodplain map. Another important difference is that FEMA floodplain mapping is
a national effort covering entire counties in each study, and large regions of the nation as completed county studies accumulate, while the USACE process is local to a particular river or stream with flood problems. The large spatial extent of the FEMA flood mapping process means that it has to place a greater reliance on automated hydrologic and hydraulic methods. Indeed, in many FEMA flood mapping studies, the design flood discharge is estimated directly from USGS regression equations contained in the USGS National Flood Frequency program, and no rainfall-runoff model such as HEC-HMS is used. The large geographic areas of interest to the FEMA flood mapping program makes this a qualitatively different task than traditional hydraulic engineering studies for flood damage reduction.
Framework data are used at all three stages in the FEMA flood mapping process but are most crucial for the flood hydraulics and hazard zone mapping. Flood hydrology depends on a more generalized view of the landscape and its watershed characteristics and is less reliant on precise elevation or base map information. Precise elevation information is critical to both the input and the output of flood hydraulic analysis—the input because it is from such information that stream cross sections are developed, and the output because the boundary of the flood hazard zone has to be interpolated from one cross section to the next using a contour map or a digital elevation model. To ensure that the flood hazard map and the flood hydraulic model conform to one another, it is important to use consistent elevation information throughout each of the component processes.
This discussion indicates that uncertainty in mapped flood hazard zones and BFEs arises from a variety of sources—uncertainty in the magnitude of the flood discharge, in the modeling
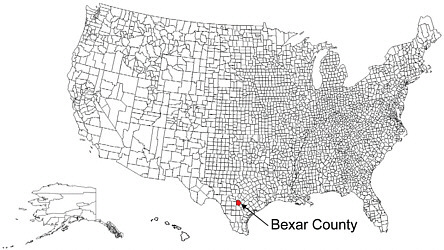
FIGURE 2.5 The 3,140 counties of the United States.
of flood hydraulics, and in the transformation of the modeled water surface elevation onto a map. This report deals only with the influence of framework information on determination of the floodplain; a forthcoming National Research Council study on flood map accuracy will examine the totality of these uncertainties in much greater detail.
From the viewpoint of hydrology and hydraulics, the concern with precise framework information is for the flood hazard zone in and around a stream. However, when constructing a floodplain map for a county, it is impractical to construct framework information for just those locations—it is more practical to prepare maps with base and elevation data for the entire county or by complete drainage basins.
FEMA Map Modernization seeks to create a floodplain map such as that shown for Bexar County in most counties in the United States, as shown in Figure 2.5. This involves flood modeling for several million stream reaches, and logistical considerations require the use of automated hydrologic and hydraulic methods as described in Chapter 3. As a result, FEMA Map Modernization relies heavily on nationally available framework data sources. The task of this report is to examine whether these data sources are of adequate quality to support this effort.


