
4
Limitations of the Current Data System for Measuring Business Dynamics
The U.S. statistical agencies provide a wealth of information about the activities of U.S. businesses.1Moreover, in an era of tight budgets, they have continued to innovate and respond to measurement needs for a rapidly changing economy. Despite these successes, there remain a number of large data gaps in U.S. business statistics. A key deficiency relates to data integration and coordination. The system of economic accounts is balkanized given that the underlying source data are obtained by multiple agencies. As emphasized in a recent volume on the “architecture” of the national accounts (Jorgenson, Landefeld, and Nordhaus, 2006), considerable gains could be realized through better integration of data—both administrative and survey based—some of which would require more extensive data sharing between the Bureau of Economic Analysis (BEA), the Bureau of Labor Statistics (BLS), and the Census Bureau.
One way to evaluate systemic data gaps is to ask whether it is feasible to go from the aggregate statistics to the firm level in a consistent manner. The feasibility of disaggregating data is of interest for a number of reasons. It is useful as a tool to help identify data gaps, since the inability to drill down to the micro level may reveal situations in which there are limited or no source data underlying an aggregate statistic. An example is the measurement of capital expenditures by detailed asset type and by industry.
|
1 |
Appendix A provides an overview of the major federal business data sources. |
Such statistics, produced by BEA, are used frequently to gauge which industries are heavy users of advanced technologies. However, underlying source data are extremely sparse and very strong assumptions are required to produce these statistics (see Becker et al., 2006). More generally, the ability to disaggregate data down to the firm level has practical applications for both the measurement and interpretation of business statistics. For measurement, anomalies can be identified through scrutiny of the underlying source data. For interpretation, observed changes may reflect fundamental compositional changes in the mix of firms that are important for understanding the business cycle or secular trends in the economy.
It is possible to connect some key aggregate statistics, such as employment and payroll, to the underlying firm-level data, and recent programs at BLS and at the Census Bureau exploit this micro-macro link. However, for most key aggregate statistics, particularly those that require combining nominal values (such as nominal gross output) and prices, this is not feasible. The reason is that nominal activity measures for firms are collected by the Census Bureau, whereas nominal prices are collected by BLS; these data cannot be shared and thus they cannot be integrated at the firm level. Even with data sharing, coordination and integration of the administrative and survey data would be required to permit such drilling down from aggregate statistics. In short, for key national statistics such as real value added, real capital expenditures, or real productivity growth of a sector, it is impossible to connect back to firm-level statistics. Again, this shortcoming reflects data gaps as well as lack of data integration.
This report is primarily about the importance of measuring changes in businesses. As has been emphasized throughout, the existing system of accounts and underlying source data focus on measuring the level and cross-sectional variation in the levels of activity. The neglect of business dynamics and the role of young and small businesses in accounting for growth are related to the data gap problems discussed above. In order to capture the contribution of young and small businesses, the underlying administrative data tracking businesses must include them in a consistent and coordinated manner across the statistical agencies. Moreover, administrative data, while a powerful source of information on U.S. businesses, do not include a number of important firm characteristics that must therefore be collected by surveys. The neglect of young and small businesses by the existing system implies that a number of these key measures are not collected in a representative manner.
To explore these data gaps for measuring business dynamics, this chapter reviews the nature of data coverage of U.S. businesses past and present. Since administrative data sources can be used to track business dynamics, and in particular young and small businesses, we then turn our attention to data gaps in the business registers. However, since administrative data must
be supplemented with survey data, we also describe weaknesses in existing surveys. Finally, since a significant part of the data gap for measuring both levels and growth of economic activity reflects a lack of data sharing and data access, we also discuss these issues.
4.1
DATA COVERAGE OF YOUNG AND SMALL BUSINESSES
For much of its history, business data coverage in the United States was by and large limited to the agriculture and manufacturing sectors, reflecting where much of the economic activity in the country was located. Some of the earliest efforts by private-sector firms to count and characterize firms included those by R.G. Dun and Company, which produced credit reports on firms in the 1840s, with information on owners, ownership structure, firm performance, and financial transactions. From 1842 to 1890, the company amassed records on some 1.2 million firms (Madison, 1975). Dun & Bradstreet data extend back sporadically to the 1870s for some sectors of the economy.
On the government side, various censuses of manufacturing were conducted, some at the state level, prior to 1900. The 1810 Census of the Population was the first to include questions—albeit a highly limited set—on manufacturing. The Office of Business Economics, the precursor of BEA, began producing data on the number of firms by major industry in 1929 and continued to do so through 1963, at which time the program was discontinued due at least in part to concerns about data quality. By the mid-1950s, the quinquennial economic census was developed to the point that the Census Bureau’s Enterprise Statistics Program was able to produce statistics on firm size for selected industries. However, even with additional input from the bureau’s County Business Patterns—begun in 1946 but not available annually until 1964—data production was sporadic and incomplete, typically released with four- or five-year lags (Armington, 2004, p. 2).
It was not until the development of comprehensive business lists that the statistical agencies began generating high-quality descriptive data on something approaching the universe of U.S. employer businesses. Historically, most data collection by federal statistical agencies has been oriented toward a cross-sectional view of business activity. While progress has been made more recently at the statistical agencies to develop and improve statistics on business dynamics, there are still important topics that cannot be adequately explored due to data deficiencies.2
Figure 4-1 summarizes the distribution of business data coverage, mapping data sources in terms of the business and labor populations they cover
|
2 |
See Appendix A for a review of business data sources relevant to business dynamics. |
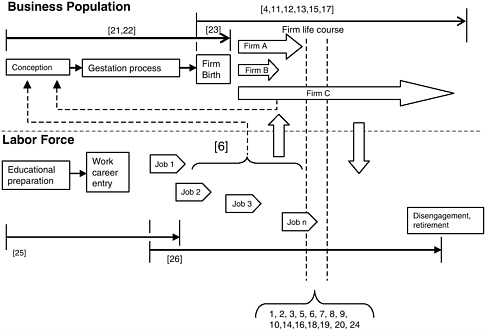
FIGURE 4-1 Stylized depiction of current data coverage.
Key to Numbered Data Sets
-
BLS, Business Establishment List
-
BLS, Quarterly Census of Employment and Wages
-
BLS, Current Employment Statistics
-
BLS, Business Employment Dynamics
-
BLS, American Time Use Survey
-
BLS-Census: Current Population Surveys
-
U.S. Census Business Registrar
-
U.S. Census Company Organization Survey
-
U.S. Census, Economic Census
-
U.S. Census Survey of Business Owners
-
U.S. Census Longitudinal Business Database
-
U.S. Census Integrated Longitudinal Business Database
-
U.S. Census Longitudinal Employer-Household Dynamics
-
Dun & Bradstreet Duns Market Identifier file
-
NSF [U.S. Census] Longitudinal Research Database
-
SBA Statistics of U.S. Businesses
-
Business Information Tracing Series [BITS]
-
FRB Survey of Small Business Finances
-
IRS Survey of Income
-
Standard & Poor’s Compustat
-
Kauffman Foundation Panel Study of Entrepreneurial Dynamics [University of Michigan]
-
Kauffman Foundation and Others: The Global Entrepreneurship Monitor
-
Kauffman Firm Survey [Mathematica]
-
Kauffman Financial and Business Databases
-
National Longitudinal Survey of Youth [BLS, conducted by Ohio State/NORC]
-
Panel Study of Income Dynamics [University of Michigan]
along a life-cycle continuum. The top portion of the figure categorizes efforts for which the unit of analysis is the business entity; the lower portion emphasizes individuals participating in the labor force. Dynamic processes associated with each unit of analysis are depicted by the horizontal arrows. As represented by block arrows labeled Firm A, Firm B, and Firm C, firms are developed and implemented, they grow and shrink and, at some point, many deactivate. Similarly, as represented by block arrows Job 1, Job 2, Job 3, etc., individuals complete their schooling, enter the labor force, take a series of jobs, and eventually withdraw and retire. Some members of the labor force become involved in creating new firms, represented by the dashed line from the job arrows to the block labeled “conception.” Some new firms are created by existing firms, represented by the dashed line from “Firm C” to the block labeled “conception.” The considerable cross-level activity is represented by vertical arrows.
The numbers in brackets refer to 26 different current data collection activities identified by the panel. Sixteen of these data collection efforts [1, 2, 3, 5, 6, 7, 8, 9, 10, 14, 16, 18, 19, 20, 22, 24] are designed to provide time-specific estimates, suitable for cross-sectional or cross-temporal assessments, but they do not allow for tracking the same units of analysis over time. Six [4, 11, 12, 13, 15, 17] allow for tracking of firm changes once they are incorporated into official business registries. Two [25, 26] capture individuals at different stages of their life-course work career. Two [6, 21] provide information related to individuals’ efforts to create new firms. One [6] provides evidence of some efforts to create a self-employment option; the other [21] identifies and tracks individuals as they enter into the firm creation process (this data source is based on a one-time screening of a cohort identified in 2005). Finally, one specialized project [23] is designed to track the early years of the firm creation process.
The salient point here is that business data systems operated by the U.S. statistical agencies are designed primarily to capture levels of rather than changes in economic activity. The vast majority of data sources used in the construction of economic statistics are concentrated around mature, stable businesses and static components of the workforce. There is little coverage of early and late life-cycle dynamics and a paucity of information on business creation and start-up phase processes that take place before businesses are incorporated into official registries.
4.1.1
Business Register Consistency and Coverage
In assessing the current system for measuring business dynamics, it makes sense to begin at its core, with the business registries. In contrast to many other countries (see Box 4-1), there are four major business registers in the United States that provide wide-scale coverage of both publicly held
|
BOX 4-1 Alternative Models: Building Registers Primarily from Administrative Data Upon systematic review (see Appendix A), it is striking how many good business surveys are conducted in the United States. The problem is that in only a few cases can information be merged across sources. This makes it expensive to collect the data and also creates a substantial burden for respondents. In contrast, some European countries now collect their census data on persons and businesses via a number of administrative registers. In these systems, individuals have identification numbers assigned at birth or, for persons not born in the country, when they are granted a work permit for the first time. This is similar to the U.S. Social Security numbering system. The register of identification numbers is kept up to date through several sources, again depending on the country. In most of Scandinavia, a housing register provides the core structure of the person registers, as all inhabitants are allocated to an address and to a particular house or apartment. Whenever people change addresses, they must inform the agency in charge of the housing register. All births are recorded in the birth register; there are other kinds of registers—e.g., tax, education, health, criminal—as well. In Denmark, administrative registers must be authorized by Parliament and statistical registers by Statistics Denmark; the conditions for data use have to be codified in the act allowing the collection of data. Similarly, each business has an ID (similar to the employer identification number or EIN in the U.S. system) which also serves as the value-added tax (VAT) number. This number is given to a firm at the time of registration; all agencies collecting data use the same ID numbers, with the result that the register is constantly kept up to date with basic information on all citizens and business entities. Registering a business is required if it is incorporated; the business also needs a number in order to collect and deduct VAT, or if the owner wants his income to be taxed as a business. Since business tax is lower than personal income tax, owners have a clear incentive to register at an early stage. If the business has employees, it must register in order to collect taxes from them. All these registrations are coordinated through one single business ID number. Furthermore, each geographical workplace (establishment) has a register number that is linked to the business ID number. Information on businesses and citizens is updated every time they have to report payment or withholding for persons. Every January, businesses must regis- |
and privately held businesses; three are maintained by government agencies—the Internal Revenue Service (IRS), BLS, and the Census Bureau—and one is a private database produced by Dun & Bradstreet. The business registers at the Census Bureau and BLS are the primary sources from which business statistics on firm and establishment dynamics are generated. The main programs on business dynamics in the United States—Business Employment Dynamics (BED) and the Statistics of U.S. Businesses (SUSB) and related Longitudinal Business Data (LBD)—are constructed from the microdata on establishments in these files.
|
ter income earned by each employee—this is similar to the U.S. form W2. At the same time, they must indicate who was employed on a specific day (typically in November). Furthermore, for firms that maintain multiple work sites, employers indicate in the same form the physical location at which each employee worked throughout the year. Government agencies are allowed to share data only to a limited extent and, even then, it must be permitted in the act that authorizes collection of specific data. However, Statistics Denmark can by law request all data, including the person and firm IDs, from each collecting agency, as well as from private sources. Statistics Denmark is thereby allowed to fully exploit the common ID numbering system and use all data in the production of statistics and for research. Trust and reliance in the system are so broad that a standard census has not been conducted since 1970. One of the conditions of use by Statistics Denmark is that no individual or firm can be identified. Researchers desiring access to confidential microdata that are allowed work inside the agency are subject to the same nondisclosure requirements as regular employees. For the past five years or so, it has also been possible for researchers to obtain admission to approved data sets from their own workplaces through the Internet (http://www.dst.dk/HomeUK/ForSale/Research.aspx). Although the approaches described here may be more problematic to implement for an economy as large and complex as the United States (e.g., where unregistered and illegal employment is perhaps more widespread), universal coverage registers create interesting possibilities that do not exist with other systems. First, survey samples of persons and businesses can be drawn from the universal registers. This increases the quality of sampling frames and saves respondents time because they do not have to provide information already embedded in the registers (number of employees, industry, gender, age, education, children, etc.). Second, survey response data can be easily merged with register information. For example, responses from a survey of job and life satisfaction, in which only one or a few employees in each firm are sampled, have been linked with register information on all the coworkers in the firm. This has generated information on how the composition of workers, their wages, and the hierarchical structure of the firm may affect responses from the sampled person. Another example is analysis of the relation between human capital formation of employees and the bottom line of firms. A different class of examples can be found in medical research, where groups of patients can be traced back in time with controls for work- or residence-related exposure applied. An example here is work on the long-term effects of occupational hazards. |
The BLS business register, constructed primarily using data that originate from the Quarterly Census of Employment and Wages (QCEW) pro-gram,3 is designed to produce frames that are optimized for survey mea-
surement at relatively high frequencies. The QCEW program is administered by the state Unemployment Insurance (UI) programs. For their register, the Census Bureau relies on the federal tax system, the Company Organization Survey (COS), and the quinquennial Economic Censuses to maintain a frame optimized for periodic survey measurements at relatively low frequencies. The end result is two fully maintained establishment registries with very substantial overlap (probably in excess of 95 percent of establishments occur on both lists) and two programs for creating business-based statistics. The Census Bureau’s measurements are focused on the outputs and the nonemployment inputs while BLS’s measurements are focused on the employment input. Consequently, the national statistical products do not reveal the extent to which the agencies’ establishment list inputs contain the same entities.
Business list comparison projects conducted cooperatively between the Census Bureau and BLS indicate that, in some areas, the business lists of the two agencies do not match up well. Even after controlling for differences in scope and coverage between the two registers, the aggregate employment figures (published in County Business Patterns (CBP) and the QCEW) vary significantly. For example, in 2001, the CBP data show a total employment of about 115 million, while the QCEW figure was not quite 109 million—a difference of about 5.5 percent.4 One difference in scope between these two business lists is that the Census business register includes nonemployer businesses while the QCEW does not (however, statistics on nonemployer businesses are published separately from the CBP). Inconsistencies in the registers and associated aggregate, industry, and firm-level statistics may stem in part from the differences in the treatment and coverage of business dynamics and young and small businesses. It is inherently difficult to track young and small businesses—they tend to increase or decrease in size rapidly—so they are a moving target for measurement purposes.
Another dimension in which the business lists vary is in their identification of single versus multiunit status. In BLS’s Multiple Worksite Reports (MWR) system, multilocation employers with at least 10 employees in secondary locations are required (in some states) to break out their employment and payroll by individual establishment.5 When a single-location firm expands to multiple locations, the “new” establishment will not be observed until it crosses the 10-employee threshold. In addition, since MWR
is a state-based program, if the expansion occurs to a state in which the firm does not already have a presence (and if the firm does not use a unique national EIN), it is possible that it would not be captured as a multi-establishment birth but as a new firm in the other state. The Census Bureau business register program has excellent coverage of multiestablishment firms every five years but is uneven in intervening years, when the COS must be relied upon. The COS includes all employers with at least 250 employees but only a sample of companies smaller than that.
These differences in the processing of multiestablishment firms across the two registers result in comparability issues, especially with regard to time series movements in births and deaths, and to job creation and job destruction series. Comparisons made using the 2001 microdata indicate that there are about 309,000 cases in which the Census Bureau and BLS lists disagree in the single versus multiunit designation, and these businesses employ 21-22 million people.6 Even for the 4.1 million businesses that both agencies agree are single establishments, BLS estimates a total employment level of 35 million, and the Census Bureau a total of 38 million. Analysis of the 2001 microdata indicate that 71 percent of these establishments match exactly on payroll figures, and 69 percent match exactly on employment figures. For multiunit EINs, a near match (those within a plus or minus 2.5 percent band) occurs 51 percent of the time on payroll and 39 percent of the time on employment. There is also significant mismatch in industry classifications at the micro level. For single-unit establishment firms found in both lists, less than 70 percent match at the 6-digit level of the North American Industry Classification System (NAICS). This level of disaggregation is often used to produce the national accounts, raising obvious concerns about the consistency of source data used to build that all-important set of economic statistics.
Differences in the way that business structure and single-unit/multiunit transitions are covered in the two major business lists lead to inconsistencies in estimates of important dynamic activities associated with births, deaths, and restructuring. The heavy reliance on the Economic Census for new information about business structure is reflected in the measures of dynamics derived from that source. The result is clusters of apparent activity at five-year intervals that is really cumulative over the period between the censuses. At the same time, reliance on state employment security agencies for information about business structure in the BLS list may result in state-to-state variation in the quality of business structure information.
There are also distinct differences across the registers in terms of how ownership links are recorded. BLS has reasonably complete accounting of ownership links within a state for employers reporting a single EIN. However, some large corporations with complex parent-subsidiary relationships may have multiple EINs, and ownership links for multistate firms are not comprehensive in these data. This makes it difficult to distinguish between de novo and experienced firm entry. The Census Bureau business register has high-quality ownership links for large companies that are maintained and developed through the COS and economic census programs. However, for smaller multiunit firms, details of ownership links across establishments degrade over time between censuses.
Inconsistencies in the coverage and accuracy of the business lists have direct implications for the reliability of key business statistics—from gross domestic product (GDP), to employment, to productivity and industrial production—that are all derived, at least in part, from business list data. A number of problems for downstream data users were discussed at a workshop on the topic of business data sharing.7 Presenters from BEA described the growing statistical discrepancy that now exists between GDP and gross domestic income (GDI), two key aggregate measures of domestic output that should, in principle, agree. One source of the statistical discrepancy can be traced to the fact that GDP and GDI are calculated from different data sources, the former primarily from Census data and the latter primarily from BLS data (National Research Council, 2006, p. 15).
The most interesting (and problematic) discrepancies occur, however, at the industry level. For example, in 2002 the Census Bureau measure of current-dollar value added for the computer and electronic products sector was twice as large as that shown by BLS data, providing two contrasting pictures of factor productivity for the sector. Industry-based productivity studies typically rely on output data from the Census Bureau and input measures (industry employment) from BLS. These problems adversely affect the economic decision-making process. The ability of the Federal Reserve to conduct effective monetary policy could be diminished when productivity estimates are inaccurate because these data factor directly into assessments of inflation trends. Indeed, during the late 1990s, flaws in industry-level data resulted in slow recognition of productivity gains in technology and related industries, which directly affected assessments of the prospects for the nation’s economic performance (National Research Council, 2006, pp. 29-30).
4.1.2
Register-Based Business Dynamics Programs
Longitudinal microdata are essential for measuring business dynamics—births and deaths, expansions and contractions, mergers and splits, relocations, ownership changes, and worker flows—the processes on which this report is focused. Because sources of longitudinal business microdata have historically been scarce, particularly for smaller and newer businesses, research progress on business dynamics and entrepreneurship has been hampered. Recently, however, data products have begun to emerge that promise to greatly enhance available information relevant to these topics. In theory, tracking businesses through time can be accommodated either by designing longitudinal surveys or by linking records from successive years. For the most part, the latter strategy—linking data, mainly across administrative and survey sources—has been used at the statistical agencies because of cost and respondent burden constraints. Because of their proximity to the business lists, the Census Bureau and BLS are the key players in this new area. Among the most promising data sets now coming on line are BLS’s BED, and three Census Bureau efforts—the SUSB, produced jointly with the Small Business Administration (SBA); the LBD and its successor the Integrated Longitudinal Business Database (ILBD); and the Longitudinal Employer-Household Dynamics (LEHD) Program.
In addition to the establishment employment counts, the BED publishes quarterly statistics on job creation, broken out by expanding and opening establishments, and job destruction, broken out by contracting and closing establishments. Data are disaggregated by industry (sector level) and by firm size. The firm size data use tax EINs to aggregate across UI accounts. Development of the BED required BLS to overcome several methodological hurdles to create record linkages from EINs (in coordination with other information), which are imperfect for the purpose of producing firm-level statistics (see Okolie, 2004).8 The SUSB program at the Census Bureau (partially supported by the SBA) uses the Census Bureau register to construct annual measures of job creation and job destruction disaggregated by opening, expanding, contracting, and closing establishments, along with respective establishment counts. The SUSB reports currently provide more geographic and industry detail than does the BED, breaking data down data by state, enterprise size, metropolitan statistical area, and 4-digit NAICS code (plans are in the works at BLS to produce statistics at finer levels of detail in these dimensions). However, the SUSB annual reports are issued with a significant lag (2 to 3 years) compared with the BED reports
(which have a roughly 8-month lag). There are also differences in industry and type of employer coverage across these two data sets.
In addition to the SUSB, the Census Bureau also has two research databases constructed from the business register. The LBD is an establishment-level longitudinal data set that can be used to measure producer dynamics, including the birth and deaths of establishments and firms. Its coverage and properties are similar to the SUSB; however, it provides researchers with links to additional survey data. A new data effort at the Census Bureau is creating an ILBD, which includes data from both the employer universe (LBD) and the nonemployer universe. The objective of this project is to integrate these data sources by not only merging the data together, but also by developing micro-level links between the data on nonemployers and on employer firms. In this way, the transition of firms from nonemployer to employer status, and the reverse, could be tracked (Davis et al., 2006). Currently, very little is known regarding such transitions.
The LEHD is a relatively new microdata source being developed by the Census Bureau that integrates data on households and individuals with data on employers.9 The program has created opportunities to conduct research on topics for which empirical analysis of confidential longitudinal linked employer-household microdata are required, such as research on low-wage workers and human capital and productivity. The LEHD, which has also been applied to investigate a range of other topics (e.g., outsourcing), illustrates the tip of the iceberg in terms of the information volume and detail that can be made available through data integration and the efficiency of the approach relative to developing new surveys.
An advantage of these newly developed research databases is that they offer the possibility to link additional information about firms or establishments into an analysis. At least every five years the Census Bureau carries out detailed surveys of these establishments. These surveys provide a much richer description of the activities of the establishment or firm. In contrast, the quality of both business registers suffers because they do not incorporate basic data on establishment output. The LBD, for instance, allows researchers to link the basic data on establishment and employment in the business register to richer data on inputs, outputs, characteristics of business owners, and other variables.
4.2
GAPS IN DATA ON BUSINESS DYNAMICS AND ON SMALL, YOUNG, AND NASCENT FIRMS
As indicated throughout this report, the primary emphasis of the statistical system traditionally has been to produce accurate cross-sectional, highly aggregated statistics. One consequence of this strategy is that our ability to accurately measure the activity of small and younger producers, and their role in dynamic economic processes, is compromised. For this segment of the business population, a greater reliance on administrative records has developed over time.10 Administrative data typically contain only a limited number of data fields such as payroll and employment.
Even with limitations imposed by administrative data, U.S. business statistics typically can be disaggregated along a number of dimensions—for example, by firm or establishment size. However, the federal statistical system produces very little information tabulated by firm or establishment age. A better understanding of business dynamics, industry evolution, the role of entry in markets, and the productivity impact of new firms requires data on business age. As illustrated by past efforts—for example, the 1939 and 1948 Censuses of Retail—and by recent studies using business microdata (Davis, Haltiwanger, and Schuh, 1996), it is certainly feasible to construct such statistics. A focus on publishing statistics by business age would also dovetail well with recent innovations in measuring producer dynamics, such as the BED, Quarterly Workforce Indicators, and LBD/SUSB programs. Since these programs rely on the accurate measurement of entry and exit of producers and the accurate tracking of existing producers over time, their statistical frames could be readily adapted to allow for the measurement of business age and the production of statistics disaggregated by business age. This involves no new collection of data but would require business registers to maintain information that, though relatively easy to construct at the establishment level, does require somewhat greater effort at the firm level, where adjustments for mergers and acquisitions must be incorporated into the company age data.
Besides placing greater emphasis on the production of statistics (both levels and dynamics) of small and young firms from existing data resources, more regularly collected information on the activity of these businesses needs to be collected to help fill several conspicuous gaps. For example, few data sources detail how young firms invest in research and development,
capital equipment, or human capital. Recent studies (e.g., Becker et al., 2005) show that investment rates in physical capital by very young businesses are high, but these businesses are not covered in a representative manner by surveys of capital expenditures. There is a paucity of data on the activities of the nonemployer universe of firms, and even less is known about the transitions and interactions between the employer and nonemployer universes. Data on this transitional phase are essential for understanding the entrepreneurial process whereby firms evolve to the point at which workers are hired. Moreover, the level of activity in the nonemployer universe of firms is substantial. Census Bureau figures indicate that there are over 18 million nonemployer firms in the United States—roughly three times the number of employer firms. In general, little is known about the evolution of these firms (Davis et al., 2006).
While data on the universe of nonemployer firms (which is dominated by very small producers) actively engaged in business are sparse, even less is known about the firm-formation process in the preproduction phase. Before the presence of activity by a new entity can be detected in a business register, it must have either positive sales or employment (the two standard ways that administrative systems identify firms). In order to learn about entrepreneurial activities in the preproduction stage, a different data collection approach that surveys households or individuals (e.g., the Current Population Survey [CPS]) is most likely required. Fairlie (2006) uses the CPS questions about self-employment income to identify entrepreneurial activity, and the Kauffmann Foundation publishes an index of entrepreneurial activity based on these data. In order to measure entrepreneurial activities in the preproduction phase (before income is earned and tax returns are filed), one must ask specific questions about the topic in household surveys such as the CPS or perhaps BLS’s American Time Use Survey.
Fairlie enumerated a list of advantages of data collected from households relative to that collected from businesses. Household data sources currently offer comparatively large sample sizes and long time series; more timely estimates of business ownership and entrepreneurship; built-in comparison groups of nonbusiness owners; the potential, when in panel form, for measuring entrepreneurship, business creation, transitions into and out of self-employment,11 and for examining income growth (e.g., the National
Longitudinal Survey of Youth (NLSY), the Panel Study of Income Dynamics); the ability to include a wide range of variables measuring owner characteristics (e.g., race and gender, age, education, personal wealth); and the capacity to create detailed profiles of previous business ownership, work, employment and earnings experience (e.g., the NLSY), and to include questions on nonmonetary returns (e.g., job satisfaction) or on psychological factors related to entrepreneurship.
The disadvantages of household data have to do with limited information on such factors as business outcomes (e.g., sales and profits); employment (e.g., number, wages paid, health insurance, other benefits, gender and race composition); customers (e.g., other firms, consumers); revenues (e.g., from government contracts, international sales); financial inputs (e.g., start-up capital, types of financing, bank loans); family businesses and work experience in family businesses; business acquisition processes (e.g., franchise, inherited, purchased, family gift); innovation (e.g., patents, new service or product); and use of technology (e.g., computers, Internet).
The statistical agencies do have programs that target small firms (see Appendix A). A clear example is the Survey of Business Owners (SBO), last survey conducted in 2002.12 The SBO surveys sole proprietors, partnerships, and subchapter S-corporations, asking for information about business owner demographic characteristics, the level and source of start-up financing, and the importance of the business as a source of income to the owner. This is valuable information for understanding the business formation process, but the data are collected infrequently. To fill this gap, the Federal Reserve sponsors the Survey of Small Business Finance because existing data on bank lending and financing to small businesses are inadequate. The survey is quite small and voluntary in nature, so it has both response and coverage issues—we also understand there are plans to discontinue it which, despite these shortcomings, would be a significant loss.
4.3
SYSTEMIC DEFICIENCIES
4.3.1
Insufficient Interagency Data Coordination
In some cases, the data that would be most useful to researchers and policy makers for measuring business dynamics are simply not collected. In other cases, survey data are collected or administrative records maintained, but they cannot be shared among the statistical agencies.13 Insufficient data
|
12 |
The SBO is similar to the Characteristics of Business Owners survey conducted in prior census years (e.g., 1987 and 1992—the survey was cancelled in 1997 due to budget limitations). A number of rich studies have been conducted using Characteristics of Business Owners and SBO data sets—see, for example, Holmes and Schmitz (1995). |
|
13 |
See Appendix 4-1 for a brief history of interagency data sharing. |
sharing and lack of coordination result in an underutilization of resources. Not only can data sharing result in improved quality of economic (and other) statistics, it may also potentially reduce costs to the agencies and the burden placed on survey respondents who receive similar data requests from multiple agencies (see Chapter 3 on this point).
The production of economic statistics relies heavily on survey and administrative data collected and housed by the Census Bureau, BLS, and BEA. However, with a few specific exceptions, these agencies are not permitted to share their data sources when they include Title 26 (U.S. Code) federal tax information. The Confidentiality Information Protection and Statistical Efficiency Act (CIPSEA) has expanded the potential for data sharing among these agencies. However, enabling legislation for the sharing of tax data is not part of CIPSEA. As a result, data in the Census Bureau’s business register, which is constructed in large part from IRS tax data, cannot be shared.14 This, in turn, impedes coordination of the business lists maintained by the statistical agencies. In some cases, agencies have had to purchase private business lists that are inferior in some ways, simply because they did not have access to the business data at another agency (for example, the Survey of Small Business Finances at the Federal Reserve has used sampling frames from Dun & Bradstreet). Controlled access to government lists would eliminate these kinds of costs and allow more accurate data to be used.
Since the Census Bureau’s business register relies heavily on IRS source data, the agency’s ability to share with BEA and BLS is extremely limited. The Census Bureau itself does not collect any data on receipts from nonemployer businesses but simply uses IRS data for such cases. These data cannot be shared. Likewise, BLS and BEA access to data on sole proprietors—of which there are roughly 1.5 million, a group of businesses that constitutes a large fraction of economic activity—and partnerships is extremely limited and has been excluded from previous data-sharing proposals.15
|
14 |
See Appendix B in the Committee on National Statistics (CNSTAT) report Improving Business Statistics Through Interagency Data Sharing (National Research Council, 2006) for an overview of recent legislation governing data sharing and access to federal tax data. Papers by Nick Greenia and Mark Mazur and by Robert Parker in that volume provide further details of statistical agency access to IRS data. The full text of the CIPSEA legislation can be found at http://www.eia.doe.gov/oss/CIPSEA.pdf. |
|
15 |
The effort to promote greater data sharing for business list reconciliation is further complicated because BLS data are shared with state programs. The Labor Market Information Cooperative Agreement includes provisions for BLS and state agencies to share data for five BLS programs—Current Employment Statistics, Local Area Unemployment Statistics, Occupational Employment Statistics, the QCEW, and Mass Layoff Statistics. Under the legal terms of the agreement, the state agencies have access to data collected through these |
Inability to fully share business register microdata creates problems for a number of statistical programs and research needs. As noted above, it harms the accuracy of industry output, compensation, and productivity trend measures (especially for fast-growing and innovative industries, such as information technology) which, in turn, affects the ability of downstream users, such as the Federal Reserve, BEA, and researchers, to use the data effectively. It also inhibits the ability of the statistical agencies to consistently adjust sampling frames for the entry and exit of new businesses in a timely manner and to identify and classify businesses (again, see National Research Council, 2006). For example, both the Census Bureau and BLS require establishment-level data for multiunit firms. The Census Bureau requests multiestablishment firms to break out employment and payroll numbers by establishment in its COS; for BLS, the UI program’s MWR is used (refer to Appendix A for details). Because the timeliness and comprehensiveness of the COS and MWR are not the same, measures of employment, payroll, and establishment birth and death trends for multiunit firms are incomplete and inconsistent.
While the statistical agencies already share data—effectively in some cases—a more extensive data-sharing arrangement between BLS and Census would likely lead to improvements in both lists. BLS industry coding, physical location addresses, multiunit data from the MWR, and employment data for single units are recognized as being very thorough, and this level of detail would be—and, to some extent, already is—beneficial for use in Census programs.16 The Census Bureau is particularly interested in the data of multiunit companies within states, as well as in BLS data for the client businesses of professional employer organizations (PEOs). PEOs (or employee leasing) firms typically supply human resource management services (e.g., payroll accounting, benefits administration) to their clients. The Census Bureau’s tax record-based data do not accurately indicate the geographic location and industry of leased employees working at client sites; rather, they indicate the industry and location of the PEO itself. BLS would benefit from an evaluation of firm information that is collected as part of the Census Bureau’s COS. Access to Census data could potentially add
consistency to BLS industry codes, giving the agency the ability to analyze microdata on some 18.6 million nonemployer businesses. A workshop held on the topic (see National Research Council, 2006) explored possible mechanisms for increasing sharing for the purpose of business list improvement; Chapter 5 includes recommendations on how to move forward.
Integration of the business registers and the business surveys is a complex and difficult process. Sorting through what matters for key national statistics and for understanding the driving forces of the U.S. economy is a long-standing topic of mutual interest to the statistical, research, and policymaking communities. Improving measurement and understanding of business dynamics in general, and young and small businesses in particular, can be accomplished only through partnerships between the statistical agencies and the research community. This in turn requires access, with appropriate safeguards and for approved projects, to the underlying firm-level data. This partnership is an essential ingredient to tackling conceptual and measurement problems because the statistical agencies have limited resources to address these issues by themselves.
4.3.2
Inadequate Researcher Access
Even the best data are without value if no one can use them. Another limitation of the current system has to do with who can use data beyond the walls of government agencies. Our primary concern is with research and policy users, but data access by others, including business planners, is also important. Because the vast share of expertise in data analysis resides outside the statistical agencies (which are, for the most part, working near capacity just to produce the data), academic researchers and government policy makers must be given access if the data are to be used with an intensity sufficient to justify the costs of collection. The importance of researcher access to data, as well as the confidentiality requirements that must be met in order to provide that access, has received extensive attention in several CNSTAT (and other National Research Council) reports. A major theme of Expanding Access to Research Data (National Research Council, 2005b) is that a full return on the nation’s investment in the federal statistical system requires that users have access to data which, in turn, informs policy and feeds back to improve the quality of surveys and of the data sets (public use and restricted access) themselves (pp. 48-49):
Researchers’ use of government data creates an effective feedback loop by revealing data quality and processing problems, as well as new data needs, which can spur statistical agencies to improve their operations and make their data more relevant…. McGuckin (1992) argued more than a de-
cade ago that coordinated research efforts between in-house and outside researchers offer the best model for ensuring that agencies maximize the benefits from data users. In fact, McGuckin (1992:19) argued that it is a primary responsibility of statistical agencies to facilitate researcher access to confidential microdata files. Such access, by improving the microdata for research and policy analysis, will also improve the quality and usefulness of the aggregate statistics on trends and distributions that are the bread and butter of statistical agency output.
Researcher access is critical for addressing the data gaps highlighted in this chapter. Data sharing with accompanying data integration and coordination within the statistical agencies will go a long way toward improvements in business statistics. However, many difficult conceptual and measurement issues must be confronted, and a partnership between the statistical agencies and the research community is vital to such efforts. It is useful to note that major innovations in measuring business dynamics have stemmed from partnerships. The methodology underlying the job creation and destruction measures now part of the BED and the LEHD programs was developed under joint projects between Census Bureau staff and external researchers at the Center for Economic Studies (see Davis, Haltiwanger, and Schuh, 1996, for discussion of this partnership). A joint project between John Abowd and the French National Institute for Statistics and Economic Studies (see Abowd, Kramarz, and Margolis, 1999, and Abowd, Corbel, and Kramarz, 1999) and a related joint project between Julia Lane and the Census Bureau (see Burgess, Lane, and Stevens, 2001, and Haltiwanger, Lane, and Spletzer, 1999) led to critical conceptual and measurement breakthroughs that underlie many of the key data products of the LEHD program.17
Throughout this report, we document the value of business data, particularly when it can be disaggregated along geographic and other dimensions. However, as noted in Chapter 3, the presence of geographically specific identifiers along with other variables in a database gives rise to confidentiality issues.18 Social scientists have begun to grapple with the
dilemma posed by the conflicting needs for spatially explicit data and confidentiality (Van Wey et al., 2005).
A number of strategies for meeting the dual goals of confidentiality protection and user access are possible (Box 4-2 includes a description of an approach used by Statistics Denmark):
-
Sensitive disaggregated data can be held by a central agency and access to sensitive databases restricted to researchers and policy makers who have cleared security hurdles.
-
Disaggregate data can be held by a central agency that responds to user requests for data for certain areas and releases the data only in aggregated form. Because confidentiality can be breached if the data are released for small areas such as census blocks, block groups, or even census tracts, the minimum size of area for data release remains an empirical question that can be answered only in terms of the probability that a given business can be identified, which is a function of the density of similar businesses in an area, inter alia.
-
The location identifier in the disaggregate database can be generalized from a point to an area; in this strategy, location specificity is sacrificed by “geo-fuzzing” to preserve confidentiality. As in the second case, the size of the area to which the location needs to be generalized to maintain confidentiality depends on the spatial distribution of proximate similar businesses (compare, for example, a business in a rural area—the only one of its kind in a county—with a similar one in a dense urban area that has many similar businesses within the same census tract).
The problem of balancing increased access to microdata while conforming to confidentiality requirements has also led to the idea of creating synthetic versions of microdata sets. The development of methods for gen-
|
BOX 4-2 Data Access Abroad Data access arrangements differ significantly from country to country. In some cases, recognized researchers can obtain data samples on their own computers (to some extent, this is the case in Norway and Sweden). In others cases, researchers must travel to statistical agencies to gain access (Germany); this is of course highly inconvenient and, by lowering use rates, reduces the societal value of the data resource. Denmark has a special arrangement worth mentioning. The Ministry of Research together with Statistics Denmark set up a system whereby researchers can remotely access data sets they have ordered through the agency. Researchers apply to use data for a specific project, then Statistics Denmark creates a data set specified in a way that meets the criteria for that use. In constructing the data set, the agency may allow use of the full range of available data. However, it is up to their discretion to determine the extent to which a researcher’s information request is fulfilled. The final step in data delivery involves anonymizing the data then moving them to the researcher’s computer system. Researchers are of course not allowed to publish or to take out any data that can be used to identify individuals or firms. The arrangement does allow them to gain remote access to data from their offices over a virtual network connection. Local printing is not possible, nor is downloading of data. Output can instead be sent as email. These emails are screened by Statistics Denmark employees or by a computer program for any breach of data security before they are sent, which means a delay of about 5 minutes. The system has been working for about 5 years without incident. One downside of this arrangement is that most researchers use seemingly different data sets, with the result that typical scientific critique can be more difficult and discussion of data limited to some extent. |
erating synthetic versions of data sets is relatively recent, dating back to Rubin (1993). The synthetic data approach is essentially data masking, though it is more sophisticated than such conventional techniques as rounding, top-coding, withholding variables, and creating value ranges.19 Methods of disclosure limitation based on synthetic or virtual data have shown promise in safeguarding confidentiality and permitting the estimation of
complex models (see, e.g., Abowd and Woodcock, 2001; Doyle et al., 2001; Raghunathan, Reiter, and Rubin, 2003).
From a research perspective, synthetic data sets are not ideal; rather, they are a compromise. There have always been two perspectives when it comes to synthetic data: on one side are those who believe that, in addition to its role in statistical disclosure limitation, replacing real samples with records created from posterior distributions offers significant potential in terms of maintaining the analytic value of the data. On the other side are researchers who are concerned that imputation algorithms blur data in ways that introduce unacceptable effects on error structures (and other inaccuracies), particularly in complex modeling applications. In general, social scientists have concluded that the extent to which a synthetic sample representing “virtual households” or “virtual businesses” is useful depends on the particular implementation of the method and on the particular questions being addressed.
However, it is extremely important to note that the method offers a highly valuable data access tool. Synthetic public-use microdata versions can be used to facilitate access to non- (or less) sensitive versions of restricted access data sets. This kind of access can provide a means for researchers to explore, test, and refine estimation models at relatively low cost before incurring the higher costs of accessing confidential data through a research data center or another restricted access mode. Synthetic data and multiple imputation techniques are relevant to several of the data sets discussed in this report. One example is the multiple imputation apparatus in place for the Survey of Consumer Finances (SCF). The SCF is conducted by the Federal Reserve Board, with survey information collected by the National Opinion Research Center at the University of Chicago. The sampling frame is constructed from records based on tax returns maintained by the Statistics and Income Division of the IRS. Because the SCF contains sensitive and detailed information about respondents’ assets and liabilities, as well as detailed demographic and geographic codes, and because missing data have always been an important problem in the SCF, substantial resources have been devoted to the construction of an imputation framework that can be used to simulate data to replace those originally reported.
Synthetic data and multiple imputation techniques have also been used in the LEHD program. This has allowed data to be released at the block level without compromising the confidentiality of individuals or businesses. One application of this method, currently being used in 14 states for economic and workforce development, permits decision makers to examine job creation, job destruction, hires, and separations at the block group level—as well as their dynamics over time (see http://lehd.excensusonline.com).
The use of multiple imputation has been helpful to address the problem
that UI wage records typically do not include the physical establishment for workers employed by multiunit businesses. For these workers, only the identifier for the multiunit business is recorded. The LEHD program staff developed a multiple imputation technique to assign a place of work to these individuals based on the size and hiring patterns of establishments within the multiunit business and the relationship between the place of residence of each worker and the location of each business. This is an example of using imputation to improve the quality of data. Imputation can therefore be useful for two purposes—when there are missing data and when confidentiality must be protected.
4.4
APPENDIX: DATA-SHARING HISTORY20
The potential benefits of more efficient data sharing among the U.S. statistical agencies have long been recognized. The National Research Council’s 1993 report, Private Lives and Public Policies: Confidentiality and Accessibility of Government Statistics, included a section on “Barriers to Data Sharing within Government” in which the authoring panel wrote (p. 6):
Some of the laws that govern the confidentiality of statistical data prohibit or severely limit interagency sharing of data for statistical purposes. Laws that control access to administrative records, such as reports of earnings covered by Social Security, restrict their use for statistical purposes. These barriers to data sharing for statistical purposes have led to costly duplication of effort and excessive burden on individuals and organizations who are asked to supply information. They have also made it difficult or impossible to develop data sets needed for policy analysis on topics of major interest to the public.
The panel concluded that barriers to sharing data on both persons and businesses for statistical purposes should be removed subject to strict controls to protect confidentiality. Recommendation 7.4 of that report articulates the panel’s position that interagency data coordination should include the sharing of lists of businesses by federal and state agencies for statistical purposes. Recommendation 7.5 asked for new legislation to expand confidentiality to records collected by all statistical agencies; some of this recommendation was subsequently accomplished by CIPSEA. Although this report cited several examples of reduced sharing as a result of the provisions
of Title 26 (specifically, Section 6103) of the tax code, there was no explicit recommendation to amend this act. Nevertheless, the panel’s view on the topic was clearly expressed by a section titled “Inability to Share Business Lists: An Embarrassment to the Federal Statistical System.”
A more recent CNSTAT report, Expanding Access to Research Data: Reconciling Risks and Opportunities (National Research Council, 2005b), includes a detailed discussion of CIPSEA and specifically points to the need for changing Section 6103 (p. 23):
A key element in the Census Bureau’s data is its business register, which is constructed with data from the Internal Revenue Service (IRS). However, without new legislation (to amend Title 26 of the U.S. Code, which governs access to IRS tax data), the business register and associated data cannot be shared with BEA and BLS.
Many organizations have weighed in with positions supporting amendment of Section 6103 of the tax code. In response to a congressional request, the Administrative Conference commissioned a team of tax experts headed by Charles Davenport to study the operations of the IRS. The result was the Report on Administrative Procedures of the Internal Revenue Service, October 1975, to the Administrative Conference of the United States (Davenport, 1976), which included a section reviewing the history and rationale for tax return access for statistical purposes. The report concluded that “it appears that the use of tax data by Census, though not consistent with revenue administration, is a use which can be considered beneficial and is one which does not appear to have any undesirable side effects” (p. 880). The study came to a similar conclusion for BEA but not for the Statistical Research Service (SRS) of the Department of Agriculture. The key distinguishing factor for the commission was that the Census Bureau and BEA were strictly statistical agencies and did not engage in activities related to other functions of the department. Still, the commission recognized that SRS had statistical activities but determined that the statistics it collected “for policy making by the agency of which it is a part.”
In 1979, the U.S. General Accounting Office (GAO, now the Government Accountability Office) issued a report identifying efforts by the Census Bureau to create a centralized business register for use by other statistical agencies. That report, After Six Years, Legal Obstacles Continue to Restrict Government Use of the Standard Statistical Establish List, supported changing Section 6103; its findings were summarized as follows (title page):
The Census Bureau has developed the Standard Statistical Establishment List, a comprehensive list of businesses in the United States. Many Federal
agencies could use such information. But confidentiality laws prevent the Census Bureau from sharing List information with other agencies…. Amendments to these laws would help improve the quality and comparability of economic statistics and reduce business response burden from numerous Federal statistical surveys…. Because some of the List data comes from the Internal Revenue Service, the Treasury Department has reservations about using tax information for statistical purposes. However, the Commerce Department plans to introduce proposals for changes to the confidentiality laws and GAO recommends favorable congressional consideration.
In 1998, GAO testified before Congress (based on its report, Statistical Agencies: Proposed Consolidation and Data Sharing Legislation) about legislation submitted in 1996 and 1997 that would permit limited sharing of data among designated statistical agencies for statistical purposes, subject to procedural safeguards. The testimony included the following statement describing GAO’s position (pp. 5-6):
For the past 2 decades, we and others have urged legislative changes that would allow greater sharing of data and information on data sources among agencies, but so far these efforts have met with little success. The Paperwork Reduction Act of 1980 gave the Director of OMB the authority to direct a statistical agency to share information it had collected with another statistical agency. However, this authority was limited since it did not apply to information that was covered by laws prohibiting disclosure outside the collecting agency. In the early 1980s, the statistical agencies, under OMB’s leadership, tried to further enable federal statistical agencies to share data. They attempted to synthesize, in a single bill, a set of confidentiality policies that could be applied consistently to all federal agencies or their components that collected data for statistical purposes. This effort, which was known as the “statistical enclave” bill, would have allowed statistical agencies to exchange information under specific controls intended to preserve the confidentiality of the data providers. A bill was introduced in Congress but was not enacted.
More recent proposals concerning data sharing have called for enactment of legislation that would allow statistical agencies to share data and information with appropriate safeguards to protect against breaches of confidentiality. These proposals were not adopted, in part because of general concerns that greater data sharing might endanger the privacy of individuals. Both the Economic Statistics Initiative under President Bush and the National Performance Review (NPR) under President Clinton have recommended such actions. NPR recommended the elimination of legislative barriers to the exchange of business data among federal statistical agencies, and we agreed with this recommendation. The NPR recommendation did not address the sharing of information on individuals.
Some officials of statistical agencies and Members of Congress, however, have argued that a distinction should be made between the sharing of business data and the sharing of personal data about individuals. They noted that breaches of confidentiality protection when personal information is involved may be more serious. The National Academy of Sciences has made recommendations regarding the need for appropriate legislative provisions on data sharing that the Subcommittee may wish to consider in its deliberations.
In the 2002 Economic Report of the President, the Council of Economic Advisors noted the critical need for reliable data and that data sharing would increase their quality and timeliness (p. 25):
… the quality of existing statistics is far from perfect and could be enhanced with further investment. Even real GDP, generally thought of as a reliable measure of overall activity in the U.S. economy, is susceptible to considerable revisions…. Such revisions lead to uncertainty for both government and private decision makers, which can cause costly delays…. A number of steps can be taken to improve the accuracy and timeliness of economic statistics. In particular, targeted improvements to the source data for the national accounts would go a long way toward illuminating the causes of the growing statistical discrepancy. Another cost-effective measure would be to ease the current restrictions on the sharing of confidential statistical data among federal statistical agencies. Such data sharing, which would be done solely for statistical purposes, is currently hindered by lack of a uniform confidentiality policy. Confidentiality is of key importance to all agencies and to the individuals and businesses who participate in Federal surveys, but a uniform confidentiality policy would allow agencies such as the Bureau of Economic Analysis, the Bureau of Labor Statistics, and the Census Bureau to cost-effectively compare and improve the quality of their published statistics while preserving confidentiality. In the past, attempts have been made to pass legislation, together with a conforming bill to modify the Internal Revenue Code, allowing such data sharing under carefully crafted agreements between or among statistical agencies. In 1999 such legislation passed the House but stalled in the Senate. The Administration will continue to seek passage of data sharing legislation to improve the quality and effectiveness of Federal statistical programs.
Positions on data sharing have also been issued by the Treasury Department and the Joint Committee on Taxation (JCT). Section 3802 of the Internal Revenue Service Restructuring and Reform Act of 1998 requires the secretary of the treasury and the JCT to conduct separate studies of the scope and use of provisions regarding taxpayer confidentiality and to report their findings, together with any recommendations deemed appropri-
ate, to Congress. The JCT published its report on January 28, 2000; the Office of Tax Policy of the Department of the Treasury submitted its report on October 2, 2000.
The JCT and the Treasury Department have disagreed on the merits of changing Section 6103 to permit expanded data sharing. The JCT recommended that “new access to returns and return information should not be provided unless the requesting agency can establish a compelling need for the disclosure that clearly outweighs the privacy interests of the taxpayer.” The JCT report did not explain how to determine both the pros and cons of such a decision, nor did it appear to fully accept the need for the existing access. (Both the JCT and the Treasury Department recommended dropping the Federal Trade Commission from access under Section 6103.)
The Treasury Department, in contrast, recommended that “the disclosure authority of Section 6103(j) should be expanded to additional specified statistical agencies, and such agencies should be permitted, upon prior Treasury approval, to share IRS data with each other.” It also specified the agencies to include and that the change to Section 6103 should cover both individual and business records.
Private business economists have actively supported data sharing. In 1996, Maurine Haver, president of Haver Analytics and chair of the Statistics Committee of the National Association for Business Economics (NABE), testified before the House Subcommittee on Government Management, Information and Technology. In her testimony on consolidating the three major economic statistical agencies (H.R. 2521), she expressed support for the inclusion in that bill of provisions for data sharing among these agencies as it would allow for the creation of a single business register. In 2001, Richard Berner, the president of NABE and managing director and chief U.S. economist of Morgan Stanley, Inc., testified before the House Subcommittee of the Census Committee on Government Reform on the Statistical Efficiency Act of 1999. In his testimony, Berner reported on NABE’s support for the reintroduction of this act, which had been passed unanimously by the House in the previous Congress. He testified that “NABE believes that our national data collection efforts should be as efficient as possible. To that end, we believe that Congress should mandate ‘data sharing’ among the agencies, solely for statistical purposes.” He noted that existing confidentiality statutes are barriers to such data sharing because “they virtually guarantee duplication of effort and inconsistencies among related data sets collected by the affected agencies. Moreover, they prevent agencies from undertaking new analyses that could improve the information available to policy makers. This is not a cost-effective way to run any business—either public or private.”


