
Panel I
An Overview of the Global Challenge
Moderator:
Bradley Knox
House Committee on Small Business
Speaking on behalf of the House Small Business Committee, Mr. Knox expressed excitement that the symposium was taking place and gratitude to the committee and Dr. Wessner for bringing to the fore the matters it was to take up. He then introduced Carl Dahlman of Georgetown University, saying the audience was certain to benefit from his experience. Dahlman’s previous career at the World Bank has spanned a quarter-century.
THE INNOVATION CHALLENGE: DRIVERS OF GROWTH IN CHINA AND INDIA
Carl J. Dahlman
Georgetown University and The World Bank, retired
Dr. Dahlman said that he would rapidly draw a broad sketch of the world based on work that he has engaged in for several years. Following this, he stated that he would sketch out the strengths of the United States, the European Union, and major nations in Asia, highlighting some of the lessons their various experiences might provide. Next would be a discussion of some key drivers of growth and competitiveness, notably education and innovation—particularly with respect
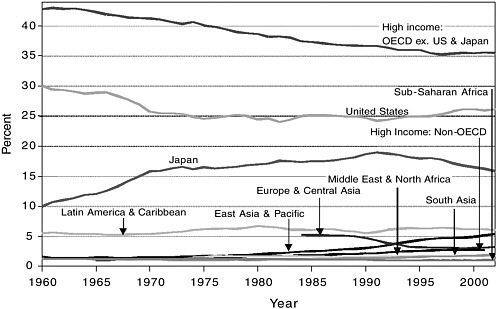
FIGURE 1 Shares of world GDP, 1960-2002.
to China and India. Finally, he noted that he would make some hypothetical projections intended to stimulate discussion.
Beginning with a chart showing changes in the relative size of different world economic groups between 1960 and 2002 (Figure 14), Dr. Dahlman pointed out that the United States’ share of global GDP fell from 30 percent at the start of that period to around 27 percent by its end. Meanwhile, Japan’s share rose, particularly during the 1970s and 1980s, drawing the attention of its economic competitors. As the 1990s began, however, Japan “got stuck,” said Dr. Dahlman, while the United States, whose share of worldwide GDP fell below 25 percent by 1991, began an economic recovery. In the meantime, the share of global GDP of the remaining OECD countries had shrunk more than that of the United States. Significantly, he added that the only region of the globe to record a continuous increase in its share of world GDP was East Asia (excluding Japan).
Rapid Growth of Chinese, Indian Economies
Dr. Dahlman’s next graph, covering the period 1990-2002, assigned per capita GDP to the horizontal axis and average annual growth rate per capita to the
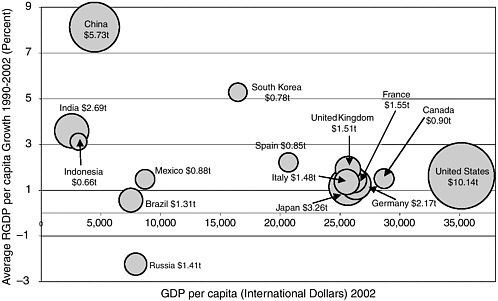
FIGURE 2 Fifteen largest economies (GDP 2002).
SOURCE: The World Bank.
vertical axis (Figure 2). Individual countries were represented by circles whose size corresponded to the size of their national economy measured in terms of purchasing-power parity (PPP) rather than in terms of nominal exchange rates (the latter, he asserted, may not always be a reliable guide.) While admitting the use of PPP is not beyond being questioned, Dr. Dahlman said his purpose was to emphasize the speed of China’s growth: Measured in PPP, China’s economy has for quite some time been second in size to that of the United States. According to his chart, Japan’s economy was third largest and India’s fourth largest, ahead of Germany’s in fifth place. Not only were China’s and India’s economies “becoming big in the global sense,” both were growing very rapidly; India was growing at 7 percent to 8 percent per year.
Dr. Dahlman then compared the various economic groups’ shares of global GDP between 1990 and 2002 based on current U.S. dollars and on current PPP. Based on current dollars, the United States ranks number one among the world’s economic groups, followed by the EU. After the EU come East Asia and the Pacific (EAP), grouping the Asian Pacific economies including Japan, and the group of the Big Six developing countries: China, India, Brazil, Russia, Indonesia, and Mexico. But using purchasing-power parity to measure GDP, the Big Six constitute the largest economic group, followed by the East Asia-Pacific group, the EU 25, the United States, and, finally, the EU 15.
The Foundation of U.S. Preeminence
Dr. Dahlman then listed reasons for the preeminent economic position of the United States, which by itself accounted for more than one-quarter of the world’s GDP:
-
very large, integrated domestic markets;
-
an economic institutional framework facilitating rapid deployment and restructuring to take advantage of new opportunities;
-
strong competition;
-
a deep and flexible capital market (including risk capital);
-
a deep and flexible labor market;
-
good rule of law;
-
very strong science and technology institutions; and
-
very flexible managerial organizational structures.
Among additional advantages he cited was a very strong investment in education, and particularly in higher education; this he attributed in part to the post-World War II GI Bill, which has moved the United States “ahead of everybody else.” On top of this, the nation boasted strong infrastructures both for research and for information and communications; was home to more multinational corporations than any other country; enjoyed superior military strength as the sole remaining superpower; and benefited from an entrepreneurial culture. Calling this last “a very special characteristic,” he noted that “many other countries really are trying to imitate” it, but with debatable success. What was “unique” about the United States, he observed, was that “when you take risk [and] you fail honestly, that’s even a good thing” in the eyes of Americans, whereas elsewhere if “you take a risk [and] you fail, you’re out.”
Other Nations “Catching Up Fast”
Turning to the challenges that the United States is facing, he pointed out that “other countries are catching up fast.” They are investing heavily in R&D, in education, and in science and technology infrastructure. Large multinationals have been multiplying, not only in Europe but in the developing countries of Asia—Korea, Taiwan, and China—as well. And one consequence of the growth of these very large, global corporations was that “there’s some confusion on ‘Who is us?’” Dr. Dahlman stated, posing the question: “Is Nokia Finnish, or is it now a ‘global corporation’—and what does that mean?”
He included among other challenges to United States preeminence:
-
emerging regional economic arrangements, such as the EU and ASEAN, with the potential to counterbalance U.S. economies of scale;
-
ongoing competition for global market share in PPP terms, which would depend on the United States’ performance relative to that of China and Japan;
-
“gigantic” fiscal and trade imbalances, a “very strong vulnerability” of the kind that normally raises red flags at the World Bank, which the United States could sustain only because it owned the world’s reserve currency; and
-
some neglect of existing scientific and technical infrastructure in the face of vigorous efforts by other nations in this area.
Regional Economic Blocs
European Union
The EU was showing more success in creating large markets for trade in goods than for trade in services. Hallmarks of progress include a significant integration to a single currency, increased regional stability, increased policy coordination, and the incorporation of ten new countries as of May 1, 2004.
But the significant challenges rooted in the EU’s low productivity growth and low economic growth remained. This challenge was compounded by EU expansion, as the group of countries across which policies needed to be coordinated became much larger. Making productivity and growth rise would require far more flexibility in the EU’s economic institutional regime, in its labor markets, in its capital markets, and in many rules and regulations at the local level. It would also require strengthening those educational fields most closely tied to research and innovation; despite having instituted programs with that objective, the EU was still lagging the United States in the area. The EU was also facing a major structural impediment in the aging of its population, which would prove a much larger burden there than in the United States, according to Dr. Dahlman. The dependence of a greatly increased number of retirees on a much smaller workforce would be “a big drag” on Europe’s economy. Finally, the adjustment necessary to accommodate new entrants, including modernization of institutional and regulatory structures, would have to continue in the context of competitive pressures heightened by East Asia’s joining the United States as the EU’s rival for global markets.
East Asia
This region’s market, although quite large to begin with, is the fastest growing regional market in the world. Intraregional trade, which accounts for half of its overall volume, is on the rise. Still, East Asia’s markets are not fully integrated and East Asian economies remain very dependent on the U.S. and European markets.
At the same time, Dr. Dahlman said, “some critical mass” was reached in R&D and human capital in an area covering not just Japan but now China, India,
Korea, and Taiwan as well. Investment in education, and with it educational attainment, has been “tremendous.” South Korea, for example, has rapidly transformed itself from a very poor country to one whose workforce in 2000 ranked third in the world in percentage of college-educated individuals, behind only the United States and the Netherlands. In fact, Korea could now be considered to have excess capacity in higher education. For its part, China has been ramping up its giant system of higher education by 50 percent per year for the past 5 years; as of 2004, it had more people in higher education than did the United States in absolute numbers. Several East Asian nations have undertaken rapid increases in their R&D efforts as well.
Korea and Taiwan in particular—but also Japan and, more recently, China—are investing very heavily in the information and communications technology (ICT) revolution, “rid[ing] this wave very well and [going] quite far with that.” Meanwhile, East Asia has become home to a growing number of multinationals that have the ability, Dr. Dahlman observed, to “go out and compete with the big boys, do strategic alliances, and cross-subsidize from cash cows to the new areas.”
The state’s role in coordinating development strategy has been enlarged, since most of these countries see science and technology (S&T) as a key to future growth and competitiveness. The central focus for future growth is placed on S&T in the eleventh Chinese 5-year plan—released in March 2005, a month before this symposium—but this has in fact been the reality for a long time. The East Asian countries have placed emphasis on being fast followers and established a record of being very quick in that role. More recently, however, Korea and India have joined Japan in efforts to be on innovation’s cutting edge, making significant investments and pushing back the frontier of knowledge.
Challenges for East Asia
East Asian nations nonetheless face significant challenges. They remain less developed than the United States, possess more rigid institutional structures, and continue to be dependent on the U.S. market. “This is a big risk for the whole world,” Dr. Dahlman warned, “because they’re serving as the ATMs for the U.S. deficits.” Doing so had allowed them to prevent their currencies from appreciating, thereby keeping them competitive and ensuring their access to the U.S. market. China, for example, benefits from the dollar’s devaluation with respect to the euro. But he characterized the situation as “a very delicate balance,” asserting that it is impossible to predict what might happen in the event of major disruptions. Whenever authorities in these East Asian nations talk about moving from U.S. treasury bonds into euros or any other currencies, the markets become extremely worried.
In addition, fragmentation is a problem in East Asia, not just within the regional market but also within the various nations. China and India, Dr. Dahlman
commented, are marked by a “tremendous lack of integration of the domestic markets.” These countries’ service sectors are less developed than that of the United States, as are their educational and innovation systems, although they were building those very rapidly. Moreover, with the exception of Japan and Korea, the East Asian nations have less developed value chains, marketing, and distribution networks. Again, however, China was beginning to build global value chains with its own brand names. Finally, allowing for variation from country to country, the region’s culture was somewhat less entrepreneurial and risk-taking than that of the United States.5
Growth and Competitiveness: Key Drivers
Dr. Dahlman then described the factors that prompt what he called “a renewed interest in growth” over the previous decade, running through them quickly because he felt the attendees were already familiar with them. The ICT revolution had underlined the importance of knowledge as a major competitive element in the “New Economy,” in which an increase in high-tech products’ share of exports is increasingly accompanied by managerial and organizational changes. During this transition, macro-level evidence of changes have appeared in both the patterns and nature of growth in the industrialized world: There had been a reversal of a previous trend toward convergence of per capita income among OECD countries, and the growth of the U.S. economy between 1995 and 2002 was surprisingly strong.
The overriding development, however, is that globalization continues to increase. Over the previous 12 years, the share of worldwide imports and exports relative to total world outputs, or “world GDP,” has increased from 38 percent to 52 percent, a fact that Dr. Dahlman attributed to a rapid reduction of transportation and communications costs. Contributing significantly to this trend are the biggest developers and disseminators of applied technology, the multinational or transnational corporations: The value-added by their production, in their home countries and by their affiliates abroad combined, accounted for 27 percent of global GDP. That figure, in fact, represents “an underestimate of their influence,” he said, “because they have very long supply chains and also the forward linkages, marketing, distribution, [and] customer service.” In addition, these corporations continue to be “very important in terms of strategy.”
Changing Nature of Competitiveness
Traditionally, economists have viewed competitiveness as a function of capital and labor costs, the cost of inputs and infrastructure services, the general busi-
ness environment, and strength in technology and management. This may have been appropriate to a more static system, but the current economy, stirred by the ICT revolution and by the volume of new knowledge being created and disseminated, is very dynamic. Competitiveness is coming to be based more and more on the ability to keep up with rapid technological and organizational advances, which affects the ability to redeploy resources both at the country level and at the firm or organizational level.
In this context, the importance of flexibility in labor and capital markets, and of social safety nets that would catch those people falling between the cracks, is increasing. The quality and skills of the labor force are assuming greater weight as well: As the half-life of knowledge has grown shorter, workers’ level of formal education has grown relatively less important, and developing mechanisms for lifelong learning are relatively more important. “We are moving almost to just-in-time learning,” observed Dr. Dahlman, stressing the need for systems capable of the rapid dissemination of knowledge “according to whatever is relevant for whatever institution or sector we’re in.” Another source of advantage resided in gigantic systems, such as those used by “the Wal-Marts,” that are “very integrated with what the customer wants all the way to supply chains, massive economies of scale, and logistics.” As shown by containerization’s importance in permitting globalization through reducing transportation costs, it was not only “hard technology” that matters. The ability to make effective use of information technologies to lower transaction costs across the board also looms quite large.
The Knowledge Economy’s Four Components
As a result, countries are placing added emphasis on improving their basic economic structure and business environment, their education skills, their innovation system, and their information infrastructure.
Dr. Dahlman then projected a graph (Figure 3) ranking world nations for innovation on a population-weighted basis as measured by three variables that, he said, had to be “very crude” because of the large number of countries included: scientists and engineers engaged in R&D per million population, scientific and technical publications, and U.S. patents. Each axis presents a rank ordering of all the countries in the world, but at a different moment: The horizontal shows the countries’ positions in 1995, and the vertical shows their positions in 2002; the most advanced countries appear at the top right. Of importance is not only a country’s relative position along the diagonal but also whether it is plotted above or below the diagonal: In the first case its position would have improved between 1995 and 2002, while in the second case it would have deteriorated. The graph indicates, therefore, that the United States has been stable, but that Korea, Brazil, China, and India have moved significantly in the direction of improvement.
A second graph (Figure 4), which differs only in that it is based on the countries’ absolute size rather than population, provides a radically revised pic-
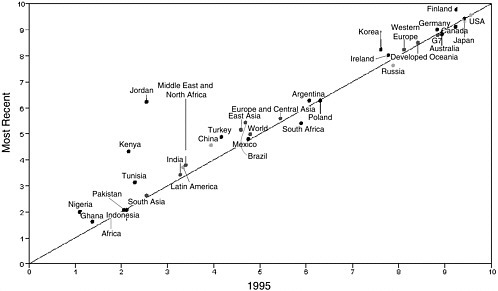
FIGURE 3 Innovation—Weighted by population.
ture. On this chart, Russia, Brazil, India, and China are found at the upper right, competing with the OECD nations. The reason, according to Dr. Dahlman, is that when it comes to knowledge—which, once produced, can be used without being consumed—critical mass matters.
China’s Rapid Rise in R&D Spending
A third graph (Figure 5), placing R&D expense as share of GDP on the horizontal axis and scientists and engineers per one million of population on the vertical axis, presents a comparison of national efforts in R&D as of 2002 in terms of PPP. It depicts a clearly dominant United States, followed by Japan, with Germany, France, the UK, and China bunched behind the two leaders. But China has moved very quickly into third place, having increased its R&D investment from 0.6 percent of GDP in 2002 to 1.3 percent in 2003, a jump of 50 percent or, in PPP, 70 percent. It now boasts not only the world’s third-largest R&D expenditure, but also its third-largest scientific and technical engineering work force focusing on R&D.
While acknowledging that there was no need to convince his present audience of innovation’s growing importance for competitiveness, Dr. Dahlman emphasized that “innovation is not just about R&D [but also] about making effective use of experience to improve things,” which can include imitating, copying, or buying
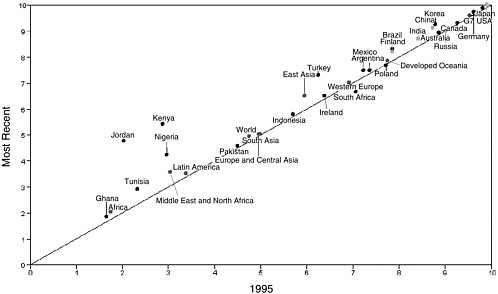
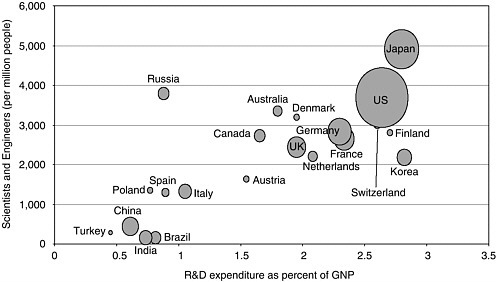
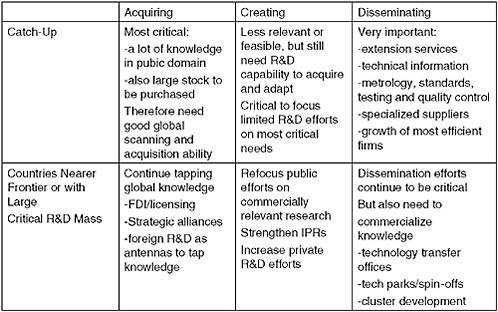
FIGURE 6 Differentiated strategies for innovation.
improvements made by others. It is valuable, he stated, to distinguish between innovation as “pushing back the global frontier” and as introducing knowledge, in the form of a development or application, into a local context. Being able to tap what is available from others was important because the stock of knowledge was moving so quickly and because nobody can enjoy an absolute dominance over the domain. For countries or sectors not yet at the global frontier, acquisition—whether through trade, foreign investment, or technology transfer—and adaptation of existing knowledge are paramount. For those closer to the frontier, pushing it back is what counts. Dr. Dahlman offered a chart sketching an innovations strategy appropriate to each of the stages (Figure 6).
Innovation’s Engines, Private and Public
Naming the innovation system’s key actors, Dr. Dahlman noted that multinational corporations (MNCs), as “the main generators and disseminators of technology,” have been its engine in the private sector. He underlined the utility of determining how MNCs integrate their efforts with national policies, and the utility to other companies of learning how to link up with them. In national systems the key players are government research laboratories; universities; the enterprise sector, comprising not only established companies large and small but also startups; government innovation programs; and public-private partnerships.
These last are gaining in importance because, he said, “we’re moving to some areas even where you have club goods and clusters.”6 He urged promoting greater interaction among the key players through such mechanisms as joint research grants, innovation awards, consortia such as Sematech, and other programs that rotate scientists and engineers, and government procurement officials.
There is also a need to generate more effective output from all these players, something that depends not on competitive pressure alone but, to a great extent, on the incentives extended to institutions and individuals. The “fine tuning” of these incentives, he said, “is critical.” Science and technology policy, depending on the degree of backing it receives from government, has the potential to make this infrastructure work better through coordinating activities, administering public awards for innovation, and supporting high-tech parks, incubators, and technology transfer centers at universities.
While noting that all nations, faced with these issues, have been trying to devise policies, Dr. Dahlman singled out Finland for special commendation: Even though it had a “tiny” economy and a population of only five million, that country had put into place a very good system for developing the kinds of institutions that facilitate such coordination and linkages. The last need he mentioned was for mechanisms of evaluation and monitoring that would provide clear definition of goals, stipulate what was to be measured and how, and assess impact—all indispensable to learning how to use resources more efficiently.
Enumerating China’s Economic Strengths7
To begin a discussion of the two top competitors emerging from the developing world, China and India, Dr. Dahlman observed that the former, by growing at about 8 to 10 percent per year for the previous four decades, has established the record for the fastest economic growth over the longest period of time for any country in the world. Its “gigantic” internal market affords it a very important strategic advantage in negotiating externally, as evidenced by the fact that foreign interests competing to invest in China had been willing “to bring not the second- or third-weight technology but the very best” for application in their operations there. Based on personal observations conveyed to him by a friend, he reported that a Motorola plant in China had two production lines. The line using more traditional technology made goods for export to the United States, while
the line using more modern technology made goods for internal consumption. “That’s what a big market does for you,” he declared.
He then offered a catalogue of China’s other economic strengths:
-
It has a very high savings and investment rate, which, at about 40 percent, contrasts with 20-plus percent in most of the rest of the world.
-
It is excellent at tapping into global knowledge through direct foreign investment and the Chinese Diaspora, the latter providing China and Taiwan a “fantastic global network … that is very hard to replicate.”
-
It is becoming the world’s manufacturing base.
-
It has a very large supply of excess labor in the agricultural sector, some 150-200 million people, which could continue to provide it a labor-cost advantage.
-
It is nonetheless moving up the technology value chain very rapidly to become an exporter of far more than low-cost, labor-intensive goods.
-
Its “fantastic” export-trade logistics, combined with economies of scale, make it “cheaper to ship from most ports in China to the U.S. than from most parts of Mexico to the U.S.” despite the greater distance involved.
-
It has achieved critical mass in R&D, which it is beginning to deploy in a highly focused effort to increase its competitiveness.
-
It is making very strong investments in education and training.
-
Its government has a very strong sense of national purpose, something that “helps to coordinate things, although it creates some other kinds of problems.”
Lessons from China’s Experience
Outlining lessons to be drawn from China’s experience, Dr. Dahlman pointed to its demonstration of the “importance of the nation-state” not only in developing long-term plans and visions but also in providing a stable macroeconomic framework. He underlined what he called the “tremendous pragmatism” exhibited by the Chinese: “Although it is supposed to be a communist system, they have stock incentive plans in the research institutes.” Similarly remarkable, he noted, was that one-third to one-half of the cost of higher education was paid by the students through tuition. While the Chinese have been focusing on technology and education for the previous two decades, the policies currently in development are more coordinated than those that had preceded them. “They are just really revving this up even more,” he commented.
Yet more lessons might be found in China’s conduct of its external relations. It has turned to “tremendous advantage” the realignment necessitated by its integration into the world economy. “Joining WTO was a risky move on their part, but it’s given them lots of benefits,” he said, counting among them not only the country’s dominance of world textile markets but also the pressure that had come upon its domestic system to improve. China has been very effective at
using foreign investment, first to move up the technology ladder, then to create home companies that have shown their strength in everything from competing with Cisco to buying IBM’s notebook-computer capability. “And,” he predicted, “that’s just the beginning.” Strong investment in human capital complemented by effective use of the Chinese Diaspora, whether in acquiring technology or gaining access to markets, filled out the picture.
India “Poised To Do a China”8
For its part, India has seen its annual growth rate rise from the 2 to 3 percent that was traditional prior to the past decade through the 5- to 6-percent level to around 8 percent. It was, in Dr. Dahlman’s words, “poised to do a China,” held back only by its own internal constraints. Chief among these was the surfeit of bureaucracy stifling a flair for entrepreneurship that is nonetheless very strong, as could be seen in the United States, particularly in California, and in linkages back to the home market from overseas. But the country has a critical mass of capable, highly trained scientists and engineers, most notably in the chemical and software fields. In addition to playing a prominent role in the outsourcing of business processes, it is becoming very attractive to multinationals as a place to conduct R&D.
In fact, because of India’s tremendous cost advantage in human capital, more foreign firms have located large R&D facilities there than in China. Companies such as Wipro are increasingly performing contract research in India on behalf of multinationals—and in pharmaceuticals as well as in ICT, a sign of the “tremendous strength being built up there.” The country has relatively deep financial markets compared to other developing countries, and, under the pressure of China’s liberalization, is finally beginning to look not just internally but also outside. It is also seeking strategic alliances, aided by success in capitalizing on its own Diaspora for access to information and markets.
India’s Human Capital Investment Pays Off
One of the main lessons to be drawn from the Indian experience is the significance of the long term: The investments in high-level human capital that were now beginning to pay off for India were made as far back as Prime Minister Nehru’s time in the 1950s through mid1960s. The Indian Institute of Technology and Indian Institute of Management, world-class institutions that accepted only about 2 percent of applicants, have helped build a truly gigantic skill pool. “If they were to rev this up, they could begin almost to dictate the wages for anything you can digitize,” said Dr. Dahlman, admitting this was an exaggeration calcu-
lated to be “provocative.” Still, he observed, “they have a large mass of people that can move and, in economics terms, they have the production-functional educational system. They just have to expand it.”
India could be expected to provide further positive lessons depending on how it handles other pivotal aspects of its development:
-
harnessing its Diaspora, so that the brain drain could be turned into a “brain gain”;
-
moving away from a very autarchic system to become a more integrated part of the global system, which would offer significant benefits from specialization and exchange; and
-
reforming the legal and regulatory regime, which had been what was holding the country back.
A Provocative Projection: China Atop the Heap
Reminding those in attendance that he had promised to provoke them, Dr. Dahlman then posted a graph projecting the next decade’s GDP growth in purchasing-power parity terms for a dozen major nations (Figure 7). The projection assumes that the world’s growth rate between 2005 and 2015 will be stable, and that the countries considered will grow at the rates at which they grew from 1991 to 2003. The graph shows China’s economic size surpassing that of the United States by 2013 and India’s surpassing Japan’s by 2007. While admitting that assuming constant growth rates might be simplistic and that questions could be raised about the way purchasing-power parity is adjusted, he maintained that PPP offered “a better measure of economic size” and declared that China and India were “going to become very big players.” According to a National Intelligence Committee projection of the state of the world in 2020, he added, a big factor will be rising nations—meaning China and India.
Dr. Dahlman reiterated that the key drivers of the world’s increasing competitiveness are education, training, and innovation now that many of the more traditional heavy industries had faded in importance. But access to natural resources have, in contrast, remained critical; competition for energy resources would be “tremendous,” and new energy technologies would be a big area to focus on. Different countries would face many different challenges, and how they respond will depend very much on their particular political, economic, historical, and sociological makeup: on where their strengths lie, how they can mobilize them, how they achieve consensus, and how they can move forward. “The countries that have been growing very fast generally have had good mechanisms for creating public-private partnerships, for consensus, and for developing a shared agenda and a vision,” he observed.
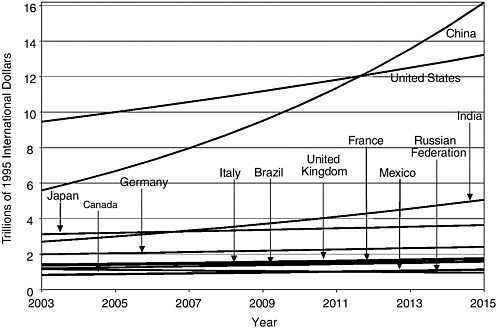
FIGURE 7 Real GDP (PPP): 2004-2015 projections using 1991-2003 average growth rates.
Concluding his presentation, Dr. Dahlman noted that China at present appears to be ahead on most measures of innovative potential, “but,” he cautioned, “India is waking up.”
DISCUSSION
“Just-in-Time Learning”: A New Necessity?
According himself the privilege, as moderator, of opening the question period, Mr. Knox referred to Dr. Dahlman’s comments on the need for “just-in-time learning” in a highly innovative economy and observed that it was a notion with which actual university teaching methods clashed. “What is going to happen in the university space to make this happen?” he asked.
Warning that his answer to this “good and tough question” would again be “provocative,” Dr. Dahlman noted that universities, in general, were founded by the public sector in times of less rapid technological change. Because of the current, very rapid technological change, the private sector had had to establish many institutions of its own in order to gain access to the skills needed for rapid response. Among them had been internal institutions dedicated to training, even internal universities.
The United States has a big advantage over the rest of the world—where, for the most part, the university sector was “too isolated from the needs of the productive sector”—in having a very dynamic higher-education sector that responded very rapidly to change. But even the United States is seeing tremendous growth in online learning, because workers were in constant need of new skills and have no time to return to the campus to acquire them. While not everything can be taught online, very specialized courses could be offered. Approximately 13 percent of higher education in the United States is now taking place online, and 30-40 percent of students are no longer in the age cohorts normally associated with the universities; they were older and are obliged to come back to learn new skills of all varieties.
The United States nevertheless retains many aspects of its traditional education system, which tries to cover many different areas of knowledge. Among core skills, teaching how to learn, and learning how to learn are still very important in enabling people to go out and pursue “whatever it is that is most relevant,” Dr. Dahlman said, and such concerns have “radical implications for designing education all the way from the primary through the secondary and then to the university level.”
Consulting firms, he noted, have begun to discover that, rather than hire MBAs at high salaries, they can take very bright college graduates and train them quite cost-effectively to perform whatever tasks are needed. “There’s going to be more and more competition from these new [education providers], some of whom will come from not the traditional university sector but even from publishing or mass media,” he predicted, saying this trend is not confined to the United States but is global. The ability to use computer-based training and other forms of information technology will combine with increasing competition to put great pressure on educational systems to restructure. Although the United States, thanks to its large and exceptionally dynamic market, is very much ahead in this area, other countries are catching on.
Potential Showstoppers for China
Dr. Wessner asked Dr. Dahlman to identify the main potential showstoppers for the Chinese economy and to reflect in particular on the strength of that country’s banking system and the adequacy over time of its investment capital.
Dr. Dahlman responded by outlining four key internal challenges to the continuation of what had been very impressive economic performance by China.
Environmental Concerns
On a per capita basis, China’s natural resources are quite thin. The nation is very energy-dependent, a problem it has been addressing by using the very large foreign currency reserves it has amassed to acquire access to raw materials around
the world. For example, China has engaged in forward-purchase programs for oil, one of which enabled the Russian government to buy back Yukos. At the same time, China has been struggling with tremendous air and water pollution, which is nearing a choke point. Despite this, however, China’s leaders have opted for a very extensive expansion of the automotive sector without having found a way around the familiar environmental problems that this expansion can entail.
Economic Inequality
Inequality is growing in China both among people and regions, and it is becoming a serious concern. As television penetration is quite good throughout the country, people in the poorer parts of the west, where conditions were hard and the benefits of growth few, are able to observe the differences in living standards, something that can stimulate unrest.
The Financial System
Although the Chinese financial system appeared at first blush to be largely non-performing, it cannot be assessed by customary standards. In the absence of a system of social security, the financial system makes up much of China’s social safety net. China had so many nonperforming loans because former employees of downsized state-owned enterprises, growing at a rate of 10 million to 15 million people per year, continued to receive some payment after their release. “If the country continues to grow very fast, this non-performing loan problem is not a problem,” stated Dr. Dahlman, “but if it slows down, then the relative size of the non-performing loans is a big problem.”
As for constraints on capital, the country’s investment rate of 40 percent or more indicates that capital is not being used very effectively, something the Chinese themselves see as a “big strategic weakness.” The government is setting up numerous venture-capital funds and other means of financing interesting business prospects in an attempt to address this inefficiency while also bringing in foreign banks to provide more competition, better systems of risk assessment and quality control, and better management. The desire to force this improvement is part of the reason China had joined WTO.
The Political System
Although China was moving more and more toward a market economy, it does not have a democratic political system. “At some point there is tension between people’s willingness to live in a more constrained system as opposed to a freer one,” Dr. Dahlman observed, saying it was not easy to predict how this issue would play out. Having seen what had happened in the Soviet Union and other countries, the Chinese authorities are extremely worried about the Internet
and, in particular, the possibility it affords large numbers of unemployed from the industrial sector to organize rapidly. “They’re schizophrenic about it,” he said. “They see tremendous potential, but they also see the risk. And it’s a very hard economy to manage.”
Admitting his puzzlement at the country’s success in managing its economy, and his misplaced skepticism of 20 years before that China’s annual growth rates of 8 to 10 percent could be sustained, Dr. Dahlman pointed to the pragmatism of its leadership. He also suggested that, with the pie growing very fast and the benefits trickling down—sometimes to a greater, sometimes to a lesser degree—a national consensus had been achieved. “The population at large,” he believed, “feels that they are getting a lot of benefits from the government, which is giving economic performance.”
Possible Impact of RMB Revaluation
Al Johnson of Corning, noting that Dr. Dahlman had shown graphs using purchasing-power parity calculations, asked him to comment on the possibility of revaluation of the RMB (China’s currency) and on whether a revaluation might bring forward the moment at which China and the United States reached purchasing-power parity.
Disavowing any expertise on what he regarded an important yet difficult and complicated issue, Dr. Dahlman stated that the Chinese have been very careful concerning the relative strength of their currency because they fear losing control of the speed of the country’s economic growth and, as a consequence, experiencing inflation or a slowdown. While a slowdown, in the Chinese context, could mean a drop in the annual growth rate from 10 percent to 5 percent, it would still make a big difference in how benefits will be distributed and how their distribution will be perceived; the possibility was therefore considered very risky.
But because the RMB was pegged to the dollar, it had in fact been depreciating along with the dollar with respect to the yen, pound sterling, and euro. So, judging by a trade-weighted basket of currencies, the RMB has realigned considerably—it simply has not realigned with respect to U.S. currency. The United States has a particular problem in its very large trade deficit with China, with which Japan and Korea each had a trade surplus. Dr. Dahlman described, admittedly in “exaggerated terms,” a relationship he saw as both difficult and symbiotic based on the purchase by the Japanese and Chinese of U.S. Treasury bonds. While the bonds paid “virtually nothing,” they prevent Japan’s and China’s currencies from revaluing and keep the two nations very competitive with respect to U.S. markets. “They can get a hit if the U.S. devalues very rapidly because they then lose the stock value of these gigantic investments,” he said, and like other investors they will “get nervous if the U.S. is subject to some big terrorist attack.”
The Most Serious U.S. Flaws
Mark Myers of the Wharton Business School, who is a member of the STEP Board, asked what, from the U.S. perspective, Dr. Dahlman considered the three most serious flaws in the nation’s current position.
Stressing that he was responding spontaneously, Dr. Dahlman rated the fact that only a limited number of Americans in higher education are focusing on engineering, science, and technology is a “fundamental weakness” that he said would be very hard to correct. With high pay levels in business and the legal profession attracting the nation’s best and brightest, it is very important to put in place programs that provide ample grants and other assistance to graduate students in science and engineering. Enrollment in these disciplines in U.S. universities has become extremely dependent on Chinese and Indian students, and fewer are entering the country in the wake of September 11, “some because of [immigration] restrictions, some because they are now making a different choice.” As a result, he said, a “big strategic weakness for the whole [U.S.] innovation system” is being exposed.
Dr. Dahlman added that articulation and coordination of policy affecting innovation needs to be increased. He acknowledged that the size and dynamism of the U.S. economy had given it a “gigantic first-mover advantage,” and he also praised its flexibility and “fantastic institutional structure.” Nevertheless, he called for the building of consensus, saying this does not necessarily have to be left to the government, but that there is a significant role for the private sector in self-organizing and establishing consortia where consensus building could take place. It was because the world was becoming “much tougher” and developments were taking place so quickly that this capability is in need of strengthening. Even if not persuaded by his scenarios, he said, his listeners could certainly imagine East Asia’s becoming “a very big dynamo” spawning many large companies, altering the competitive landscape in the process. Europe, “sitting uncomfortably in between” East Asia and the United States, also bears watching. “All this implies the need to think very carefully about how to do strategic alliances and to have a way that the world is more balanced,” he said, “so that you can have a better chance.”
Finally, he pointed out that “tremendous opportunities” remained for U.S. investment in China and India. But this prospect raised the questions “national vs. multinational” and “Who is us?” This “very tricky issue,” he said, “requires more thought.”
Training for Innovation: From What Age?
Jim Mallos of Heliakon, returning to the theme of just-in-time learning, speculated that the character traits and habits of thought that distinguish inventors are already formed by the time a student reaches college, so that college might come too late for the training of inventors. “Shouldn’t we have more emphasis
on funding elementary school education when we worry about innovation?” he asked.
While disavowing expertise in the field of pedagogy, Dr. Dahlman agreed that such training should start at a very early age. One significant advantage the United States had is its reputation for “fantastic” higher education, in particular at the graduate level, which drew people from all over the world. But fundamental rethinking of education is required before critical-thinking skills can be cultivated at the very earliest level, since the country is “stuck with an obsolete structure.” This is a gigantic task, and one that calls not only for continued research but also for “some real action” in the form of experimentation on what works in which setting, both within the United States and in other countries.
Remarkably, he observed, some countries have spent heavily on education yet done very poorly in the OECD’s Program for International Student Assessment (PISA), an evaluation of learning skills among 15-year-olds. Finland, in contrast, has achieved very high scores on these tests with the lowest variance in performance—yet had spent far less than the average country. “How do they do it?” Dr. Dahlman asked. “I don’t know. We should find out. Maybe we can learn.” While PISA might be an imperfect measure of the capacity for invention or innovation, its results offered an illustration that it is not only the amount of money spent that counted, but the internal organization of an educational system that is important, including the risk and reward structure, and the incentives to be more creative. In fact, a premium needs to be placed on these features, he added.
Integrating Tacit Knowledge, Formal Research
Ken Jarboe of the Athena Alliance commented that Dr. Dahlman’s coinage of “just-in-time learning” might have broken new ground, since the term described current reality far more accurately than the commonly used “lifelong learning,” which was saddled with other connotations. As Dr. Jarboe understood the new concept, it is rooted in the fact that innovation is based not only on formal knowledge but also on tacit knowledge: on learning by doing, learning through experience. He asked what implications adopting the model of just-in-time learning will have for the industry-university-government research endeavor. Would it imply “some sort of just-in-time knowledge production”? And how could learning by doing or learning through experience be integrated into formal research?
Dr. Dahlman began his response with a clarification: He had not meant that very good core grounding in fundamentals could be dispensed with. Yet, he noted that many who studied the hard sciences end up working at administrative tasks where they apply very little of the deep knowledge they had acquired. That implied that a better system for producing scientists and engineers is needed, one that delivers the knowledge appropriate to the needs of the future work environment in less time. When it came to basic research, a great deal of very deep knowledge is obviously required to push back the frontier; the problem is that
“too much of a narrow disciplinary approach” still reigns at a time when many different disciplines are flowing together. Therefore, mechanisms are needed that can foster and capitalize on interaction among disciplines that sometimes have no communication with one another, and that can then support work in those fields based on the possibilities and opportunities that might be found. Pilot projects are very important because of the quick response time they afforded, as are simulations. Advances in ICT enables just-in-time learning to take place in greater quantity and on a global scale; part of globalization is that it has become possible to have engineers or scientists working on a problem around the clock.
Cultural Barriers to Innovation
Jongwon Park of SRI International, saying he had recently seen data collected at the behest of the National Science Foundation on the science and technology systems of 10 Asian nations, expressed the wish to be “provocative” by talking not about the successes of Asian countries but about problems and challenges they were facing. In Korea, Japan, Taiwan, and Singapore, members of younger generations have for some time been turning away from science and engineering studies at post-secondary levels, something he called a “tremendous problem.” Also, cultural barriers existing in these countries—the “Confucian, more traditional way of thinking” among them—stood in the way of spawning creativity. He asked for Dr. Dahlman’s reaction.
Getting people interested in the science and technology area, where money is less easily made than in other fields, is a global problem, Dr. Dahlman concurred. While it would demand a great deal of effort, he suggested that all countries could benefit from creating financial incentives, perhaps targeted at the cost of education, along with such “moral rewards” as prizes, awards, and public prominence. Responding to the questioner’s observations on the influence of Confucian thought, he attributed to cultural factors the fact that very few of the world’s top-ranked universities are located in Asia. “It is something the Asian countries are going to have to face,” he stated; in this case, new approaches have to be developed for application not only at the higher educational levels but far earlier as well. In effect, these problems are generic, and the present discussion is directed at conditions in the United States only because the United States was on the leading edge.
Improving Performance Evaluation
Cerise Elliott of the National Institutes of Health, noting that Dr. Dahlman had posited a need for the United States to facilitate effective communication in its information structure, asked for his suggestions for improving the evaluation and measurement of performance.
Dr. Dahlman replied that the United States has a very dynamic peer review system that works much better than those in other countries because of the United States’ large size. It is very difficult to replicate this system in developing countries with very small pools of experts, where the system is subject to all kinds of biases. “When you’re doing research, by definition you don’t know for sure where you’re going to end up,” he remarked, so it is very important “to set up appropriate ways of identifying what you’re targeting and how you know if you’re making progress,” as well as what the impact of the effort might be. He was reluctant, however, to do more than acknowledge how difficult the problem was.
Should Leadership Be a National Priority?
Shiela Ronis of the University Group, which was currently working under contract with the House Small Business Committee, asked Dr. Dahlman whether remaining the leader in science and technology should be a national priority for the United States, and whether it was important to remaining a superpower.
“I think it’s hard to be a leader in everything: There are too many fields, and it’s too complex,” Dr. Dahlman replied, while protesting that the question went beyond his field of competence. In his opinion, the United States should focus on how to remain the leader in selected areas, and these should be not only familiar areas but also areas that, although perhaps less familiar, had potential for the future. The linkages seen among information technology, nanotechnology, and bioengineering seemed to be the beginning of a new wave, one in which many developing countries were beginning to invest quite heavily and in a very systematic way. Consideration should be given to supporting, in addition to space and military technologies, some fundamental technologies that could have big spillover effects.


