
2
Current Status of At-Risk Subnational Population Estimation
The principal goal of this chapter is to address the first task of the committee, which is to “assess the strengths and weaknesses of existing data, methods (e.g., gaps in spatial and thematic coverage, counting individuals, proxy measures such as those derivable from Earth observations), and tools for estimating population.” Because the committee was charged with the overall task of better identifying populations at risk—groups that are susceptible to the impact of natural or human-induced disasters—we recognize that there are three critical elements of the data, each of which is a scale issue: (1) spatial scale (how far below the national level can estimates be derived?); (2) temporal scale (for how recent a time period can estimates be made?); and (3) social “scale” (how detailed are the available population characteristics?).
A close corollary of the scale issues is the question of accessibility of the data. Data might be “available” in the sense that they have been collected, but access to them may be highly restricted and this will limit their usefulness to the humanitarian relief community. Each of these scale issues, along with the availability of existing data, is influenced by the trade-off between costs and “errors.” The finer the scale at which data are collected, the costlier the information will be, and making these more detailed data available to users will be proportionally more expensive.
As a preface to assessment of the current state of the art, the committee notes that input was sought from a range of individuals, familiar with planning and delivery of humanitarian relief, regarding the kinds of data that would be most useful to them. These individuals expressed complete agreement that very recent local data are extremely useful (without agreement,
however, on a strict definition of “recent” nor on the spatial scale at which data become “local”), whereas less agreement was evident about the kinds of population characteristics that data users routinely employ. Distributions of the population by age and gender were most often mentioned because women, children, and the elderly tend to have higher levels of vulnerability in almost any emergency situation. In some parts of the world, relief agencies are clearly aided by knowing the distribution of the population by characteristics such as income levels, housing, religion, race or ethnicity, and language. In culturally homogeneous areas, especially rural regions, some of these characteristics may be common knowledge and sophisticated data collection schemes are not necessary, but in urban areas and other places experiencing in-migration, it may be important to know the relative distribution of various cultural groups. In its discussion of the social scale of available data, the committee includes age, gender, and socioeconomic and cultural characteristics, with the caveat that not every emergency may demand these characteristics and not every relief agency may use them.
This input to the committee’s report is consistent in all respects with the Hyogo Framework of Action for 2005-2015, which was adopted by the international community at the United Nations World Conference on Disaster Reduction held in Hyogo, Japan, in January 2005, shortly before this committee began its work. Particularly noteworthy are the following elements, which the Hyogo Framework (UNISDR, 2005) suggests should be incorporated into all disaster reduction planning: (1) A gender perspective should be integrated into all disaster risk management policies, plans, and decision-making processes, including those related to risk assessment, warning, information management, and education and training. (2) Cultural diversity, age, and vulnerable groups should be taken into account when planning for disaster risk reduction, as appropriate. (3) Systems of indicators of disaster risk and vulnerability at national and subnational scales should be developed that will enable decision makers to assess the impact of disasters on social, economic, and environmental conditions and disseminate the results to decision makers, the public, and populations at risk.
Although tasked with evaluating both data and methods, the committee’s view is that methods themselves are likely less problematic than the data to which estimation techniques are applied, especially in those countries that are data-poor. The committee discusses the use of censuses, field and weighted population sample surveys, and remotely sensed imagery, as well as spatial modeling techniques designed to overcome deficiencies in the extant data sources. A key element in modeling and estimation techniques is the emphasis on spatially explicit demographic data—combining demographic characteristics of the population with the georeferenced location of people according to those characteristics. “Georeferenced” means a location in terms of an address or latitude-longitude, not just a place or
regional name. The committee emphasizes that its focus is on pre-event population estimation—having knowledge about who is likely to be at risk when an emergency strikes, so that the size and scope of the response can be estimated properly and mobilized. However, the collection of data in the post-event environment is also discussed, especially in terms of its reliance on pre-event estimations of the population at risk.
GAPS IN SPATIAL AND TEMPORAL COVERAGE
The Ideal Census Database for Estimating Populations at Risk
The ideal population database at the subnational level would probably be a population register, with data recorded for every person with respect to residence, place of employment, age, gender, and other relevant sociocultural characteristics, with the requirement that every person has to report each change in status and location. However, the cost and intrusiveness of such a scheme means that it is presently impracticable in all but a few countries. Data from the United Nations Statistics Division (UNSD) show that scarcely more than 70 million people worldwide (about 1 percent of the world’s population) live in a country with a population register, and all of them are in Europe (UNSD, 2005). The closest database that most countries come to this kind of register would be administrative sources for the purpose of voting, taxes, or driver’s licenses, which record age, gender, and residence and are updated routinely. However, such registers generally exclude children and may also exclude the most vulnerable individuals in a population because they do not drive, pay taxes, vote, or otherwise have need of a formal identification card.
Population registers are maintained at the local level, with events being registered by the municipal authorities. From this point the data may be relayed up to regional and national levels, creating a central population register. Data could, of course, remain at the local level and be shared at higher administrative levels only as needed. This would be one of the “bottom-up” approaches that international organizations such as the Asian Disaster Preparedness Center (ADPC) suggest be combined with the more traditional “top-down” approaches to data collection and analysis (ADPC, 2006). The usefulness of local data depends, however, on the ability of relief organizations to access and integrate those data into standard methods of analysis. Thus, an integration of top-down standards and bottom-up data collection would probably yield the most reliable and useful type of population register.
Until resources become available to generate ideal population databases in all countries, the best working set of data by which to estimate populations at risk almost certainly comes close to what is available for countries
such as Mexico, the United Kingdom, Canada, South Africa, and the United States—census data for two or more time periods at the equivalent of the subcounty level (e.g., census tract, or preferably census block, in the United States and Canada; area geográfica estadística basica (AGEB) in Mexico; enumeration area in the United Kingdom), along with digital boundary files (e.g., Shapefiles) that cover that level of geography and to which the data can then be georeferenced. Preferable in almost every situation is to have data at the finest possible spatial resolution, especially when dealing with emergency situations. In general, it is easier to aggregate detailed data to coarser spatial resolution than it is to parse aggregated data into finer units. In an emergency situation, in particular, detailed data may help identify populations that are especially vulnerable and are thus likely to be in the greatest need of assistance.
Censuses measure people at their place of residence (the “nighttime” population), not where they work or attend school. If emergencies occur during a time period when people are not at or near home (typically the daylight hours), then estimates of residential population are apt to overestimate the population at risk in some places (by inferring that people are at home when they are really at work) and underestimate it elsewhere (where people work, but do not live). Partial compensation for these daytime and nighttime differences is possible in countries such as the United States where an economic census (a census of businesses, rather than households) or the Place of Work data set produced by the Population Division of the U.S. Census Bureau is available. These data can be used to create at least rough estimates of daytime populations at the local level.
In theory, every census has the potential to become this kind of versatile resource because each interviewed household should have an address associated with it, and thus the data can be aggregated (anonymously) to local administrative boundaries, although the committee notes that sample size issues can make this exercise challenging. The existence of paper maps for such boundaries means that digital maps can be produced, as long as the paper maps (or other legal description of boundaries that can be produced in a map) are made available to someone with the software and expertise to create digital maps. The committee notes that the spatial precision of maps rendered from imprecise paper maps will retain those aspects of impression in their digital forms. Producing digital maps is not an insurmountable issue for any place just as long as some type of hard-copy enumeration unit map exists. Once a digital map is made, it does not need to be remade, only updated as boundaries change.
The utility of existing census data can be seen in Figure 2.1, which summarizes and updates UN data on the recency of national censuses throughout the world. Since 2000, 85 percent of the world’s population has been enumerated in a census or population register. To be sure, this
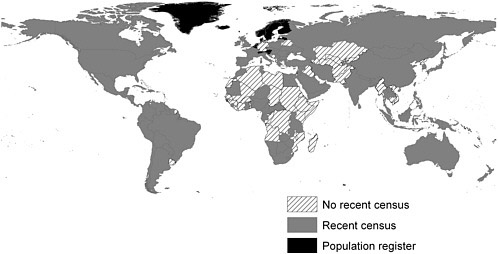
FIGURE 2.1 Censuses by country as of the year 2005 based on data back to the year 2000. Most countries have taken a census in 2000 or more recently. Mozambique, shown in this figure as lacking a recent census, had conducted a full census in 1997 and has made these georeferenced data available digitally. Mozambique will conduct its decennial census in 2007 (see also Chapter 5). Thus, “recent” as a qualifier to the existence of reliable census data in a country must be evaluated on a country-by-country basis. SOURCE: Courtesy of and adapted and updated from United Nations Statistics Division (2005).
still excludes nearly 1 billion people, about half of whom are in Asia and half in Africa. The latter region is particularly underrepresented in census counts, with scarcely half of the population having been enumerated in a recent census.
A positive development in terms of maintaining current data is the increasing (albeit still relatively limited) use of continuous measurement programs, such as the American Community Survey in the United States, to supplement the regular (typically decennial) censuses. Peru is among the first developing countries to begin the implementation of such a program (Peru Instituto Nacional de Estadistica e Informatica, 2005).
For the best-case scenario, the assumption is made that the information obtained in the census includes those attributes of people, households, and housing units that will be most useful for planning purposes. Such censuses would have followed the recommendations and guidelines on census content set forth by the United Nations and available at http://unstats.un.org/unsd/publication/SeriesM/SeriesM_67rev1E.pdf. At present, these guidelines are silent on overall principles of census taking, and the recommendations on subnational data collection are weak. Furthermore, there are no guidelines whatsoever for spatial data collection and dissemination. What would an ideal set of guidelines include?
The population characteristics or attributes that may be especially useful in humanitarian relief situations include age and gender, household structure, religion and/or race or ethnicity (in diverse populations), levels of education, categories of economic activity, health status and skills, and characteristics of the housing unit (Box 2.1). However, in addition to the importance of the categories of each variable, the cross-tabulation of different variables is also significant. What is the age structure of the population by race or ethnicity? What is the household structure by religion or by educational attainment? These kinds of details help planners evaluate levels of vulnerability. Detailed tables could be assembled at a fine resolution in advance by statistical agencies, but this rarely occurs. Instead, such detailed tables are normally requested based on specific planning or research needs for particular projects or in response to some disaster situation. To develop such detailed cross-tabulations requires access to individual census records, or census microdata, as these resources are called.
The principal drawback to micro-level data is the potential for violations of confidentiality. Privacy is a major concern with the use of any data. In the United States, aggregated census data are sometimes altered or even suppressed in order to maintain confidentiality (Abowd and Lane, 2004). One common way in which confidentiality is preserved when microdata are made available to the public is to strip each record of its specific address and assign it instead to an administrative unit that includes enough people so that no single individual can be identified on the basis of the
|
BOX 2.1 The Gold Standard for Census Data That Permit an Assessment of Subnational Populations at Risk
|
data included in the census. In the United States these are called Public Use Microdata Areas (PUMA), and depending on population size, they encompass several census tracts or several counties in less-populated areas of the country. Further complicating the situation is that PUMA boundaries do not coincide with the administrative units for which other information is collected, thus making it difficult to provide an integrated database of information that would be most useful in an emergency situation.
Planning for emergencies, however, does not necessarily require that geographically precise microdata be publicly available, only that someone at the national statistical agency has the background, training, and authority to conduct analyses when requested. Of particular importance is that maps are available, and that population data are integrated into the maps. To date, most census bureaus or national statistical offices in which these confidential data reside are ill-equipped to produce on-demand estimates of census variables by hazard-specific geographic boundaries.
Reality Compared with the Gold Standard
Every country can be evaluated against the gold standard for census data (Box 2.1), and the results of that global comparison provide an estimate of the overall gap that needs to be bridged with regard to estimating subnational populations at risk. These gaps are roughly categorized into (1) lack of recent census or population data, (2) deficiencies in the existing census data, and (3) lack of or deficiencies in maps.
Lack of Census or Population Data
Conducting a census is, of course, an extremely expensive operation, and for this reason the availability of censuses at the appropriate level of detail is difficult in less-developed countries, especially Africa and Asia as noted above. However, an equally important issue is that in many less-rich countries, census data are collected but are not processed quickly or not made available for use. For the billion people not enumerated in a recent census, estimates of their number and location must be made by some modeling technique. These estimates require at least one reasonable source of information to fill in the gap left by the lack of a census. Two basic sources of such data exist—surveys and administrative data—as well as one important ancillary source, remotely sensed imagery.
Survey Data. In addition to administrative registers and population censuses, surveys are an essential, but often underestimated, source of information for vulnerability assessment and disaster response. Given the absence of recent censuses and the rudimentary status of administrative data in many developing countries, survey data are generally the most important source of information. The wide range of local, national, and international actors involved in development and humanitarian activities carry out surveys on a regular basis to scope interventions for health, nutrition, access to water, housing, eradication of poverty, and so forth. These surveys all produce baseline population data and indicators relevant for the risk and vulnerability assessment. Such surveys are relevant even in countries where regular censuses are carried out, given the inherent aspects of census data, including their decennial frequency, potential difficulties of access, slowness in processing, and weighty administrative procedures. Publishing and centrally archiving population surveys and their indicators are essential steps in ensuring their quick availability in periods of looming or actual disaster.
Sample survey data are important sources of information, especially with respect to detailed population characteristics, even in places where censuses are undertaken. The obvious advantage of the sample survey is that it is less costly to undertake a sample that includes only a small fraction of the total population. The disadvantage, of course, is the loss of geographic detail. However, it may be possible to use a variety of spatial modeling techniques to make estimates for places that were not surveyed based on the patterns found in those places that were surveyed. This estimation is made more or less difficult by the type of sampling strategy employed. The most common survey design is a multistage cluster probability sample, often stratified by urban and rural residence, which is based on sampling from defined administrative units using estimates of the enumerated population in each area. Typically, sample sizes within administrative
units are based on probabilities proportional to the number of people (a self-weighting sample within each stratum), so the more populated areas are overrepresented. This approach is appropriate for obtaining national-level data but may lead to large geographic areas, especially sparsely populated rural areas, that are excluded from the sample.
Another concern with sample surveys is the size of the sample itself. The sample size must be large enough within the subnational levels sampled for estimates of subnational populations to be made with a reasonably small margin of error (with the caveat that “small” has been left undefined). Furthermore, urban areas, often oversampled already (see above), may require even greater oversampling to obtain good estimates of at-risk populations living in marginal locations such as informal settlements and unofficial housing.
The value of sample surveys is enhanced if the survey data can be combined with census data in those places where the survey was conducted. In developing nations where higher fractions of the population at risk of natural or human-induced disasters are especially vulnerable to the long-term disruption from such events, the scientific sample surveys most likely to be available are either the Demographic and Health Surveys (DHSs) conducted by Macro International Inc., an Opinion Research Corporation company (ORC Macro), with funding from the U.S. Agency for International Development (USAID), or the United Nations Children’s Fund (UNICEF) Multiple Indicator Cluster Surveys (MICS). These surveys almost always include at least one subnational administrative level and thus provide an important basis for modeling subnational populations. The list of currently available and planned surveys can be found at http://www.measuredhs.com and http://www.childinfo.org/MICS2/natlMICSrepz/MICSnatrep.htm, respectively.
Household surveys have also been conducted over the past several years by the World Health Organization (WHO). These surveys are undertaken primarily in developing countries and may overlap coverage with the DHS. Information about the World Health Surveys can be found at http://www.who.int/healthinfo/survey/whsresults/en/index.html.
The World Bank, in conjunction with the United Nations Development Programme, has sponsored a series of household surveys aimed at evaluating levels of poverty in developing countries. The Living Standards Measurement Surveys were conducted especially during the 1990s, but some others are more recent. A complete listing is available at http://www.worldbank.org/LSMS/guide/select.html.
The World Bank has supported the creation of metadata for these and other household surveys (including the DHS, MICS, and WHO surveys), and this information has now been compiled by the International Household Survey Network and can be accessed at
http://www.internationalsurveynetwork.org/home/?lvl1=activities&lvl2=catalog&lvl3=surveys/. The metadata include contact information for obtaining access to the micro-level data with identifiers removed.
Rapid-assessment surveys conducted just after an emergency also fill in some of the data gaps by obtaining expert judgment estimates from well-informed local leaders—community leaders and planners or local nongovernmental organization (NGO) or national statistical office (NSO) heads. While the quality of these data is typically unknown Noji (2005) suggests that such data are preferable to no data at all. The committee would qualify this statement by indicating that consistent collection and updating of census and survey data would reduce reliance on data that may be of questionable or unknown reliability.
Administrative Data. Administrative data refer to data collected by the government or other large entity for purposes other than demographic uses. These data might be land parcel data used for taxation and land tenure purposes or utility data collected for billing purposes. Committee members recognize, however, that areas lacking censuses are equally likely to lack these sources of information. When available, administrative records typically provide data on the number of households in a given region, and in combination with other estimates of household size, this information can be used to generate total population estimates for subnational areas. However, these sources of population estimates rarely provide data on the characteristics of the population or households. Quite often, administrative data in developing countries are not automated and thus not very practical for creating and updating statistical profiles.
Remotely Sensed Data. Remotely sensed imagery includes data acquired from sensors positioned on satellites and other airborne vehicles and has generally been collected for the purpose of Earth science observation and monitoring. The total costs of undertaking a mission to acquire satellite data would far exceed the expenditures of undertaking frequent national censuses; in contrast, the marginal cost of acquiring already-collected imagery is fairly inexpensive at moderate resolution. The image itself is composed of a two-dimensional array of pixels from which radiant energy has been captured for an area on the ground that is equal to the spatial resolution of the image. The information recorded for each image depends on the particular sensor, but the brightness within a given band is assigned a digital number. The combination of digital numbers representing relative reflectance across the different bands of light yields the spectral signature of that pixel. Particular types of land cover (e.g., vegetation, soil, water, impervious surface) tend to have unique spectral signatures. The more bands that a sensor has, the more detailed is the land cover classification.
Determining any personal information about individuals directly from remotely sensed imagery is nearly impossible, although we may indirectly infer the social status of residents in an area by interpreting characteristics such as building size and shape and amenities such as swimming pools and vegetation. These inferences build on the fact that humans generally transform their physical environment in ways that provide clues about their numbers, location, and overall well-being. In rural areas, people clear forests and plow fields to plant crops; they dam rivers to create reservoirs of water, build roads, and alter the environment in numerous other ways. These activities yield clear, aerially extensive signs of the human alteration of the physical environment. This transformation is even more intense in urban areas where people put infrastructure underground and then cover the surface with an almost endless variety of buildings and transportation networks, interspersed with bits of nature (parks) in the midst of vast areas of human-built impervious surfaces (de Sherbinin et al., 2002). In all cases, people build dwellings that can be counted and identified from satellite imagery pre- and post-disaster.
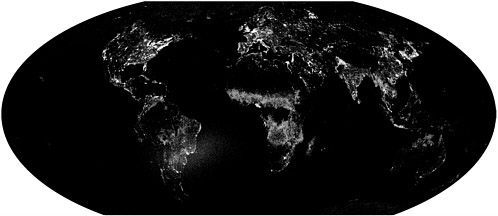
Because of the direct and deliberate impact that humans have on the environment, the transformed environment may be used as an index to the population living there. Depending on the spatial, spectral, and temporal resolution of the data, it is possible to estimate the extent of human activity in an area. For example, nighttime light imagery has been used extensively to estimate the size and extent of urban populations (Balk et al., 2005a), and these images are probably among the more widely recognizable of all satellite images (Figure 2.2). These data are discussed later in the chapter, but it is useful at this point to note that in spite of the imagery’s popularity, a number of limitations to the use of these data exist (Elvidge, 2006). In highly developed areas, the lights tend to splash into unpopulated areas leading to an overestimation of population, whereas in less developed areas the lack of electricity leads to an underestimation of the population. Further, no intra-urban distinctions are possible, limiting the use of these data to the detection of entire settlements. Nonetheless, the usefulness of nighttime lights for social science purposes has led to proposals for launching satellites with more sophisticated light sensors that would at least diminish some of these problems and make the data even more useful for subnational population estimation purposes (Elvidge et al., 2007).
Deficiencies in Existing Census Data
Census information, such as tables on population and housing characteristics, is increasingly georeferenced using twenty-first century geospatial technologies, but it is still the case that census tables are often not released with census geographic boundaries. Even where a census has recently been
conducted, resource limitations may mean that data have not been aggregated or disaggregated to the local levels where they are most useful for disaster planning and response. Furthermore, even if data are available at a subnational level there may be a requirement that they be purchased and, more importantly, the purchase price may include restrictions on their reuse by others. Both requirements can prevent these data from being employed in the support of humanitarian relief operations. Although tabular data are often made available freely by NSOs—even at a fairly high level of spatial disaggregation—the corresponding census boundaries are much less likely to be made available without fees.
Another potential deficiency of existing census data is that important population characteristics may be missing. In particular, ethnic and religious differences have historically been triggers for internal violence, yet these characteristics are not always available in a census. For example, censuses in the United States historically asked about race and, since the 1980s, about Hispanic ethnicity, when the United States recognized the importance of the increasing Hispanic population. The 1980 Census question sought to obtain a count of the population of Hispanic descent. Those who selected the “Hispanic” category were asked to identify their ethnic background (e.g., Mexican American, Puerto Rican, Cuban, or “other” [Spanish, Hispanic, Latino]) (Rodríguez et al., 2007). While sensitive to some, these questions have been retained in the census, despite criticism, on the grounds that only by collecting such information could inequalities be addressed. The French, in contrast, deliberately have not asked such questions about race or ethnicity because of the social philosophy that all citizens of France should be thought of as French, regardless of their racial/ or ethnic origins. Sometimes questions about certain population characteristics, especially ethnic group identity or religion, deliberately may not be asked for fear that the information will be used by one group against another (Box 2.2). To compensate for the lack of such information, modeling techniques can be employed using sources other than census data to fill in gaps, as discussed below.
Data on health and the overall standard of living of a population are important in the evaluation of levels of vulnerability (see Chapter 1). It is assumed that persons with lower levels of health and of economic well-being will be more vulnerable than others in a population, because they tend to be more sensitive to the hazard and have less coping capacity. The source of vital statistics is a system of vital registration (e.g., birth and death registers) or a population register in combination with surveys. The source of standard-of-living data is also a census in richer countries (and sometimes in less-rich countries) and surveys in less-rich countries. In the absence of such data, it is possible to model mortality levels (which are important indicators of overall health) if reasonably accurate age and gender data are
|
BOX 2.2 Dangers of Census Taking in Nigeria In March 2006, Nigeria (the world’s ninth most populous nation) completed its first census in 15 years, but not without protests, boycotts, rows over payments to officials, and at least 15 deaths (Lalasz, 2006). Notably missing from the questions asked on the census were those relating to religion and ethnicity. Nigeria’s population is divided among three broad ethnic groups: the Hausa-Fulani in the north, who are predominately Muslim; the Yorubas in the southwest (of various religious faiths); and the largely Christian Ibos in the southeast. The 1952 census of Nigeria indicated that the Hausa-Fulani had the largest share of the population, so they dominated the first post-colonial government set up after independence in 1960. The newly independent nation ordered a census to be taken in 1962, but the results showed that northerners accounted for only 30 percent of the population. A “recount” in 1963 led somewhat suspiciously to the north accounting for 67 percent of the population. This exacerbated the underlying ethnic tensions, culminating in the Ibos declaring independence. The resulting Biafran war (1967–1970) saw at least 3 million people lose their lives before the Ibo rejoined the rest of Nigeria. A census in 1973 was never accepted by the government, and it was not until 1991 that the nation felt stable enough to try its hand again at an enumeration, after agreeing that there would be no questions about ethnic group, language, or religion, and that population numbers would not be used as a basis for distributing government expenditures. The official census count was 88.5 million people, well below the 110 million that many population experts had been guessing in the absence of any real data (Okolo, 1999; Weeks, 2005). If the final count from the 2006 census conforms to demographic estimates, it should be about 130 million. The 2003 Nigeria Demographic and Health Survey suggests that 51 percent of these people are Muslim, while about 48 percent are Christian, and 1 percent practice some other religion (Nigeria National Population Commission and ORC Macro, 2004). |
available at the subnational level (NRC, 2003). Some assumptions about the standard of living can be made from ancillary data or even inferred from the absence of data. The World Bank has pioneered methods of inferring levels of consumption, poverty, and inequity from indirect estimation techniques that couple limited census information with more expansive but more geographically confined survey information for small administrative areas (Elbers et al., 2003; Henschtel et al., 1998).
Insufficient or Deficient Maps
The easiest of the gaps to fill is with respect to maps, at least in theory. In the United States, the Census Bureau has been at the forefront in the creation and distribution of digital boundary files that provide the spatial
locations referred to in census and government survey data (for the United States and Puerto Rico). The boundary files are a product of the Topologically Integrated Geographic Encoding and Referencing (TIGER) system and are available for free download from the Census Bureau at http://www.census.gov/geo/www/cob/index.html. Canada and Mexico have produced similar digital boundary files, but require that most users purchase them from the national statistical agency (Statistics Canada and Instituto Nacional de Estadística e Informática [INEGI], respectively). An increasing number of countries are following this lead, and private companies also buy these data sets and repackage them for consumers. The Environmental Systems Research Institute (ESRI), one of the largest producers in the world of geographic information system (GIS) software, includes a set of boundary files in its basic desktop mapping software, and it maintains a web site that has a search engine for existing digital maps from anywhere in the world, albeit without any assurances of the quality of the data found at each link available at (http://www.geographynetwork.com). ESRI’s VMap (Vector Smart Map) data files were produced in conjunction with the U.S. National Imagery and Mapping Agency (NIMA; now the National Geospatial-Intelligence Agency [NGA]).
At first glance, the necessary maps appear to exist so there should be no problem in linking maps with demographic data. The reality is that the existing maps tend to be of uncertain or unknown quality, in terms of both accuracy and age. Furthermore, the extant maps are not necessarily available at the same level of geography (e.g., enumeration areas) as the available census data. Researchers must anticipate that for most nations a great deal of time and effort will be required to obtain digital maps that correspond to the subnational boundaries referred to in census or survey data.
Considerably more effort has been given to obtaining place-name and location data than has been devoted to building a global database of political and administrative boundaries (Lauber, 2007; see also Appendix E). While the place-name data are extremely useful for a variety of purposes, knowledge of the geographic distribution of a population within a place is crucial for estimating the size and characteristics of at-risk populations. Since census data are collected with administrative boundaries in mind, appropriate maps of those boundaries are required in order to locate people spatially. A recent Working Group of the International Union for the Scientific Study of Population (IUSSP) argues for making as many of the spatial building blocks available so that it is possible to determine the location of particular places within their administrative units and with respect to all other neighboring units (Champion and Hugo, 2004).
The United Nations Geospatial Information Working Group (UNGIWG) was created in 2000 to address these and related issues and in 2001 began work on a Second Administrative Level Boundary (SALB) project to map all countries
of the world at the second administrative level, which is equivalent to the county level in the United States. This project is described in more detail on its web site (http://www3.who.int/ whosis/gis/salb/salb_PO.htm).
One of the limitations of the work being done by UNGIWG is that mapping is done at the scale of 1:1,000,000, which might compromise the positional accuracy of the data. As Lauber (2007; see also Appendix E) indicated, maps that were produced at the equivalent of a 1:50,000 scale would be preferable. As of 2006, maps at this scale were available for only a relatively small number of countries. An important reason for this restricted availability may be that countries are less willing to share boundary information than they are to provide place names (Lauber, 2007; see also Appendix E).
The NGA is currently in the process of digitizing the known subnational boundaries for all countries of the world (Lauber, 2007; see also Appendix E), based on descriptions of those boundaries provided to it by the U.S. Department of State. These data are an important resource with even greater value if made available publicly and accompanied by full metadata consistent with Federal Geographic Data Committee (FGDC) standards. To date, public use data files produced by NIMA (NGA’s predecessor), although widely used, are considered to be poorly documented according to most university and agency standards.
With the exception of Africa, most regions of the world have a high level of coverage of the population from a recent census (Figure 2.1). Most countries that have not taken a census recently have had one or more household surveys conducted that have the potential to provide population estimates. Administrative data and remotely sensed imagery can also be used to fill in gaps in population coverage from other sources. Because all census and survey data are collected initially at the household level, the locations were known at that time. Coming close to the gold standard for census data availability requires recognition on the part of people everywhere that georeferencing the data collected is the key to success in all subsequent efforts to create subnational population estimates. Once the link is lost between the data and their location, the task of creating subnational population estimates becomes tremendously more complicated.
Added to these complications are the problems associated with trying to overlay population data with maps representing areas hit by a hazard, such as a flood, fire, or conflict. Overlaying maps is a relatively straight-forward process with GIS computer software, but the computer requires a set of digital maps and many statistical agencies throughout the world are only now beginning to undertake the task of creating the maps that coincide with the boundaries of places for which statistical data are aggregated.
Because so few countries have the combination of fine-scale demographic data and accurate maps of the places represented by those data, a
variety of other techniques to estimate subnational populations have been developed on an ad hoc basis. The next several sections review these techniques in order to assess their strengths and weaknesses.
Post-event Population Data
Once an event has occurred, the demographic structure and dynamics and the condition of the population in the affected region may change as a result of deaths and/or mass displacement. The issues and methods involved were reviewed in a previous report (NRC, 2001), and this section largely updates information contained in that report.
The difference between the estimate of the baseline (pre-event) population and the estimate of the post-event population provides an estimate of overall impact, and of course, the baseline data provide denominators so that death rates (and thus excess mortality) can be calculated. While baseline population counts are necessary, these counts should be sufficiently spatially disaggregated for event-specific denominators to be constructed. For example, the high-resolution census data for Indonesia (i.e., at the fourth administrative level, representing 60,000 units nationally and more than 2,000 within Aceh Province alone) permitted the estimation of the population within a narrow band of the coast—at risk from the tsunami. Data for other countries affected by the December 2004 Indian Ocean tsunami were not available at this fine a scale, adding greater uncertainty to the denominators (Balk et al., 2005b) and thus to the overall estimations of deaths and injuries.
Age and gender, which represent key demographic variables differentiating death rates and coping capacities, are the population characteristics most sought after (Doocy, 2007; see also Appendix E). Two additional characteristics, race or ethnicity and social class, were also identified as essential to understanding pre- and post-disaster vulnerability among populations affected by Hurricane Katrina in 2005 (Cutter, 2005; Cutter and Emrich, 2006; Cutter et al., 2006; Pastor et al., 2006).
Estimates of post-disaster event demographics are generally made by members of the emergency relief team or other relief agencies or, in some cases, by researchers from academic institutions or NGOs (Noji, 2005). The methods used appear to vary by organization, and often the results are not shared and compared with those of other organizations, as discussed in Chapter 4. Estimates of populations residing in refugee camps, such as those maintained in the Complex Emergency Database (CE-DAT) by the Centre for Research on the Epidemiology of Disasters (CRED) at the University of Louvain School of Public Health, have an unknown level of accuracy since there are seldom methods of validation, but the expectation is that proper scientific sampling techniques will yield reliable results (Brown
et al., 2001). The office of the United Nations High Commissioner for Refugees collects and posts data on hundreds of refugee camps and other locations by gender and age on its web site (http://www.unhcr.org/statistics/STATISTICS/4486ceb12.pdf). Often, the refugee population is residentially intermingled with the existing population, making it impossible to assess the refugees within the community without a separate population survey (Bilsborrow, 2006). For this reason, the demographic impact on areas outside of the immediate event area remains largely unknown.
METHODS AND TOOLS FOR POPULATION ESTIMATION
Substantial investment has gone into the collection of data and the estimation and forecasting of national-level populations (Lutz et al., 2004; UNPD, 2005). Although subnational data are, by definition, collected in the process of constructing national-level estimates, analysis of subnational population data currently is not seen as the responsibility of the United Nations or any other international organization.
Organizations that regularly provide estimates and projections of subnational populations for different countries of the world include the United Nations Population Division (UNPD) and the Population Division of the U.S. Census Bureau. For the U.S. Census Bureau, this type of international work is entirely client based, and the subnational estimates and projections are not routinely made publicly available. In practice, the data may be made available to another U.S. federal agency but may not necessarily be openly accessible to the public. One of the Census Bureau’s clients is Oak Ridge National Laboratory (ORNL), which uses the data as input to LandScan (see section on global population data below).
If census or survey data exist for subnational units, those data can be updated to create estimates of current population or can be projected forward in time. Population projection methods—including the well-used cohort-component method and newer probabilistic forecasts—were not the focus of this committee. Within the field of demography, established techniques for estimating and projecting local populations exist, but these methods rely on the prior existence of subnational population data, typically down to or below the fourth administrative level, such as census block groups in the United States. (Smith et al., 2001; Plane and Rogerson, 1994; Kintner et al., 1994).
However, the committee realizes that many countries with vulnerable populations have out-of-date censuses or existing censuses that have not been processed to the local level, and thus may be in need of projection or forecasting methods simply to estimate their current populations. Such methods require either good vital statistics data, indirect estimates of mortality that may be derived from the model life tables created by Coale and
Demeny (1983), or for countries of sub-Saharan Africa where deaths due to AIDS have altered previous mortality patterns and gains in life expectancy, the new life tables created by the INDEPTH Network (2004). Additional information (e.g., age-specific birth rates) may be drawn from DHS or similar reproductive surveys. Age- and gender-specific migration rates can also be incorporated into the cohort-component method, although data on migration rates are more difficult to model than are mortality and fertility.
Because the data tend to be more available and reliable at the national than at the subnational level, the estimation/or projection methods tend to be top-down ratio methods—extrapolation or ratio regression methods, controlled to national totals (see, for example, Smith et al., 2001). If the data permit, the preference is to use cohort component at the subnational level and then control those totals to the cohort-component model created at the national level. An alternative approach is to estimate all but the largest subnational areas and then assume that the largest area is equal to the total minus the sum of the subnational level.
The availability of such data obviously varies from place to place, but the methods themselves are standard techniques and are well known to demographers. Although the methods can be implemented by trained demographers, the committee was reminded that few such experts are currently employed in sub-Saharan Africa (Landau, 2007; see also Appendix E). As a result of this human resource deficit, these kinds of demographic estimates and projections are unlikely to be undertaken by national statistical agencies.
In the past several decades, numerous models for facilitating training for census officials, ranging from bilateral assistance from the U.S. Census Bureau (and other NSOs) to specialized training programs at Demographic Training Centers were established by the UNPD. Unfortunately, these basic demographic training programs have diminished over time (Landau, 2007; see also Appendix E; Menken et al., 2002). Technical assistance is still given, but it is presently at much lower levels than in the past. Further, the technical assistance has focused largely on demography with some minor training in spatial techniques, but the spatial and demographic components have not been well integrated.
Since population research tends to be allied with social problems and the search for solutions to those problems, donor priorities have an important influence on the field. Over time, new donors have entered the population field and the substantive priorities of established donors have shifted. Moreover, a critical change in the population field occurred in the mid-1990s when United Nations Population Fund (UNFPA) and USAID decreased or eliminated funding for doctoral and master’s training. New donors in the field have not provided substitute funding for the diminished contributions of the established donors in the training arena, and those
interested in capacity building generally confine themselves to short-term training. Opportunities for graduate training for promising developing country scholars are now largely dependent on a diminishing number of private foundations and some national governments (Menken et al., 2002). While the most desirable situation is one in which population experts are trained primarily in high-quality institutions located in their own countries or regions, this is not likely to be achieved in the near future.
Issues of Uncertainty Regarding Population Counts and Characteristics
All methods of population estimation have a level of uncertainty associated with them. Some of the uncertainty is a consequence of nonsampling error (such as poor data quality) and is not readily measurable. Some of the error is associated with sampling (which occurs within censuses, as well as within purpose-driven surveys such as the DHS), and some of the error is associated with the estimation or projection techniques. With the exception of the sampling error associated with censuses and purpose-driven surveys, the other errors are nonparametric in nature and require bootstrapping and Monte Carlo methods in order to create a confidence envelope around the estimates or projections (Mooney, 1997; Lunneborg, 2000). These techniques employ resampling of a researcher’s observed data to evaluate the variability in those data as a way of estimating the likely confidence interval around a population value. Thus, instead of taking repeated samples from a population (the classical statistical approach), one takes repeated samples from a single sample drawn from the population. These simulation methods are possible only with computers that can handle the enormous number of computations involved.
The committee did not discuss this issue in detail, but notes that all users of population estimates and projections should be familiar with literature such as Smith et al. (2001) and Siegel and Swanson (2004) and should be aware of methods that are still evolving to provide measures of uncertainty with respect to demographic estimation. The committee also notes that to the extent that rates are estimated over a geographical surface, the statistical significance of differences between contiguous areas can be estimated using Bayesian procedures such as those developed by Christakos and associates (Christakos et al., 2005).
Spatial Demography
As noted above, subnational population characteristics may be estimated by modeling data from georeferenced surveys, such as the DHS and the MICS, and similar household surveys. These surveys do not cover all countries, but they do cover places in the world that are the most data-
poor, by census standards, and are likely to have disproportionate shares of vulnerable populations. Livia Montana, of ORC Macro, provided the committee with examples of how this modeling might proceed (Montana, 2006). Survey data are georeferenced to the centroids (geographic centers) of the administrative boundaries representing the clusters from which households are sampled for the DHS. Data summarized for these areas can then be interpolated between clusters to produce estimates for those places not included in the sample. Montana (2006) illustrated this method using inverse distance-weighted interpolation to model HIV prevalence in Kenya and Tanzania, but a variety of other spatial interpolation techniques (e.g., kernel density estimation, kriging) exist to accomplish this task, and the choice of modeling technique depends on the nature of the data being used and the assumptions being made about the spatial distribution. The state of the art is still quite nascent in this regard, and considerable additional research will be required to help researchers make decisions about the appropriate modeling strategies to employ in this situation. At present, not enough validation studies have been conducted to guide researchers definitively to a method of choice.
As Weeks et al. (2000) and Openshaw and Rao (1995) suggested, the use of point data in statistical modeling to represent information aggregated for an area around that point can be improved if the point refers more accurately to where the population actually resides, rather than relying generically on the geographic center of the administrative region to which the data refer. The use of remotely sensed imagery provides a way of locating populations within an area, because humans almost always make modifications to the natural environment that can be detected remotely and then mapped on that basis. This referencing technique is called dasymetric mapping (Mennis, 2002, 2003) and is an example of what is often referred to as the modifiable areal unit problem (MAUP), keeping in context the fact that the MAUP shows that the results of statistical analyses almost always depend on the spatial scale of the analysis (Plane and Rogerson, 1994).
Global Population Data
All of the data and methods discussed to this point are place specific, in the sense that we are asking what kinds of demographic data and digital geospatial data exist for a particular country for the most recent date possible. However, important initiatives have been made to create global spatial databases of population that can be used to identify populations at risk. Tobler (1992) summarized a model for allocating national-level population data to a global grid of 5-arc-minute by 5-arc-minute quadrilaterals. The model was refined and summarized in subsequent publications (Tobler et al., 1995, 1997). The database was made available on the Internet site of
the Center for International Earth Science Information Network (CIESIN) and was the basis for the current Gridded Population of the World (GPW), housed and now produced with refinements at CIESIN at Columbia University (CIESIN et al., 2004). This model inspired the development of a similar database, but with higher resolution, designed specifically to help globally identify populations at risk of disasters. That database, known as LandScan, is a project of ORNL (see summary in Dobson et al., 2003). Both GPW and LandScan have largely concentrated on population “surfaces”—arbitrarily defined areal grids—rather than on the specific identification of populated places or settlement networks. Thus, GPW and LandScan are grids, not geographic features, and have to be used with this understanding when dealing with specific locations in space such as a village or town. Further, the only aspect of population captured by these approaches is total population size. No other demographic information that could identify risk (beyond being in the path of a disaster), such as age, gender, or race or ethnicity, is currently available in these data collections. Nonetheless, both models have considerable utility and are used for a variety of purposes including emergency planning; so they are reviewed here with the caveat that if either or both of them met all of the needs of humanitarian relief and development organizations, this committee’s work would not have been requested.
Gridded Population of the World
A gridded population surface of the world was developed for studying the human dimensions of global change rather than for identifying populations at risk. The initial GPW data set, GPW version 1, was a direct outgrowth of a Global Demography Workshop held at CIESIN in 1994 (Tobler et al., 1997). The data set was produced by Tobler and colleagues at the National Center for Geographic Information and Analysis (NCGIA), at the University of California, Santa Barbara, with partial support from a CIESIN National Aeronautics and Space Administration (NASA) contract so that population data could be integrated with Earth science data. GPW is now in its third version and includes a major update of the underlying population and spatial data. The first version had fewer the 20,000 input polygons (or administrative units), whereas the third version has almost 400,000 such units (see http://sedac.ciesin.columbia.edu/gpw/). The GPW data include only total population numbers (denominator data) and must be overlaid with other data layers (numerator data) to create measures of risk or vulnerability. Although used in applications for assisting at-risk populations, most uses are still moderate in scale and concern health applications (Balk et al., 2006) or global environmental change assessments.
LandScan
LandScan was developed in 1997 at ORNL, with the explicit intention of modeling populations at risk (Dobson, 2007; see also Appendix E). LandScan starts with subnational population estimates provided by the Population Division of the U.S. Census Bureau and then uses ancillary data sources—elevation, slope, land cover, and road networks—to reallocate persons within administrative areas (Dobson et al., 2003). LandScan is an explicit model to measure population across times of day, seasons, and likely localities (e.g., implicitly at work rather than at home), that is, at an individual’s “average” or ambient location. Such a model has considerable appeal because it does not assume that individuals remain stationary and near their homes at all times. At present, however, the more detailed data have been completed only for the United States and Puerto Rico. These data rely not on population estimates but on actual census counts at a fine geographic scale for the United States and its territories.
LandScan has utility in helping estimate populations at risk, and improvements in the program could enhance this utility further. For example, in addition to producing a single ambient measure, estimates that represent the most common flows of individuals—daytime verses nighttime movements—could be very useful. In particular countries or portions of countries including hazard zones (e.g., near coasts), a set of seasonally specific population estimates would also enhance LandScan’s utility. LandScan staff are presently working on such refinements to their product, but the work thus far has been limited to a few geographic areas within the United States (Shankar et al., 2005). Another limitation of the LandScan global product is that, as is true with GPW, it is based solely on total population counts and does not incorporate any other population characteristics.
Comparative Assessment
While both approaches rely on population counts that come from individual countries’ statistical agencies or NSOs, GPW and LandScan differ in the types of inputs they use and the intent of the output. The GPW data collection uses a heuristic approach to population distribution, and the basic data include only spatial boundaries and population counts as inputs. The intent is to represent the “usual residence” (the measure used by most censuses to determine where census respondents usually reside) of the global population. The LandScan collection uses population data along with ancillary inputs (e.g., roads, land cover) to indicate an ambient distribution of population (i.e., an individual’s location averaged across all times of day, seasons of the year, and so forth). LandScan models each nation (and, in many cases, separate regions within nations) individually due to the spatial disparities of
input data quality, scale, and availability. Further, the population distribution for each administrative area is calculated separately within each nation to account for differences in the spatial data inputs and settlement patterns.
Testimony to the committee during the study presented a number of the key issues and a historical context for constructing population surfaces (Dobson, 2007; see also Appendix E) or what we consider baseline data. These population data can be used as denominators for rates or to determine the total population exposed to risk. However, because of the lack of information about population characteristics, neither LandScan nor GPW can be used for a rapid assessment of exactly who was or will be affected by a specific event.
Table 2.1 reviews basic similarities and differences in the databases. The committee notes that these two data collections were developed largely independently of one another. Although efforts to share data have worked in the past, it is not the current practice. The underlying data, including the spatial and population estimates may be proprietary, making it challenging to share the full suite of data products across institutions.
These data products are intended as complements rather than substitutes for one another, although most data users select one over the other for a given purpose. Hay et al. (2005) published one of the few studies that compare these and other data sets in their study of malaria in Africa.
Each of these data products has strengths and weaknesses. In general, GPW most resembles the underlying census inputs. To the extent that both GPW and the census inputs are spatially precise, of reasonably high spatial resolution, and recent, they are very likely to approximate the distribution of usual residence. LandScan, in contrast, represents an ambient population, and estimates of population distribution from this data set will tend to be better than GPW in places where the census data are spatially coarse and not recent (as long as the ancillary data are more current). It is unclear which data set would be objectively superior for places where the data quality and spatial and temporal resolution of the underlying census data were high (Figure 2.3).
Both GPW (and related data products) and LandScan would need new methods to construct surfaces of population characteristics such as age distribution, gender, or race or ethnicity. Even in GPW, where the only assumption made is one of proportional allocation, population counts are often available at the finest spatial resolution, whereas other demographic or housing information is available at a coarser level. Similarly, LandScan’s ancillary data inputs assume equal patterns across ages; this type of assumption would not, for example, allow differentiation of the ambient populations of children from those of people in the paid labor force.
Lastly, although the population surfaces from all of these databases are publicly available, the underlying data are not, even though in many
TABLE 2.1 Comparison of LandScan and GPW
|
Overview |
LandScan 2004 |
GPW Version 3 |
|
Number of administrative units |
239,178 |
399,000 |
|
Output resolution (grid cell area at equator) |
0.5 ft. (1 km) |
2.5 ft. (5 km) |
|
Model input variables |
|
|
|
Census data (population) |
YES |
YES |
|
Land cover |
YES |
NO |
|
Roads |
YES |
NO |
|
Digital Elevation Model inputs (elevation and slope) |
YES |
NO |
|
Nighttime lights |
NO (but was included up to LandScan 2003) |
NO |
|
Other imagery |
Shuttle Radar Topography Mission (SRTM) for elevation data; Controlled Image Base (CIB) data for urban boundaries and settlement identification; MODIS for land cover data; Landsat Thematic Mapper Derived Land Cover Data; Digital urban boundaries updated and modified with IKONOS/Quickbrid high-resolution imagery |
|
|
Population data source |
U.S. Census Bureau |
Variable data sources (mostly NSOs) |
|
Years of estimate |
2004 |
1990, 1995, 2000, 2005, 2010, 2015 |
|
Export Data Type |
ArcInfo Grid/ArcInfo BIL/HPAC Binary |
ArcInfo export files |
|
Minimum downloadable unit |
Continent |
Country |
|
Institutional |
||
|
Producer |
ORNL |
CIESIN and CIAT |
|
Sponsors |
Department of Defense |
NASA |
|
URL |
||
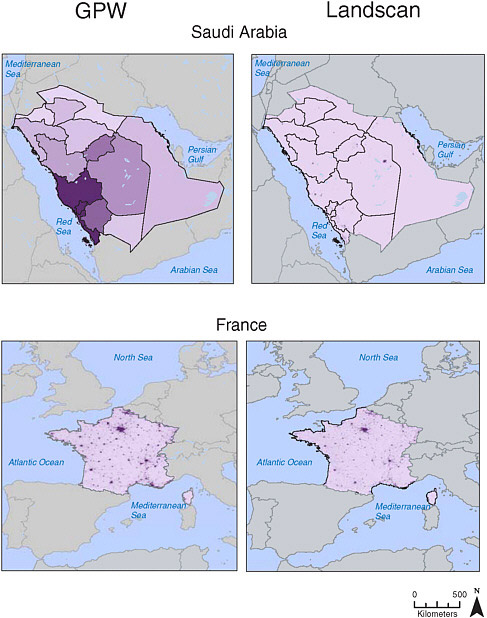
FIGURE 2.3 Comparison of GPW version 3 and LandScan 2003 for an example of a high- and low-input-resolution country. All data shown are gridded with first-order administrative boundaries overlaid for the low-resolution country, Saudi Arabia. The LandScan model reallocates population in Saudi Arabia from large administrative regions to likely places of work or residence and produces a much more finely resolved population distribution map. Where underlying population inputs are high per unit area, as in the case of France, the output grids of population distribution appear quite similar.
instances the underlying data would be preferable to the gridded surfaces. The restrictions on the underlying data are due largely to the fact that some data layers are derived from proprietary sources. In other instances the underlying data are not available publicly because they have not been prepared to the same standards (e.g., the data lack full metadata records, cross-national boundary rules, or place names) and the sponsors for these global data products do not require or supply sufficient resources to make the data inputs available as well. A reasonable conclusion is that the same problems that prevent existing census data from being directly usable by humanitarian relief agencies also prevent the data from being made available through GPW or LandScan.
Other Database Developments
The GPW and LandScan concepts have encouraged construction and development of additional databases. For example, in collaboration with the UN Food and Agriculture Organization (FAO), CIESIN and the Centro Internacional de Agricultura Tropical (CIAT) constructed a set of gridded population projections out to the year 2015. This effort uses the same 400,000 inputs as does GPW version 3, but estimates the population in 2005, 2010, and 2015. Where the input units are extremely local (e.g., South Africa, which has 80,000 enumerator areas), a coarser administrative level is used as the basis of the estimation. Note that these projections are extrapolations from the last two observed census estimates and are not based on the more demographically sophisticated cohort-component method.
The newly modeled data sets include the Global Rural Urban Mapping Project (GRUMP) (http://beta.sedac.ciesin.columbia.edu/gpw/) and those of the Accessibility Model surface for Africa and Latin America (Nelson and Deichmann, 2004). GRUMP is designed to identify urban areas by coupling satellite data (from the nighttime lights data set; see below) with point settlement information (both population counts and geographic names and location) within administrative area boundaries. These urban area populations are themselves a key data product, providing a new method of dasymetric mapping. The Accessibility Models of population distribution also use GRUMP urban areas and roads to reallocate population within administrative areas. If these data are to be of use as baselines for the disaster response community, considerable investments—in detecting urban footprints, settlement points with associated populations, and road networks—will be required. Road networks, in particular, are known to be correlated with population density (Silva and Clarke, 2002), so the mapping of road networks can be an important, even if indirect, part of population estimation. Point data, road networks, dasymetric models, and remote sensing/or high-resolution imagery analysis have also been incorporated
into the LandScan program. Developments such as these based on both GPW and LandScan concepts lead to further improvements in the ability to improve subnational population estimates.
PROXY MEASURES OF POPULATION SIZE AND DISTRIBUTION
The increasing availability of remotely sensed imagery has led to investigations of the use of these data as proxy sources of population size and distribution, with the aim of improving population estimates and locations, especially for areas where little reliable information exists or at least is not available from other sources. Remotely sensed imagery has the advantage that it can be collected even for places where people otherwise cannot or will not venture on the ground. The promise of these data sources and analytical modes was recognized as early as the 1960s by Waldo Tobler, who used photographs from a Gemini NASA space mission as data from which to construct spatial models, eventually leading to the Global Demography Project, which in turn served as the inspiration for the GPW project, as noted above. Such proxy methods have proven useful for the macro spatial scale in which they are undertaken. They have proven less robust for meso- and micro-spatial scale assessments—the scale required for risk and vulnerability concerns—owing to questions of imagery resolution, costs, and the detail of ancillary information required to inform imagery analysis. Imagery-based methods can directly estimate population size reasonably well in a few (ideal) circumstances: high-resolution imagery can be used to identify housing units in an environment where reasonable housing density coefficients are known. However, imagery analysis is much more effective in identifying and monitoring the distribution of land occupation and use, which can then be used to make indirect estimates of population (Lo, 2006).
Fine to Coarse Scale
Fine-Tuned Resolution and Population Size
The basic principles of using airborne imagery to derive proxy estimates of population are straightforward and generally take one of two approaches: (1) obtain aerial photographs of a region, count the number of dwelling units, and multiply the number of households by an estimated number of people per household; and/or (2) determine the physical extent of human settlements and apply a coefficient that relates the size of the transformed environment to the number of people living there.
Fine-tuned spatial resolution and ancillary information are pivotal for such approaches as summarized by Jensen and Cowen (1999): selected
characteristics of populations may be extracted from remotely sensed data based on (1) counts of individual dwelling units, (2) measurement of urbanized land areas (settlement size), and (3) estimates of land cover/or land use as proxies for the existence and type of residential units as a proxy for population density. Accuracy increases with in situ data (typically census data) used to calibrate the average number of persons per dwelling and the number of homeless, seasonal, or migratory people, and with spatial resolution sufficient to identify individual structures and their uses (e.g., house, commercial building) despite tree cover. Jensen and Cowen (1999) report good results with U.S. data, but they suggest that the methods are too time-consuming and costly for a countrywide analysis. The use of remotely sensed and GIS data to reallocate population has not yet been widely validated by the demographic community and will eventually be required for successful streamlining of these types of modeled data.
Airborne imagery from fixed-wing aircraft is typically produced on an ad hoc basis by different parties for different purposes; these images do not provide a consistent or regular source of data with global coverage as do Earth observations. Much of the public access imagery is of relatively low resolution (large pixel size) such that it cannot fulfill the attributes identified by Jensen and Cowen (1999). Those space-based products that do possess sufficient resolution (1 meter and sub-1 meter), such as Ikonos and Quickbird, are relatively new (1999 and 2001, respectively) and expensive. These costs are amplified by the relatively small footprint (area observed), which requires multiple images to address even small regions such as a city. The multiple images also lead to processing and storage problems. One-meter panchromatic Controlled Image Base (CIB) imagery is used by ORNL as input to its LandScan product, and this provides the requisite resolution for population estimation but is not widely available to civilian agencies for population analysis. The CIB-controlled image base is a federal government resource that is derived from commercial imagery. It is geometrically corrected and in panchromatic (black and white) format, available in 1-, 5-, and 10-meter spatial resolution (sourcing may vary depending on resolution). It is for government use only, and although not classified, it is considered sensitive and cannot, for example, be taken out of the United States.
Attempts to simplify population estimates with Ikonos data by linking them to imagery texture have not yet proven fruitful (Liu et al., 2006), but the high-resolution satellite imagery has the same capability as a high-resolution aerial photograph to be used to count buildings and thus make estimates of total population size. This process may be capable of automation using sophisticated imagery classification software such as IDRISI from Clark Labs (Marsh Institute) at Clark University, ERDAS Imagine, and Definiens Professional (formerly known as eCognition).
Medium-Scale Resolution and population Size
The imagery data workhorse for much of the science and social science communities has been Landsat TM and ETM+ or SPOT 2 or 4, providing medium-scale resolution data (30 meter and 10 meter, respectively, for Landsat TM and ETM+). This scale of resolution proves problematic for estimating population size by the methods noted above because many, if not most, individual structures are missed (hidden in the pixel). However, the imagery can be used to define the urban extent of settlements and, through links to allometric growth principles, to estimate population size (Box 2.3).
Allometric growth and other models have been tested for cities in China (Lo, 1995)and the United States (Holt et al., 2004). The results suggest that the methods have quite a high level of accuracy in suburban areas, whereas the error increases in very dense high-rise cities. Allometric growth has not been tested for largely rural populations or for the dense occupation of cities in the developing world.
Alternatively, Landsat and SPOT imagery can be combined with other data to estimate population size. Various studies (Rashed et al., 2001, 2005; Weeks, 2004; Weeks et al., 2004,2005) found that good results could be obtained in Egypt using imagery that combined higher-resolution (in this case 5-meter panchromatic Indian Remote Sensing imagery) with medium-resolution 24-meter Indian Remote Sensing multispectral imagery. From this merged data set the studies were able to distinguish detailed differences among neighborhoods throughout the greater Cairo area. More detailed data within the dense core of Cairo were obtained by merging a 0.6-meter panchromatic and a 2.4-meter multispectral Quickbird images. Examples of the difference in spatial resolution in Cairo are provided in Figure 2.4.
|
BOX 2.3 Allometric Growth The “law of allometric growth” (Nordbeck, 1965) is an empirical relationship between simple urbanized built-up area classified from remotely sensed imagery and settlement population,posited as where r = radius of built-up area, a is constant of proportionality, p is population, and b is an empirically derived exponent. If a and b can be estimated, then p can be found by rearranging the formula: |
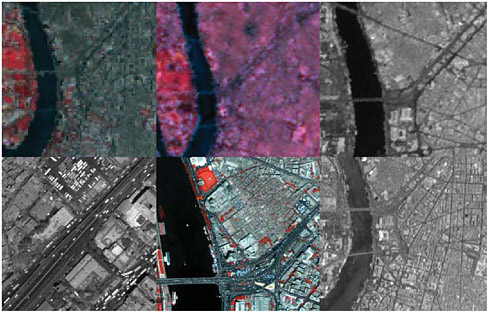
FIGURE 2.4 This series illustrates what can be observed from satellite imagery of different spatial and spectral resolutions. The images are centered on the bus station in Tahrir Square in central Cairo, Egypt. Clockwise from the upper left the imagery represents (a) Thematic Mapper 30-meter multispectral, (b) Indian Remote Sensing 24-meter multispectral, (c) SPOT 10-meter panchromatic, (d) Indian Remote Sensing 5-meter panchromatic, (e) Quickbird 2.4-meter multispectral, and (f) Quickbird 0.6-meter panchromatic. Map courtesy of John R. Weeks (San Diego State University).
Shifting to the United States, a comparative study in Dallas indicates that the U.S. Census Bureau’s TIGER system GIS road data proved better at estimating populations than land change data derived from Landsat imagery (Qui et al., 2003). In contrast, by adding texture, temperature, and spectral responses to Landsat ETM+ data, imagery analysis yielded a nearly 97 percent accurate estimate of Indianapolis (Li and Weng, 2005).
Note that most urban-related work using these sensors focuses on urban land cover as an estimate of the human settlement footprint. Indeed, the low spatial resolution of Landsat means that it is a poor choice even for deriving the outlines of population settlements. Although widely used, there are significant weaknesses in Landsat-derived “urban land cover” layers such as those provided by MDA Federal Inc. (formerly EarthSat) in its GeoCover-LC products. The areas within each classification tend to be underbounded, they are not verified on the ground, and they have high incidences of both false positives and false negatives. In essence, the relatively inexpensive—and thus widely available—moderate- and low-resolution
imagery has not proven very successful in population estimation. This task generally requires higher resolution imagery, either sensors mounted on low-altitude fixed-wing aircraft or satellites with high-resolution sensors. Both platforms are expensive and thus limit the ability to analyze wide swaths of land.
A new problem that has emerged with Landsat imagery is that new imagery is not apt to be available until at least 2012. Although the Landsat 5 satellite lasted far longer than NASA ever expected, Landsat 6 never flew, and Landsat 7 has been beset by sensor difficulties. Without additional support from federal funds, these national satellite programs will not meet the anticipated demands by the public; private satellite companies can offer good imagery, but this shifts the burden of cost from the federal government to the end user and thereby limits the availability of affordable imagery. In order to fill this gap, the University of California, Santa Barbara (UCSB) has created a new program in conjunction with Terra Image, Inc., which is a reseller of the French-based SPOT satellite imagery. The SPOT at UCSB program aims to offer SPOT imagery (which is similar to Landsat imagery) at a deep discount to academic researchers.
Imagery and Population Distribution
Despite the limitations noted above, imagery both at fine- and coarse-scale resolutions has been used successfully to identify and monitor the distribution of occupied landscapes. Major advances have been made in this domain, largely registered in land use and land cover change science as observed by Landsat and SPOT satellites and more recently by Moderate Resolution Imaging Spectroradiometer (MODIS) (Gutman et al., 2004; Lambin and Geist, 2006). This work does not focus on population distributions per se, as provided in nighttime light analysis, but rather on which lands and ecosystems have been modified and transformed by human occupancy and, to some extent, the kinds and intensity of that observed use. For example, “cryptic” deforestation from selective logging and forest regrowth from slash-and-burn cultivation and moving settlement frontiers can now be detected and added to the occupational uses of forests that also include clear cutting for agriculture, timber, or human settlement (Lambin and Ehrlich, 1997; Nepstad et al., 1999; Turner et al., 2004). Likewise, burning and grazing patterns in savanna and open woodlands can be used to determine not only where people are located, but changes in the intensity of livestock and cultivation activities, indicative of changing land pressures (Archer, 2004; Laris, 2002; Turner, 2003). Since these kinds of observations focus on rural lands at some distance from major urban settlement, imagery analysis offers a convenient means to “fill in” and track the presence of people and their activities in areas that often receive less attention from
those sources that derive population information by other means. A major caution is the need to discern land use and land cover changes by extractive industries, such as the international timber trade, which rely on itinerant and often small pools of labor, even though the observed footprint may be exceptionally large (Curran et al., 2004).
DMSP-OLS (Nighttime Lights)
As mentioned earlier in the chapter, nighttime lights, detected by the DMSP-OLS (Defense Meteorological Satellite Program-Operational Linescan System), represent the only system currently collecting low-light imaging data globally. The U.S. Air Force has operated imaging satellite sensors since the early 1970s. The current generation of OLS sensors has flown since 1976 with the primary goal of imaging clouds at night, and their ability to detect lights emitted from Earth’s surface was a serendipitous by-product of this original, and still important, purpose. A digital archive of the data was established at the National Geophysical Data Center (NGDC), part of the National Oceanographic and Atmospheric Administration (NOAA), in 1992 (Elvidge et al., 1997). The maps of the Earth at night produced from this data set have received global publicity, and the data themselves have been used as proxies for level of development, and population change, extent, and location (see, for example, Elvidge et al., 1997; Sutton, 1997; Doll et al., 2000; Sutton et al., 2001).
The basic characteristics of the data are as follows: 3,000-kilometer swath; 2.7-kilometer ground sample distance; two spectral bands (visible and thermal); nightly global coverage; flown since 1972; and flights continue until ~2012. Global coverage and temporal change detection capabilities are the strengths of these data. NGDC has produced a time series of annual cloud-free nighttime lights composites for various countries (Figure 2.5); the time series allows the detection of change.
Spatial resolution is the main weakness of OLS. With coarse spatial resolution, an overglow effect is created because OLS lights are larger than sources on the ground. Biases include the phenomenon that urban centers are typically saturated and lighted roadways, shopping centers and so forth, may indicate the existence of population when, in fact, few people live there (Figure 2.6). Sutton et al. (1997) found that the population density of urban centers was underestimated and the population density of suburbs was overestimated. Lighted area can be used as a good estimate of built-up area. However, the blooming or overglow effect—lighted area extending beyond the area of settlement—begs the question of using the areal measurement to calculate settlement footprints. A more thorough study using high-spatial-resolution imagery is required in order to determine the relationship between nighttime light footprints and actual settlement extent. Currently
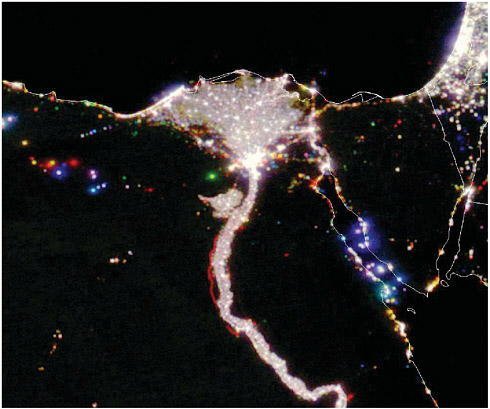
FIGURE 2.5 Time-series composite of the Nile Delta nighttime lights for the years 1992 (blue), 1998 (green), and 2003 (red). Note the different types of information that can be extracted from the images of Cairo (Figure 2.4) compared to this image. Image courtesy of Chris Elvidge (National Oceanic and Atmospheric Administration).
these data are not used in either GPW or LandScan products, but they are used in GRUMP.
At present, funding is still uncertain for the launch of a new NPOESS VIIRS (National Polar-orbiting Operational Environment Satellite System Visible Infrared Imager Radiometer Suite) satellite. It was set to launch in 2009, but a review by the House Science Committee in June 2006 put the funding in doubt. If launched, this will be a medium-resolution sensor with more quantization levels than OLS and spatial resolution sufficient to observe primary features found in cities and towns. Once operational, Elvidge (2006) has indicated that this improved sensor would be able to provide the following: (1) products depicting the geographic footprints of human settlements of all sizes, including the outline of developed areas, specific estimates or measures of constructed area, and vertical structures in urban
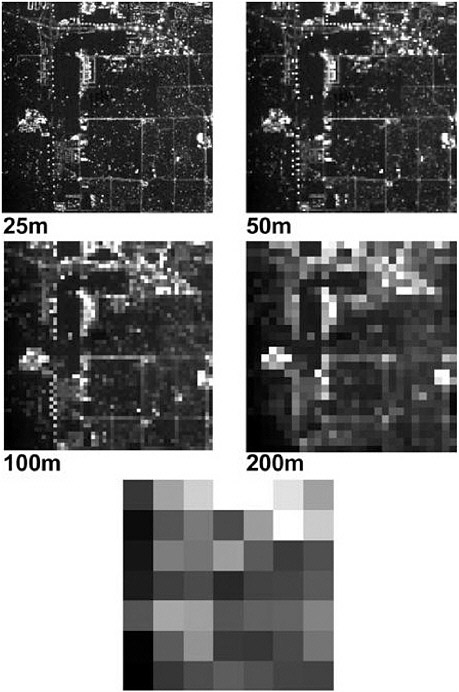
FIGURE 2.6 Simulation of 25-, 50-, 100-, 200-, and 742-meter (Visible Infrared Imager Radiometer Suite [VIIRS]) resolution nighttime lights imagery covering a portion of Las Vegas, Nevada, generated using a 1.5-meter resolution image. The images show the effect of spatial resolution on feature content in nighttime lights. Images courtesy of Chris Elvidge (National Oceanic and Atmospheric Administration).
cores; (2) the location and extent of sparse development in rural areas; (3) objective identification of intra-urban classes, such as classes of residential areas, commercial and industrial areas, and the distribution of vegetation types and open lands within urban areas; (4) vectors for streets and roads; and (5) measures of economic activity such as the extent and stability of the electric power grids.
Other Aerial Imagery
During and after an emergency, remotely sensed imagery from satellites or lower-altitude aircraft may be useful in estimating the number of people potentially affected by a crisis or disaster (Jensen and Hodgson, 2005). The use of imagery to assess damage in places such as Kosovo (as a result of conflict), Indonesia, Sri Lanka (as a result of the tsunami), and the U.S. Gulf Coast (as a of Hurricane Katrina) has been instructive and offers a way of assessing the geographic extent (and the degree of physical change of the landscape) of the affected areas so that the size of the population affected by an event may be determined. Additionally, oblique-angle aerial photography and digital videography used in response to Hurricane Katrina were successful for assessing damage.
Of course, repeated analyses of such places can offer estimates of the recovery of population in affected areas. Satellite imagery is constrained by its temporal resolution (how often it passes over a given place on Earth’s surface) and by the occurrence of cloud-free passes over that place. Virtually all of the satellite imagery used for population estimation purposes to date is optically sensed and thus requires cloud-free scenes to be used effectively. As a consequence, remote imagery in some emergency situations may have to be acquired by other fixed-wing aircraft that can fly under the cloud cover. With relatively modest training, these data can be analyzed by people on the ground to estimate damage to homes and infrastructure in the post-event period.
Radar imagery can be used to “see through” the clouds, but the use of radar data in population estimation has been extremely limited. In one of the few published studies using radar imagery for these kinds of purposes, Tatem et al. (2004) utilized Japanese Earth Resources Satellite-1 (JERS-1) synthetic aperture radar (SAR) imagery in combination with Landsat TM imagery to map settlements in Kenya. To be useful for population estimation purposes however, the radar data must be combined with multispectral imagery such as Landsat TM, along with ancillary data such as road networks.
Risk Indicators
The world’s populations are not evenly distributed, nor are the risks and hazards to which they are exposed. The World Bank produced a set
of maps (“Hotspots” maps) that spatially delimit the populations of the world (in total population counts) that are at risk from selected natural hazards (cyclones/or tornadoes, earthquakes, floods, drought, volcanoes, and landslides) (Dilley et al., 2005). These maps use GPW and the disaster impact data of CRED (both mentioned earlier in this chapter) to calculate disaster risk at the subnational level in order to contribute to development planning and disaster prevention. Some populations are at risk from more than one of these hazards, so their overall exposure to natural hazards is additive. While the spatial overlay of total population by multiple hazard sources helps to prioritize areas by exposure, a more important question is the extent to which these populations include vulnerable subpopulations that are more sensitive to a hazard and have less resilience to cope with an emergency, such as the young, the old, the sick, or the poor. This type of a vulnerability analysis requires the existence of subnational population attribute data and hazard data for each area of interest, whether at a county level (Cutter et al., 2006), city level (Pelling, 2003), or for a small island nation (Pelling and Uitto, 2002).
SUMMARY
We take for granted the assumption that better data will improve humanitarian relief efforts, although admittedly this is a difficult proposition to prove. All respondents to our study, including those involved directly with humanitarian and development aid projects, indicated that better georeferenced population census and survey data, and maps to which the data could be linked, were desired and preferred for planning and execution of these aid projects. Nonetheless, we do not have similarly situated emergencies, one with good data and one without, with all other conditions held constant, that would allow us to quantify the importance of good data. In particular, we are unable to specify how many lives or livelihoods would be saved if better data were available. Thus, we cannot readily weigh the costs and benefits of spending donor resources on better data, and better training of people to use and disseminate those data, compared to other uses of the same resources. The committee has thus chosen instead to consider the narrower question of how best to generate the subnational population estimates that relief agencies believe will be of assistance to them. Chapters 3 and 4 explore the question of coordination and training within and among various responders who might use these data, because good data alone will not guarantee an effective emergency response.
The chapter began with an overview of the data required to prepare estimates of populations at risk of being involved in emergency situations. Since it is impossible to know in advance what events people might confront, the estimates for planning purposes need to be spatially explicit and
sufficiently detailed in demographic terms so that they have broad applicability to a number of emergencies. Ideally, population registries would be universally accessible as sources of data at all geographic levels. In reality, censuses of population tend to be the best single source of data because they maximize the geographic coverage of populations and typically have enough detailed characteristics about each person in each household to permit the calculation of estimates of vulnerability. In theory, censuses are also ideal geographically because each household’s location had to be known to the statistical agency undertaking the census, so the characteristics of people should be capable of being spatially identified with considerable precision. In practice, the exact location may not be recorded and so is lost immediately after the data are collected; even if the location is known, it may not be converted to a digital format that can be mapped easily. The committee concludes, therefore, that in much of the world the real issue is not the collection of data per se, but rather what happens to the data after being collected. Census and other data about households and individuals need to be georeferenced (with proper privacy safeguards), linked to accurate maps, and then analyzed by individuals with the appropriate training to undertake tasks.
A major shortcoming of census data (and most population registers as well) is that they are universally collected at places of residence, yet people are often at risk outside of their home. There is no simple answer to this dilemma of estimating the “daytime” populations (assuming that being away from homes is essentially a daytime activity), but modeling based on the results of survey data about out-of-home activities is the most common approach.
Most other problems in creating estimates of the population at risk are related to the fact that censuses are not conducted everywhere on a regular basis, and even where they are conducted, the national statistical agency may not have the resources to provide data at a local level, to prepare local-level maps coinciding with the census geography. To work around some of these issues, global population databases such as LandScan and GPW were developed to create population “surfaces” for the globe, but at the moment they lack the breadth of demographic characteristics that would allow users to create estimates of vulnerability beyond population counts and density in a given area.
Much of this chapter has examined what can be done when the ideal census data and corresponding maps are not available, recognizing that this is largely an issue for data-poor countries, which tend to have limited resources for training of personnel and collection of data. Proxy measures should not be preferably established over collection of census data and associated maps. The most important kinds of data that might be used in the absence of recent detailed census data include sample survey data, such as those collected in
the DHS and MICS, as well as information derived from remotely sensed imagery. These kinds of proxy measures have tremendous potential to augment our knowledge of subnational populations, but they require the use of fairly sophisticated modeling techniques if they are to be employed in population estimation for at-risk groups, since they were not designed for that mission. Uncertainty is a component in any population estimate, but these proxy measures have less certainty associated with them than census-based estimates, and researchers must utilize the techniques that are emerging to evaluate error in these statistically unconventional models. While it is generally true that any data are better than no data in an emergency situation, the best decisions are those made with the best data or, at the very least, with the best understanding of the limitations of available data.
Overall, it seems doubtful that one approach to estimating populations at risk will fit all situations. The reality is that countries have different kinds of data available, different populations in diverse geographic locations, and different probabilities of needing to have data available. The committee has tried to provide a road map for estimating populations at risk given the kinds of data that are currently used for that purpose. This is, however, an evolving area of policy research, and it is imperative that we learn from each new emergency or disaster situation what is needed and how it is used, so that meeting these data needs in future disasters becomes a high priority for governments and emergency responders.
RECOMMENDATIONS
The preceding discussion provides the basis for the following committee recommendations:
-
Improve the capacity of census-poor countries, through training and technical assistance programs, to undertake censuses. Such improvement is critical for the long-term availability of subnational data that can assist in humanitarian emergency and development situations. Knowing the location, number, and critical characteristics of populations is pivotal to all planning, response, and long-term understanding of disasters. These data sets should have pre-existing protocols for data format, sharing, mapping, intercensal projections, and metadata that are consistent with international standards. [Report Recommendation 1]
-
Support should be given to test the accuracy of estimates of size and distribution of populations based on remotely sensed imagery, particularly in rural and urban areas of countries with spatially, demographically, and temporally inadequate census data. Current
-
efforts to render global spatial population estimation—LandScan and Gridded Population of the World—use different methodologies. An independent study of the state of the art in spatial population estimation would highlight the strengths and weaknesses of the existing methods and could serve as a guide for improvements in the methods and development of new ones for the purposes of understanding populations at risk. [Report Recommendation 8]
REFERENCES
Abowd, J.M., and J. Lane, 2004. New approaches to confidentiality protection: Synthetic data, remote access and research data centers. In J. Domingo-Ferrer and V. Torra (eds.), Lecture Notes in Computer Science. Berlin: Springer, pp. 282-289.
ADPC (Asian Disaster Preparedness Center), 2006. Community Based Disaster Risk Management 2006. Available online at http://www.sheltercentre.org/shelterlibrary/items/pdf/ADPCCriticalGuidelines.pdf [accessed October 3, 2006].
Archer, E.R.M., 2004. Beyond the “climate versus grazing” impasse: Using remote sensing to investigate the effects of grazing system choice on vegetation cover in eastern Karoo. Journal of Arid Environments 57(3):381-408.
Balk D., F. Pozzi, G. Yetman, U. Deichmann, and A. Nelson, 2005a. The distribution of people and the dimension of place: Methodologies to improve the global estimation of urban extents. The International Society for Photogrammetry and Remote Sensing Proceedings of the Urban Remote Sensing Conference, Tempe, Arizona, March.
Balk, D., Y. Gorokhovich, and M. Levy, 2005b. Estimates of Coastal Population Exposed to the 26 December 2004 Tsunami, Note prepared for the Humanitarian Information Unit of the U.S. Department of State, January 7; available online at http://www.ciesin.columbia.edu/tsunami2004.html (and presented at the Columbia University School of International and Public Affairs, Tectonics, Politics and Ethics: The Tsunami and Its Aftermath, March 2005).
Balk, D.L., U. Deichmann, G. Yetman, F. Pozzi, S.I. Hay, and A. Nelson, 2006. Determining global population distribution: Methods, applications and data. Advances in Parasitology 62(April):119-156.
Bilsborrow, R., 2006. University of North Carolina; presentation to the committee on April 20 at the National Academies Keck Center, Washington, D.C. Presentation available through the National Academies Public Access Records Office.
Brown, V., D. Coulombie, F. Belanger, G. Jacquier, S. Balandine, and D. Legros, 2001. Rapid assessment of population size by area sampling in disaster situations. Disasters 25:164-171.
CIESIN (Center for International Earth Science Information Network), Columbia University; International Food Policy Research Institute (IFPRI), the World Bank; and Centro Internacional de Agricultura Tropical (CIAT), 2004. Global Rural-Urban Mapping Project (GRUMP). Available online at http://sedac.ciesin.columbia.edu/gpw/.
Champion, T., and G. Hugo, 2004. New Forms of Urbanization: Beyond the Urban-Rural Dichotomy. London: Ashgate Publishing Limited, 444 pp.
Christakos, G., R.A. Olea, M.L. Serre, H. Yu, and L. Wang, 2005. Interdisciplinary Public Health Reasoning and Epidemic Modeling: The Case of Black Death. New York: Springer, 319 pp.
Coale, A., and P. Demeny, 1983. Regional Model Life Tables and Stable Populations. New York: Academic Press, 496 pp.
Curran, L.M., S.N. Trigg, A.K. McDonald, D. Astiani, Y.M. Hardiono, P. Siregar, I. Caniago, and E. Kasischke, 2004. Lowland forest loss in protected areas on Indonesian Borneo. Science 303(5660):1000-1003.
Cutter, S.L., 2005. The Geography of Social Vulnerability: Race, Class, and Catastrophe, Social Science Research Council, Understanding Katrina: Perspectives from the Social Sciences. Available online at http://understandingkatrina.ssrc.org/Cutter/ [accessed October 3, 2006].
Cutter, S.L., and C.T. Emrich, 2006. Moral hazard, social catastrophe: The changing face of vulnerability along the hurricane coasts. Annals of the American Academy of Political and Social Science 604:102-112.
Cutter, S.L., C.T. Emrich, J.T. Mitchell, B.J. Boruff, M. Gall, M.C. Schmidtlein, C.G. Burton, and G. Melton, 2006. The long road home: Race, class, and recovery from Hurricane Katrina. Environment 48(2):8-20.
de Sherbinin, A., D. Balk, K. Yager, M. Jaiteh, F. Pozzi, C. Giri, and A. Wannebo, 2002. Social Science Applications of Remote Sensing, A CIESIN Thematic Guide. Palisades, New York: Center for International Earth Science Information Network of Columbia University.
Dilley, M., R.S. Chen, U. Deichmann, A.L. Lerner-Lam, and M. Arnold, 2005. Natural Disaster Hotspots: A Global Risk Analysis. Washington, D.C.: The World Bank, 145 pp.
Dobson, J.E., 2007. In harm’s way: Estimating populations at risk. In National Research Council, Tools and Methods for Estimating Populations at Risk from Natural Disasters and Complex Humanitarian Crises. Washington, D.C.: The National Academies Press.
Dobson, J.E., E.A. Bright, P.R. Coleman, and B.L. Bhaduri, 2003. LandScan2000: A new global population geography. In V. Mesev (ed.), Remotely Sensed Cities. London: Taylor & Francis, pp. 267-279.
Doll, C., J. Muller, and C.D. Elvidge, 2000. Night-time imagery as a tool for global mapping of socioeconomic parameters and greenhouse gas emissions. Royal Swedish Academy of Sciences 29:157-162.
Doocy, S., 2007. Identify ways in which subnational demographic and geographic data and tools could be used to help decision makers provide useful information to populations at risk. In National Research Council, Tools and Methods for Estimating Populations at Risk from Natural Disasters and Complex Humanitarian Crises. Washington, D.C.: The National Academies Press.
Elbers, C., J.O. Lanjouw, and P. Lanjouw, 2003. Micro-level estimation of poverty and inequality. Econometrica 71(1):355-364.
Elvidge, C., 2006. NOAA; presentation to the committee at a workshop held on March 13-14 at the National Academies Keck Center, Washington, D.C. Presentation available through the National Academies Public Access Records Office.
Elvidge, C.D., K.E. Baugh, E.A. Kihn, H.W. Kroehl, and E.R. Davis, 1997. Mapping city lights with nighttime data from the DMSP Operational Linescan System. Photogrammetric Engineering and Remote Sensing 63:727-734.
Elvidge, C.D., P. Cinzano, D.R. Pettie, J. Arvesen, P. Sutton, R. Nemani, T. Longcore, C. Rich, J. Safran, J.R. Weeks, and S. Ebener. 2007. The Nightsat mission concept. International Journal of Remote Sensing, in press.
Gutman, G., A. Janetos, C. Justice, E. Moran, J. Mustard, R. Rindfuss, D. Skole, B.L. Turner, and M.A. Cochrane (eds.), 2004. Land Change Science: Observing, Monitoring, and Understanding Trajectories of Change on the Earth’s Surface. New York: Kluwer Academic, 461 pp.
Hay, S.I., A.M. Noor, A. Nelson, and A.J. Tatem, 2005. The accuracy of human population maps for public health application. Tropical Medicine & International Health 10:1073.
Hentschel, J., J.O. Lanjouw, P. Lanjouw, and J. Poggi, 1998. Combining census and survey data to study spatial dimensions of poverty and inequality. World Bank Economic Review, Policy Research Working Paper, 1928 31 pp.
Holt, J.B., C.P. Lo, and T.W. Hodler, 2004. Dasymetric estimation of population density and areal interpolation of census data. Cartography and Geographic Information Science 31:103-121.
INDEPTH Network, 2004. INDEPTH Model Life Tables for Sub-Saharan Africa. Aldershot, UK: Ashgate Publishing Company, 36 pp.
Jensen, J.R., and D.C. Cowen, 1999. Remote sensing of urban/suburban infrastructure andsocioeconomic attributes. Photogrammetric Engineering and Remote Sensing 65:611-624.
Jensen, J.R., and M.E. Hodgson, 2005. Remote sensing of natural and man-made hazards and disasters. In M.K. Ridd and J.D. Hipple (eds.), Manual of Remote Sensing: Settlements. Bethesda, Md.: American Society for Photogrammetry and Remote Sensing, pp. 401-429.
Kintner, H.J., T.W. Merrick, P.A. Morrison, and P.R. Voss (eds.), 1994. Demographics: A Casebook for Business and Government. Boulder, Co: Westview Press, 340 pp.
Lalasz, R., 2006. In the News: The Nigerian Census. Population Reference Bureau. Available online at http://www.prb.org/Template.cfm?Section=PRB&template=/Content/ContentGroups/06_Articles/In_the_News__The_Nigerian_Census.htm [accessed March 19, 2007].
Lambin, E.F., and D.F. Ehrlich, 1997. Land-cover changes in sub-Saharan Africa, 1982-1991: Application of a change index based on remotely sensed surface temperature and vegetation indices at a continental scale. Remote Sensing and the Environment 61(2):181-200.
Lambin, E.F., and H.J. Geist (eds.), 2006. Land-Use and Land-Cover Change: Local Processes and Global Impacts. New York: Springer-Verlag, 222 pp.
Landau, L.B., 2007. Cognitive and institutional limits on collecting and processing data on populations at risk: Preliminary reflections on Southern African responses to displacement. In National Research Council, Tools and Methods for Estimating Populations at Risk from Natural Disasters and Complex Humanitarian Crises. Washington, D.C.: The National Academies Press.
Laris, P., 2002. Burning the seasonal mosaic: Preventing burning strategies in the wooded savanna of southern Mali. Human Ecology 30(2):155-186.
Lauber, W.G., 2007. Political geography and emergency Relief. In National Research Council, Tools and Methods for Estimating Populations at Risk from Natural Disasters and Complex Humanitarian Crises. Washington, D.C.: The National Academies Press.
Li, G.Y., and Q.H. Weng, 2005. Using Landsat ETM plus imagery to measure population density Indianapolis, Indiana, USA. Photogrammetric Engineering and Remote Sensing 71:947-958.
Liu, X., K.C. Clarke, and M. Herold, 2006. Population density and image texture: A comparison study. Photogrammetric Engineering and Remote Sensing 72:187-196.
Lo, C.P., 1995. Automated population and dwelling unit estimation from high-resolution satellite images: A GIS approach. International Journal of Remote Sensing 16:17-34.
———, 2006. Estimating population and census data. In M.K. Ridd and J. Hipple (eds.), Remote Sensing of Human Settlements. Bethesda, Md.: American Society for Photogrammetry and Remote Sensing, p. 835.
Lunneborg, C.E., 2000. Data Analysis by Resampling: Concepts and Applications. Belmont, Calif.: Duxbury Press.
Lutz, W., W.C. Sanderson, and S. Scherbov, 2004. The End of World Population Growth in the 21st Century: New Challenges for Human Capital Formation and Sustainable Development. London: Earthscan.
Menken, J., A.K. Blanc, and C. Lloyd, 2002. Training and Support of Developing Country Population Scientists: A Panel Report. New York: Population Council.
Mennis, J., 2002. Using geographic information systems to create and analyze statistical surfaces of population and risk for environmental justice analysis. Social Science Quarterly 83:281-297.
———, 2003. Generating surface models of population using dasymetric mapping. Professional Geographer 55:31-42.
Montana, L., 2006. ORC Macro; presentation to the committee at a workshop held on March 13-14 the National Academies Keck Center, Washington, D.C. Presentation available through the National Academies Public Access Records Office.
Mooney, C.Z., 1997. Monte Carlo Simulation. Beverly Hills, Calif.: Sage Publications.
NRC (National Research Council), 2001. Forced Migration and Mortality. Washington, D.C.: National Academy Press, 145 pp.
NRC, 2003. Cities Transformed: Demographic Change and Its Implications in the Developing World. Washington, D.C: The National Academies Press.
Nelson, A., and U. Deichmann, 2004. The African Population Database, Version 4. United Nations Environment Program (UNEP) and the Center for International Earth Science Information Network (CIESIN), Columbia University. Available online at http://www.na.unep.net/datasets/datalist.php3 [accessed December 2006].
Nepstad, D.A., A. Veríssimo, A. Alencar, C. Nobre, E. Lima, et al., 1999. Large-scale impoverishment of Amazonian forests by logging and fire. Nature 398:505-508.
Nigeria National Population Commission and ORC Macro, 2004. Nigeria Demographic and Health Survey 2003. Calverton, Md.: ORC Macro.
Noji, E.K., 2005. Estimating population size in emergencies. Bulletin of the World Health Organization 83:164.
Nordbeck, S., 1965. The law of allometric growth. Michigan Inter-University Community of Mathematical Geographers, Discussion Paper 7.
Okolo, A., 1999. The Nigerian census: Problems and prospects. American Statistician 53: 321-325.
Openshaw, S., and L. Rao, 1995. Algorithms for reengineering 1991 Census geography. Environment and Planning A 27:425-446.
Pastor, M., R.D. Bullard, J.K. Boyce, A. Fothergill, R. Morello-Frosch, and B. Wright, 2006. In the Wake of the Storm: Environment, Disaster, and Race After Katrina. New York: Russell Sage Foundation.
Pelling, M., 2003. The vulnerability of cities. In Natural Disasters and Social Relience. London: Earthscan.
Pelling, M., and J. Uitto, 2002. Small island developing states: Natural disaster vulnerability and global change. Environmental Hazards 3:49-62.
Peru Instituto Nacional de Estadística e Informática, 2005. Censos Nacionales 2005: X de Poblacion y V de Vivienda, Plan Directriz 2005. Available online at http://www.inei.gob. pe/cpv2005/archivos/Plan%20Directriz.pdf [accessed October 3, 2006].
Plane, D., and P. Rogerson, 1994. The Geographical Analysis of Population: With Applications to Planning and Business. New York: John Wiley & Sons.
Qui, F., K.L. Woller, and R. Briggs, 2003. Modeling urban population growth from remotely sensed imagery and TIGER GIS road data. Photogrammetric Engineering and Remote Sensing 69:1031-1042.
Rashed, T., J.R. Weeks, M.S. Gadalla, and A.G. Hill, 2001. Revealing the anatomy of cities through spectral mixture analysis of multispectral imagery: A case study of the Greater Cairo Region, Egypt. Geocarto International 16:5-16.
Rashed, T., J.R. Weeks, D.A. Stow, and D. Fugate, 2005. Measuring temporal compositions of urban morphology through spectral mixture analysis: Toward a soft approach to change analysis in crowded cities. International Journal of Remote Sensing 26:699-718.
Rodriguez, H., R. Saenz, and C. Menjivar (eds.), 2007. Latino/as in the United States: Changing the Face of América. New York: Springer.
Shankar, M., C. Liu, and B.L. Bhaduri, 2005. From static to dynamic models: Enabling real-time geocomputation infrastructures. GeoComputation Conference. Available online at http://igre.emich.edu/geocomputation2005/abstract_list/0600085.pdf. [accessed October 2006].
Siegel, J.S., and D.A. Swanson, 2004. The Methods and Materials of Demography, 2nd edition. San Diego: Elsevier Academic Press.
Silva, E.A., and K.C. Clarke, 2002. Calibration of the SLEUTH urban growth model for Lisbon and Porto, Portugal. Computers, Environment and Urban Systems 26:525-552.
Smith, S., J. Tayman, and D. Swanson, 2001. Population Projections for States and Local Areas: Methodology and Analysis. New York: Plenum Press.
Sutton, P., 1997. Modeling population density with night-time satellite imagery and GIS. Computing, Environment and Urban Systems 21:227-244.
Sutton, P., D. Roberts, C. Elvidge, and H. Meij, 1997. A comparison of nighttime satellite imagery and population density for the continental United States. Photogrammetric Engineering and Remote Sensing 63:1303-1313.
Sutton, P., D. Roberts, C. Elvidge, and K. Baugh, 2001. Census from heaven: An estimate of the global human population using night-time satellite imagery. International Journal of Remote Sensing 22:3061-3076.
Tatem, A., A.M. Noor, and S.I. Hay, 2004. Defining approaches to settlement mapping for public health management in Kenya using medium spatial resolution satellite imagery. Remote Sensing of Environment 93:42-52.
Tobler, W., 1992. Preliminary representation of world population by spherical harmonics. Proceedings of the National Academy of Sciences 89:6262-6284.
Tobler, W., U. Deichmann, J. Gottsegen, and K. Maloy, 1995. The Global Demography Project. Technical Report No. 95-6. National Center for Geographic Information and Analysis. University of California, Santa Barbara.
———, 1997. World Population in a Grid of Spherical Quadrilaterals. International Journal of Population Geography 3:203-225.
Turner, B.L., II, J.G. Geoghegan, and D.R. Foster (eds.), 2004. Integrated Land-Change Science and Tropical Deforestation in the Southern Yucatán: Final Frontiers. Oxford, UK: Oxford University Press.
Turner, M., 2003. Methodological reflections on the use of remote sensing and geographic information science in human ecological research. Human Ecology 31 (2):255-279.
UNISDR (United Nations International Strategy for Disaster Reduction), 2005. Hyogo Framework for Action 2005-2015: Building the Resilience of Nations and Communities to Disasters (World Conference on Disaster Reduction).
UNPD (United Nations Population Division), 2005. World Population Prospects, the 2004 Revision. New York: United Nations.
UNSD (United Nations Statistics Division), 2005. Population and Housing Censuses; Census Dates for all Countries 2005 Available online at http://unstats.un.org/unsd/demographic/sources/census/censusdates.htm [accessed September 2006].
Weeks, J.R., 2004. Using remote sensing and geographic information systems to identify the underlying properties of urban environments. In New Forms of Urbanization: Conceptualizing and Measuring Human Settlement in the Twenty-First Century, A.G. Champion and G. Hugo (eds.). London: Ashgate Publishing Limited.
———, 2005. Population: An Introduction to Concepts and Issues, 9th edition. Belmont, Calif.: Wadsworth Thomson Learning.
Weeks, J.R., M.S. Gadalla, T. Rashed, J. Stanforth, and A.G. Hill, 2000. Spatial variability in fertility in menoufia, Egypt, assessed through the application of remote sensing and GIS technologies. Environment and Planning A 32:695-714.
Weeks, J.R., A. Getis, A.G. Hill, M.S. Gadalla, and T. Rashed, 2004. The fertility transition in Egypt: Intra-urban patterns in Cairo. Annals of the Association of American Geographers 94:74-93.
Weeks, J.R., D. Larson, and D. Fugate, 2005. Patterns of urban land use as assessed by satellite imagery: An application to Cairo, Egypt. In B. Entwisle and P.C. Stern (eds.), Population, Land Use, and Environment: Research Directions. Washington, D.C.: The National Academies Press, pp. 265-286.


