
3
Data Dissonance in Disasters
Demographic data are some of the most common data collected worldwide. The collection of demographic data, however, does not guarantee their availability before, during, or after disasters. More importantly, such data are generally not sufficient to assist the affected population. New crises need new data analyses. People who are responding to disasters complain that they are often operating in a data vacuum. These complaints vary in levels of frustration, but they are heard with respect to every kind of disaster and in all countries, whether rich or poor. Without appropriate demographic data, responders have difficulty setting short-term priorities, allocating scarce resources efficiently, or establishing strategic plans for longer-term recovery efforts. This chapter addresses the dissonance created by the existence of detailed local demographic data and the data vacuum that appears in the midst of most disasters.
This dissonance is illustrated through examples from three types of natural disasters (earthquakes, hurricanes, and tsunamis) in four different parts of the world (Turkey, Pakistan, India, and the United States) with affected populations in urban and rural settings. Although the examples are all natural disasters, the observations made from examination of the four case studies can also apply to populations-at-risk data in any setting.
This chapter discusses some of the important reasons why the existing data are underutilized by decision makers and, most significantly, how existing local area data would have to change to become more useful to decision makers who provide humanitarian assistance. The chapter also places the data dissonance in the context of broader information management, training, and technology considerations. Decreasing the dissonance
in the underutilization of existing data requires better organization and management of the data and does not necessarily invoke significant additional direct costs. The difficulties in effecting better organization stem from a number of causes, both internal and external to the organization. These difficulties in obtaining and using data within existing organizational structures are highlighted in this chapter and discussed in detail in Chapter 4.
THE LOCAL CONTEXT
The examples presented in this chapter span diverse natural disaster settings and demonstrate that disasters can strike both rich and poor countries in a variety of inland and coastline terrains and can occur either instantaneously (sudden onset) or with ample notice. These disasters represent recent events for which the pre-impact planning and data were judged to be better than most and the committee had some knowledge based on the members’ own field work in affected areas. The common theme is that in all four scenarios, the existing population and spatial data were underutilized, making the disaster response less effective and ultimately worsening the plight of victims.
The Izmit, Turkey Earthquake, 1999
Turkey is in a seismically active region affected by the northward collision of the Arabian plate with the Eurasian plate along the Anatolian fault system, which is more than 900 kilometers long (Figure 3.1). Eight major earthquakes have occurred along this fault during the past century resulting in more than 88,000 fatalities (CRED, 2006). On August 17, 1999, a 7.4 magnitude earthquake, the latest in this earthquake series, struck the Marmara region southeast of Istanbul (Figure 3.1) and resulted in more than 17,000 fatalities and more than half a million people left homeless (Scawthorn, 2000).
Turkey is a middle-income country with a per-capita income of $7,680 in 2005 (PRB, 2005). At the time of the earthquake, Turkey’s population was approximately 73 million. Although the most recent population census had been taken in 1990, a housing census was taken as recently as 1997, two years prior to the Marmara earthquake. The next population census was not scheduled until 2000.
In the immediate period after the earthquake struck, geospatial data and technologies were employed, and the resulting images and maps were made available to responders, and more generally, on the Internet. For example, Landsat 5 images of the devastated area were widely available two days after the earthquake, and the U.S. Department of State also produced five maps using high-resolution satellite images for in-country
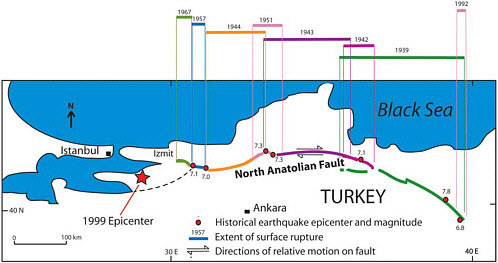
FIGURE 3.1 Location of major earthquakes in Turkey along the North Anatolian Fault prior to the 1999 Izmit earthquake. SOURCE: Adapted from USGS, http://quake.wr.usgs.gov/research/geology/turkey/images/turkey_loc.gif.
use. However, the maps and images were not combined with existing demographic data for the country and thus did not contain any information on the plight of the residents affected by the earthquake or relevant, local planimetric data such as street names; for the city of Adapazari, near the epicenter, the only local street map available to responders was a tourist map. Five weeks after the earthquake, no detailed disaster assessments were available when a joint Turkey-U.S. team went into the field (Eguchi et al., 2000a,b). At that time, physical damage assessments were made on the ground using geographic positioning and geographic information systems (GIS, including global positioning systems [GPS] data); although a delayed input to the recovery situation, these technologies made it possible to do in hours what used to take days to do. The new data were able to provide information about what roads were open and closed and the extent of the collapse of densely populated buildings; this kind of information was used to make some estimates of the number of people who had been affected by the event.
The fact that the epicenter was located near Istanbul, which was not extensively damaged, facilitated accessibility to the area and thus made the relief efforts more effective than they might otherwise have been, given the lack of correspondence between remotely sensed satellite images and maps, local planimetric data, and national and subnational population data. The proximity of the Marmara earthquake to Istanbul also encouraged authorities in Turkey to develop better emergency preparedness plans for the city, which is responsible for 60 percent of Turkey’s gross national product and is home to 12 million people. Plans are currently under way to engage the public in disaster mitigation and preparedness and to invoke GIS and GPS technology and existing population data for this purpose (Ulgen, 2006). For the rest of the nation, however, population data are not available at subnational levels such as a city block or similar enumeration level. While personal locators and handheld GPS devices, or potentially, cell phones, for individual responders or the general public may be part of the future in some countries or specific communities, current technologies and population survey methods are still challenged by the issue of collecting demographic data when people are forced to migrate in response to a disaster. This issue is also explored in the section below on Hurricane Katrina and has been the topic of an earlier National Research Council report (NRC, 2001).
South Asian (Kashmiri) Earthquake, 2005
The South Asian earthquake (also referred to as the Kashmir or Pakistan earthquake) of 2005 occurred in an inaccessible part of one of the poorest countries in the world (Figure 3.2). The epicenter of the 7.6
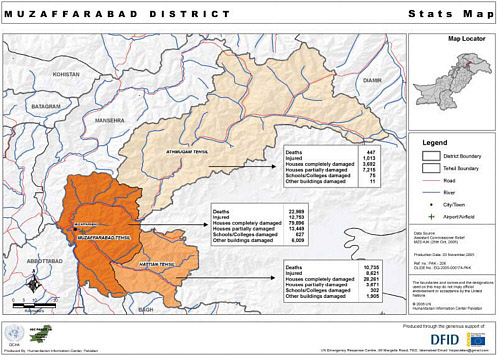
FIGURE 3.2 Status map of affected population and infrastructure on November 3, 2005. SOURCE: OCHA Humanitarian Information Centre Pakistan (HICP) and available on Relief Web, http://www.reliefweb.int/rw/RWB.NSF/db900LargeMaps/JOPA-6J5D2H?OpenDocument&emid=EQ-2005-000174-PAK&rc=3/.
magnitude earthquake was near Muzaffarabad. The earthquake resulted in an estimated 90,000 deaths and more than 80,000 injuries. Approximately 3 million people were made homeless, and about 575 health facilities were partially or fully damaged (Durrani et al., 2005). The location of the event in the disputed territory of Kashmir, now controlled by Pakistan, and the timing of the October 8, 2005, event just before the onset of winter in the Himalayas, were significant factors in rescue, relief, and recovery efforts. These circumstances exacerbated the demographic and geospatial data dissonance that occurred at the time of the crisis. Pakistan has a population of 165 million, which is 66 percent rural. Its gross domestic product per capita is less than one-third that of Turkey (CIA, 2007). Pakistan’s most recent census had been taken in March 1998.
Extensive mapping of the communities affected by the Kashmir earthquake was undertaken by a number of agencies and organizations. The maps provided detailed information, satellite imagery, and radar data showing the changing landscape as a result of the earthquake and massive landslides and the damage to buildings, roads, bridges, and other infrastructure. For example, the U.S. Geological Survey (USGS; http://earthquake.usgs.gov/eqcenter/eqinthenews/2005/usdyae/), the Earthquake Engineering Research Institute (EERI; http://www.eeri.org/lfe/clearinghouse/kashmir/observ1.php), the Centre for the Observation and Modeling of Earthquakes and Tectonics (COMET; http://comet.nerc.ac.uk/news_kashmir.html), and the Mid-America Earthquake (MAE) Center (http://mae.ce.uiuc.edu/Publications/cdseries/Cd%20series%20files/05-04/Report05-04.pdf), among many others, collected, analyzed, and distributed a significant amount of data, generated maps, and have made accessible a number of reports focusing on the physical impact of the earthquake (Figure 3.2).
In some of the most severely affected regions, more than 95 percent of the buildings were destroyed, while lifelines (water, electricity) and the communication infrastructure were essentially rendered useless. The magnitude and extent of the Kashmir earthquake encouraged significant local and international response to this disaster. Initially, disaster relief aid was extremely slow to reach disaster victims, particularly in the most affected regions (e.g., Muzaffarabad, Balakot) and in remote mountain villages. A number of these remote communities were inaccessible for weeks after the earthquake and remained cut off from relief supplies even by helicopter or airplane. The rough terrain and the severity of the disaster combined with the lack of adequate disaster planning and response initiatives at the local level to hinder disaster relief strategies in the initial days following the event.
As is typical following a disaster of such proportions, a massive convergence of materials and supplies from international sources resulted in an excessive amount of goods. This aid did not reflect the immediate needs of
the local population, was not responsive to local norms and circumstances, and was not delivered to the places most in need. The fact that the census information was dated made its use problematic; the census data had not been supplemented by newer sources of information that might have been derived from household surveys or a Demographic and Health Survey (DHS), nor were the census data available in electronic form for responders. The distribution of disaster relief aid following the Pakistan earthquake was more a function of who was at the right place at the right time, than of any systematic assessment and placement of vehicles for distribution of the necessary aid (Bilsborrow, 2006). Information on the affected population, including people’s demographic and economic characteristics, and their locations—data that should be available from a prior census or household survey—was difficult to obtain and thus could not be utilized in a meaningful way in the distribution of disaster relief aid or other humanitarian assistance once data from the post-earthquake community mapping initiatives were available.
South Asian Tsunami, 2004
The South Asian tsunami was produced by a large, undersea 9.0 magnitude earthquake near the Andaman Islands on December 26, 2004. Within 15 minutes, the large wave began affecting the Thai and Indonesian coasts and radiated eastward from the epicenter. A short time thereafter, it began to impact other countries bordering the Indian Ocean to the north and west including Sri Lanka and India. Seven hours after the earthquake, the resulting tsunami had traveled across the Indian Ocean to Somalia (Figure 3.3). The human death toll remains uncertain years later, but official estimates suggest that approximately 250,000 perished (UNEP, 2006) and millions of people were displaced from their homes and livelihoods. Overall damage to the region was estimated at $10 billion (UNEP, 2006).
Indonesia, India, and Sri Lanka suffered the highest fatalities. All three countries had taken population and housing censuses every 10 years since 1961, except Sri Lanka, which had a 20-year lapse from 1981 to 2001. Indonesia had a census in 2000, and India and Sri Lanka both had censuses in 2001. Therefore, up-to-date, local area demographic data were available in these countries when the tsunami struck. In India, the national statistical office (NSO) had also digitized population maps based on the last census. This information existed in the NSO and the state government offices of Tamil Nadu. The data, however, were not available to the first, second, and third responders to the disaster at the local level (Subramanian, 2006). Considerable aerial photography was collected of affected areas (Figure 3.4), but few ancillary data were available to responders on the number of
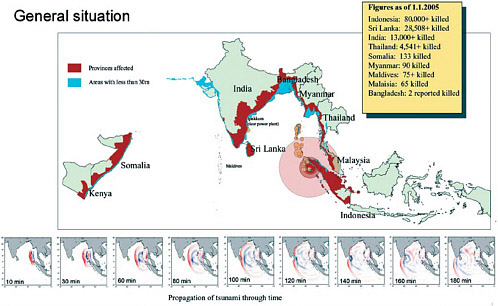
FIGURE 3.3 Impact area of the 2004 South Asian tsunami. SOURCE: International Coordination Group for the Tsunami Warning System in the Pacific (http://ioc3.unesco.org/itic/). Image available at http://www.unep.org/tsunami/images/ image001.png.
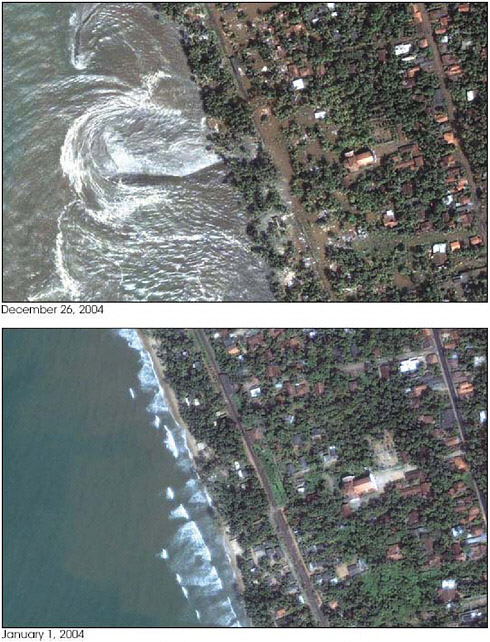
FIGURE 3.4 The top satellite picture of Kalutara, Sri Lanka, was taken about an hour after the first tsunami wave hit on December 26, 2004. Water is rushing back out to sea after inundating the land. The lower picture shows what the same area looks like under standard daily conditions. SOURCE: Courtesy of Windows to the Universe, http://www.windows.ucar.edu. Image available at http://www.windows.ucar.edu/earth/images/tsunami_NASA_ EO_sm.jpg, 324 × 426 pixels- 160k, image may be scaled down and subject to copyright.
people likely to have been in the area at the time, including both residents and tourists.
While other data sources, such as administrative records, vital statistics, or perhaps tax records, could have been used, these data were largely unavailable for local coastal villages, so information about the pre-disaster population was in many cases derived from interviews with survivors. Lacking digitized census maps to determine how many people had been affected, relief teams in the field relied on hand-drawn maps of local villages such as Kameswaram (Figure 3.5). Ultimately, the numbers of people who were killed or affected were reconstructed through interviews of survivors, but these numbers lacked the support that could have been provided from pre-existing demographic data. Furthermore, data on the age and gender of the victims were not recorded, so it was difficult to project the longer-term impact on demographic patterns in the affected regions.
Responders traveling through India and Sri Lanka in the immediate aftermath of the tsunami stated (Rodríguez et al., 2006, pp. 170-171) that they:
observed a variety of irregularities or inequities, particularly related to the distribution of disaster relief aid. We also received reports of challenges in the provision of relief and recovery services. For example, in some instances, NGOs duplicated efforts or provided assistance not suited to the locale or to the varying population sizes. Further, while in some communities there seemed to be an abundance of aid, in other communities, particularly remote ones, the distribution of aid seemed to be quite slow and limited. In Sri Lanka, the ongoing conflict between the government and the Liberation Tigers of Tamil Eelam (better known as the Tamil Tigers) generated a variety of concerns regarding how aid was distributed which made understanding the difference between political and disaster response issues complicated.
Hurricane Katrina 2005
In the previous three cases of disasters, the countries were relatively poor, the governments had few resources for population data collection and analysis, and the disasters occurred without warning. None of the three conditions existed in the case of Hurricane Katrina when it struck the United States. Unlike the previous three examples, Hurricane Katrina struck the world’s richest country, which had a wealth of data appropriate to tackle the disaster. The hurricane developed over a period of days, with hourly warnings on many public broadcast systems. Disaster preparation plans had been developed long in advance for just such a circumstance and were in place when the hurricane struck New Orleans and other parts of Louisiana, Alabama, and Mississippi. The amount of data and plans avail-
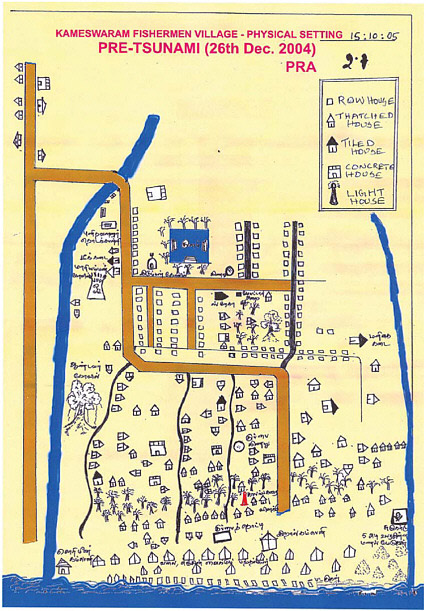
FIGURE 3.5 Hand-drawn maps of Kameswaram village, derived from information collected from villagers by aid responders (Subramanian, 2006). The map on the left shows the village prior to the tsunami, and the map on the right shows the water inundation of the village on the day of the tsunami. Despite an enormous contribution of international relief aid to areas affected by the earthquake and tsunami, and the advanced technology available to some responders, immediate relief efforts and assessments of the condition and numbers of the affected population relied on hand-drawn maps in this region. This map contains not only subnational, but village-specific, population data relevant to assistance providers and demonstrates that adequate aid does not necessarily require advanced technology—rather advanced technology requires appropriate and timely input of data. SOURCE: Courtesy of Abbiah Subramanian, Madras Christian College, India.

able before the disaster, however, did not guarantee that the data would be used well after the hurricane hit the Gulf coast.
Hurricane Katrina occurred five years after the decennial U.S. population and housing census, not unlike the timing of the decennial censuses relative to the natural disasters in the preceding examples. However, local area data had already been used to apportion congressional seats for the 2002 elections, and many of the data were publicly available. The U.S. Census Bureau makes detailed digitized maps of its address files before every population census, and many local area maps are available from the Topologically Integrated Geographic Encoding and Referencing (TIGER) system files for local area planning. The maps include major landmarks, such as road and train lines, and the Greater New Orleans Community Data Center (GNOCDC) had used these data extensively in preparing community demographic and economic profiles for the metropolitan area, an effort designed to democratize data and make them readily available to community-based organizations on the web (http://www.gnocdc.org). Further, the data were used in preparing evacuation plans and testing them in the hypothetical training exercise called Hurricane Pam, developed by city, state, and federal officials (Laska, 2004; FEMA, 2004). Local authorities knew not only the distribution of the population at potential risk, but also its characteristics. However, in the immediate post-disaster environment, the availability and quality of data were another issue altogether (Box 3.1, Figure 3.6).
WHY DECISION MAKERS DO NOT USE EXISTING DEMOGRAPHIC DATA IN DISASTERS
Local-area census data could be invaluable in times of disaster. Census data provide a basic platform from which to evaluate the effects of a disaster. The rates of displacement, morbidity, and mortality cannot be calculated without accurate census data. Without updated, place-based census numbers, responders cannot evaluate the number of affected people or their ages, gender, or education levels; without this information a sampling frame for post-disaster surveys cannot be constructed accurately. Why are the available demographic data not used more often?
As demonstrated in the preceding examples, the underutilization of existing demographic data in a crisis is not necessarily a function of having too few data, too little money, or a lack of local and international response to help disaster victims. Data dissonance—or the lack of coordination between existing demographic and geospatial data sets and their accessibility and use by responders—is rather a function of several features of the data themselves and the operations of the institutional structures employing the data. The inadequacies in the data can be characterized under three headings:
|
BOX 3.1 Democratizing Data: Where Are the Residents of New Orleans Now? Hurricane Katrina resulted in the largest internal displacement of Americans since the 1930s Dust Bowl. Nearly half of the residents of metropolitan New Orleans no longer live there; their housing and livelihoods were destroyed by the levee-breach flooding. In the aftermath of Hurricane Katrina, three important data needs confounded recovery and reconstruction efforts. First, there were few spatially referenced data corresponding to those who voluntarily evacuated and where they went. Estimates indicate that upward of 80 percent of the residents in the region evacuated, but we know little about which communities they left, for example. Second, residents who did not evacuate the city, but went to shelters such as the Convention Center or Superdome, became internally displaced and were relocated throughout the United States. While there are gross counts on the number of people internally displaced (based on registry data for individual assistance payments at the state level), data on their original locations (home addresses) and current ones are not readily available. Finally, it is not known with any certainty who is returning to the metropolitan area and from which places they are returning. Proxy data based on rapid population estimate surveys are available for estimation of repopulation of the metropolitan area, but they are not sufficiently georeferenced to provide an adequate picture of the geographic and demographic nature of recovery at the community and block levels (GNOCDC, 2006). |
-
The data are old and not representative of the current population or settlement patterns, as in the case of the Turkey and Pakistan earthquakes.
-
The data are not at the correct spatial scales or are missing key characteristics, as exemplified by the lack of detailed data at local levels in the tsunami or the earthquake examples.
-
The data are inappropriate for the needs of decision makers, as demonstrated by the availability of remote sensing imagery of affected regions that lacked corresponding overlays of population data or, as in the case of Hurricane Katrina, where data tracking the relocation of evacuees were not systematically recorded.
Out-of-Date Data
Census demographic data are the most detailed data available for local areas, and the age of the data is one important aspect of evaluating how likely population determinations derived from the data are to represent the present-day, local situation. Nonetheless, age is not the sole criterion on
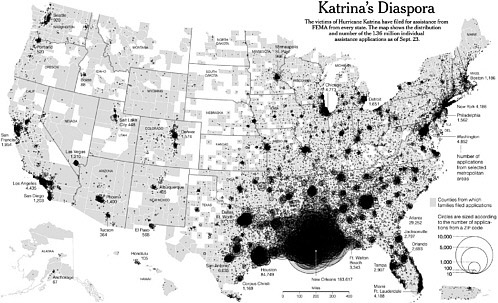
FIGURE 3.6 Gross counts of internally displaced people subsequent to Hurricane Katrina showing their widespread geographic distribution and impact outside the immediately affected Gulf Coast region. Hurricane Katrina became the costliest natural disaster in U.S. history (nearly $125 billion and counting) and represents 79 percent of all global disaster losses for 2005. SOURCE: New York Times, used with permission.
which to evaluate data reliability or usefulness. Most countries conducting regular censuses do so only once every decade, so it is the quality and reliability of these initial data, whether or not they are georeferenced, the degree to which they can or have been disaggregated to subnational levels, their accessibility, and whether or not they have been updated with intercensal surveys that help determine whether older data can be used with confidence. For the four examples discussed in this chapter, the census data were nine years old when the earthquake struck Turkey, seven years old at the time of the Kashmir earthquake, and five years old when Hurricane Katrina hit New Orleans. India had the most recent census data, which were only three years old at the time of the tsunami. These cases show that the age of the data is of less importance than other factors such as coordination between response agencies and governments, political will, and data accessibility and format in getting aid to the populations in distress.
While the expense and resource commitments needed to conduct national censuses with greater than 10-year frequency are prohibitive, methods for updating these data are outlined in Chapter 2, and could be used to update the census population data with information from ongoing demographic surveys. Between censuses, movement of people in and out of regions, especially in cities (Entwisle and Stern, 2005) does occur, and censuses cannot capture migration dynamics. In addition, census data are based on residence and therefore do not describe the distribution of the population when people are not at home. If a disaster occurs after work hours, the census population distribution is likely to be reasonably accurate at local scales in describing the population affected. However, given the commuting distances that many people around the world encounter on an ordinary workday, the differences between daytime and nighttime populations in a given location can be of orders of magnitude (see also discussion in Chapter 2). Simple algorithms to estimate these intercensal changes are rarely employed in pre-disaster preparedness or post-disaster response situations but would greatly improve data accuracy and usefulness in the event of a disaster response situation and could also be used for other types of normal development and planning programs in education, health care and housing.
Inaccessible and Incomplete Data
Even if demographic data were up-to-date, accessing the information is likely to be a continuing problem during a disaster, such as in Turkey or Pakistan (Buchanan-Smith and Davies, 1995). Also, while demographic data were available at the Tamil Nadu’s (India) state offices, they were not available at local levels. Furthermore, having complete data on population characteristics (e.g., age, gender) is critical, especially when examining dif-
ferential mortality or post-event trauma needs of the injured. Having the right data at the right spatial scale is critical for an effective disaster response.
One of the first casualties in a disaster is the infrastructure for data transmission. Electricity and telephone lines are disrupted. Computers cannot function at all or for very long, therefore, Landsat and other satellite data that may be available outside the disaster area cannot be downloaded into the field where they could be useful. Even if a computer could still function, the bandwidth available might be too narrow to capture all of the data available for field use. Some of the inaccessibility of the data occurs because the demographic data and the geographic boundary files are so voluminous that they overwhelm the transmitting systems (Bagiire, 2006). This raises the issue of how appropriate the data are for decision making if they cannot be used in the field during crisis situations. Linking demographic and geographic data is the first step toward an effective emergency response. The second step is the need for simple, large-scale maps of local areas affected by disasters.
Inappropriate Data for Decision Making
If demographic data are up-to-date, complete, and accessible in the field, they still may be underutilized because they are not in a form that can be used for decision making (Maxwell and Watkins, 2003). For example, disasters happen in real time to real places as do relief efforts. Therefore, both the disaster and the disaster relief can best be understood spatially; unfortunately, most available demographic data are aspatial (Liverman et al., 1998). Most countries do not combine their census data with other geographic data (including enumeration districts discussed in Chapter 2). Without such georeferencing, these data are of limited use in a disaster. Furthermore, in many disasters, more than two dimensions of the spatial data are needed. Floods, in particular, require elevation data as well as horizontal spatial data in order to identify the households most at risk. The disconnection between the spatial requirements for disaster responders (where) and the aspatial nature of the available data (how many) often renders the data inappropriate for place-based decision making in times of crises (Messick, 2006).
Another issue is the availability of too many data, which can be as inappropriate as too few available data and may overwhelm responders. In the United States, considerable demographic data are available, but the data can overwhelm decision makers. Identifying the most relevant data in hundreds of pages of tabulated numbers is daunting to everyone. By the time that the third responders from outlying areas arrive, many people with
different data needs are involved, and the cognitive dissonance of too many needs and too many responders is already in place (Messick, 2006).
An agreed standard of the minimum information needs in various types of disasters and at different stages in a disaster scenario would be an important step in making data more complete and accessible to decision makers in times of crises or disasters without simultaneously overwhelming these responders. Recognition of these needs would also provide guidelines for data provision at the time it could be used most effectively. The concept of minimally useful data sets would begin to address this issue (Noji, 2005; NRC, 2007; see next section).
CHANGES NEEDED TO MAKE EXISTING DEMOGRAPHIC DATA ACCESSIBLE TO DECISION MAKERS
In order to make the existing demographic data more useful in responding to disasters several steps would have to be taken:
-
Update local-area census data routinely (at least every five years) as part of a comprehensive planning or emergency preparedness planning.
-
Provide local area data in both spatial and tabular, preferably digital, form.
-
Develop an agreed-upon minimum set of requisite data for post-event response as well as pre-impact disaster preparedness.
Update Local Area Census Data Routinely
Several different sources of data collected between censuses could be used to update census local area demographic estimates. The U.S. Census is used for the sampling frame for other surveys throughout the following decade, such as the Current Population Surveys (CPS). The new American Community Survey (ACS) is now providing reliable, updated demographic data at a local level every three years for areas with populations of 20,000 or more and every five years for those smaller communities (Mather et al., 2005). More questions and attributes are available, but at a coarser level (subcounty minor civil divisions) than the decennial census (blocks, block groups, tracts). For example, estimates of poverty rates, daily commutes, and group homes and the homeless (the latter two are future ACS collection plans) would be available every three to five years, but only at the county or in some instances the subcounty level (such as a small town or city). In developing countries, DHSs are taken every three to five years and can also be used to update the census population estimates (Montana, 2006). Updating local area estimates could be time-consuming and expensive if
done for each individual enumeration area on an annual basis. The timing for these updates does not have to be annual in places where populations do not change rapidly. These conditions would have to be evaluated on a country-by-country, or region-to-region, basis. Projection algorithms already exist that, if implemented by appropriately trained people, could provide regularly updated estimates at the local level, as long as good baseline data exist as a foundation for the projections.
Provide Local Area Data in Spatial and Tabular Form
At their best, maps are “instruments for reasoning about quantitative information” (Tufte, 1983). Maps can be designed to have at least three viewing depths: the overall structure of the distribution, the more explicit details, and the underlying framework for both. If the data are not presented in a form for rapid and accurate decision making, they would not be used no matter how good they are. This realization is as important for pre-disaster demographic data as for post-disaster data.
Mapping demographic data is now done with computer-based GIS used to analyze spatial problems and to allow the user to visualize the data in a dimensional form that many people, regardless of their training, can use as a common platform (Box 3.2). The main use of GIS in disaster risk assessment and mitigation among practitioners is to provide maps for decision makers. For example, maps can depict the location of people and facilities at risk and the available resources for responding to that risk. Remote sensing, real-time photos and videos generated by GPS-enabled devices can improve data collection in the field before and after a disaster has occurred (Ulgen, 2006). The overlying functions of GIS can link data for the areas impacted and facilitate analyses. The discussion in Chapter 5 about the floods in Mozambique illustrates the importance of having the elevation of a disaster area mapped when flooding is a major threat. The map can quickly provide responders with information about which areas would be most threatened and which areas may be destinations for refugees because their elevation is above the flood level. A review of the many current and potential applications of GIS and GPS in humanitarian response is provided by Kaiser et al. (2003).
Humanitarian Information Systems (HIS) provide and integrate information to assist humanitarian emergency response and decision making, especially in the early stage when quick response is needed (Maxwell and Watkins, 2003). Conventional HIS components include early warning systems and response monitoring. In addition to the magnitude or severity of the hazard, the potential and actual impact on populations according to their differential vulnerabilities is a necessary component of HIS. When integrated with spatial information using GIS, post-disaster assessments of
|
BOX 3.2 Spatial Tools for Organizing, Displaying, and Analyzing Data Data exploration and visualization can reveal unknown spatial patterns in highly interactive environments. Methods, including symbolization, highlight subsets of data via either focusing (for a subrange of the data) or brushing (for an arbitrary set of spatial entities), creating multiple views, animation, linking with other forms of display (tabular and graphical displays), or spatial data mining that enables patterns to be detected automatically. Data exploration software involves high-dimensional graphics. Examples include StatMapper by DHS, 3-D Mapping Software, ExploreMap, MapTime, ArcGIS/ArcView, HealthVisPCP, Vis5D, and CommonGIS. CommonGIS provides web users easy access to visualizations of attribute data associated with enumeration units or point locations. It has the ability to automatically select the appropriate method of symbolization given a set of attribute data that a user wishes to map. Peckman (2004) used it to visualize global databases such as LandScan. Geographic visualization is the use of concrete visual representations—whether on paper or through computer displays or other media—to make spatial contexts and problems visible, so as to engage the most powerful human informationprocessing abilities, those associated with vision (MacEachren and Cai, 2006). Analytical techniques and geovisualization methods can greatly enhance our understanding of risk and mitigation efforts. Data visualization software can be used to present information on post-disaster population status and humanitarian assistance needs to decision makers and those involved in disaster response. An example of a data visualization and spatial statistics software package that is freely availability is GeoDa (Figure 3.7), which was developed by the Spatial Analysis Lab at the University of Illinois, UrbanaChampaign. By employing visualization software, users have interactive access to a vast amount of information that is displayed in a more readily understandable form. For example, spatial analysis of demographic data can help identify regions in which a particular event or need is concentrated. Information can be presented spatially by area-based rates, which can help guide the disaster response by targeting geographic areas (e.g., visually displaying unmet needs or reported service access). Information can also be presented by age- and gender-specific population subgroups as an event density, which can help identify particular population subgroups that may be at risk for certain disasters such as an earthquake or a hurricane (Doocy, 2007; see also Appendix E). Spatial data analysis refers to the quantitative and statistical analysis of spatial data. For the analysis of the spatial relations among a measles outbreak, food distribution, acute malnutrition, and micronutrient deficiencies, a spatially weighted regression equation that relates measles cases to these areal attributes can be used to model and explain the spatial variation of the measles outbreak. Further, spatial statistical methods such as adjusted and smoothed rates, tests for spatial randomness, spatial heterogeneity, and spatial association can be used to examine the spatial patterns of the outbreak. Another possible method is inverse density-weighted smoothing, where more weight is given to closer samples and less to those that are further away (Isaaks and Srivastava, 1989). Spatial-temporal modeling of space-time data can also be undertaken. Examples include vector habitats and malaria over time. |
surviving populations, including their movements, needs assessment, living conditions, and health data, provide a needed perspective for decision making and the timely delivery of resources (Doocy, 2007; see also Appendix E; Messick, 2006).
Box 3.2 and Figure 3.7 suggest the potential benefits of data integration, analysis and visualization. However, the cost of the equipment and software to generate these types of analyses, as well as the requirements for detailed local data and analytical training, may be prohibitive for many countries or local communities. Therefore, the feasibility and relevance of these sophisticated techniques for a disaster situation depend heavily on
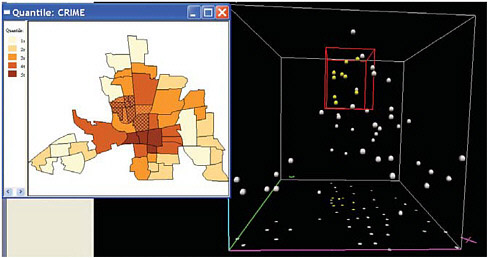
FIGURE 3.7 The three-dimensional scatter plot of GeoDa can be used to examine the relationship among three area-based variables and their spatial manifestation, dynamically linked with a map (see Anselin, 2004). In the right pane, the x-axis (pink) and y-axis (green) represent the geographical coordinates of the centroid of the neighborhoods shown on the left pane; the z-axis (light blue) represents the respective crime rate for each neighborhood. Neighborhoods in the three-dimensional scatter plot in the right pane can be selected using a three-dimensional selection box (red), whose position and size can be changed. The selected points (spheres) in the three-dimensional scatter plot are highlighted in yellow and are linked to the map in the left pane, which is a five-quantile choropleth map of crime rate of the study area (Columbus, North Carolina). While each of the five quantile classes is color-coded to represent the first, second, etc., class, additional shading is used to indicate the neighborhoods selected by the red 3D box in the right pane. Several three-dimensional point manipulations are supported by GeoDa, such as rotating and zooming, as well as linking and brushing. By these means, the geographical pattern of areal units with certain combination of characteristics (e.g., high poverty level, crime) can be identified on the dynamically linked map of the study area. SOURCE: Luc Anselin, University of Illinois, Urbana-Champaign.
the availability of adequate financial and technical resources in the local context. The committee thus recognizes the difficulties in achieving this level of technical capability with data visualization and analysis, but emphasizes the potential of these visualization tools to improve the abilities of local agencies to respond to disasters. Visualization tools and training are not a priority for countries or communities lacking data, but they should be recognized as part of the future toward which analytical capacities and technology for population data can aspire. Priority should be given first to the acquisition and maintenance of good base data, training of analysts to use the data, and coordination of organizations and governments through which these data must be transmitted for disaster or development aid projects. As noted elsewhere (NRC, 2007), effective emergency response begins with a map, and for many responders to humanitarian crises and disasters, the map may be most useful in paper, not digital form.
Adopt a Principle of Minimally Essential Data Sets
The pre-disaster demographic data provide a baseline to assess the human impact of the disaster, but the pre-disaster data themselves cannot provide an assessment of the post-disaster impacts. Each disaster leaves its own unique footprint on the population and the landscape. Interactions between the disaster, the people, and the environment mean that generalizations about the impacts of a disaster are difficult to make until a post-disaster survey is taken. The 2004 tsunami had different effects in both Indonesia and India. In Aceh Province in Indonesia a cluster sample survey of households found that women were almost twice as likely to have been killed as men (MacDonald, 2005). The most vulnerable age groups were the 0-9 year-olds and those aged 60 and over (Doocy et al., 2006). The effect of the tsunami was quite different in Nagapattinam District in Tamil Nadu, India. In that one district, 6,065 people died. Children were a smaller percentage of the dead than adults; 40 percent of the dead were adult women and 31 percent were adult men (Doocy, 2007).
Several different kinds of post-disaster survey designs exist, each with different strengths and weaknesses (Box 3.3). The challenge is that very different kinds of information are needed at different stages after the disaster and for different interventions. If one disaster precipitates another one of a different kind in the same region, then the information needed for that response will continue to evolve. The concept of a minimal essential data set (MEDS) is important so that only the most relevant and important data are collected for the particular kind of disaster at the right stage within the emergency cycle (Noji, 2005).
A framework for data for pre- and post-disaster situations would include data for both sudden-onset and chronic disasters. The data would
|
BOX 3.3 Minimum Population Data Requirements for Emergencies Displaced persons are most in need of emergency assistance. Information collected during emergencies follows the pattern of an inverted pyramid. Whereas very few data are available at the start, the amount of information increases exponentially over time. This is also the case for population data. Due to the high mobility of displaced persons, population data should be updated on a regular basis. It is better to collect basic population data frequently, rather than detailed information only on an occasional basis. Basic population data are collected through a variety of data collection methods, including counting, estimation, rapid assessments, surveys, registration, and other administrative records. Several methodologies specific to post-disaster population surveys include cluster sampling, area probability sampling, the quadrate method, and the T-square method (Noji, 2005). Most emergency interventions are organized according to sectors, such as health, food, water, nutrition, sanitation, and shelter. Some of these sectors have standardized data collection methodologies (e.g., mortality measurement, nutrition). In practice, the different sectoral interventions often require similar population data. Arguably, the denominator (i.e., total population size) is the most important population data need for all actors. Surprisingly little attention has been devoted to defining minimum standards for demographic data collection, developing methodologies and tools for rapid demographic assessment, and improving population estimates. The need for population data collection depends greatly on the geographical region, the capacity of the host country, the type of emergency, and the scope of the response. While an earthquake in Pakistan, a hurricane in the United States, displacement of Sudanese by conflict, and refugees crossing an international border occur in different geopolitical contexts, each requiring a tailored response, the needs for basic population statistics during first phases of the emergency are surprisingly similar. For example, data collected on shelter residents displaced by Hurricane Katrina were quite similar to information collected on refugees in subSaharan Africa. Standardization is also promoted because international agencies use standardized forms and templates in responding to emergencies. However, there is no formal agreement between agencies on the population data to be collected. At a minimum, the collection and georeferencing of population data should be linked with the existing coordination mechanisms on the ground. Surveys are critical for assessing the needs and characteristics of the survivors of any emergency situation. However, only when the total surviving population is compared to the total pre-disaster population from the census or administrative records can accurate counts of the number of people killed be made. Specific Place-Based Data Needs At the Border. When refugees cross an international border, host country authorities, often aided by international agencies, seek to determine the scale of the influx by counting or estimating the number of persons crossing the border. If feasible, the new arrivals are registered. Population data collected at the border include the total number of persons (“rate of arrival”), a count or estimate of the number of males, females, and children and an indication of their place of origin. |
|
At the Reception Area. To provide basic protection and deliver emergency assistance to displaced persons at the reception area (camps or centers), it is necessary to establish a total population count, to capture basic demographic characteristics, and to record every individual. Typically, all individuals will be issued a unique identification number. Registration during emergencies is often conducted at the family level. Data collected from each family include: name; place of origin; current location (site, block, shelter no.); date of arrival; and number of males, females, and persons with special needs, including children under age 5. As soon as possible, all persons should be registered on an individual basis. Data collected from each individual include name, relationship to head of household, place of origin, current location, date of arrival, gender, date of birth, and special needs (if any). When people leave the site, their date of departure and destination should also be captured. To simplify data collection, answers to these questions should be pre-coded with a limited number of answer categories. Collecting few data and entering them quickly is the golden rule. Once the emergency is over, more data can be collected, including educational level and skills. For registration to provide population statistics, it is essential that data are entered as quickly as possible. Unfortunately, data entry often does not keep pace with the rapidly evolving situation on the ground. Moreover, registration figures are often inflated, because of the inherent incentives of being registered and lack of disincentives for de-registration. Separate counts are held of the number of people arriving (departing) and in particular headcounts of those who are present. Shelter counts based on satellite imagery or observations on the ground, combined with a shelter survey providing the average number of persons per shelter, are often used to estimate the total population. Shelter surveys can also used to provide a basic demographic profile by gender and broad age group. Key Emergency Indicators In the humanitarian community, there is widespread agreement about a limited number of indicators to trigger emergency interventions. These key emergency indicators include the crude and under-5 mortality rate; nutritional status; minimum requirements for clean water, food, energy, shelter, and sanitation; as well as the reported cases of measles, respiratory infections, and diarrhea (UNHCR, 1990). Most indicators require the total population size as denominator. The mortality rate, arguably the most important emergency indicator, is another area in which population and census experts can lend their expertise. |
include both the physical characteristics of the area that has been affected and the population characteristics. Physical characteristics would include spatial data on the extant transportation network, including roads, bridges, airports, rail systems, and ports. Most disasters also would require spatial information on the health care systems, such as hospitals, clinics, nursing homes, and health institutions (e.g., mental hospitals); most disaster responses will also require spatial information on settlements and their power grids, alternative sources of power, gas stations, and backup systems.
The development of a matrix of needed data for different kinds of disasters at different stages of recovery is essential to help make the best use of scarce resources. Currently, several groups, among them George Washington University (see discussion of data availability below), the United Nations, and Environmental Systems Research Institute (ESRI), are surveying the international disaster response community for the kinds of data they need at different stages of a disaster. Their plan is to develop a template of needed data that can serve as a guide for in-country responders as well as the international community. In addition, the UN Office for the Coordination of Humanitarian Affairs (OCHA) is also trying to standardize some of the definitions and concepts that people use during disaster reporting. Both efforts are essential to providing decision makers the right kind and level of data for decisions that must be made immediately. The goal should be to get the best data to the field as soon as possible in a form that can “promote the ordered, sequenced, hierarchical flow of information from the graphic to the mind’s eye” (Tufte, 1983) for decision making.
Peruse Household Survey Data
As noted above, surveys are often the only source of data in many developing countries. Surveys are carried out by a variety of local, national, and international agencies for a variety of purposes. However, a common feature of most of these surveys is that they include basic data on the sociodemographic characteristics of the population and indicators of their well-being. Both in contingency planning and in responding to disasters, knowledge of recent household surveys carried out in the area and, particularly, the availability of the specific indices collected as part of those surveys is important. Emergency responders would gain great benefit from resource investment in collecting and maintaining existing household survey data in accessible databases.
BROADER INFORMATION MANAGEMENT, TRAINING, AND TECHNOLOGY ISSUES
Data Access
Population data expressed as aggregates even in very small enumeration areas are some of the better examples of public goods. Most countries make their population counts—and, at some geographic level, other information—publicly available and usually at no cost provided that no spatial (boundary) data are also being distributed. Individual unit records from censuses are subject to confidentiality agreements and are not made publicly available. In many countries, such data are available for use at the
NSO or related data enclaves. When census data are publicly available, they are usually available through NSO web sites. At present there appears to be no capacity within these agencies for systematic collection, processing, or dissemination of subnational data through a centralized or distributed system.
Spatial data associated with commonly needed census variables are not commonly available to the public, nor are they widely available to nongovernmental organizations (NGOs) and other disaster response entities. Increasingly, the practice is to make census boundaries available, usually through collection of a fee, because the “business model” for producing these data has been one of cost recovery, either for the total investment or on an on-demand basis for a particular data product.
Distributed Archives
Census data are normally available through NSO web sites, and for global aggregations of population estimates the official repository is the UN Statistics Division (http://unstats.un.org/unsd/demographic/). Several NGO collections exist: the African Census Analysis Project (ACAP) at the University of Pennsylvania, the Centro Internacional de Agricultura Tropical (CIAT), the Center for International Earth Science Information Network (CIESIN) at Columbia University (see also Chapter 2), and the Integrated Public Use Microdata Series (IPUMS) project at the University of Minnesota (see Box 3.4). Each of these has both national and subnational census data. Many countries disseminate subnational data tables and spatial boundaries, but many do not. Further, as Table 3.1 shows, the resolution of spatial inputs (by area or population) varies tremendously. However, no subnational data are redistributed by the main producers of population estimates and projections, namely the UN Population Division, the U.S. Census Bureau’s International Program Center, or the International Institute for Applied Systems Analysis (IIASA).
Technology now allows for distributed archiving systems in which data holdings would remain in a country but conform to international standards so that they could be integrated seamlessly from a single repository. This approach has the advantage of keeping ownership within a country but allowing easy access by individual researchers, policy makers, and agencies.
Such distributed systems require some degree of interoperability of systems and standards, but with moderately small investments in computing infrastructure and the associated human resources, such a system is within reach of most of the world. A more challenging issue is determining an ideal home for the gateway to the distributed network. Such a gateway could, but would not necessarily, also have to double as an archive, or off-site backup location, for the various data sets under discussion. A working
|
BOX 3.4 Nongovernmental Organizations with Collections of Regional or Global Aggregations of Population Estimates ACAP specializes in demographic research and training to maximize the use of African census microdata for academic and policy-oriented research to benefit African governments and research (http://www.acap.upenn.edu). CIAT is a nonprofit organization that conducts social and environmental research oriented toward reducing hunger and poverty and preserving natural resources in developing countries (http://www.ciat.cgiar.org). CIESIN specializes in online data and information management, spatial data integration and training, and interdisciplinary research related to human interactions in the environment (http://www.ciesin.org). IPUMS collects and provides in database format U.S. census microdata and census data from around the world, for social and economic research at no cost to the user (http://www.ipums.umn.edu). |
example of such a data gateway is housed at the Socioeconomic and Data Applications Center (SEDAC; http://sedac.ciesin.columbia.edu) at CIESIN, Columbia University, which serves simply as an example of the architecture; this particular gateway currently serves gridded demographic data but not population data associated with finely resolved subnational units.
Data Availability
Simply sharing existing population data is admirable but may be insufficient if disaster management is to be effective. Other data—on population characteristics (e.g., demographic, health, socioeconomic) as well as the location of roads, facilities (e.g., hospitals, clinics, schools), and elevation and slope—may be critical. With the exception of elevation and slope, none of these data are currently available to the extent of population data. Roads are perhaps the most glaring omission of a data set for which there is a clear, unmet need and for which the private investment (e.g., commercial road maps) might make the construction of a public global good particularly challenging. A recent initiative supported by academia, the private sector, and UN agencies is developing a GIS data model for humanitarian action (Box 3.5).
Data collected and acquired in the relief and recovery process may be useful for longer-term development activities. However, data acquired under conditions of disaster response may be the most perishable and decentralized and subject to the greatest variation in ownership, consistency, and quality. Nevertheless, these data may present important details about
TABLE 3.1 Spatial Resolution Associated with Available Population Data: Examples from the Gridded Populationof the World (GPW) Data Collection
|
|
Country |
Resolution (km) |
Population per Unit (in thousands) |
Area (km2) |
Administrative Area Type |
Number of Administrative Units |
Population (in thousands) (UN, 2000) |
|
1 |
South Africa |
<1 |
1 |
1,217,645 |
Enumeration Area |
83125 |
43,309 |
|
2 |
Guam |
2 |
1 |
546 |
Block Group |
203 |
155 |
|
3 |
Slovenia |
2 |
0 |
20,224 |
Settlement |
5989 |
1,988 |
|
4 |
Malta |
2 |
6 |
315 |
Locality |
67 |
390 |
|
5 |
Macao |
3 |
142 |
19 |
Peninsula/Island |
3 |
444 |
|
6 |
Maldives |
3 |
13 |
189 |
Atoll |
21 |
291 |
|
7 |
Malawi |
3 |
1 |
94,958 |
Enumeration Area |
9219 |
11,308 |
|
8 |
Mauritius |
3 |
6 |
1,993 |
Municipal Ward/Village Council Area |
186 |
1,161 |
|
9 |
Netherland Antilles |
3 |
2 |
818 |
Geozone |
71 |
215 |
|
10 |
United StatesVirgin Islands |
3 |
3 |
374 |
Blocks |
32 |
121 |
|
11 |
Czech Republic |
4 |
2 |
78,616 |
Obec |
6258 |
10,272 |
|
12 |
Switzerland |
4 |
2 |
38,975 |
Commune |
2912 |
7,170 |
|
BOX 3.5 GIS Data Model for Humanitarian Action The purpose of the Humanitarian Data Model (HDM) is to promote GIS usage and data sharing among humanitarian organizations. The model would provide a “ready-to-use” template or framework from which various agencies and organizations could build their internal system. The current model consists of both geodatabase design and application framework. Those currently participating in the ongoing development of the model are the International Charter on Space and Major Disasters; UN OCHA Humanitarian Information Centers; UNOSAT; the RESPOND Consortium; UN Geospatial Information Working Group (UNGIWG); the U.S. Department of State’s Humanitarian Information Unit; the Open GIS Consortium (OGC); and the Institute for Crisis, Disaster, and Risk Management (ICDRM) at George Washington University. Proposed Applications of the Model:
Base Universal Layers:
The draft HDM will consist of (1) a conceptual database design document, (2) an analysis diagram, (3) Unified Modeling Language (UML) documentation and Geography Markup Language (GML) schema, and (4) sample database and map documents. After it has been developed and stabilized through peer review, the HDM will then be ready for publication on ArcOnline and the ICDRM web site. The developers would then begin construction of a short book that documents the data model design. Published by ESRI Press, the book would provide a concise description of the thematic groups and classes in the model, and would serve as a reference book for teams working on projects. The paper discussing the development of the model referenced the Homeland Security, Defense-Intelligence, and Transportation Data Models are potential references for the structure of the HDM. |
migration flow and individual, household, and community characteristics, all of which might aid longer-term recovery and development efforts. However, agencies that collect and share data for relief aid may differ from those that collect data for longer-term recovery and development.
Data Documentation
Metadata for humanitarian applications are often not available or are poorly documented. Government agencies should be held responsible for including metadata using one of the standard available formats, as long as doing so does not hamper the publication of data during the crisis. This requirement could be incorporated with a larger mission of cost-effective investment of national resources to improve the level of geographic detail. Data should be subnational and should include more spatial units, boundaries, and sufficient detail for future updates and replication either by the original data collector or by another entity. These requirements could be explored in practice through disaster exercises or dress rehearsals where national-level actors interact in a simulated crisis environment to see where communication and data flows can break down.
Data Sharing Needs During the Response Phase
Rapid access to relevant information is crucial for the immediate response to the event and to mitigate its consequences. Various data about the affected areas are needed for this purpose, including building plans and footprints, local streets, utility lines, and critical facilities such as hospitals. Emergency responders must to be able to search, retrieve, assemble, and use existing geospatial information quickly (Goodchild, 2003a). Data sharing among agencies or units would greatly facilitate emergency response, but such exchanges are constrained by operating cultures (see Chapter 4) and information technology issues of interoperability.
Interoperability is the ability of systems to exchange information, based on shared understanding of meaning (semantic interoperability) and mutually agreed formats (syntactic interoperability) (Goodchild et al., 1999). The data needed may be difficult to assemble or integrate because of incompatible formats and inaccuracies. Geospatial data standards that facilitate data sharing and interoperability need to be developed and adopted long before disasters occur.
In addition, there are several important considerations when establishing the database or information system for emergency response (Goodchild, 2003b). First, the system should not only incorporate important geographic information but also have spatial analytical and modeling capabilities to facilitate effective response to disasters—for example, the capability to dis-
play, identify, and analyze critical spatial patterns or relationships among event locations, shelters, transportation routes, and the population at risk. The system should also permit interactive and dynamic visualization of the temporal progression of both the disaster situation and the evacuation of the affected population from the disaster site (see Box 3.2, for example).
Since the risks at a disaster site can change swiftly and unexpectedly, decision support in real time for both emergency response personnel and the affected population is an essential function of such a system. This means that the system should be able to collect and disseminate information about the current condition of the disaster site in real time. The system should also allow responders to model or simulate possible trajectories of change in the disaster conditions and to formulate alternative decision scenarios. Furthermore, the database infrastructure should have a distributed architecture and allow for wireless and mobile deployment. As emergency crews work at a site, mobility and self-reliance (without requirement for hard-wired connections, even if available) are critical for information and decision support. The ability to communicate decisions and desirable actions effectively among all affected persons and emergency personnel is, therefore, essential for any geospatial data sharing infrastructure (Messick, 2006). To remain operational during a disaster situation, such infrastructure could be built upon a highly flexible and distributed system architecture, where the geographic database and decision support functionalities remain accessible to emergency personnel through multiple channels including wireless and mobile communications technologies. Most importantly, strong coordination mechanisms should be created at the field level between all actors involved in population data collection. For this to happen, population data management could be considered a separate “cluster,” similar to water, sanitation, and shelter. Although population data are cross-cutting, creating a population data cluster in each emergency would ensure proper resources and coordination opportunities.
Training for Effective Data Use
Of course, better data management and technology will require better training for the people who will be expected to use the data more efficiently. Some people will have to be trained to integrate demographic data with GIS technology, but many more people will have to be trained to analyze the demographic data, in both tabular and spatial form. This training does not necessarily have to be sophisticated, but it does have to be appropriate to emergency situations in general. Training is not free, but it need not be expensive if it is integrated into the job requirements of those who will be expected to use data during a disaster. Demographic data training is essential for basic disaster management competency and is also important
for promoting an organizational culture that is more efficient, flexible, and collaborative during disasters and beyond. Not every person involved in disaster relief needs data training; in fact, the selection of a subset of people, such as geographers and demographers, for training will be more cost efficient.
One of the obstacles to the full employment of spatial demographic data during disasters, despite the clear need to do so, is the pressing human resource issue. Responding to disasters and humanitarian crises requires shared geographic and demographic thinking and training. At present, relatively few units, especially in developing countries, have sufficient trained expertise in both demography and geospatial tools and technologies. Improvements in the training and commitment of the national statistical office and other staff for each country are essential, to include both demographic projection methodology in local areas and the use of appropriate spatial administrative units in map form. There are a number of mechanisms for building such capacity, the first of which is recognizing the importance of the skill sets required for disaster preparedness and response. The second is formalized training. Such training programs could be part of overall capacity building and funded by bilateral aid programs, such as the U.S. Agency for International Development, or through broader country capacity-building programs, such as those conducted by the U.S. Census Bureau with support from the World Bank or the United Nations. The United States experience suggests that improvement in the capacity to prepare for and respond to disasters saves lives and reduces economic costs when an event occurs.
SUMMARY
The selected vignettes of disasters in countries with different levels of resources all demonstrate the same problem. A pervasive gap exists between the data that are available for use in disaster situations and the underutilization of those data when they are most needed. Each disaster seems to receive a new approach without any systematic understanding of what information is needed and the form it should take.
Although each disaster has its own unique characteristics and each country has its own unique data collection and dissemination systems, the uniqueness of the disaster and of the national, local, and urban institutions does not obviate the more fundamental requirements for demographic data before and after disasters strike. The sense of each disaster being unique (in terms of both the event characteristics and the impact on particular places) has hindered the ability to generalize across disasters and countries in terms of common information requirements, especially among response communities.
Remedies for data dissonance in disasters rely less on new money than on the better organization and coordination of the data and resources that already exist. National, local, and urban governments should coordinate the release of specific data sets that are vital to disaster management and planning based on what has been called the “good Samaritan” principle (Iwata and Chen, 2005). Protocols for data sharing drawn up before disasters could facilitate sharing during and after disasters. Protocols for data formatting could also be developed before disasters. Local and urban area data sharing before disasters would also facilitate disaster response.
A template of illustrative local area population and other data could be developed for different kinds of disasters for different kinds of responders over time. At least two efforts to do this are taking place, the Humanitarian Data Model (see Box 3.5) and the Structured Humanitarian Assistance Reporting Effort (SHARE) effort by OCHA. Both efforts stress common formats for reporting data. Focus of both efforts on short-term response and on what is needed for long-term recovery efforts would be useful.
To improve the effectiveness of response, the integration of spatial data and demographic data would be most useful prior to the disaster, not afterward. The development of MEDS to provide the baseline for preparedness and response is one avenue for reducing the demographic dissonance that plagues so many responders to disasters.
RECOMMENDATIONS
Based on the preceding discussion, the committee makes the following recommendations:
-
Develop a template of minimum acceptable population and other geospatial data sets that are required by disaster responders. The data sets should be updated frequently (at least mid-decade if not more frequently) and include digital census enumeration units and other census maps in digital form. [Report Recommendation 4]
-
The standard of open-access census data and sharing (as practiced, for example, by Brazil, South Africa, and the United States) should serve as a model for other agencies and for countries that currently do not operate in an open geospatial environment. This access includes spatial data such as digital boundary files or subnational units of countries of the world. Governments should release specific data sets that are vital to disaster planning and response. Furthermore, international standards should be developed for the release of subnational population data to maintain confidentiality. Countries
-
financially unable to comply with confidentiality standards should be offered incentives to do so. [Report Recommendation 5]
-
Establish a centralized system of access, such as distributed archives and data centers for publicly available subnational data, including data from surveys. The archive would function as such a repository for shared local data and would have the primary responsibility for re-dissemination of data to the appropriate response communities during a disaster. The archives should build upon existing data resources. [Report Recommendation 6]
REFERENCES
Anselin, L., 2004. GeoDa 0.9.5-i Release Notes. Spatial Analysis Laboratory (SAL), Department of Agricultural and Consumer Economics, University of Illinois, Urbana-Champaign.
Bagiire, V., 2006. Bridges.org; presentation to the committee at a workshop held on March 13-14 at the National Academies Keck Center, Washington, D.C. Presentation available through the National Academies Public Access Records Office.
Bilsborrow, R., 2006. University of North Carolina; presentation to the committee on April 20 at the National Academies Keck Center, Washington, D.C. Presentation available through the National Academies Public Access Records Office.
Buchanan-Smith, M., and S. Davies, 1995. Famine Early Warning and Response: The Missing Link. London: Intermediate Technology Publications.
CIA (Central Intelligence Agency), 2006. The World Factbook. Available online at www.cia. gov/cia/publications/factbook/ [accessed October 3, 2006].
CIA, 2007. The World Factbook. Available online at https://www.cia.gov/cia/publications/factbook/index.html [accessed March 19, 2007].
CRED (Center for Research on the Epidemiology of Disasters), 2006. “Turkey” country profile. EM-DAT: The OFDA/CRED International Disaster Database. Available online at http://www.em-dat.net/disasters/countryprofiles.php [accessed October 3, 2006].
Doocy, S., 2007. Identify ways in which sub-national demographic and geographic data and tools could be used to help decision makers provide useful information to populations at risk. In National Research Council, Tools and Methods for Estimating Populations at Risk from Natural Disasters and Complex Humanitarian Crises. Washington, D.C.: The National Academies Press.
Doocy, S., A. Rofi, G. Burnham, and C. Robinson, 2006. Tsunami mortality in Aceh Province, Indonesia. Presented at the Population Association of America: Annual Meeting 2006, Los Angeles, March 30-April 1.
Durrani, A.J., A.S. Elnashai, Y.M.A. Hashash, S.J. Kim, and A. Masud, 2005. The Kashmir Earthquake of October 8, 2005: A Quicklook Report. Mid-America Earthquake Center, CD Release 05-04, December.
Eguchi, R.T., C. Huyck, B. Houshmand, B. Mansouri, M. Shinozuka, F. Yamazaki, and M. Matsuoka, 2000a. The Marmara Earthquake: A View from Space. Section 10: The Marmara, Turkey Earthquake of August 17, 1999: Reconnaissance Report, Technical Report MCEER-00-0001, Multidisciplinary Center for Earthquake Engineering Research, University at Buffalo, New York.
Eguchi, R.T., C. Huyck, B. Houshmand, B. Mansouri, M. Shinozuka, F. Yamazaki, M. Matsuoka, and S. Ülgen, 2000b. The Marmara, Turkey earthquake: Using advanced technology to conduct earthquake reconnaissance. In Research Progress and Accomplishments
Report 1999-2000: A Selection of Papers Chronicling Technical Achievements of the Multidisciplinary Center for Earthquake Engineering Research (Buffalo, New York). Available online at http://mceer.buffalo.edu/publications/resaccom/00-SP01/ [accessedOctober 3, 2006].
Entwisle, B., and P. Stern (eds.), 2005. Population, Land Use and Environment: Research Directions. Washington D.C.: The National Academies Press.
FEMA (Federal Emergency Management Agency), 2004. Hurricane Pam Exercise Concludes. Press release R6-04-093, July 23. Available online at http://www.fema.gov/news/newsrelease.fema?id=13051 [accessed October 3, 2006].
GNOCDC (Greater New Orleans Community Data Center), 2006. Rapid Population Estimate Survey Report, January 28-29. Available online at www.gnocdc.org/reports/NOLAPopEstimate.pdf [accessed October 3, 2006].
Goodchild, M.F., 2003a. Geospatial data in emergencies. In S.L. Cutter, D.B. Richardson, and T.J. Wilbanks, eds., The Geographical Dimensions of Terrorism. New York: Routledge, pp. 99-104.
Goodchild, M.F., 2003b. Data modeling for emergencies. In S.L. Cutter, D.B. Richardson, and T.J. Wilbanks, eds., The Geographical Dimensions of Terrorism. New York: Routledge, pp. 105-109.
Goodchild, M.F., M.J. Egenhofer, C. Kottman, and R. Fegeas, 1999. Interoperating Geographic Information Systems. New York: Springer.
Isaaks, E.H. and R.M. Srivastava, 1989. An Introduction to Applied Geostatistics. New York: Oxford University Press.
Iwata, S., and R.S. Chen, 2005. Science and the digital divide. Science 310(5747):405.
Kaiser, R., P.B. Speigel, A.K. Henderson, and M.L. Gerber, 2003. The application of geographic information systems and global positioning systems in humanitarian emergencies: Lessons learned, programme implications and future research. Disasters 27(2): 127-140.
Laska, S., 2004. What if Hurricane Ivan had not missed New Orleans? Natural Hazards Observer 29(2); available online at http://www.colorado.edu/hazards/o/nov04/nov04c.html.
Liverman, D., E. Moran, R.R. Rindfuss, and P.C. Stern (eds.), 1998. People and Pixels: Linking Remote Sensing and Social Science. Washington, D.C.: National Academy Press.
MacDonald, R., 2005. How women were affected by the tsunami: A perspective from Oxfam. PLoS Med 2(6):e178.
MacEachren, A.M., and G. Cai, 2006. Supporting group work in crisis management: Visually mediated human-GIS-human dialogue. Environment and Planning B: Planning and Design 33(3):435-456.
Mather, M., K.L. Rivers, and L.A. Jacobson, 2005. The American Community Survey. Population Reference Bureau. Population Bulletin 60(3):5-24.
Maxwell, D., and B. Watkins, 2003. Humanitarian information systems and emergencies in the Greater Horn of Africa: Logical components and logical linkages. Disasters 27(1):72-90.
Messick, S., 2006. Veterans For America; presentation to the committee at a workshop held on March 13-14, at the National Academies Keck Center, Washington, D.C. Presentation available through the National Academies Public Access Records Office.
Montana, L., 2006. ORC Macro; presentation to the committee at a workshop held on March 13-14 at the National Academies Keck Center, Washington, D.C. Presentation available through the National Academies Public Access Records Office.
NRC (National Research Council), 2001. Forced Migration and Mortality. Washington, D.C.: National Academy Press.
NRC, 2007. Successful Response Starts with a Map: Improving Geospatial Support for Disaster Management. Washington, D.C.: The National Academies Press.
Noji, E.K., 2005. Estimating population size in emergencies. Bulletin of the World Health Organization 83(3):164.
PRB (Population Reference Bureau), 2005. 2005 World Population Data Sheet of the Population Reference Bureau. Available online at http://www.prb.org/pdf05/05WorldDataSheet_Eng.pdf [accessed October 3, 2006].
Peckman, R., 2004. GIS, visualization and spatial analysis for major hazards in Europe. Poster Session at Seventh AGILE Conference on Geographic Information Science, Heraklion, Greece, April 29-May 1.
Rodríguez,H., T. Wachtendorf,J.Kendra, and J. Trainor, 2006. A snapshot of the 2004 Indian Ocean tsunami: Societal impacts and consequences. Disaster Prevention and Management 15(1):163-177.
Scawthorn, C., 2000. Introduction, The Marmara Turkey Earthquake of August 17, 1999: Reconnaissance Report. MCEER Multidisciplinary Center for Earthquake Engineering Research, University at Buffalo. Available online at http://mceer.buffalo.edu/publications/Reconnaissance/00-0001/default.asp?sH2=-1&oH0=-1&oH1=-1&oH3=-1&oH4=-1 [accessed October 3, 2006].
Subramanian, A., 2006. Madras Christian College, India; presentation to the committee at a workshop held on March 13-14 at the National Academies Keck Center, Washington, D.C. Presentation available through the National Academies Public Access Records Office.
Tufte, E.R., 1983. The Visual Display of Quantitative Information. Cheshire, Connecticut: Graphics Press.
Ulgen S., 2006. United Nations; presentation to the committee at a workshop held on March 13-14 at the National Academies Keck Center, Washington, D.C. Presentation available through the National Academies Public Access Records Office.
UNEP (United Nations Environment Programme), 2006. After the Tsunami: Rapid Environmental Assessment. Available online at http://www.unep.org/tsunami/reports/TSUNAMI_report_complete.pdf [accessed October 3, 2006].
UNHCR (United Nations High Commissioner for Refugees), 1990. Handbook for Emergencies. Geneva, p. 370.


