
2
Nutrition-Related Health Concerns, Dietary Intakes, and Eating Behaviors of Children and Adolescents
INTRODUCTION
Good nutrition during childhood and adolescence is essential for growth and development, health and well-being, and the prevention of some chronic diseases. Yet many American children’s diets fall considerably short of recommended dietary standards. Furthermore, poor diet and physical inactivity, resulting in an energy imbalance, are the most important factors contributing to the increase in obesity in childhood. Obesity is the most pressing challenge to nutritional health in this first decade of the 21st century (CDC, 1999). The major nutrition issues among children and adolescents have shifted from nutrient deficiency diseases, common in the first half of the 20th century, to concerns today about overconsumption, poor dietary quality, and food choices. However, food insecurity remains a concern among the poor (Briefel and Johnson, 2004). This chapter provides an overview on nutrition-related health concerns, current dietary and nutrient intakes, and dietary trends over the past 20–40 years for children and adolescents.
Importance of Healthful Dietary Behaviors in School-Age Children and Adolescents
During childhood and adolescence, good nutrition and dietary behaviors are important to achieve full growth potential and appropriate body composition, to promote health and well-being, and to reduce the risk of
chronic diseases in adulthood. Children require sufficient energy, protein, and other nutrients for growth as well as maintenance of body functions. Nutrient needs tend to parallel rates of growth. Growth continues at a steady rate during childhood, then accelerates during adolescence, creating increases in nutrient needs to support the rapid growth rate and increase in lean body mass and body size (Story et al., 2002a). During puberty, adolescents achieve the final 15 to 20 percent of stature, gain 50 percent of adult body weight, and accumulate up to 40 percent of skeletal mass (Story et al., 2002a). Inadequate intakes of energy, protein, or certain micronutrients will be reflected in slow growth rates, delayed sexual maturation, inadequate bone mass, and low body reserves of micronutrients (Story et al., 2002a).
In addition to the impact on growth and development, children’s diets are important to ensure overall health and well-being. Dietary practices of children and adolescents affect their risk for a number of health problems, including obesity, iron deficiency, and dental caries. Inadequate nutrition also lowers resistance to infectious disease, and may adversely affect the ability to function at peak mental and physical ability. Obesity in children and adolescents is associated with a number of immediate health risks, such as high blood pressure, type 2 diabetes (T2D), metabolic syndrome, sleep disturbances, orthopedic problems, and psychosocial problems (Daniels, 2006; IOM, 2005b). Furthermore, obese adolescents are likely to remain overweight as adults (IOM, 2005b). Indeed, longitudinal epidemiological studies provide evidence that obesity, hypercholesterolemia, and hypertension track from childhood into adulthood and lifestyle choices such as diet and excess caloric intake influence these conditions (Gidding et al., 2005).
There is concern about long-term health as certain dietary patterns, developed in childhood and carried into adulthood, result in an increased risk for chronic diseases, such as obesity, heart disease, osteoporosis, and some types of cancer later in life. Some of the physiological processes that lead to diet-related chronic diseases have their onset during childhood. For example, studies indicate that the process of atherosclerosis begins in childhood (Gidding et al., 2005). Nutritional factors contribute significantly to the burden of preventable illnesses and premature deaths in the United States (DHHS, 2000). Four of the ten leading causes of death in adults are diet related: diabetes, coronary heart disease (CHD), certain cancers, and strokes. Diet is also associated with osteoporosis. Dietary factors also contribute to reproductive health, e.g., adequate consumption of folic acid to prevent neural tube defects in infants.
Dietary patterns are influenced by behavioral choices and environmental factors. It may be easier to change children’s health behavior than adults’ behavior. Childhood offers the opportunity to provide the solid foundation needed for healthful lifelong eating patterns. The importance of applying
a life-course approach, starting early in life, to the prevention of chronic diseases and obesity has also been emphasized (WHO, 2003). A principal goal of public health is to give people the best chance to enjoy a long and healthy life. Children represent the nation’s present and its future.
OVERVIEW OF CHILDREN’S NUTRITION-RELATED HEALTH CONCERNS
The rising rate of obesity in children has become a major health concern, both because of its impact on childhood health and its potential effect on the development of chronic disease in adulthood. Obesity status is usually indicated by the body mass index (BMI), which is a measure in which weight is adjusted for height. More specifically, BMI is defined as weight in kilograms divided by height in meters squared. For adults, weight status is based on the absolute BMI level, and in children BMI percentile. BMI measurements in children adjust the children’s weight and stature by their age and gender. In this report, the term “obesity” is used to refer to children and adolescents who have a BMI at or above the age and sex-specific 95th percentile of the BMI charts developed by the Centers for Disease Control and Prevention (CDC) in 2000. Those children and adolescents who have a BMI between the 85th and 95th percentile for age and sex are termed at risk for obesity. In most children and youth, a BMI level at or above the 95th percentile indicates elevated body fat and reflects the presence or risk of related chronic disease (IOM, 2005b, 2007).
Trends in Childhood Obesity
Childhood obesity has been increasing steadily, particularly during the past two decades. The number of children above the 95th percentile of weight for height has tripled among those in the age bracket of 12 to 19 years, rising from 5 percent in 1976–80 to 17 at present (Ogden et al., 2002, 2006). The National Health and Nutrition Examination Survey (NHANES) III (1988–1994) found an increase from 7 to 11 percent in obesity for 6- to 11-year-old children, compared to NHANES II a decade earlier (1976–1980) (Ogden et al., 2002). Further NHANES survey data (1999–2004) confirmed the continued rise in obesity. Another 15 percent of children and adolescents are estimated to be at risk for obesity (85th to 95th percentile), making a third of children and adolescents obese or at-risk for obesity (Ogden et al., 2002, 2006). These trends are shown in Figure 2-1.
Although childhood obesity has increased in every demographic population group in the United States, some have been more affected than oth-
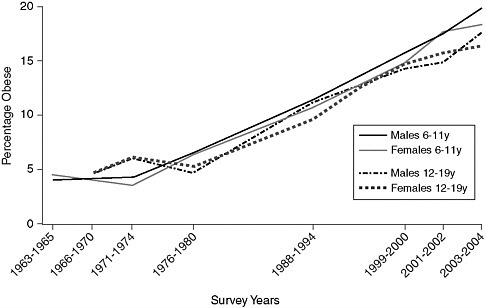
FIGURE 2-1 Trends in child and adolescent obesity in males and females aged 6–19 years.
NOTE: Obesity is defined as a body mass index (BMI) at or above the age- and gender-specific 95th-percentile cutoff points from the 2004 Centers for Disease Control and Prevention BMI Charts. The data on which this figure is based may have a standard error of 20 to 30 percent.
SOURCE: Derived from IOM, 2005b; Ogden et al., 2002/2006.
ers. For example, using data from the 2003–2004 NHANES, Ogden et al. (2006) reported obesity rates of 19 and 16 percent for white boys and girls respectively, aged 6–19 years. The rates of obesity in African American children were 18 percent for boys and 26 percent for girls, and among Mexican-American children, the rates were 22 percent for boys and 17 percent for girls. Other research has shown similar or higher rates of obesity (Sorof et al., 2004). In samples of minority children from three states, 29 percent were obese and another 19.8 percent were at risk for obesity (Jago et al., 2006). In New York City nearly half of 2,700 students surveyed were at risk for obesity (Thorpe et al., 2004). The average rate of obesity in this student population was 31 percent among Hispanic (36 percent among boys), 23 percent among African American, 16 percent among white, and 14 percent among Asian children (Thorpe et al., 2004). Childhood obesity status tracks into adulthood obesity status (Deshmukh-Taskar et al., 2006; Raitakari et al., 2005).
Associations Between Obesity and Chronic Disease
The increased prevalence of obesity in childhood is of concern because of the strong association between obesity and cardiovascular disease risk, hypertension, dyslipidemia, and T2D that begins in childhood and continues into adulthood.
Cardiovascular Disease
Cardiovascular disease (CVD) is the leading cause of death and disability in the U.S., responsible for some 500,000 deaths a year. Most CVD is the result of the process of atherosclerosis whereby plaque builds up in blood vessels. About 50 percent of CVD is related to coronary artery disease. Although the clinical effects of the process do not usually show up until middle age, atherosclerosis begins in childhood and the extent of atherosclerotic change in childhood and young adulthood is correlated with elevated risk in adults (Rodriguez et al., 2006; Williams et al., 2002).
Risk factors for CVD, such as elevated serum cholesterol and blood pressure occur with increased frequency in obese children and adolescents compared to children with a normal weight. In a population-based sample, approximately 60 percent of obese children aged 5 to 10 years had at least one physiological CVD risk factor, such as elevated total cholesterol, triglycerides, insulin, or blood pressure, and 25 percent had two or more CVD risk factors (Freedman et al., 1999). These risk factors are related in some degree to lifestyle factors such as diet and physical activity. The American Heart Association concludes that existing evidence indicates that primary prevention of atherosclerotic disease should begin in childhood (Williams et al., 2002).
Hypertension
Hypertension contributes substantially to CVD, renal failure, and premature death. The diagnosis of hypertension in children and adolescents is based on the distribution of blood pressure measurement in healthy children. Those with an average systolic or diastolic blood pressure above the 95th percentile for age, gender, and height on three separate occasions are considered to be hypertensive, while those between the 90th and 95th percentile are considered high normal or prehypertensive and are at increased risk for hypertension (AAP, 2004a). NHANES 1999–2000 found that 8 percent of children and adolescents aged 12 to 19 years had hypertension. Recent studies with participants who were predominantly minority and, on average, higher in weight, have shown around 20 to 25 percent of children with hypertension or prehypertension. The rates increase with higher BMIs,
from 14 percent of those with normal BMI percentile, to 27 percent of those at risk for obesity, to 39 percent of those who are obese (Jago et al., 2006). This finding differs by ethnic group, ranging from 25 percent among Hispanic to 16 percent among Asian children (Sorof et al., 2004). The relative risk for hypertension continues to be significant for obesity even when ethnicity, gender, and other factors are controlled. Comparing rates between the 1988–1994 and 1999–2000 NHANES shows that hypertension among children and adolescents has increased over time. This increase is partially accounted for by the increase in obesity (Muntner et al., 2004).
Diabetes
Type 2 diabetes is a complex glucose and insulin metabolic disease that can lead to serious consequences such as diabetic retinopathy, peripheral neuropathy, and kidney failure. Diabetes also increases the risk of atherosclerosis with its attendant risks of stroke, heart attack, and hypertension. Obesity in children is a major element in insulin resistance and is thus a risk factor for T2D. Type 2 diabetes has been considered an adult disease, commonly diagnosed in persons 40–74 years of age. However, the diagnosis of T2D has increased dramatically in children and adolescents and is related to body fatness.
Although the rate in years past was about 5 to 10 percent of the population diagnosed with the disease, it is now estimated that, for individuals born in the U.S. after 2000, the lifetime risk of being diagnosed with T2D is 30 percent for boys and 40 percent for girls if obesity rates level off (Narayan et al., 2003). The lifetime risk of developing diabetes is even higher in some ethnic minorities at birth and at all ages. Indeed, in some communities, diabetes will become normative, that is, more individuals will have it than not. These high rates of diagnosis in children and adolescents will have considerable public health consequences: the longer a person has the disease, the greater the risk of complications. This will have an impact on schools, colleges, and workplaces, as each setting will have to deal with the increasing effects of this severe and debilitating disease in the form of days lost from school or work, discomfort, ill health, disabilities, and increased medical visits. In addition, the cost of treating diabetes, which has been estimated at $132 billion a year, will increase as today’s children and adolescents reach adulthood (American Diabetes Association, 2003).
Metabolic Syndrome
Metabolic syndrome is a constellation of clinical findings, including abdominal obesity, high blood pressure, dyslipidemia, and high glucose levels, that confers increased risk for CVD and T2D. Metabolic syndrome is also called “syndrome X” and insulin resistance syndrome. An analysis of data
from NHANES III (1988–1994) found that the overall prevalence of metabolic syndrome among all adolescents aged 12 to 19 years was 4.2 percent (6 percent in males and 2 percent in females). The syndrome was present in more than a fourth (28.7 percent) of obese adolescents, compared to 6.8 percent in adolescents at risk for obesity and 0.1 percent of those with a BMI below the 85th percentile (p <.001). Based on population-weighted estimates, this means that in the U.S. approximately 900,000 adolescents have metabolic syndrome (Cook et al., 2003). Another study found that the prevalence of metabolic syndrome increased with the severity of obesity and reached 50 percent in severely obese children and adolescents (Weiss et al., 2004). Other studies have shown clustering of components of metabolic syndrome with coronary and aortic atherosclerosis in young adults (Berenson et al., 1998).
Increasing childhood obesity rates affect not only individuals and their families, but also impose direct and indirect economic costs in the forms of lost productivity, disability, morbidity, and premature death. States and communities will have to allocate new resources to prevent and treat the various metabolic syndrome comorbidities. Indeed, the great advances in the nation’s health as a result of the decline in nutritional deficiencies and the promise of advances in biomedical discoveries may be offset by the burden of illness, disability, and death resulting from metabolic syndrome and comorbidities. Therefore, schools have the opportunity and responsibility to address this nutritional and social problem within the school-age population.
Bone Health and Osteoporosis
Osteoporosis is a complex disorder with many contributing factors. Osteoporosis is characterized by low bone mass and microarchitectural deterioration of bone tissue, resulting in fragility and an increased risk of fracture (WHO, 2003). Osteoporotic fractures are a major cause of morbidity and disability in older people. An estimated 10 million Americans over age 50 have osteoporosis and another 34 million are at risk (DHHS, 2004a). Each year an estimated 1.5 million Americans suffer an osteoporotic-related fracture. One out of every two women over 50 years of age will have an osteoporosis-related fracture in her lifetime, with risk of fracture increasing with age (DHHS, 2004a). Health-care costs associated with osteoporotic fractures are estimated at $12–18 billion per year in 2002 dollars (DHHS, 2004a). Because of the expected increase in the number of individuals in the age range of highest risk, the incidence of hip fractures in the United States may triple by the year 2040. Although bone disease often strikes later in life, the importance of maintaining bone health and early prevention is now well recognized. It is believed that with good nutrition (especially adequate intake of calcium and vitamin D) and physical activity throughout life,
individuals can achieve and maintain good bone health and significantly reduce the risk of bone disease and fractures (DHHS, 2004a).
Because of the importance of bone health in childhood, osteoporosis can be viewed as a pediatric disorder that manifests itself later in life. Late childhood and the adolescent years provide the window of opportunity to influence lifelong bone health. Approximately 45 percent of the adult skeleton is acquired between the ages of 9 and 17 years (Weaver and Heaney, 2006). Approximately 60 to 80 percent of bone mass is genetically determined, but hormones and lifestyle factors play a role in determining peak bone mass, which is typically achieved by the time an individual reaches the mid-teens to early 20s (DHHS, 2004a). Development of a higher peak bone mass during the adolescent years likely protects against age-related bone loss (DHHS, 2004a; Heaney et al., 2000; Weaver et al., 1999). Because the amount of bone accumulated during pubertal growth depends to some extent on the amount of calcium and vitamin D in the diet, low calcium intakes during skeletal formation may result in decreased bone mass (Heaney et al., 2000). Variations in calcium nutrition in late childhood and adolescence may account for a 5- to 10-percent difference in peak bone mass resulting in a difference of 25- to 50-percent of hip fracture incidence later in life (Heaney et al., 2000). Epidemiological evidence supports the hypothesis that low bone mass may be a contributing factor to fractures in children (Greer and Krebs, 2006).
Many studies have examined the association between calcium intake during childhood and adolescence and bone health. Of 52 calcium intervention studies, all but two showed a correlation between improved bone density at higher intakes, greater bone gain during growth, reduced bone loss in the elderly, or reduced fracture risk (Heaney, 2000). Maintaining adequate calcium intake during childhood and adolescence is critical to achieving peak bone mass (Greer and Krebs, 2006). As is discussed below, the majority of older children and adolescents do not reach the recommended intakes of calcium.
Iron Deficiency
Iron deficiency is the most common nutritional deficiency in the world. Iron deficiency represents a spectrum ranging from iron depletion, which causes no physiological impairments, to iron-deficiency anemia, which affects the functioning of several organ systems (CDC, 1998). Iron deficiency and anemia are known to impair psychomotor development, affect physical activity and work capacity, lower resistance to infection, and, in pregnant women, increase the risk of preterm delivery and delivering a low birth-weight infant (IOM, 2001). Iron deficiency has also been linked to poorer cognition and behavioral and learning problems among school-age children and adolescents (Grantham-McGregor and Ani, 2001; Halterman
et al., 2001; Pollitt and Mathews, 1998). For example, one recent study investigated the relationship between iron deficiency and test scores among a nationally representative sample of school-age children and adolescents and found lower standardized math scores among iron-deficient children and adolescents, including those with iron deficiency without anemia (Halterman et al., 2001).
Iron deficiency is highest among toddlers, women of childbearing age, and pregnant women. Adolescents undergoing rapid growth periods are also at risk as iron requirements increase dramatically as a result of the expansion of total blood volume, the increase in lean body mass, and the onset of menses in young females (Beard, 2000). According to NHANES (1999–2000) data of all age groups, the prevalence of iron deficiency was highest (16 percent) among females aged 16–19 years. Among children and adolescents aged 12–15 years, 9 percent of females and 5 percent of males had iron deficiency (CDC, 2002). National data indicate that only one-fourth of all females of childbearing age meet the dietary recommendations for iron (15 mg/day). Primary prevention of iron deficiency means ensuring an adequate intake of iron (CDC, 1998). This includes selecting iron-rich foods and increasing consumption of foods that enhance iron absorption.
Dental Caries
Although dental caries (tooth decay) is largely preventable, it is the single most common chronic disease among American children and is twice as common among low-income compared to higher-income families (DHHS, 2004b). Low-income children have about 12 times more restricted activity days due to dental-related diseases than children from higher-income families. Pain due to untreated tooth decay can lead to problems in eating, speaking, and attending to learning (CDC/DHHS, 2006). The most recent NHANES data (1999–2002) found that, among all children aged 2 to 11 years, 41 percent had dental caries in primary teeth. There are disparities evident with children in lower-income households and African American, Hispanic, and American Indian children having a higher prevalence of dental problems (DHHS, 2000, 2004b). Among children and adolescents aged 6 to 19 years, 42 percent had dental caries in permanent teeth (Beltran-Aguilar et al., 2005). Topical fluoride in toothpaste, fluoridated water, and preventive dental care were found to have a significant impact on reduction of caries risk (Touger-Decker and van Loveren, 2003).
The role of diet in the etiology of dental caries is well established. There is consistently strong evidence that frequent consumption of sugar and other fermentable carbohydrates is associated with the development of caries (Lingstrom et al., 2003). Several reviews of the literature concluded a causal relationship between sugars and dental caries, although the relationship is not as strong as in the pre-fluoride era (Lingstrom et al., 2003;
Touger-Decker and van Loveren, 2003; WHO, 2003; Zero, 2004). Dietary habits of children remain a major component of the caries process (Dye et al., 2004). Furthermore, given the American propensity for frequent snacking, it is likely that many starch-containing processed foods also contribute to caries formation (Zero, 2004).
Other important factors in caries development are food form (e.g., liquid, solid, sticky), duration of exposure, nutrient composition, sequence of eating, potential to stimulate saliva, and presence of buffers (e.g., cheese, gum containing xylitol) (Moynihan and Petersen, 2004; Touger-Decker and Mobley, 2003). Risk factors related to food consumption include nocturnal meal consumption and frequent sugar consumption (Bankel et al., 2006), and the form of sugar-containing food (Marshall et al., 2007). Intake frequency of sugars is considered the most important dietary factor in caries development (Lingstrom et al., 2003; Moynihan and Petersen, 2004). Tooth erosion refers to the gradual loss of the outside, hard surface of the tooth due to chemical, not bacterial, processes (Touger-Decker and Mobley, 2003). Tooth erosion involving frequent intake of acidic foods and beverages weakens tooth integrity and further increases caries risk (Touger-Decker and Mobley, 2003). Tooth erosion is increasing in industrialized countries and is thought to be related to increased consumption of acidic beverages (e.g., soft drinks, sports drinks, and fruit juices) (Moynihan and Petersen, 2004). Because of the synergistic relationship between nutrition and oral health, and because nutrition is a critical component of oral health, the dietary habits of children and adolescents are needed to improve oral health.
Disordered Eating Behavior
Relative to many other public health problems, full-syndrome eating disorders are fairly rare among children and adolescents; however, they are a serious cause of morbidity and mortality in this group. More than 10 percent of individuals with anorexia nervosa admitted to university hospitals eventually die from the disorder (APA, 2000). Anorexia nervosa (characterized by self-starvation, weight loss, intense fear of weight gain, and body image distortion) (APA, 2000) affects less than 1 percent of adolescent females (Emans, 2000). Bulimia nervosa affects 1 to 5 percent of adolescent girls (Emans, 2000) and is characterized by binge eating and purging (APA, 2000). The onset of eating disorders often occurs during adolescence or early adulthood (Emans, 2000). About 5 to 10 percent of all adolescents with an eating disorder are male (APA, 2000).
Eating disorders are viewed as multifactor disorders with environmental and social factors, psychological predisposition, and biological and genetic predisposition. “Dieting” is a common entry point in both anorexia nervosa and bulimia nervosa, with the greatest risk being the group of se-
vere dieters (Rome et al., 2003). Sociocultural and environmental factors as they relate to ideal body shape are thought to play an important role in the development of eating disorders. Eating disorders are more common in countries and cultures where female thinness is associated with attractiveness (Rome et al., 2003).
More common in the preadolescent and adolescent population are dieting and disordered eating behaviors. Dieting is a common and widespread practice especially among girls. Nationwide in 2005, 62 percent of high school girls (whites, 64 percent; African Americans, 53 percent; Hispanics, 64 percent) reported trying to lose weight during the 30 days preceding the survey. Thirty percent of high school boys were trying to lose weight (Eaton et al., 2006). Nearly 17 percent of females had gone without eating for 24 hours or more, 8 percent had taken diet pills, and 6 percent had induced vomiting or taken laxatives to lose weight during the previous 30 days (Eaton et al., 2006). Studies have shown that adolescent girls using unhealthy weight control behaviors consume fewer fruits, vegetables, and grains, and have lower intakes of calcium, iron, and other micronutrients compared to girls using healthy weight control methods or not dieting (Neumark-Sztainer et al., 2004; Story et al., 1998). A recent longitudinal study of adolescents found that dieting and unhealthy weight control behaviors among adolescents predicted weight gain, obesity status, disordered eating, and risk of eating disorder five years later (Neumark-Sztainer et al., 2006). These studies suggest that a shift is needed away from dieting and drastic weight control measures and toward lifelong healthful eating and weight control behaviors and physical activity behaviors.
DIETARY INTAKE AND CONSUMPTION PATTERNS OF CHILDREN AND ADOLESCENTS
Are Children’s Diets Meeting the Dietary Guidelines for Americans?
The general dietary recommendations for those aged two years and older in the Dietary Guidelines for Americans (DGA) (DHHS/USDA, 2005) emphasize a diet that relies primarily on fruits and vegetables, whole grains, low-fat and nonfat dairy products, beans, fish, and lean meat. The guidelines stress meeting recommended dietary intakes within energy needs; consuming a variety of nutrient-dense foods and beverages; and limiting intakes of total, saturated, and trans fat, cholesterol, salt, and added sugars. The guidelines, as they pertain to children and adolescents, are consistent with other dietary recommendations for children and adolescents put forth by the American Heart Association (Gidding et al., 2005) and the American Academy of Pediatrics (AAP, 2004b).
Despite the importance of healthful eating patterns during childhood and adolescence, studies have consistently shown that this group has poor
eating habits and does not meet dietary recommendations (Enns et al., 2002, 2003; Gleason and Suitor, 2001b; IOM, 2007; Moshfegh et al., 2005; Munoz et al., 1997). National data found that no more than 2 percent of children and adolescents met the Food Guide Pyramid recommendations, and 16 percent did not meet any of the food group recommendations (Munoz et al., 1997, 1998). Areas of concern include low intakes of fruits, vegetables, whole grains, fiber, and calcium-rich foods, and higher than recommended intakes of foods and beverages high in fat, sodium, and added sugars. The consumption of added sugars, saturated fats, and trans fats provides calories but few essential nutrients (DHHS/USDA, 2005). Current dietary patterns among children and adolescents lead to median intakes be-
|
BOX 2-1 Why Not Just Fortify? The Scientific Basis for Promoting Fruits, Vegetables, and Whole Grains The scientific basis for the Dietary Guidelines for Americans on fruits, vegetables, and whole grains is the epidemiological evidence that individuals who consume generous amounts of these foods on a regular basis have lower rates of cardiovascular disease (CVD), several cancers, diabetes, and other chronic diseases. These foods contain nutrients and phytochemicals that may lower chronic disease risk directly, or via established risk factors such as blood pressure and plasma cholesterol levels. In addition, diets high in these foods tend to have lower levels of fat, saturated fat, and cholesterol. Clinical trials conducted with beta-carotene, vitamins A, C, and E, folic acid, and selenium (alone or in combination) examined the role of specific food components hypothesized to reduce chronic disease to determine if adding these components to other foods or supplements would have the same health benefits as consuming plant foods. However, the U.S. Preventive Services Task Force (USPSTF) concluded that the evidence is insufficient to recommend for or against the use of these food components as supplements for the prevention of chronic disease (USPSTF, 2003), and the National Institutes of Health Consensus Conference also concurs (NIH, 2006). Underscoring the important scientific uncertainties concerning health effects of individual nutrients, it is noteworthy that the USPSTF recommends that beta-carotene not be used as a supplement, either alone or in combination, because of the evidence that it may increase the risk of lung cancer in high-risk individuals (USPSTF, 2003). More recent reports have confirmed the finding that these supplements are not effective in reducing cancer or CVD (Bjelakovic et al., 2004; Manson, 2003; Pham and Plakogiannis, 2005) and further suggested that high-dosage supplements of vitamin E may increase all-cause mortality (Miller |
low recommended values for many nutrients (DHHS, 2000; DHHS/USDA, 2004; Gidding et al., 2005).
Emerging evidence for the health benefits of fruits, vegetables, and whole grains has important implications for strategies to improve children’s diets. Specifically, it reinforces the importance of improving the overall quality of food intake rather than nutrient-specific strategies such as fortification and supplementation, and thus is consistent with the Dietary Guidelines for Americans (see Box 2-1). In addition, regular consumption of fortified beverages can contribute to the displacement of nutrient-dense beverages such as milk (see discussion of sweetened beverages below).
|
et al., 2005). Neuhouser et al. (2003) reported that the use of a high-dose beta-carotene and retinyl palmitate supplement negated the beneficial effects of a diet high in fruits and vegetables. The reasons for these unexpected findings remain unclear. The conclusion drawn from negative findings in clinical trials is that the mechanisms by which plant foods decrease disease risk are likely the cumulative effect of numerous phytochemicals on multiple biochemical pathways, rather than the result of single nutrients or phytochemicals. An estimated 5,000+ phytochemicals have been identified in fruits, vegetables, and whole grains, but a large percentage still remain unknown and the study of their individual and combined effects of these on health and disease is just beginning (Jeffery, 2005; Liu, 2004). The concentration of individual and major classes of phytochemicals varies widely across different forms of fruits and vegetables and their biological activity does not necessarily correlate with the levels of nutrients in foods. For example, a 100-gram serving of apple (with peel) contains only 5.7 mg vitamin C, representing about 13 percent of the U.S. Recommended Dietary Allowance for 9- to 13-year olds. Yet the phytochemicals have antioxidant activity 250 times greater than that of the vitamin C alone (Liu, 2004). This suggests that, given current scientific knowledge, the use of nutrient content alone as a guide for the relative healthfulness of various foods or products is incomplete and potentially misleading. In summary, the evolving understanding of plant foods highlights three key points. First, plant foods are compositionally complex. Second, the health benefits of plant foods appear to be closely related to their compositional complexity, not to individual components. Third, the levels of vitamins and minerals in foods do not necessarily correlate well with the other classes of beneficial components. These points reinforce the need for nutrition standards to go beyond the criteria of upper limits (for fat, saturated fat, etc.) and qualifying levels (for vitamins and minerals), and to place at least equal emphasis on the health benefits of fruits, vegetables, and whole grains. |
Overview of Nutrient and Energy Intakes of Children and Adolescents
Nutrient Intakes
The Dietary Guidelines Advisory Committee (DGAC) reviewed the scientific literature and concluded that, based on dietary intake data or evidence of public health problems, intake levels of the following nutrients are of concern for children and adolescents: calcium, potassium, fiber, magnesium, vitamin E, and, for adolescent girls, iron and folate. The committee also found that in general, Americans consume too many calories and too much saturated and trans fat, cholesterol, added sugars, and salt (DHHS/USDA, 2004).
The most recent nationwide dietary intake data are for the years 2001– 2002 and were collected as part of NHANES as 2 days of dietary data based on 24-hour recalls. NHANES is a multistage, stratified sample and was representative of the U.S. population. A recent report examined usual nutrient intakes from food compared to Dietary Reference Intakes1 (DRIs) (Moshfegh et al., 2005) and found the following:
-
Nearly all children 4–8 years old, and males 9–18 years old had adequate intakes (based on Estimated Average Requirement) of protein, folate, vitamin B6, thiamin, riboflavin, niacin, iron, zinc, copper, and phosphorus.
-
The majority (>80 percent) of children and adolescents had inadequate dietary intakes of vitamin E. Vitamin A intakes were inadequate for one third of females aged 9–13 years and more than half of adolescents aged 14–18 years. Vitamin C intake was inadequate for one-fourth of males and 42 percent of females aged 14–18 years. Magnesium intake was inadequate among 9- to 13-year-olds.
-
For dietary fiber and potassium, less than 3 percent of children and adolescents had intakes above the Adequate Intake level.
-
Calcium intake was low for many children and adolescents. The following percentage of children had intakes below the Adequate Intake: 31 percent of children aged 4- to 8-years, 70 percent of males aged 9- to 18-years, and 92 percent of females aged 9- to 18-years.
-
Females aged 14–18 years were at especially high risk of inadequate vitamin and mineral intakes, much higher than any of the other age and gender groups. For example, 54 percent had inadequate intake of vitamin A, 42 percent had inadequate intake of vitamin C, 91 percent had inadequate intake of magnesium, and 19 percent had inadequate intake of folate.
The results of the NHANES 2001–2002 dietary survey are consistent with previous findings from the Continuing Survey of Food Intakes by Individuals (CSFII) national surveys (Gleason and Suitor, 2001b). In the 1994–1996 CSFII, most school-age children met the reference standards for the B vitamins (except folate), but many were at risk for inadequate intake of folate, magnesium, and vitamins A and E. Older children had lower intakes than younger ones and females had lower intakes than males. Large numbers of adolescent females failed to consume adequate amounts of vitamins and minerals. For most nutrients, racial/ethnic differences in intakes were small (Gleason and Suitor, 2001b). The results of these national studies point to concerns about the adequacy of the diets of today’s children and adolescents.
Energy Intake
Energy is required to sustain body functions such as respiration, circulation, physical work, and core body temperature, and to meet growth requirements (IOM, 2002/2005). Energy intake should be commensurate with energy expenditure so as to achieve energy balance. Imbalances between intake and expenditure result in weight gain or loss. Energy expenditure depends on age and varies primarily as a function of body size and physical activity, both of which differ greatly among individuals. In children and adolescents, energy requirements include energy costs associated with growth needs and the deposition of tissue. However, the energy cost of growth is relatively low; for the adolescent pubertal growth spurt, it is only about 4 percent of the total energy requirement (IOM, 2002/2005).
Results of surveys of children’s energy intakes present results that vary by gender and age. In NHANES III (1988–1994), the mean energy intakes for children 6–11 years of age were 2,146 kcal/day for boys and 1,793 kcal/day for girls. For adolescents 12–19 years of age, the mean energy intakes were 2,843 kcal/day for boys and 1,977 kcal/day for girls (Troiano et al., 2000). In NHANES, mean energy intakes changed little from the 1970s to 1988–1994, except for an increase in adolescent girls of 192 calories (Troiano et al., 2000). In the CSFII data for the same period, substantial increases were reported in the mean energy intakes of children and adolescents from the mid-1970s to the mid-1990s. Average energy intakes increased by 243 calories for adolescent boys and 113 calories for adolescent girls (Enns et al., 2003). For children aged 6–11 years, there were only modest increases of 100 calories for boys and about 30 calories for girls (Enns et al., 2002). However, as discussed below, a number of methodological studies provided evidence of underreporting in food intake surveys.
Excess weight gain or obesity may develop over several months from a relatively small daily excess (e.g., 50 to 100 calories/day) of calories consumed compared to calories expended (IOM, 2005b). Both excessive
caloric intake and physical inactivity are likely contributors to the caloric imbalance that leads to excessive fat stores and obesity. A recent study modeled the magnitude of energy imbalance responsible for the increase in body weight among U.S. children during the periods 1988–1991 and 1999–2002. They found that a reduction in excess energy intake of 110–165 kcal/day could have prevented this increase (Wang et al., 2006).
Sodium Intake
Sodium is an essential mineral needed for normal fluid and electrolyte balance. Sodium homeostasis is maintained mostly through dietary intake and urinary excretion. The minimal metabolic requirement for sodium is estimated to be no more than 0.18 g/day (IOM, 2005a), although extremely low-sodium diets may lead to decreased intake of other essential minerals such as potassium, calcium, and magnesium. Sodium levels in blood and tissues can be conserved in conditions of low intake through reduced excretion in urine and sweat (Allan and Wilson, 1971; Allsopp et al., 1998).
Increased sodium intake is associated with elevated blood pressure, which in turn is a risk factor for cardiovascular and renal diseases. A dose-dependent but nonlinear relationship has been shown between sodium intake and blood pressure (Alderman, 2002). Genetic factors may increase sodium sensitivity and contribute to cardiovascular risk associated with high sodium intake (Franco and Oparil, 2006).
The bulk of the evidence supporting associations between sodium intake and blood pressure has been derived from studies on adults. Similar associations between sodium intake and increased blood pressure in children are not as well documented, although there is strong evidence to support an association between low sodium intake early in life and lower blood pressure in childhood and into adulthood (Geleijnse et al., 1990, 1997; Martin et al., 2003) and observational evidence to support that blood pressure levels track from childhood into adulthood (Bao et al., 1995; Dekkers et al., 2002; Gillman et al., 1993; Van Lenthe et al., 1994). Evidence from observational studies, randomized clinical trials, and longitudinal studies, however, is inconclusive about an association between reduction of dietary sodium and decreased blood pressure in children and adolescents (IOM, 2005a). Taken together, this evidence suggests that elevated blood pressure during childhood increases the risk for subsequent cardiovascular disease.
Dietary sodium is derived primarily from salt (sodium chloride) and food processing ingredients (e.g., sodium bicarbonate, monosodium glutamate, sodium phosphate, and sodium benzoate). The DGA (DHHS/USDA, 2005) recommendations for those age 2 years and above include
-
consuming less than 2,300 mg (approximately 1 teaspoon of salt) per day; and
-
choosing and preparing foods with little added salt and, at the same time, consuming potassium-rich foods such as fruits and vegetables.
The Dietary Reference Intakes (IOM, 2005a) recommend limiting the sodium intake according to age for children and adolescents up to age 18. The higher number in each age category reflects the Upper Level, the maximum level that is likely to pose no risk of adverse effect.
|
Age (years) |
Daily Sodium Intake Range (mg) |
|
2 to 3 |
1,000 to 1,500 |
|
4 to 8 |
1,200 to 1,900 |
|
9 to 13 |
1,500 to 2,200 |
|
14 to 18 |
1,500 to 2,300 |
In 2006 the American Medical Association, recognizing the long-term adverse health effects of excess sodium in the diet, recommended that the Food and Drug Administration (FDA) limit the amount of sodium that may be added to commercial foods.
Nonnutritive Food Components
Nonnutritive Sweeteners
Nonnutritive sweeteners, which include aspartame, sucralose, acesulfame-K, neotame, sugar alcohols, and saccharin, are usually consumed in coffee, tea, diet soft drinks, and some low-calorie food items. The goal of inclusion of nonnutritive sweeteners in beverages and foods is to provide a desirable sweet taste without additional calories. In considering nonnutritive sweeteners in competitive foods and beverages for school-age children, four related topics were evaluated: safety of nonnutritive sweeteners for children; effect of intake of foods and beverages containing nonnutritive sweeteners on intake of other foods and beverages to be encouraged (fruits, vegetables, whole grains, and nonfat or low-fat dairy products); efficacy of intake of foods and beverages containing nonnutritive sweeteners in contributing to maintenance of a healthy weight in children; and choice (see Chapter 3 for discussion).
Safety The FDA sets a safety standard for foods or food additives, regulated by the Federal Food, Drug, and Cosmetic Act, of “a reasonable certainty of no harm.” The Food Additives Amendment (1958) to the Federal Food, Drug, and Cosmetic Act requires FDA approval for use of an additive prior to its inclusion in a food and requires the manufacturer to prove the additive’s safety for the way it will be used. The process of determining whether a food additive such as a nonnutritive sweetener is safe is initiated
with a Food Additive Petition, submitted by a manufacturer to the FDA for approval. For foods or food additives that are Generally Recognized as Safe (GRAS), the notifier (manufacturer) makes the safety determination and the FDA reviews the notification for approval.
The FDA has reviewed numerous safety studies on nonnutritive sweeteners and has not, to date, found a safety risk associated with their use (FDA, 2006a). Table 2-1 compares four nonnutritive sweeteners that are or have been in common use in the United States and their current approval status.
The American Dietetic Association concluded (ADA, 2004), in a position paper, that there is no clear evidence that nonnutritive sweeteners, when consumed in a diet concordant with the DGA (ADA, 2004), are harmful to health. A variety of noncaloric sweeteners is now on the market (see Table 2-1), and thus the exposure to any single sweetener may be diluted.
There is a paucity of evidence on long-term health effects in humans from nonnutritive sweeteners, particularly resulting from exposure initiated in childhood. Butchko and Stargel (2001) reviewed several published reports assessing the safety of aspartame. Their review included anecdotal reports of adverse health effects (headache, seizures, or allergic-type reactions); it concluded that these effects were “generally mild and common among consumers” and that there was no evidence for a unique or consistent pattern of symptoms that could be associated with aspartame consumption. Lim et al. (2006) prospectively evaluated the hematopoietic and brain carcinogenic potential of aspartame in adult men and women and concluded that their findings did not support an increased risk for cancer.
TABLE 2-1 Comparison of Nonnutritive Sweeteners
|
Nonnutritive Sweetener |
Characteristics |
Approval Status |
Labeling Requirements |
|
Aspartame |
200× sweeter than sugar; contains phenylalanine, a potential harm for individuals with phenylketonuria |
Approved |
Must state that the product contains phenylalanine |
|
Acesulfame-K |
130× sweeter than sugar; cannot be metabolized so contributes no calories |
Approved |
None |
|
Saccharin |
300× sweeter than sugar; safety concerns about carcinogenicity in rodent models |
Approved |
Must state that use of the product may be hazardous to health |
|
Cyclamate |
Safety concerns about potential carcinogenicity |
Banned |
None |
Weihrauch and Diehl (2004) reviewed the literature for human epidemiological studies on the health effects from exposure to a range of nonnutritive sweeteners (saccharin, cyclamate, aspartame, acesulfame-K, sucralose, alitame, and neotame) from foods and beverages. They found that assessing the carcinogenic potential of a single sweetener from dietary exposure was not feasible, but that the overall carcinogenic risk from nonnutritive sweeteners was negligible. Renwick (1990) reviewed toxicity reports and magnitude of safety factor for acesulfame-K, aspartame, cyclamate, and saccharin. Acceptable daily intake levels were reviewed and shown to be well below a toxic threshold for acesulfame-K, aspartame, and saccharin. The review reported that cyclamate was banned based on dose-response evidence at the upper dose intake level but the results were not reproducible in subsequent independent studies.
There is only one known large-scale study (Soffritti et al, 2005) to have tested aspartame in an animal model, from 8 weeks of age until natural death, at varying doses (ranging from 0 to 100,000 ppm) that include levels comparable to human exposure through foods and beverages. The authors concluded that administration of aspartame, even at low doses, caused an increase in incidence of malignant tumors of both epithelial and mesenchymal origin.
The data from the study were reviewed by the European Food Safety Authority (EFSA, 2006) and the Committee on Carcinogenicity of Chemicals in Food, Consumer Products, and the Environment (COC) of the UK Food Standards Agency. Both EFSA and the COC concluded that the study was flawed based on a number of errors identified by the panels. For example, the report of increased numbers of lymphomas and leukemias may have been related to the presence of chronic inflammatory disease in the lungs of rats, but the investigators failed to test for mycoplasma (a causative agent) in the animal colony. The reported tumors of the renal pelvis were found to be likely related to the treatment because high doses of chemical irritants are known to cause calcium imbalances in the rat, leading to renal tumors. Neither was a dose-response relationship between aspartame intake and tumor incidence established. Another reported flaw was that all the malignant tumor incidences and all tumor-bearing animals were aggregated for statistical purposes, and the reviewers found that the aggregated data were not sufficient to demonstrate the carcinogenic potential of aspartame.
In a rebuttal statement, Soffritti (2006) responded to the criticism that lymphoma and leukemia tumors were related to underlying lung disease, and that such diseases are common when animals are taken to the point of natural death as they were in his study. The author also pointed out that, if an infection were present in the colony, it would have affected males and females equally. The other criticisms to the study were not addressed
in the rebuttal statement. To date the findings of the study have not been replicated and published.
Displacement of foods to be encouraged Analyses from national food intake surveys show a trend of increasing intake of soft drinks and decreasing intake of milk and 100-percent juice drinks (Lytle et al., 2000; Nielsen and Popkin, 2004). Studies of caloric soft-drink consumption among school-age children and adolescents also show an association between increased consumption of sweetened beverages and milk displacement (Harnack et al., 1999; Marshall et al., 2005; Storey et al., 2004).
Blum et al. (2005) found a significantly increased intake of both diet soda and sugar-sweetened beverages (100-percent juice and sugar-sweetened soda) and decrease in milk consumption in children over a 2-year period using 24-hour diet recall. Bowman (2002) examined trends in beverage consumption from the 1994–1996 CSFII and found an increasing trend in consumption of beverages that included sugar-sweetened and diet sodas, 100-percent fruit juice, and fruit drinks, and a decreasing trend in milk consumption. The study also found that milk drinkers who did not drink sodas drank more milk than those who drank sodas. A systematic review and meta-analysis of soft-drink consumption and nutrition outcomes found that soft drink (all types) consumption was correlated with decreased milk consumption and decreased calcium intake, although the effect sizes were small (Vartanian et al., 2007). This analysis also related soft drink consumption to decreased intakes of fruit and fiber.
The American Academy of Pediatrics Policy Statement on Soft Drinks in Schools states that soft drink consumption displaces milk consumption, but does not distinguish between displacement by sugar- or nonnutritive-sweetened beverages (AAP, 2004c). The 2005 Dietary Guidelines Advisory Committee (DGAC) did not review evidence about nonnutritive-sweetened foods and beverages in the diets of Americans.
Efficacy of nonnutritive sweeteners Evidence that using nonnutritive-sweetened beverages is effective in promoting weight loss in controlled settings compared with nonnutritive-sweetened foods is inconclusive. Porikos et al. (1977) studied eight obese men and women in a metabolic ward to determine if “covert” substitution (subjects were unaware of the change) of sucrose-containing foods with aspartame could dilute caloric intake. The results showed that obese individuals reduced caloric intake and could maintain body weight with covert substitution of aspartame for sucrose in the diet. A follow-up study (Porikos et al., 1982) used a similar protocol where aspartame was substituted covertly midway through the study. The results showed an initial stabilization of subjects’ food intake, followed by an increased intake to compensate for 40 percent of the missing calories.
Food intake then stabilized at 85 percent of baseline and remained at that level until the end of the study. The replacement of sucrose by aspartame in this study showed a tendency to curb weight gain.
Tordoff and Alleva (1990) examined whether nonnutritive-sweetened soft drinks were effective in controlling long-term food intake and body weight among 28 nonobese adult men and women. Individuals who consumed aspartame in soft drinks decreased caloric intake by 7 percent and significantly reduced body weight compared to those who consumed high-fructose corn syrup in soft drinks who increased caloric intake by 13 percent and significantly increased body weight. Foltin et al. (1990) also found that complete energy compensation occurred among adult men who consumed reduced-calorie meals in which the carbohydrate content was reduced by replacing sugar with aspartame.
Rogers and Blundell (1989) found that users of saccharin-sweetened yogurt compensated for the eliminated calories by increasing caloric intake in a subsequent meal. Blackburn et al. (1997), however, found that obese women consuming aspartame-sweetened foods and beverages lost significantly more weight than control subjects (no aspartame) in a multidisciplinary weight loss program that included diet and exercise advice. The study did not address the effect of aspartame-sweetened beverages compared to aspartame-sweetened foods on weight loss.
Raben et al. (2002) investigated the long-term effect of substituting additional foods and beverages with nonnutritive sweetener for those sweetened with sucrose in diets of overweight adults. In contrast to the above-described studies, those subjects who consumed additional foods and beverages containing nonnutritive sweeteners in place of sucrose did not compensate for the lost sucrose calories. The control subjects who consumed additional foods sweetened with sucrose increased their energy intake, body weight and fatness, and blood pressure.
James et al. (2004), in a randomized controlled trial of a 12-month focused education intervention, assessed the effect of reducing consumption of carbonated beverages to prevent weight gain in children aged 7–11 years. The study found a modest reduction in the number of carbonated beverages consumed among subjects in the intervention group compared to controls, and it was associated with a reduction in the number of obese children and those at risk of obesity.
Ebbeling et al. (2006) conducted a pilot study to examine the effect of decreasing intake of sugar-sweetened beverages on body weight in adolescent males and females. The intervention used was replacement of sugar-sweetened beverages with noncaloric beverages for 25 weeks. The study found that decreased consumption of sugar-sweetened beverages had a net effect of decreasing body weight over baseline BMI and the effect was
greater among the subjects who consumed more sugar-sweetened beverages at baseline. The 2005 DGAC did not review evidence about nonnutritive sweeteners and there is no recommendation in the DGA about a role for nonnutritive-sweetened beverages (or foods) in the diets of Americans.
Caffeine
Caffeine and related substances (theobromine and theophylline), collectively referred to as methylxanthines, are plant-derived alkaloid compounds that have central nervous system stimulating activity. The primary food and beverage sources are coffee, tea, kola nuts, and chocolate. Examples of caffeine levels in foods and beverages are shown in Table 2-2.
Caffeine-containing beverages (coffee, tea, soft drinks, and “energy drinks”) are readily available to consumers. A recent USDA survey of more than 15,000 subjects found that 87 percent of the study population consumed food and beverages that contained caffeine (Frary et al., 2005). The overall average intake noted in this study was 193 mg per day of caffeine, or 1.2 mg caffeine per kg of body weight per day. Among children, the study found caffeine consumption in all age groups: 76 percent of those aged 2–5 years consumed an average of 16 mg/day or 0.4 mg/kg body weight; among those aged 6–11 years, 86 percent consumed an average of 26 mg/day or 0.4 mg/kg body weight. Among males and females aged 12–17 years, 91 percent and 88 percent respectively consumed an average of 80 and 59 mg/day, or 0.5 mg/kg body weight.
Small amounts of caffeine can have a transient positive effect on alertness or ability to concentrate (Dixit et al., 2006; Griffiths and Chausmer,
TABLE 2-2 Average Caffeine Levels in Selected Foods and Beverages
|
|
Serving Size (oz) |
Caffeine Content (mg) |
|
Brewed coffee |
8 |
95 |
|
Starbucks Frappuccino™ Mocha |
9.5 |
72 |
|
Decaffeinated coffee |
8 |
2 |
|
Brewed tea |
8 |
47 |
|
Iced tea |
8 |
5–11 |
|
Coca Cola™ Classic |
12 |
30 |
|
Mountain Dew™ |
12 |
45 |
|
Other non-cola soft drinks |
12 |
0–36 |
|
Red Bull™ |
8.3 |
67 |
|
Hot cocoa |
8 |
5 |
|
Chocolate milk |
8 |
5 |
|
Chocolate bar |
1.75 |
9 |
|
SOURCES: McCusker et al., 2006; USDA/ARS, 2006. |
||
2000). Kenemans and Lorist (1995) found that a single dose of caffeine increased cortical activation, rate of accumulation of information, and speed and accuracy of target selections in male and female undergraduate students (aged 19–29 years) who regularly consumed caffeine, compared to those who did not regularly consume. Similar effects have been found in children (Hughes and Hale, 1998; Leviton, 1992; Rapoport et al., 1981), although the benefit appears to diminish with habitual use (Heatherley et al., 2006). In addition, recent epidemiological evidence supports potential health benefits of caffeine in adults for reducing risk for certain chronic diseases such as colorectal cancer and T2D (Popkin et al., 2006). However, these associations are not well established, and their relevance to caffeine consumption in children is not known.
Findings from studies addressing adverse health effects from caffeine consumption by adults are inconclusive (Higdon and Frei, 2006). Studies on caffeine consumption do not demonstrate a significant association between caffeine intake and adverse effects on reproduction, teratogenesis, tumorigenesis, or myocardial infarction (Abbott, 1986; Curatolo and Robertson, 1983). Studies also have been conducted on other potential adverse health effects including hypertension, fluid homeostasis, cognitive effects, and physical dependence.
Hypertension Nonusers of caffeine may experience an increase in blood pressure when administered an acute dose of caffeine, although the evidence is inconclusive (Green and Suls, 1996; Myers, 2004; Umemura et al., 2006; Winkelmayer et al., 2005).
Fluid homeostasis Some investigators have reported that caffeine increases fluid loss through urination in a dose-dependent manner in healthy adult males (Nussberger et al., 1990; Passmore et al., 1987). Other studies found no association between consumption of caffeine-containing beverages and increased production of urine compared to consuming non-caffeinated beverages by healthy adult male subjects (Dorfman and Jarvik, 1970; Grandjean et al., 2000). Risk for dehydration, however, may increase in situations of extremely hot or cold environments (IOM, 1993, 1996).
Cognitive effects Administration of high doses of caffeine to nonusers and infrequent users may have an adverse effect on short-term recall. Terry and Phifer (1986) found that college students given a 100 mg dose of caffeine prior to a test of short-term recall were not able to recall as many words as control subjects. Erikson et al. (1985) found that among female students, caffeine inhibited recall when word lists were presented at a slow rate, but not at a fast rate. Caffeine had no effect on recall among male subjects. In a double-blind study of young adults, Loke (1988) found no sig-
nificant effect of caffeine on cognitive, learning, and memory performance, although it did increase subjective ratings for mood.
Physical dependence Continual administration does not change the physiological effect of caffeine, but it frequently leads to tolerance to and physical dependence on caffeine (Griffiths and Chausmer, 2000; Griffiths and Woodson, 1988; James, 1997). Tolerance to a substance can be described as the reduced effectiveness of the substance as a result of regular administration over time (Dews et al., 2002). Discontinuation of a tolerated substance leads to symptoms of withdrawal. Although there is no universally accepted definition for dependence, it has been described as being present during regular administration of a substance if discontinuation precipitates symptoms of withdrawal (O’Brien, 1995). Abrupt removal of caffeine from regular users has been shown to be accompanied by withdrawal symptoms such as headache, drowsiness, irritability, and fatigue (Lader, 1999; Reeves et al., 1995).
Few studies have been done examining dependence on caffeine among school-age children. Oberstar et al. (2002) described caffeine dependence after a 1-year follow-up study of daily use in adolescents. In this study, dependence in adolescents was marked by symptoms of withdrawal similar to those found in adults. Bernstein et al. (2002) characterized symptoms of dependence in a small group of adolescents. Forty-two percent of daily caffeine users reported tolerance and 78 percent described symptoms of withdrawal following reduced intake or cessation.
In 1984, Rapoport et al. conducted a controlled, double-blind caffeine challenge among elementary school-age children who reported either “high” (500 mg/day) or “low” previous daily use of caffeine. After a 2-week period during which children received 5 mg/kg/day, parents of previously low-using children reported that their children were restless, more emotional, and less attentive while receiving caffeine. Parents of previously high users reported that their children had no emotional changes from receiving caffeine, but higher anxiety when they did not receive it.
Baer (1987) investigated the effects of small doses of caffeine (1.6–2.5 mg/kg body weight) on motor activity outcomes in kindergarten children. This study found small and inconsistent effects on off-task and gross motor activity. Leonard et al. (1987) reviewed existing studies for effects of caffeine on adults, fetuses, and animal models and concluded that moderate caffeine consumption probably has no long-term effect on physiological measures such as sleep pattern or mood. Caffeine consumption was found to induce transient changes that included altered mood and sleep patterns when administered to nonusers.
Taken together, the evidence for adverse effects of caffeine use in adults suggests that the greatest risk appears to be for symptoms of physical
dependence and withdrawal, such as sleeplessness and irritability. These effects may be similar in children.
Consumption Patterns Among School-Age Children and Adolescents
Fruit and Vegetable Consumption
Diets rich in fruits and vegetables are associated with reduced risk for cardiovascular disease, T2D, certain types of cancer, overweight, and obesity (DHHS, 2000; DHHS/USDA, 2005; Lin and Morrison, 2002). Fruits and vegetables can also be good sources of several nutrients of concern in children’s diets. Fisher et al. (2002) found that fruit and vegetable consumption among girls was positively related to micronutrient intake, and negatively associated with fat intake. On average, fruits and vegetables are low in energy density and fat, and high in fiber and other nutrients. Thus incorporating fruits and vegetables into the diet can promote satiety and decrease energy intake (Rolls et al., 2004). For a reference intake of 2,000 calories, two cups of fruits and 2.5 cups of vegetables per day are recommended with amounts adjusting depending on caloric intake level. For school-age children and adolescents, this would result in a range of 2.5 to 6.5 cups (5 to 13 servings) of fruits and vegetables each day for the 1,200 to 3,200 calorie-based diets for these ages (DHHS/USDA, 2005). The DGAC recommends that “no more than one-third of the total recommended fruit group intakes come from fruit juice with the rest coming from whole fruit” (DHHS/USDA, 2004).
National dietary intake data based on 24-hour recalls from the CSFII indicate that only 25 percent of school-age children and adolescents aged 6–19 years had two or more servings of fruits on the day of the survey. Only 36 percent of same-age school children and adolescents consumed three or more servings of vegetables. Moreover, fried potatoes accounted for one-third (32 percent) of the reported vegetable servings (DHHS, 2000). More than one-third of the vegetables in the U.S. food supply consisted of iceberg lettuce, frozen potatoes (mainly french fries), and potato chips (Putnam et al., 2002). Only 6 percent of school-age children and adolescents consumed one-third or more servings from dark green or deep yellow vegetables on a daily basis (DHHS, 2000).
Whole-Grain Consumption
Whole-grain foods, valuable sources of nutrients that include fiber, B vitamins, vitamin E, selenium, zinc, copper, and magnesium, consist of the entire grain seed, usually called the kernel. The process of refining grains for food typically removes most of the bran and some of the germ, resulting in
loss of dietary fiber, vitamins, and minerals. Altered kernels, such as those cracked, crushed, or flaked, must retain the same relative proportions of bran, germ, and endosperm as the original grain to be called a whole grain (DHHS/USDA, 2005).
Whole grains also contain phytochemicals and phenolic compounds that play important roles in disease prevention (Slavin et al., 2001). Epidemiological studies link whole-grain consumption to better health and reduced risk for certain cancers, CHD, and T2D, and consumption possibly improves glucose response, increases insulin sensitivity, and improves weight management (DHHS, 2000; DHHS/USDA, 2005).
The DGA (DHHS/USDA, 2005) recommends that school-age children eat at least three daily servings, or half their daily grain intake, as whole grains. Dietary studies indicate that consumption of whole grains is far less than the recommended intake in children, with an average intake of no more than one serving per day (less than 10 percent of Americans consume three servings per day).
In a study of whole-grain consumption by U.S. children using data from the 1994–1996 CSFII, the average whole-grain intake for children aged 6–11 years was 0.9 servings per day; for adolescents it was one serving per day. The proportion of children and adolescents consuming an average of two or more servings of whole grains daily was only 15 percent (Harnack et al., 2003). Ready-to-eat cereals, corn or tortilla chips, and yeast breads were the major sources of whole grains among children and adolescents aged 6–18 years (30, 24, and 17 percent, respectively). Children from low-income households consumed fewer whole grains than those from higher-income households (Harnack et al., 2003).
Barriers to increasing whole-grain consumption include taste perceptions, texture, preparation time, limited availability (whole grains are not as widely available at schools as refined grains), lack of understanding of health benefits, and difficulty in identifying whole-grain foods. Although the FDA has provided guidance on what constitutes a whole grain, consumers are often confused when making decisions about these products at point of purchase or consumption.
The DGA (DHHS/USDA, 2005) recommends consumption of at least 3 ounce-equivalents of whole grains each day to help reduce the risk of several chronic diseases and possibly to help maintain weight. The guidelines also suggest that children increase the amount of whole grains in their diets as they grow, and that, at all calorie levels, all age groups should consume at least half their grains as whole grains to achieve fiber recommendations. The average intake of whole grains is currently less than one serving per day, with less than 10 percent of Americans consuming three servings per day (Cleveland et al., 2000). Grains are most commonly consumed in the form of bread, a standard slice (one ounce-equivalent) contains 16 grams of
|
BOX 2-2 Food and Drug Administration Criteria for Whole Grains Definition of Whole Grain The Food and Drug Administration defines whole grains as “cereal grains that consist of the intact, ground, cracked or flaked caryopsis, whose principal anatomical components—the starchy endosperm, germ, and bran—are present in the same relative proportions as they exist in the intact caryopsis.” Whole-Grains Health Claim “Diets rich in whole grain foods and other plant foods and low in total fat, saturated fat, and cholesterol may help reduce the risk of heart disease and certain cancers.” |
flour. Three ounce-equivalent servings of whole-grain bread would therefore provide 48 grams of whole grains per day. At present, no single mechanism can easily determine what constitutes whole-grain products. However, a number of regulations and guidance documents address whole grains.2
FDA guidance On February 17, 2006, the FDA published draft guidance on “Whole Grain Label Statements.” The FDA included a definition for what constitutes a whole grain (see Box 2-2). FDA guidance also includes examples of which foods would be considered whole grains and which would not. The FDA is in the process of finalizing this guidance (FDA, 2006b).
FDA whole-grain health claim The FDA requires that any food product that carries the whole-grain health claim must by regulation contain 51 percent or more whole-grain ingredients by weight per reference amount and be low in fat (Box 2-2). This appears to be a more straightforward way of identifying whole-grain products; however, not all products that are rich in whole grains currently display the claim.
USDA standards of identity The only whole-grain bakery products that have Standards of Identity are “whole-wheat bread,” “whole-wheat rolls,” and “whole-wheat buns.” The standard requires that these prod-
|
2 |
Comparable ounce-equivalents of other grain-based foods include 5 whole wheat crackers, 1/2 “mini” bagel, and 1 cup flakes or rounds cereal (SOURCE: http://www.mypyramid.gov/pyramid/grains_counts_print.html). |
ucts be made from “whole-wheat flour, bromated whole- wheat flour, or a combination of the two,” and any product labeled “whole-wheat bread,” “whole-wheat rolls,” or “whole-wheat buns” must be made only from whole-wheat flours. The only whole-grain “macaroni products” that have Standards of Identity are “whole-wheat macaroni,” “whole-wheat spaghetti,” and “whole-wheat vermicelli” (21 CFR Part 136.180; 21 CFR Part 139.138) (FDA, 2006b). A number of whole-grain cereal flours and related products also have a Standard of Identity; however, given the proliferation of whole-grain products on the market, there are many that do not fall into the Standards of Identity categories, but are still good choices to increase whole-grain intake.
HealthierUS School Challenge: Whole-grains resource One of the most comprehensive resources to date is that provided by USDA as part of the HealthierUS School Challenge. The resource was developed as a guide to whole grains for school food authorities interested in applying for the Silver or Gold awards of the HealthierUS School Challenge (SOURCE: http://www.fns.usda.gov/tn/HealthierUS/silvergoldtn.html). This resource draws from the existing regulations and guidance described above (USDA’s Standards of Identity and FDA’s guidance and health claims) and provides school foodservice operatives with specific ways to determine the whole-grain contribution of a food product.
Whole Grains Council stamp The most common private-sector resource is provided by the Whole Grains Council. In an effort to help Americans more easily identify whole-grain products in the marketplace, the Council developed a pair of symbols to appear on whole-grain products (Figure 2-2). One stamp symbol indicates that a product contains a full 16 grams of whole grain per serving; the other indicates that a product contains 8 grams, qualifying it as 1/2-serving of whole-grain serving. This is a voluntary resource and may not be available for all eligible foods.
Consumption of Calcium-Rich Foods
Osteoporosis may be considered a pediatric disease manifesting itself in later life, and therefore dietary intake of calcium-rich foods and beverages is important for school-age children. Adequate calcium intake during childhood and adolescence is necessary for the attainment of optimal peak bone mass, which may be important in reducing the risk of osteoporosis and fractures later in life (Greer and Krebs, 2006).
Milk and milk products provide more than 70 percent of the calcium consumed by Americans (DHHS/USDA, 2005). Nondairy sources of calcium include dark green leafy vegetables, tofu set with calcium salts,

FIGURE 2-2 Identification of qualifying whole-grain products: the Whole Grain Stamps.™
SOURCE: Reprinted, with permission, from Oldways Preservation Trust and the Whole Grains Council (http://www.oldwayspt.org and http://www.wholegrains-council.org). Whole Grain Stamps are a trademark of Oldways Preservation Trust and the Whole Grains Council.
tortillas made from lime-processed corn, and calcium-fortified foods and beverages. Low intakes of calcium in children and adolescents may be related to the displacement of milk intake by soft drinks and juice drinks (Greer and Krebs, 2006; Harnack et al., 1999). Soft-drink consumption peaks in adolescence and milk intake is at its lowest level (Greer and Krebs, 2006).
National dietary survey data consistently show that most children older than 8 years do not consume the recommended amounts of calcium. National CSFII data indicated that only 19 percent of females and 52 percent of males 9–19 years of age met calcium recommendations (1,300 mg calcium/day) (DHHS, 2000). Only 10 percent of adolescent females achieve the recommended adequate dietary intake of calcium (Greer and
Krebs, 2006). There are dairy products, including flavored low-fat and nonfat milks and yogurts, that are popular among school-age children and can make a positive contribution to bone health. Johnson et al. (2002) demonstrated a positive association between flavored-milk consumption and calcium intake among children and adolescents aged 5–17 years. They also found there was no association between consumption of flavored milk and percentage of energy from saturated fat.
Consumption of Added Sugars
Added sugars are sugar or syrup or both added to foods or beverages during processing or preparation. Major sources of added sugars include soft drinks, cakes, cookies, pies, fruit drinks, candy, dairy products, and desserts. These differ from naturally occurring sugars such as fructose in fruits or lactose in milk (IOM, 2002/2005).
Children and adolescents tend to have diets high in added sugars (Briefel and Johnson, 2004). Analysis of the CSFII data (1994–1996) found that added sugars contributed 20 percent of total daily calories in school-age children’s diets or about 25 teaspoons per day (Gleason and Suitor, 2001a). Absolute intake of added sugars ranged from 19 teaspoons per day for girls ages 6–8 years to 36 teaspoons per day (3/4 cup) for males aged 14–18 years.
There are no DRI upper reference levels for total or added sugars because there was insufficient evidence to set them (IOM, 2002/2005). However, a maximal intake of 25 percent or less of energy from added sugars was recommended. The Joint World Health Organization/Food and Agriculture Organization of the United Nations Expert Consultation report, Diet, Nutrition, and the Prevention of Chronic Diseases (WHO, 2003) recommended that free sugars (equivalent to added sugars) constitute less than 10 percent of total energy in the diet because added sugars provide significant energy without specific nutrients. The DGA (DHHS/USDA, 2005) recommends choosing and preparing foods and beverages with as little as possible added sugars or caloric sweeteners.
Many foods and beverages contain high amounts of added sugars. Flavored yogurts contain about 23–27 grams of added sugars, comprising about 46–48 percent of calories. Most flavored milk contains about 15–16 grams of added sugars, comprising about 35–40 percent of calories. Consumption data from the 1994–1996 and 1998 CSFII on the intake of added sugars show that, for children aged 6–17 years who provided two full days of dietary data, sweetened dairy products were positively associated with calcium intake. Consumption of presweetened cereals was also shown to increase the likelihood of children meeting recommended intake levels for calcium, folate, and iron. Other sources of added sugars, includ-
ing sweetened baked products and other sweetened prepared grain-based foods, sweets, and sweetened beverages, were associated with a decreased likelihood for meeting recommended intake levels (Frary et al., 2004). Responding to concerns about added sugars while supporting the intake of calcium in milk, the New York State Education Department set a limit of 10 grams of added sugars per 8-ounce serving of nonfat milk sold in schools.
The Nutrition Facts panel on foods and beverages states the amount of total sugars, but does not distinguish between naturally occurring and added sugars. Thus, relying on the current Nutrition Facts panel, it is not possible to determine the amount of added sugar in an item. States and school districts that set limits on added sugars often use the proxy of “percent sugar by weight” and use the total sugar figure on the Nutrition Facts panel to calculate sugar by weight. One standard that has been applied broadly in setting limits on added sugars is “35 percent total sugar by weight” where the total grams of sugar are compared to the total gram weight of the product. However, a criterion based on weight unfairly favors foods higher in moisture content at the expense of drier foods that may be rich in a variety of nutrients (e.g., cereals and granola bars). A standard based on calories, such as “35 percent of calories as total sugar” is still a realistic calculation to do and would allow for a greater variety of products—especially ones that are less moist in nature—to be provided. A measure based on total calories instead of weight is a reasonable option until analytical methods and labeling regulations are established to measure and label the added sugars content of foods and beverages.
Consumption of Sugar-Sweetened Beverages
Although there are naturally occurring sugars in many foods and beverages (milk, fruits, some vegetables), there are many beverages popular with school-age children and adolescents that are composed of high levels of simple sugars, and little other nutrient value. These beverages are a source of concern because their consumption may displace intake of high nutrient-dense beverages such as milk (Blum et al., 2005; Hanson et al., 2005; Rajeshwari et al., 2005; Yen and Lin, 2002).
Fisher et al. (2004) conducted a longitudinal study that examined whether beverage choice, in the context of mother–daughter beverage choices, correlated with calcium intake and bone mineral content in school-age children. Beverage intake included milk, fruit juice, sweetened beverages, and noncaloric beverage and was assessed by 24-hour dietary recall. Intakes were recorded over a course of five years. Milk selection remained relatively constant over the course of the study, while juice intake decreased, and sweetened and noncaloric-beverages intake increased with age. The subjects’ intake of non-caloric beverages remained low in absolute amounts,
compared to milk and sweetened-beverage intake. Milk intake was found to decrease relative to increased intake of sweetened beverages by age, over time. The study concluded that calcium intake in girls, aged 5–9 years, reflected the relative intake of milk and sweetened beverages in their diet.
Whiting et al. (2001) conducted a longitudinal study to examine whether the amount and type of beverage consumed by adolescent boys and girls correlated with bone mineral content. Beverage and dietary intake data were collected by 24-hour recall over a six-year period. This study found a negative correlation between consumption of nutrient-poor beverages and total body bone mineral content during the 2 years around the age of peak bone mineral accrual in girls. This correlation did not hold up for boys. The authors concluded that milk consumption decreased with increased consumption of nutrient-poor beverages, but their data did not support a relationship between carbonated beverage consumption and bone health (e.g., bone-retarding chemicals in cola drinks). Reduced bone mineral accrual was significantly correlated with milk displacement by nutrient-poor beverages among girls only.
Blum et al. (2005) reviewed existing longitudinal data and found shifts in beverage consumption correlated with increased BMI, but concluded that additional longitudinal data were needed to show an association between substituting low-nutrient-dense beverages for milk and increased BMI in school-age children.
Adolescents, who have the highest intake of added sugars, obtain about 40 percent of their added sugar intake from soft drinks (Briefel and Johnson, 2004). In general, adolescents drink more soft drinks than milk or fruit juices (Briefel and Johnson, 2004). Depending on the study, Popkin et al. (2006) noted that the average calorie intake for all Americans aged 2 and older has increased by 150–300 calories per day over the past 20–30 years. About 50 percent of this increase is contributed by the consumption of sugar-sweetened beverages (Popkin et al., 2006). In the 1990s, soft drinks contributed about 4 percent of total energy intake among 6- to 11-year-old children and 8 percent among adolescents.
Increased added sugars intake has been shown to result in increased energy intake for children (Bowman, 1999). For example, adolescents who did not drink soft drinks consumed 1,984 calories per day compared to 2,604 calories per day for adolescents who drank 26 or more fluid ounces of soft drinks per day (Harnack et al., 1999). In addition, consumption of sugar contribution to dental caries (DHHS/USDA, 2004).
Among obese adolescents, soft drinks contributed about 10 percent of total energy intake for males and about 9 percent for females (Troiano et al., 2000). Soft drinks are not the only sugar-sweetened beverages. Others include fruit drinks and sports drinks. As reported by Guthrie and Morton
(2000), the percentage of total intake of added sweeteners contributed by soft drinks and fruit drinks to the diets of children is as follows:
-
Children aged 2–5 years: 34 percent
-
Children aged 6–11 years: 35 percent
-
Females aged 12–17 years: 48 percent
-
Males aged 12–17 years: 50 percent
Several primary studies have found a positive link between obesity and soft-drink consumption (James et al., 2004; Ludwig et al., 2001; Mrdjenovic and Levitsky, 2003; Striegel-Moore et al., 2006; Welsh et al., 2005). Pereira (2006) and Bachman et al. (2006) concluded from a review of studies that the findings were inconsistent, and high-quality randomized trials are needed to evaluate the possible association between changes in sweetened beverage intake and risk for obesity. A systematic review of the literature (Malik et al., 2006) examined sugar-sweetened beverages and weight gain and concluded that the weight of epidemiological and experimental evidence indicated that a greater consumption of sugar-sweetened beverages is associated with weight gain and obesity. In general, reducing consumption of sweetened beverages is viewed as an important component of a broad strategy to reduce excess energy intake (Dietz, 2006; Popkin et al., 2006).
Consumption of Fat
The role of fat in the diet is complicated because different types of fatty acids have different effects on health. However, it is clear that children consume too much dietary fat, and too much of the fat is from saturated fatty acids (DHHS, 2000). Troiano et al. (2000) found that only one in four school-age children met the intake guidelines for total fat and saturated fat. Among 9- to 13-year-old males, only 14 percent met the dietary fat recommendation of 30 percent or less of total calories from fat and only 6 percent met the saturated fat recommendation (Gleason and Suitor, 2001a). Data are consistent that diets low in saturated fatty acids are associated with lower risk for and lower rates of CHD (DHHS, 2000).
The DGA recommends that children and adolescents 4–18 years of age consume 25–35 percent of their calories from fat, with most fats coming from polyunsaturated and monounsaturated fatty acids. Less than 10 percent of calories should come from saturated fats and trans fat intake should be kept as low as possible (DHHS/USDA, 2005). For individuals with elevated blood cholesterol levels, the recommended saturated fat intake is less than 7 percent of total calories (DHHS/USDA, 2005).
The trans fats found in hydrogenated oils not only increase low-density lipoprotein (LDL) cholesterol as do saturated fats, but also decrease high-density lipoprotein (HDL) cholesterol. These combined effects result in a larger increase in total cholesterol:HDL cholesterol ratio than is observed for dietary saturated fats (Grundy, 1999).
Population trends show that the U.S. population has decreased total fat intake while increasing its caloric intake (Troiano et al., 2000), and has experienced population-wide weight gain (Ogden et al., 2006). These trends suggest that fat intake is not the only cause of obesity. A low-fat diet will not necessarily lead to weight loss if the total caloric value of the diet exceeds the individual’s energy needs.
Nevertheless, fats are calorie dense, and a high fat intake is a major contributor to the high caloric intake of overweight and obese individuals (Prentice, 2001). In addition, diets high in fat tend to contain levels of saturated fats that exceed the DRI (IOM, 2002/2005). Extremely low-fat diets may be low in essential fatty acids and impair absorption of fat-soluble vitamins, but this is rare in healthy children. The primary sources of saturated fats are meats and dairy products. Trans fatty acids are found in many processed snack foods and baked products, although there are trace amounts in animal foods such as milk and meats.
Consumption of Foods of Low Nutrient Density
Nutrient-dense foods are those foods that provide relatively high amounts of vitamins and minerals (micronutrients) and relatively few calories (DHHS/USDA, 2005). Foods of low nutrient density are those that supply calories but no or small amounts of micronutrients. Foods of low nutrient density represent a high contribution to energy and fat intakes. The top ten foods contributing to energy intakes in children aged 2–18 years are milk, bread, cakes/cookies/quick breads/doughnuts, beef, ready-to-eat cereal, soft drinks, cheese, potato chips/corn chips/popcorn, sugars/syrup/ jams, and poultry; several of these foods such as soft drinks, chips, cakes, cookies, and pastries, are low-nutrient-dense foods (Subar et al., 1998).
The CSFII 1994–1996 survey found that added sugars and fat contributed 45 percent of total energy intake in school-age children, with sugars contributing 20 percent of total calories and discretionary fat calories 25 percent (Gleason and Suitor, 2001a). In NHANES III, foods of low nutrient density contributed more than 30 percent of total energy intake among school-age children, with sweetened beverages, candy, and desserts providing about 25 percent of total energy intake (Kant, 2003). One-third of school-age children and adolescents reported eating six or more foods of low nutrient density on the day of recall. Mean intakes of vitamins and
minerals declined with increasing number of calorie-dense foods consumed (Kant, 2003). Consumption of foods of low nutrient density was related to higher energy consumption but was not associated with BMI.
In general, greater consumption of calorie-dense foods and beverages makes it more difficult to consume sufficient nutrients without gaining weight, especially for those individuals who are inactive (DHHS/USDA, 2005). If nutrient-dense foods are selected exclusively from the various food groups in the amounts recommended, then only a relatively small amount of calories is available to be consumed as added fats or added sugars (DHHS/ USDA, 2005). This is called the discretionary calorie allowance. Calorie needs are variable in children and adolescents and depend on age, rate of growth, level of physical activity, body size and composition, and stage of sexual maturation. The amount of discretionary calories increases as total caloric need increases, and is strongly associated with physical activity level. With increasing physical activity levels, discretionary calories increase. At 1,600, 2,000 and 3,000 total calories per day, the discretionary calorie allowance would be 132, 267, and 512 calories, respectively. For sedentary children and adolescents, the discretionary calorie allowance may only be 150 to 250 calories per day. This small amount of discretionary calories does not allow consumption of many calorie-dense snacks and beverages. For example, a 20-ounce soft drink contains 250 calories. Figure 2-3 illustrates the concept of essential calories (the total energy necessary to meet recommended nutrient intakes) and discretionary calories. As can be seen for inactive children, only small amounts of discretionary calories can be consumed before caloric intake becomes excessive and weight gain results (Gidding et al., 2006). Butte (2006) estimated energy requirements for children based upon reports by the Institute of Medicine (2002/2005) and Food and Agriculture Organization of the United Nations/World Health Organization/United Nations University (2004). These estimates of energy intake recommendations for children 11 years of age and under were lower than the 1985 FAO/WHO recommendations due to decreased total energy expenditure in this age group.
The committee estimated the amount of dietary energy available for discretionary energy consumption as snacks based on daily energy requirements for boys and girls as a function of age and physical activity level (IOM, 2002/2005) Estimating that approximately 25 percent of daily energy intake would be consumed at breakfast, 33 percent at lunch, and 33 percent at dinner would leave approximately 9 percent of total daily energy intake for discretionary calorie consumption. These calculations are also consistent with guidelines of the School Breakfast and National School Lunch Programs. Appendix Tables B-1 and B-2 depict the estimated energy requirements provided in the DRI report (IOM, 2002/2005) for children
and include an additional four columns that show the number of calories in 9 percent of total daily energy intake allotted as discretionary calories derived from snacks.
Fast Food Consumption
National CSFII (1994–1996, 1998) data using 24-hour diet recalls indicate that on a typical day 33 percent of children aged 9–19 years reported eating foods obtained at fast-food and pizza outlets (excluding the school cafeteria). This included 26 percent of children aged 9–13 years and 39 percent of adolescents aged 14–19 years (Bowman et al., 2004). Fast-food consumption was prevalent in both sexes, all racial/ethnic groups, and all regions of the country. Increased consumption was independently associated with male gender, adolescent age, higher household incomes, non-Hispanic black race/ethnicity, and residence in the South.
Fast-food consumption can have a negative impact on the nutritional quality of the diets of children and adolescents and may increase risk for obesity. CSFII data showed that children who consumed fast food compared with those who did not consumed more total energy (187 calories), total fat, and soft drinks, and less milk, fruits, and non-starchy vegetables (Bowman et al., 2004) compared with those who did not. French et al. (2001) found in a survey with 4,746 adolescents of multiple ethnicities that frequency of fast-food restaurant use was positively associated with total energy, energy from fat, and servings of soft drinks and french fries, and was negatively associated with servings of fruit, vegetables, and milk. A study of 101 girls between the ages of 8–12 at baseline and 11–19 years at follow-up found that the frequency of eating fast food at baseline was positively associated with change in BMI z-score. Girls who ate fast food twice a week or more at baseline had the greater mean increase in BMI z-score compared to those who ate fast food once a week or less (Thompson et al., 2004). These results suggest that fast food consumption can promote a positive energy balance and weight gain.
Meal and Snack Patterns
Another way of examining children’s dietary intake is to look at meal and snack patterns. Children and adolescents are more likely to skip breakfast than lunch or dinner. Based on CSFII data from 1994–1996, nearly one in five (19 percent) school-age children ate nothing for breakfast on the day of the survey (i.e., any given day), and one in three (33 percent) consumed foods and beverages that contributed less than 10 percent of their daily recommended energy allowance (Gleason and Suitor, 2001a). The percentage of children and adolescents who skipped breakfast on the day of the
survey increased with age: 8 percent of those aged 6–8 years, 14 percent aged 9–13 years, and 31 percent aged 14–18 years. Omitting breakfast was most frequent among adolescent females (14–18 years), with 34 percent not eating breakfast. Among all school-age children and adolescents, breakfast provided an average of 18 percent of total daily energy intake. Breakfast, when consumed, tended to be lower in fat compared to other meals (Gleason and Suitor, 2001a). Breakfast consumption has been shown to be associated with more favorable nutrient intakes and improved dietary quality in children and adolescents (Nicklas et al., 1993; Rampersaud et al., 2005). These studies found that children who eat breakfast are more likely to meet recommended intakes for vitamins and minerals than those who skip breakfast. Barton et al. (2005) found an association with cereal eating and decreased risk for obesity. In this study, however, breakfast eating was not significantly associated with decreased risk for obesity.
The majority of studies, though not all, have shown that breakfast eaters are less likely to be obese (Affenito et al., 2005; Barton et al., 2005; Rampersaud et al., 2005). A recent study examined trends in adolescent obesity from 1971 to 2004 using NHANES data (Miech et al., 2006). Skipping breakfast on the day of the 24-hour dietary survey was significantly associated with being obese. Evidence also suggests that eating breakfast may improve cognitive function related to memory and increase school attendance (Rampersaud et al., 2005).
Not eating lunch is less common than skipping breakfast. Just less than 10 percent of children and adolescents aged 6 to 18 years ate nothing for lunch on the day of the CSFII survey. Lunch provided nearly one-third of the energy for the day (Gleason and Suitor, 2001a). Dinner is frequently consumed by children and adolescents, but not necessarily with their family. In response to the survey question “How many times did all, or most, of your family living in your house eat a meal together?” about 22–32 percent of older children and adolescents reported eating dinner as a family only a few days a week or never (Gillman et al., 2000; Neumark-Sztainer et al., 2003). These studies along with Videon and Manning (2003) suggest that eating meals as a family may influence dietary intake of children. Increasing frequency of family dinner is also associated with consumption of more fruits and vegetables, less fried food and soft drinks, less saturated and trans fat, and more fiber, calcium, vitamins and minerals (Gillman et al., 2000; Neumark-Sztainer et al., 2003).
Most U.S. children consume at least one snack per day (Cross et al., 1994), and snacking prevalence among children has increased since 1977 (Jahns et al., 2001). Data from national surveys show that, on average, school-age children snack about twice daily (Cross et al., 1994; Huang et al., 2004; Jahns et al., 2001), consuming nearly one-quarter of energy intake as snacks (Huang et al., 2004; Jahns et al., 2001).
The energy density of foods is higher for snacks compared to meals (Jahns et al., 2001). Based on the 1994–1996 and 1998 CSFII, children 3–5 years of age ate snacks averaging 146 ± 3 calories, children 6–11 years of age ate snacks averaging 197 ± 5 calories, and adolescents aged 12–19 years ate snacks averaging 274 ± 11 calories (Huang et al., 2004).
Food Choice Behavior
Studies of the effects of children’s consumption patterns on parents restricting energy-dense foods suggests that severe restriction of preferred foods of low nutrient value may increase their desire for such foods (Benton, 2004; Fisher and Birch, 1999). Taste perception is likely another important factor in food choices (Drewnowski, 1997). Factors that determine taste preference include genetic background (Birch, 1999; Mennella et al., 2005) and early life exposure (Birch, 1998; Birch and Fisher, 1998; Mennella et al., 2006). Because schools represent only a small part of the daily eating opportunity for children it is not clear whether restriction of energy-dense foods of minimal nutritional value in the school environment will encourage school-age children to consume them.
Studies of students’ perceptions of factors influencing food choices suggest that they are open to information about healthful choices and willing to make changes to improve their diets. O’Dea (2003) studied the responses of students aged 7–17 years to suggested strategies to overcome barriers to healthful eating. This study found that children and adolescents were willing to make healthful behavior changes and looked to parents and teachers for support. Neumark-Sztainer et al. (1999) assessed perceptions of factors that affect food choice behaviors among adolescent boys and girls from inner-city schools. From focus group discussions, the study identified a broad range of factors such as hunger, taste appeal, availability, and convenience that influence food choice behavior. The study concluded that knowledge of these factors could be useful in developing ways to make healthful food more appealing to adolescents and encourage healthful behaviors.
SOCIODEMOGRAPHIC FACTORS AFFECTING DIETS IN CHILDHOOD AND ADOLESCENCE
Gender
Gender differences in dietary intakes emerge as children move into adolescence. During childhood, food intakes of girls and boys tend to be similar. Because of increased rates of growth and body size, adolescent males eat larger quantities of food on average than female adolescents, so they are more likely to meet recommended daily intakes for vitamins
and minerals. Dietary surveys show adolescent males eat more servings of grains, vegetables (including french fries), dairy, and meat compared to adolescent females (Enns et al., 2003; Gleason and Suitor, 2001a). Adolescent males are also more likely to have diets higher in total fat and saturated fat (Gleason and Suitor, 2001a) and to consume larger amounts of soft drinks (French et al., 2003). As a group, adolescent females are more likely to have lower intakes of vitamins and minerals (Enns et al., 2003; Gleason and Suitor, 2001a; Story et al., 2002b). They are also more likely to skip meals, especially breakfast, than are adolescent males (Gleason and Suitor, 2001a). In fact, dietary data show that adolescent females aged 14–18 years have the poorest diets compared to all other age or gender groups (Gleason and Suitor, 2001a).
Economic Status
Children in low-income families fare less well than children in more affluent families on many health status indicators (DHHS, 2000; FIFCFS, 2005). In 2003, 18 percent of all children up to 17 years of age lived in poverty. The poverty rate was higher for African American (34 percent) and Hispanic (30 percent) children compared to white children (10 percent) (FIFCFS, 2005). About 12.4 million children (16.9 percent) lived in households that were classified as food insecure at times in 2005. Households are classified as food insecure based on reports of difficulty obtaining enough food, reduced dietary quality, and anxiety about food supplies (USDA/ERS, 2006).
Several studies have shown that children in families below the poverty level are less likely than higher-income children to have a healthy diet (Devaney et al., 1995; FIFCFS, 2005; Fox and Cole, 2004; Munoz et al., 1997). Studies of trends in obesity show that patterns between socioeconomic status and overweight are complex, but such associations can be drawn (Melgar-Quinonez and Kaiser, 2004; Ritchie et al., 2003; Sturm, 2005; Wang and Zhang, 2006). In these studies, children and adolescents in low-income families had higher intakes of total and saturated fat and consumed less fruit and dairy products. Low socioeconomic status has been shown to be a strong predictor of low fruit and vegetable intake among adolescents (Neumark-Sztainer et al., 1996). This may be related to financial resources to purchase fruits and vegetables and less access to affordable, quality fruits and vegetables in low-income communities.
Current child poverty rates highlight the importance of the federal child nutrition programs such as the National School Lunch Program (NSLP) and the School Breakfast Program (SBP), which provide a food and nutrition safety net for low-income children to help reduce hunger and improve health. In the 2005–2006 school year, the NSLP provided lunch to 29 mil-
lion children and adolescents on an average day. Of these, 17 million (59 percent) received a free or reduced-price school lunch (FRAC, 2006).
Race and Ethnicity
National CSFII data for school-age children found that African American and Hispanic children and adolescents were less likely to meet recommendations for limiting total and saturated fat than their white counterparts, and total consumption of milk products and calcium was lowest among African American children and adolescents. White children had the highest intake of added sugars and soft drinks, although African Americans drank more fruit drinks (Gleason and Suitor, 2001a). Other studies have also shown that white children drank more milk than African American children, and that African American girls drank more fruit drinks (Storey et al., 2004; Striegel-Moore et al., 2006).
DIETARY TRENDS OVER TIME AMONG SCHOOL-AGE CHILDREN
Changes over time in school-age children’s food consumption (Gidding et al., 2005) include
-
increased consumption of foods prepared away from home;
-
increased percentage of total calories from snacks;
-
increased consumption of calorie-dense foods;
-
increased portion sizes of foods;
-
increased consumption of sweetened beverage; and
-
decreased consumption of milk.
Trends in Dietary and Nutrient Intakes
A recent study examined dietary intake trends among children and adolescents over a 20-year period using data from three USDA national surveys: Nationwide Food Consumption survey 1977–1978; CSFII 1989–1991; and CSFII 1994–1996, 1998 (Enns et al., 2002, 2003). Among children 6 to 11 years old and adolescents 12 to 19 years old, increases in dietary intakes over time were found for soft drinks, total grain products, snack chips, fried potatoes, fruit drinks, and candy (Enns et al., 2002, 2003). The intake of chips, crackers, popcorn, and pretzels roughly tripled from the mid-1970s to the mid-1990s for both children and adolescents. The intake of soft drinks roughly doubled during this same period for children and adolescent females and tripled among adolescent males. In both age groups, decreases were found for total milk intake. Total fat intake and percentage of calories from fat decreased, but this was due in part to increased carbohydrate in-
take (Enns et al., 2002, 2003). For example, among children, fat intake decreased by 100 calories or less, but carbohydrate intake increased by about 150–200 calories (Sturm, 2005). NHANES trend data from the 1970s to 1999–2000 also found a decrease in dietary fat and percentage of energy from fat and concomitant increases in carbohydrate intake among children and adolescents (Briefel and Johnson, 2004). The CSFII data showed increases in iron and thiamin intake, and decrease in vitamin B12 in children and adolescents (Enns et al., 2002, 2003).
Dietary Changes Among Children
National data indicate that diet adequacy deteriorates as individuals get older; children, especially infants and young children, have diets that are more nutritionally adequate than those of adolescents (Devaney et al., 2005). Lytle et al. (2000), in a longitudinal study of 291 student participants, found that diet quality declines as children move from middle childhood into adolescence; intake of fruits, vegetables, and milk decreases and consumption of soft drinks increases. The study showed that fruit consumption fell by 41 percent between the third and eighth grades and vegetable consumption fell by 25 percent. Additional evidence from a longitudinal study of girls (Mannino et al., 2004) showed that dietary quality declined between 5 and 9 years of age, with a larger proportion of girls at 9 years of age having inadequate intakes of dairy, fruits and vegetables, and several nutrients than they did at an earlier age. Lin et al. (2001) determined that an increase in eating out was a factor in the age-related adolescent decline in diet quality.
Trends in Meal Patterns and Snacking
Breakfast consumption by U.S. children and adolescents has declined over time. For example, between 1965 and 1991, breakfast consumption declined 9 percent in children aged 8 to 10 years and 13 to 20 percent in adolescent males and females. The greatest decline (20 percent) was in adolescent girls (Siega-Riz et al., 1998). The nutritional quality of foods consumed at breakfast has improved since 1965, especially in substitution of lower fat for full-fat milk (Siega-Riz et al., 1998). The introduction of the SBP has increased breakfast consumption among children in low-income areas. The Bogalusa Heart Study found that from 1973 to 1978, there was a marked increase from 8 to 30 percent in the percentage of children who skipped breakfast. When school breakfast service was introduced in the district in 1981, the percentage of children skipping breakfast declined to 12 percent (Nicklas et al., 2004).
Nationally representative data also show that the prevalence of snack-
ing has increased in school-age children and adolescents from 1977 to 1996. The average size of snacks and energy content per snack remained relatively constant during this period; however, the number of snacks eaten per day rose significantly, thus increasing the average daily energy from snacks (Jahns et al., 2001). Nielsen and colleagues (2002) found that CSFII data showed the increase in energy intake occurred predominantly from snacks particularly from 1989 to 1996 among adolescents. Thus the increase in snacking may be contributing to the epidemic of obesity in children and adults (Jahns et al., 2001; Zizza et al., 2001).
Trends in Portion Sizes
Portion sizes have increased steadily over the past 30 years (Nielsen et al., 2002; Young and Nestle, 2002). Data suggest that the trend toward larger portion sizes began in the 1970s, increased sharply in the 1980s, and has continued to increase (Young and Nestle, 2002). Between 1977 and the mid-1990s, food portion sizes for Americans aged 2 years and older increased both inside and outside the home for salty snacks, desserts, soft drinks, fruit drinks, french fries, hamburgers, cheeseburgers, and Mexican-type foods (Nielsen et al., 2002).
Larger portions not only contain more calories, but also encourage people to eat more. A recent controlled laboratory study found that increasing the portion size of all foods resulted in a significant increase in energy intake that was sustained over two days (Rolls et al., 2006). Because portion size affects energy balance, there is a need for greater attention to food portion size and consuming recommended serving sizes, such as those in the DGA.
LIMITATIONS IN RESEARCH ON CHILDREN’S DIETS
Measuring what people eat and drink is one of the most challenging aspects of population-based nutrition research studies. Studies assessing dietary intake patterns; nutrient intakes and nutrition; and health and disease relationships, especially population-based epidemiological studies, rely predominantly on self-reporting using dietary assessment instruments such as 24-hour recalls, diet records, or food frequency questionnaires. Although it is recognized that self-reported dietary intake data reflects underestimates of food intake and, in turn, energy intake, the magnitude of this effect in different populations is not clear. Studies using doubly-labeled water show that underreporting of food intake is pervasive in adults. Underreporting constitutes anywhere from 10 to 45 percent of the total, depending on the age, gender, and weight of the respondents (Johnson, 2000). Underreporting tends to increase in prevalence as children mature, is more common
among women than men, and is higher among overweight and obese adults (Johnson, 2000).
Other factors associated with underreporting include perceived social desirability of intake patterns, body image dissatisfaction, dieting, and greater eating restraint (Maurer et al., 2006). Social desirability may influence not only self-reported total energy intake, but also the likelihood of underreporting socially undesirable food intake patterns such as the consumption of high-fat, high-sugar foods and beverages (Maurer et al., 2006). On the other hand, social desirability of healthy foods such as fruits and vegetables can result in overreporting (Maurer et al., 2006).
Misreporting of food intake may result from errors in the estimation of portion sizes, inability or unwillingness to record or remember everything that was eaten, unintentional omission of certain foods or portions, and deliberate misreporting. Engaging in the recording process or anticipating the report of food intake may cause an individual to temporarily change the way he or she eats (Maurer et al., 2006). It is also more difficult to remember what was eaten between meals, which is an issue for children and adolescents who may snack frequently. Dietary intake research on young children also presents special challenges; the child’s parent or teacher may be relied on to recall the child’s intake, thus introducing a third party and further complicating the assessment process (Goran, 1998).


