
4
Overview of the NSF SBIR Program
4.1
A BRIEF HISTORY OF THE NSF’S SBIR PROGRAM
4.1.1
The Nation’s First SBIR Program
Between 1977 and 1980, the NSF operated the only federal research grant program solely for small businesses. It was called “SBIR.”
The Department of Defense (DoD) started a parallel small business initiative in 1980. Hence, there were two small business initiatives operating on July 22, 1982, when Congress passed the Small Business Innovation Development Act authorizing the SBIR program.
Upon passage of that act, the NSF designated its 1977 precursor program the agency’s SBIR program, and it became the nation’s first. The program appears to have kept essentially the same philosophy, focus, and features of the original NSF initiative. Then and now, the NSF SBIR program’s emphasis on promoting small business and entrepreneurial research differs from that of the rest of the agency, which focuses on the support of academic research. The NSF’s SBIR program also continues to differ in important ways from the SBIR programs operated by the other major R&D agencies.
4.1.2
Factors That Led to Establishment of the NSF’s SBIR Program
The NSF established the precursor SBIR program in response to efforts of the small business community to secure research funding. Small companies were at a disadvantage in seeking research funding from the NSF because of the strong orientation of the agency toward the university community. Many entrepreneurs thought that the NSF believed that quality research was synonymous with aca-
demic research. Small companies reportedly were also at a disadvantage when competing for funding at DoD and NASA because those agencies’ procurement process was oriented toward large, complex systems and the companies that could supply them. The NSF’s precursor SBIR program was established in part to respond to complaints by the small business community that it was being shut out of government funding for innovative research and for procurement and in part due to the conviction of key individuals within the NSF that small business represented an untapped resource.
4.1.3
The NSF’s Early Emphasis on Commercialization
As is often the case, the right people in the right place at the right time played a critical role in shaping the NSF’s response to the complaints by the small business community. These key individuals were Roland Tibbetts, who was instrumental in establishing the precursor SBIR program and rightly receives credit for developing the SBIR concept along with Ritchie Coryell. Interestingly both individuals had business training and shared the view that small companies could produce innovative, high quality research that could contribute to the nation’s science base. Furthermore, they believed that the small companies with the drive and know-how to commercialize were likely to be the same companies that could perform high quality research—a view that led the NSF program to have from the start a strong emphasis on commercialization That has continued and increased to the present time.1
According to Mr. Coryell, the view driving NSF’s formulation of its small business initiative was that the agency already had a substantial emphasis on academic research in its grant programs. To provide a real counterpoint, the new program would target small companies and stress commercialization while also promoting innovation and high quality research.2 These dual goals were considered completely compatible by the developers of the original SBIR program.3 The NSF SBIR program’s emphasis on commercialization, then and now, contrasts strongly with NSF’s otherwise strong orientation towards funding academic research as a means of contributing to the nation’s science and technical knowledge base.
4.2
NSF SBIR DEMOGRAPHICS
This section uses data tables and graphs to provide an overview of the NSF’s SBIR program in terms of the number of proposals received and the number and dollar amounts of grants made. It looks at the data by grant phase, by type of applicant, and by state.4 The period covered is 1992 to 2005, in most cases. There are certain subcategories for which data were not available back to 1992 or were not extended through 2005. Appendix A contains data tables from which tables and graphs used in this section are drawn.
4.2.1
Description of the NSF’s SBIR Grants
To recap, the entry level Phase I grant lasts six months and is currently capped at $100,000. Those who receive a Phase I grant from the NSF are eligible to apply for a follow-on NSF Phase II grant in an amount up to $500,000 for a period of up to two years. The NSF’s grant arrangement is essentially the same as that of other agency programs up to this point. Past this point, however, the NSF’s SBIR program has developed special features.
In 1998, the NSF introduced an innovation in its Phase II grant to promote increased commercialization. It split the Phase II grant into two parts: a “regular” Phase II grant of up to $500,000 and extending over two years, and a “supplemental” Phase II grant, called a “Phase IIB,” for which the grantee could apply as a follow-on to the initial Phase II grant. The Phase IIB grant provided a minimum of $50,000 and a maximum of $250,000 (until November 2003—see below). The Phase II grant also extends the research time by a year. The NSF’s SBIR program essentially holds back what could otherwise be part of Phase II funding and grants it as a supplement to those Phase II grantees who show evidence of commercialization potential as indicated by their ability to attract third-party funding.
To receive supplementary funding under the Phase IIB grant, the grantee must have completed one year of work on the initial Phase II grant (or receive special permission from the NSF SBIR program officer) and must show hard evidence that it has secured $2 of funding from other sources for each dollar of supplementary funding provided by the NSF. As can be inferred from the minimum grant size of $50,000, this means the grantee must have a minimum of $100,000 in funding from other sources to be eligible for a Phase IIB grant.
After November 1, 2003, the NSF’s SBIR program increased the maximum Phase IIB supplement to $500,000 by adding a “Phase IIB+” supplemental grant of up to $250,000 for an additional year to the existing $250,000 maximum
Phase IIB grant. The Phase IIB+ grant carries the same two-to-one requirement for third-party funding, but it adds a stipulation that the Phase IIB+ third-party funding cannot come from a federal source.
Together, Phase II, Phase IIB, and Phase IIB+ cannot last longer than four years. Thus, the combined maximum grant for Phase II and related Phase IIB/ IIB+ supplements has increased from $750,000 to $1 million. (For additional discussion of the Phase IIB/IIB+ supplement, see Section 8.5.)
4.2.2
Annual Dollar Outlays and Number of Grants
As explained above, grants and associated dollar outlays are made by the NSF SBIR program office through three funding tools: Phase I, Phase II, and Phase IIB/IIB+ grants. The number of grants and dollar outlays by type change over time in response to multiple factors, including the following: (1) changes in the NSF R&D budget; (2) changes in the SBIR program percentage that is applied to the NSF R&D budget to compute the SBIR program’s annual budget; (3) the timing and types of solicitations held and company responses to them; and (4) the prior distribution of funding among Phase I, Phase II, and Phase IIB/ IIB+. According to NSF program officials, there is no formulaic approach to the allocation of funding among the types of grants. The distribution of outlays in a given year is to some extent a function of prior decisions. For example, a spike in Phase I outlays in one year drives a lagged spike in Phase II outlays.
The study selected the time period for coverage as 1992–2005. The NSF has not converted all of its historical data to electronic form. When certain subcategories of data were not available for the entire period, the period covered is stated. In several other cases, such as state data, charts and tables were prepared prior to release of the 2005 data, and they were not updated if the existing data adequately addressed the subject.
Phase I Grants. Figure 4.2-1 shows total NSF funding for Phase I SBIR grants from 1992 through 2005. Two jumps in funding for Phase I grants are apparent: from 1992 to 1994, when Phase I outlays almost doubled, rising from $10.3 to $19.8 million between 1992 and 1997, and from 2001 to 2003, when the funding amount again almost doubled, rising from $21.8 million to $43.4 million. Between 1994 and 2001, outlays for Phase I fluctuated but remained close to $20 million.
The spike in Phase I funding in 2003 was, according to NSF managers, a strategic decision to respond to current events. With the collapse of the venture capital bubble and the events of September 11, 2001, small businesses found that traditional sources of private funding had dried up. Responding to this situation, the NSF increased its acceptance rate, maintaining that rate even as the number of proposals increased dramatically in 2003. Not being able to sustain this level of activity with available funds, the NSF scaled back by decreasing the success
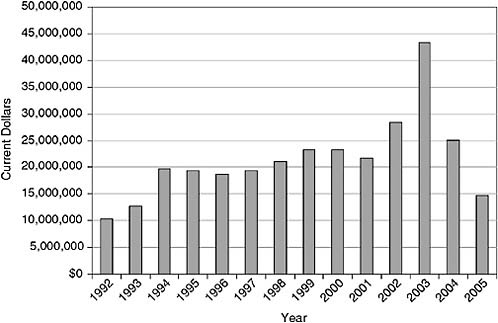
FIGURE 4.2-1 Annual Outlays for Phase I NSF SBIR Grants, 1992–2005 (Current Dollars).
SOURCE: Developed from data provided by NSF SBIR program.
rate and by going to an eighteen-month cycle to reduce the number of proposals. Reflecting these changes since 2003, outlays for Phase I grants dropped substantially—to $25.1 million in 2004, and to $14.7 million in 2005.
Figure 4.2-2 combines a bar chart showing the number of Phase I grants over the period 1992 to 2005 with a line chart showing the average size of Phase I grants. The line chart of Figure 4.2-2 shows the increase in the average grant size from 1992 to 1998, from approximately $50,000 to approximately $100,000 (reflecting changes in maximum grant size). Since 1998, the average Phase I grant size has remained essentially unchanged in current dollars, which means that it has declined steadily in constant dollars.
Phase II Grants. Figure 4.2-3 shows total NSF outlays on Phase II grants (excluding Phase IIB grants) over the same fourteen years, 1992–2005. From 1992 to 1995, annual Phase II outlays were consistently below $15 million. A steep rise occurred between 1995 and 1998, when annual outlays for Phase II grants rose to $40 million. Between 1998 and 2003, total annual outlays fluctuated between $35 million and $43 million. A surge in dollar outlays for Phase II grants occurred in 2004 and continued into 2005, following the surge in dollar outlays for Phase I grants in 2003.
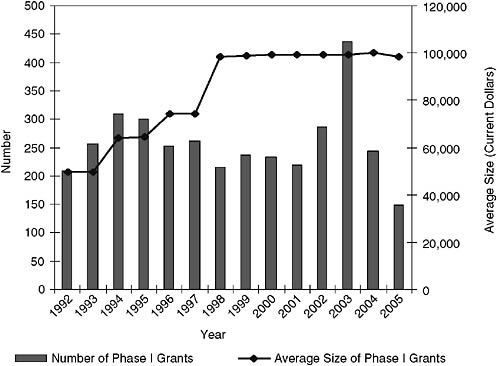
FIGURE 4.2-2 Number and Average Size of NSF SBIR Phase I Grants (Current Dollars), 1992–2005.
SOURCE: Developed from data provided by NSF SBIR program.
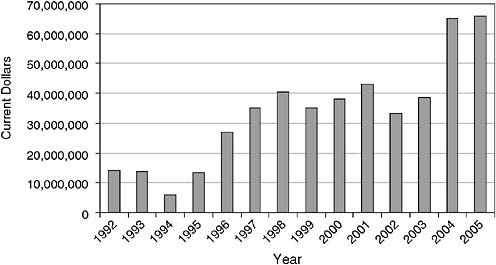
FIGURE 4.2-3 Annual Outlays for Phase II NSF SBIR Grants, 1992–2005 (Current Dollars)
SOURCE: Developed from data provided by NSF SBIR program.
NOTE: Excludes Phase IIB grants.
Figure 4.2-4 combines a bar chart showing the yearly number of Phase II grants and a line chart showing the average size of Phase II grants. The number of grants increased sharply from 1994 to 1997, fell through 2003, and then surged again in 2004. The average Phase II grant size ranged between $245,000 in 1992 and $289,000 in 1997, then rose to about $400,000 in 2000, and since 2002 has been close to the maximum allowed size of $500,000. Again, the dollar amounts are given in current dollars.
Phase IIB Grants. Figure 4.2-5 shows outlays for Phase IIB grants from 1998, when they first began, through 2005. The amount spent on these grants reached $9.6 million in 2002, dropped in 2003 and 2004, and rose again to $9.3 million in 2005.
Table 4.2-1 summarizes the number, total dollar amount, average size, and range of Phase IIB grants from 1998 to 2005. In 1998, these supplemental grants averaged about $100,000 the first year, and only four Phase IIB grants were approved. During the second year, 1999, the average grant size was about the same, but more grants (twenty one) were made. In 2000, the average grant size nearly doubled, but only nine grants were approved. Between 2001 and 2005, the average grant size fluctuated, ranging from $235,000 to $330,000, and the number of grants fluctuated between fourteen and thirty-nine.
In total, the NSF’s SBIR program approved 161 Phase IIB grants from 1998 through 2005. The smallest Phase IIB grant was $51,000 and the largest was

FIGURE 4.2-4 Number and Average Size (Current Dollars) of NSF SBIR Phase II grants, 1992–2005.
SOURCE: Developed from data provided by NSF SBIR program.
NOTE Excludes Phase IIB grants.
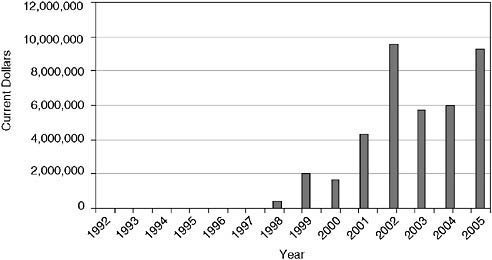
FIGURE 4.2-5 Annual Outlays for NSF SBIR Phase IIB Grants, 1992–2005 (Current Dollars).
SOURCE: Developed from data provided by NSF SBIR program.
NOTE: Includes both Phase IIB and IIB+ grants.
TABLE 4.2-1 Phase IIB Awards from Start in 1998 to 2005
$500,000. Over this period, the program provided nearly $39 million in these supplemental grants to those Phase II projects for which third-party financing had been raised. The amount of funding issued under this supplemental program was constrained by the ability of Phase II grantees to obtain firm commitments from third parties for funding.
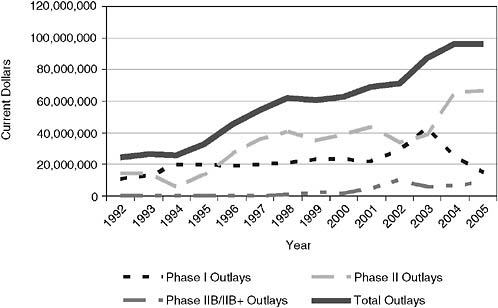
FIGURE 4.2-6 Outlays by Grant Phase, NSF SBIR, 1992–2005 (Current Dollars).
SOURCE: Developed from data provided by NSF SBIR program.
All Grants. Figure 4.2-6 shows the total annual dollar outlays for the NSF’s SBIR program from 1992 through 2005. While outlays for each type of grant increased over this period, large increases in Phase II spending drove the significant jump in total outlays. Most recently, in 2004 and 2005, the trend in total NSF SBIR outlays has been flat.
4.2.3
Applications and Success Rates
The NSF funded between 14 percent and 21 percent of the approximately 1,000 to 2,000 Phase I proposals received each year over the period 1994–2005. The highest funding rates occurred in 2002 and 2003.
According to the NSF’s response to the NRC Program Manager Survey, 80 percent of Phase I recipients in a recent year applied for a Phase II grant.5 However, 68 percent of the firms in the Phase I Survey sample, taken over a range of years, said they applied for a direct follow-on Phase II grant.6 Whatever the true figure, an average of close to 200 Phase II proposals have been submitted yearly from 1994 to 2005, and the NSF annual acceptance rate has ranged from 17 per-
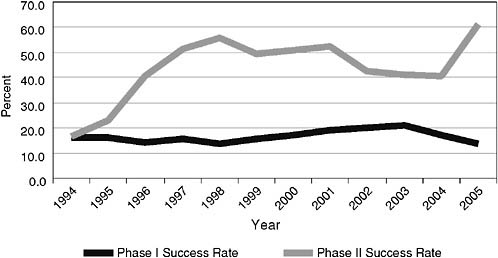
FIGURE 4.2-7 Success Rates of Applicants for Phase I and II Grants, 1994–2005.
SOURCE: Developed from data provided by NSF SBIR program.
cent to 61 percent over the same period. The lower annual acceptance rates, however, all came during the early years of the program. Since 1997, acceptance rates have for the most part ranged between 40 percent and 60 percent. Figure 4.2-7 compares the success rates for Phase I and II grants from 1994 through 2005.
According to one program official, 30 percent of Phase II recipients in a recent year applied for a Phase IIB grant and 25 percent of Phase II recipients received Phase IIB grants.7 All companies that found outside funding had their Phase IIB applications approved. Companies who are unable to meet the third-party financing requirement simply withdraw their proposal.8 Allowing for a one-year lag, the number of Phase IIB grants as a percentage of Phase II awards ranged from 3 percent in 1998 to a maximum of 42 percent in 2002. In 2005, the number of Phase IIB grants was 21 percent of 2004 Phase II grants.
4.2.4
Geographical Location of Grants and Applicants
Table 4.2-2 shows the geographical distribution of Phase I grants from 1992 through 2004. The top two recipient states, California and Massachusetts, accounted for more than 1,000 grants, approximately 30 percent of the total. These two states, plus the next eight states—Colorado, New York, Texas, New
TABLE 4.2-2 Distribution of Phase I NSF SBIR Grants by State in Descending Order of Grants Received, 1992–2003
Jersey, Connecticut, Virginia, Maryland, and Ohio—received more than 2,000 grants, 65 percent of the total. That these states received the most grants is not a surprise; they all have established high-tech clusters. The bottom 20 states accounted for fewer than 200 grants and less than 6 percent of total grants.
Table 4.2-3 shows the distribution of Phase II grants by state. Again, California and Massachusetts received a large share of the grants—approximately 40 percent. And, in this case, the same technologically advanced states made up the top ten (though not in the same order) and took an even bigger share of the total number of grants—74 percent. The bottom 20 states, each of which received less than one-tenth of 1 percent of grants, accounted for less than 9 percent of 821 Phase II grants.
TABLE 4.2-3 Distribution of Phase II Grants by State in Descending Order of Grants Received, 1992–2004
|
State |
Grants |
Percent of All |
State |
Grants |
Percent of All |
|
CA |
228 |
27.8 |
NH |
10 |
<0.05 |
|
MA |
139 |
16.9 |
MT |
12 |
<0.05 |
|
CO |
57 |
6.9 |
VT |
8 |
<0.05 |
|
NY |
56 |
6.8 |
DE |
8 |
<0.05 |
|
VA |
39 |
4.8 |
WI |
8 |
<0.05 |
|
CT |
38 |
4.6 |
HI |
6 |
<0.05 |
|
MD |
36 |
4.4 |
ND |
7 |
<0.05 |
|
TX |
35 |
4.3 |
OK |
6 |
<0.05 |
|
OH |
32 |
3.9 |
SD |
5 |
<0.05 |
|
NJ |
29 |
3.5 |
WY |
6 |
<0.05 |
|
MI |
24 |
2.9 |
AK |
4 |
<0.05 |
|
NM |
24 |
2.9 |
IN |
4 |
<0.05 |
|
MN |
21 |
2.6 |
KS |
5 |
<0.05 |
|
PA |
21 |
2.6 |
ME |
4 |
<0.05 |
|
IL |
20 |
2.4 |
SC |
6 |
<0.05 |
|
WA |
20 |
2.4 |
AR |
6 |
<0.05 |
|
AZ |
17 |
2.1 |
KY |
3 |
<0.05 |
|
FL |
17 |
2.1 |
MO |
5 |
<0.05 |
|
TN |
15 |
1.8 |
ID |
2 |
<0.05 |
|
GA |
15 |
1.8 |
LA |
3 |
<0.05 |
|
OR |
14 |
1.7 |
MS |
1 |
<0.05 |
|
UT |
13 |
1.6 |
NE |
1 |
<0.05 |
|
NC |
12 |
1.5 |
NV |
1 |
<0.05 |
|
AL |
11 |
1.3 |
RI |
1 |
<0.05 |
|
|
|
|
DC |
1 |
<0.05 |
|
|
|
|
IA |
1 |
<0.05 |
|
SOURCE: NSF SBIR program. |
|||||
The states that had the most Phase I grants did not necessarily have the highest success rates in terms of percentage of proposals funded. Similarly, the states with fewer Phase I grants did not necessarily have the lowest success rates. For example, Nebraska and Wyoming had high success rates, but they were near the bottom in terms of total grants. Wyoming had a higher success rate than California, which had the most proposals funded. The sheer number of proposals submitted from companies in the states with the most Phase I grant winners accounted for these states’ large share of grants, not a higher-than-average success rate.
Because Phase I is prerequisite to Phase II, the states with many Phase I grant winners are positioned to be large winners in Phase II and Phase IIB. However,
TABLE 4.2-4 Distribution of NSF SBIR Phase IIB Grants by State in Descending Order of Grants Received, 1998–2005
|
State |
Grants |
Percent of All |
State |
Grants |
Percent of All |
|
CA |
36 |
22.4 |
DE |
2 |
1.2 |
|
MA |
21 |
13.0 |
KS |
2 |
1.2 |
|
NY |
11 |
6.8 |
NH |
2 |
1.2 |
|
NC |
7 |
4.3 |
NM |
2 |
1.2 |
|
OH |
7 |
4.3 |
TN |
2 |
1.2 |
|
MN |
6 |
3.7 |
UT |
2 |
1.2 |
|
FL |
5 |
3.1 |
VT |
2 |
1.2 |
|
MD |
5 |
3.1 |
WI |
2 |
1.2 |
|
VA |
5 |
3.1 |
AK |
1 |
0.6 |
|
AL |
4 |
2.5 |
AZ |
1 |
0.6 |
|
IL |
4 |
2.5 |
HI |
1 |
0.6 |
|
MI |
4 |
2.5 |
MT |
1 |
0.6 |
|
PA |
4 |
2.5 |
ND |
1 |
0.6 |
|
GA |
3 |
1.9 |
OK |
1 |
0.6 |
|
TX |
3 |
1.9 |
OR |
1 |
0.6 |
|
WA |
3 |
1.9 |
RI |
1 |
0.6 |
|
WY |
3 |
1.9 |
SC |
1 |
0.6 |
|
CO |
2 |
1.2 |
SD |
1 |
0.6 |
|
CT |
2 |
1.2 |
|
|
|
|
SOURCE: NSF SBIR program. |
|||||
as may be seen in Table 4.2-4, the largest winners in Phase II are not always the largest winners in Phase IIB. Thus, splitting off part of the funding that could have been awarded in lump sums to Phase II grantees and instead awarding it in Phase IIB grants based on the ability of the grantees to obtain third-party support changes the geographical distribution of SBIR funding.9
4.2.5
Women and Minorities as Applicants, Grantees, and Principal Investigators
A statutory goal of the SBIR program is to foster and encourage participation by women and minorities in technological innovation.
Woman-Owned Businesses. Figure 4.2-8 shows the number of Phase I proposals from and grants received by woman-owned businesses from 1994 through 2005. With the exception of the bump-up in 2002 and 2003, there is clearly no upward trend. In other words, while woman-owned businesses do participate in the NSF’s SBIR program, that participation does not seem to be increasing over time.
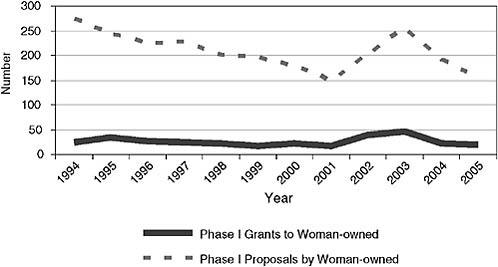
FIGURE 4.2-8 Numbers of Phase I Grants to and Proposals from Woman-owned Firms, 1994–2005.
SOURCE: Developed from data provided by the NSF SBIR program.
Figure 4.2-9 shows the number of Phase II proposals from and grants received by woman-owned businesses from 1995 through 2005. Note the erratic patterns, with no clear trend in either data series.
Figure 4.2-10 shows the number of Phase IIB grants received by woman-owned businesses annually from 1998 through 2005. In this case, there is no separate proposal data series because proposals that do not meet the third-party funding requirement are withdrawn. The numbers are small and show no obvious trend. Woman-owned businesses receive a few Phase IIBs each year.
The comparative success rates of woman-owned businesses relative to all participating businesses in obtaining grants are shown in Figure 4.2-11. Woman-owned businesses received 10 percent of NSF Phase I grants from 1994 through 2005. Their annual share ranged from 7 percent to 13 percent. The average size of the Phase I grants to woman-owned businesses was approximately the same as that received by businesses overall.
Woman-owned businesses received 7 percent of Phase II grants over the period 1995 to 2005, with their annual share ranging from 2 to 14 percent. Again, there was no significant difference between the size of Phase II grants to woman-owned and to businesses overall.
For Phase IIB grants, the numbers were small and the share of Phase IIB grants given to woman-owned businesses fluctuated, ranging from 0 percent to
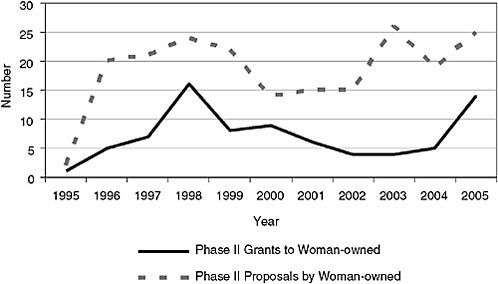
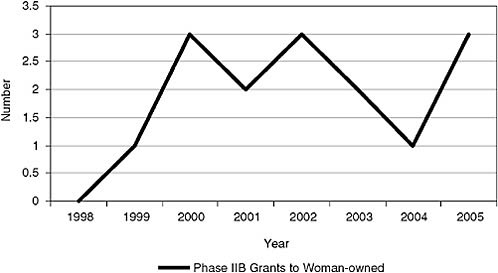
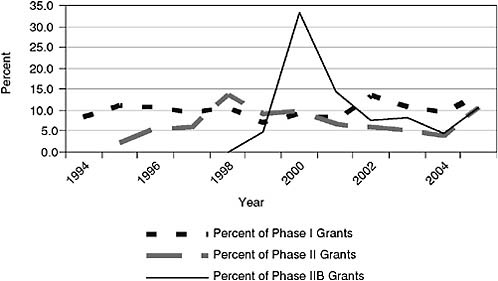
FIGURE 4.2-11 Shares of Phase I, Phase II, and Phase IIB NSF SBIR Grants to Woman-owned Businesses, 1994–2005.
SOURCE: Developed from data provided by the NSF SBIR program.
33 percent. Overall, woman-owned businesses received 9 percent of Phase IIB grants from 1998 through 2005.
Figure 4.2-12 shows that in every year since 1994, woman-owned businesses have been less successful than applicants in general in having their Phase I applications approved. Over the period 1995–2005, woman-owned businesses contributed 12 percent of all Phase I applications (2,069/16,897), and received 9.5 percent of all Phase I grants. In half the years, the success rate of woman-owned businesses was 70 percent or less the rate for all applicants.10 Statistical tests of significance showed the differences in success rates between woman-owned and all firms at Phase I to be highly significant, with the probability of obtaining the t-test results to be 0.000 if there were no real differences in success rates for woman-owned firms.11
Figure 4.2-13 shows that woman-owned businesses also had a lower success rate than businesses overall in getting Phase II proposals approved. In all except three of the ten years from 1995 through 2005, the success rate of woman-owned businesses fell below that of all businesses in having their Phase II applications
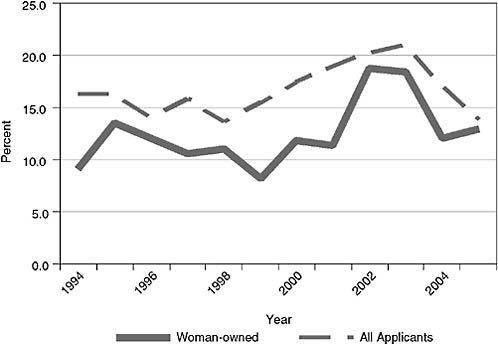
FIGURE 4.2-12 Comparative Success Rates for Woman-owned versus All Applicants in Having Their Phase I Proposals Approved, 1994–2005.
SOURCE: Developed from data provided by the NSF SBIR program.
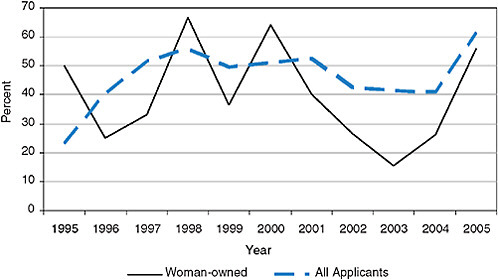
FIGURE 4.2-13 Comparative Success Rates for Woman-owned versus All Applicants in Having Their Phase II Proposals Approved, 1995–2005.
SOURCE: Developed from data provided by the NSF SBIR program.
TABLE 4.2-5 Aggregate Proposals and Grants, Woman-owned and All Businesses, 1995–2005
funded. Woman-owned businesses contributed 9 percent of all Phase II applications submitted from 1995 to 2003 (203/2,299) and received 7.5 percent of all Phase II grants (79/1059). Overall, from 1995 through 2005 woman-owned businesses had 39 percent of their Phase II proposals accepted and all businesses had 46 percent of their Phase II proposals accepted. Statistical tests of significance, however, showed these differences to be less robust than those at Phase I. The null hypothesis—that there is no statistical difference in success rates at Phase II—could not be rejected.12
Table 4.2-5 summarizes applications by and grants to woman-owned businesses from 1995 through 2005. Overall, woman-owned businesses submitted 11.7 percent of all applications and received 8.9 percent of all grants. Overall, woman-owned businesses had 16 percent of their proposals approved (362/2,262), and businesses overall had 21 percent of their proposals approved (4,053/19,357).
Minority-Owned Businesses. Minority-owned businesses—businesses owned by a member of a U.S. minority group, such as Asian Americans, American Indians, African Americans, or Hispanic Americans13—generally fared less well than businesses overall, both in their share of Phase I and Phase II grants and in their application approval rates. However, disadvantaged or minority-owned
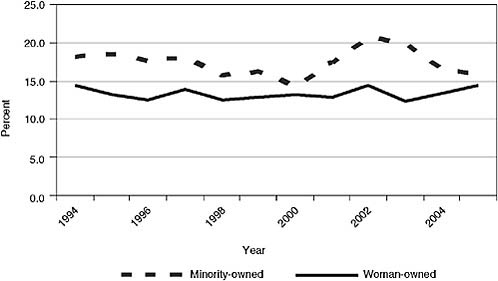
FIGURE 4.2-14 Share of Total Phase I Proposals from Minority- versus Woman-owned Companies, 1994–2005.
SOURCE: Developed from data provided by the NSF SBIR program.
businesses had a larger share of proposals (see Figure 4.2-14), a larger share of grants (see Figure 4.2-15), and a higher application approval rate than did woman-owned businesses (see Figure 4.2-16).
The shares of Phase I, Phase II, and Phase IIB grants that have gone to minority-owned businesses (shown in Figure 4.2-17) are slightly higher than the shares for woman-owned firms. The patterns are similar, as may be seen by comparing Figure 4.2-11 with Figure 4.2-17.
Figure 4.2-18 shows that minority-owned businesses, like woman-owned businesses, had a consistently lower application approval rate for Phase I proposals than businesses overall. This difference was found to be strongly statistically significant.14 The annual success rate was also lower in most years for these companies in the Phase II grant process, but statistical tests of significance showed these differences to be less robust than those at Phase I. The null hypothesis—that there is no statistical difference in success rates at Phase II—could not be rejected.15
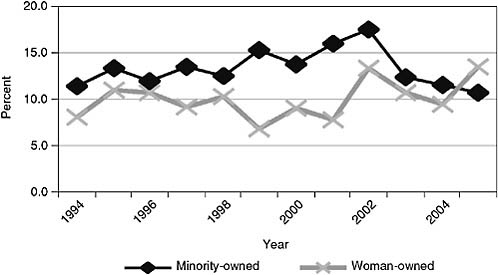
FIGURE 4.2-15 Share of Phase I Grants to Minority- versus Woman-owned Companies, 1994–2005.
SOURCE: Developed from data provided by the NSF SBIR program.
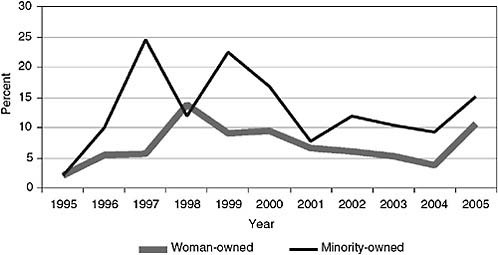
FIGURE 4.2-16 Share of Phase II Grants to Minority- versus Woman-owned Companies, 1995–2005.
SOURCE: Developed from data provided by the NSF SBIR program.
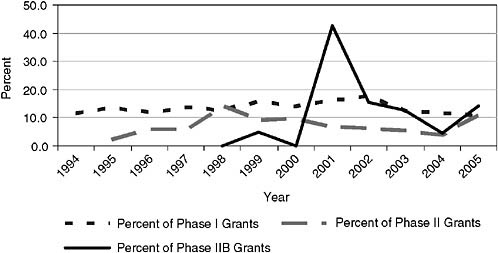
FIGURE 4.2-18 Phase I Success Rates for Minority-owned Businesses and for All Applicants, 1994–2005.
SOURCE: Developed from data provided by the NSF SBIR program.
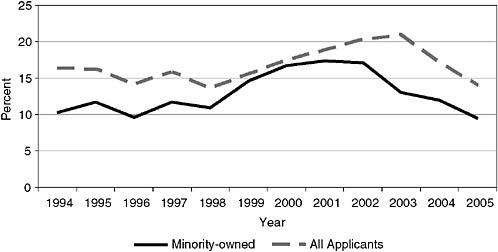
FIGURE 4.2-17 Shares of Phase I, Phase II, and Phase IIB NSF SBIR Grants to Minority-owned Businesses, 1994–2004.
SOURCE: Developed from data provided by the NSF SBIR program.
|
Box A T/J Technologies, Inc.: Bringing Nanoenergy Technologies to Market An innovative materials research company facing a long path to commercialization, T/J Technologies has used the SBIR program and other federal grants to get started and to build the firm’s technological capacity and commercial potential. Maria Thompson started T/J Technologies in 1991 with her husband by taking over a Department of Defense SBIR Phase I grant from a company that was divesting itself of its nonessential contractual obligations. From its initial work in ultrahard coatings, this minority-owned company moved on to developing ultracapacitors with the aid of additional SBIR grants. These grants, in turn, allowed T/J Technologies to develop advanced materials and devices for electrochemical energy storage and conversion. The company now holds several patents in the area of nanomaterials for alternative energy technologies, and it is recognized for its technologically advanced batteries, ultracapacitors, and fuel cells. These advanced energy technologies power automobiles and other equipment more efficiently and safely. Novel nanomaterials in their Li-ion batteries allow for higher rates of performance, longer life, lower cost, smaller size, and lighter weight than similar batteries. Moreover, because these Li-ion batteries do not contain cobalt, they are far safer environmentally. SBIR has been an integral part of T/J Technologies’ building block strategy, says Maria Thompson. SBIR grants enabled the company to start and build its initial capacity. This in turn enabled the company to pursue government research contracts, which in turn makes it possible for the company to form commercial partnerships with much larger firms to test and demonstrate the commercial potential of its materials. |
Table 4.2-6 summarizes SBIR applications from and grants for minority-owned businesses from 1995 through 2005. Overall, minority-owned businesses submitted 15.3 percent of all proposals and received 11.9 percent of all grants. Minority-owned businesses had 18 percent of their proposals approved (549/2,971), while all businesses had 21 percent of their proposals approved (4,053/19,357).
Women and Minorities as Principal Investigators. The NRC Phase II Survey provided data showing the frequency with which women and minorities serve on projects as the principal investigator—essentially, its technical leader. The survey found that 79 percent of projects surveyed had white males as principal investigators, while 21 percent had women, minorities, or both. Of these, 12 percent were women, 13 percent were minorities, and 4 percent were overlapping, i.e., minority women.
TABLE 4.2-6 Aggregate Proposals and Grants, Minority-owned and All Businesses, 1995–2005
4.2.6
Multiple Grant Winners and New Grant Winners
A company may receive multiple grants to develop multiple technologies aimed at multiple application areas, using a variety of commercialization strategies. An example provided by Luna Innovations, Inc., illustrates how receiving multiple grants is not synonymous with being a “grant mill,” i.e., simply existing off multiple SBIRs without pursing any path to commercialization.
Luna, for example, has received SBIR grants from the NSF, Air Force, Army, Navy, EPA, DOC/NIST, USFA/DOA, DNA/DSWA/DTRA, DOT, and OSD. It has received multiple Phase I, Phase II, and Phase IIB grants from the NSF’s SBIR program. The company has used SBIR grants to help move innovative ideas along a pipeline from which Luna has launched products and businesses. For every $1 of SBIR funding awarded, Luna reportedly has generated $2 in non-SBIR investment funding.
Luna has spun off six companies pursuing diverse technologies including optical test instrumentation, oil and gas sensors, wireless sensing, proteomics and clinical diagnostics, cancer inhibitors, and carbon-based nanomaterials. Recognized for its technical and business acumen, the company received the SBA Tibbetts award three times, most recently in 2006. It was named one of the 500 fastest growing companies in the United States in 1998. Founded in the early 1990s, Luna was listed on the NASDAQ in June 2006.16
Now, let us consider NSF’s multiple-grant winners from a statistical perspective. Limitations are that at the time of this study records had been digitized only back to the early 1990s; furthermore, the classifications did not take into account grants that companies may have received from the SBIR programs of other agencies. As the Luna example showed and as the case studies found, companies typically participated in the SBIR programs of multiple agencies. Thus, it should
|
Luna Innovations, Inc., Demonstrates the Use of Multiple Awards from Multiple Agencies for Multiple Technologies taken to Market along Multiple Paths
|
be noted that companies that received only one SBIR grant from the NSF may have received grants from other agencies.
Table 4.2-7 indicates for each year, 1996–2003, the percentage of Phase I grants each year that went to companies who had already received a grant that year, that is, to each year’s multiple winners. The percentage ranges from 12.4 to 17.9 percent.
Most Phase I grant winners over the period covered received only one Phase I grant from the NSF, and less than 6 percent received more than five Phase I grants. Figure 4.2-19 shows the distribution of 1,618 company grant recipients over this same period by the number of Phase I grants they received. Ninety-four percent received one to five grants. At the top end, less than 1 percent (0.3 percent) received 31 to 40 grants. A single company received 40 grants over the period.
Figure 4.2-20 shows how multiple-grant winners affected the distribution of Phase I grants from 1996 to 2003. The 94.4 percent of companies that received
TABLE 4.2-7 Percentage of Phase I Grants Going to Multiple-Grant Winners Within a Given Year, 1996–2003
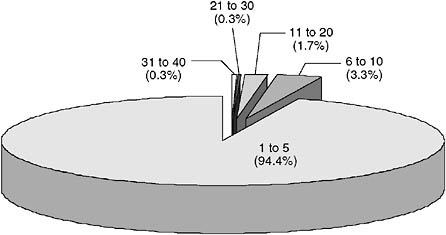
FIGURE 4.2-20 Distribution of Phase I Grants to Companies by Number of Grants Received, 1996–2003.
SOURCE: Developed from data provided by the NSF SBIR program.
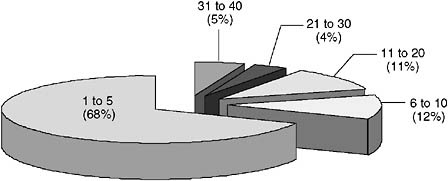
FIGURE 4.2-19 Distribution of Phase I Grantees by Number of Phase I Grants Received, 1996–2003.
SOURCE: Developed from data provided by the NSF SBIR program.
between one and five grants as a group received only 68 percent of Phase I grants. Meanwhile, less than 6 percent of the multiple-grant winners received 32 percent of Phase I grants.
One company with six Phase I grants had all six followed up by Phase II grants. But all other multiple Phase I winners were less than 100 percent successful in having their Phase I grants followed by Phase II grants. The top nine companies in terms of Phase I grants received had 50 percent or more of their Phase I grants followed by Phase II grants. Eight of the top twenty Phase I grant-winners were not among the top 20 Phase II winners. Thus, there were multiple
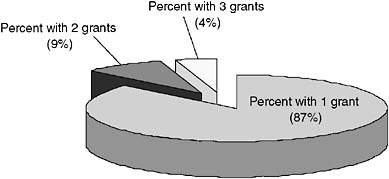
FIGURE 4.2-21 Distribution of Grantees by Number of Phase IIB Grants, 1998–2005.
SOURCE: Developed from data provided by the NSF SBIR program.
TABLE 4.2-8 Percentage of Phase I Winning Companies Who Had Not Previously Received an SBIR Grant from the NSF, 1996–2003
|
Fiscal Year |
Previous Winners |
New Winners |
Percent New Winners |
|
1996 |
98 |
109 |
52.7 |
|
1997 |
99 |
116 |
54.0 |
|
1998 |
83 |
100 |
54.6 |
|
1999 |
113 |
81 |
41.8 |
|
2000 |
97 |
108 |
52.7 |
|
2001 |
92 |
95 |
50.8 |
|
2002 |
99 |
133 |
57.3 |
|
2003 |
138 |
236 |
63.1 |
|
SOURCE: NSF SBIR program. |
|||
Phase II grants to certain companies, but the concentration was much less than at the Phase I level. For example, the maximum number of Phase II grants given to a single company over the period 1996–2003 was twelve, which went to the company that received forty Phase I grants.
As Figure 4.2-21 shows, 87 percent of Phase IIB grantees received only one Phase IIB grant from the time the program started in 1998 through 2005. Nine percent had received two grants; 4 percent had received three grants. Thus, the majority of Phase IIB grants went to grantees that had never won one before.
New Grant Winners. In recent years, 42 to 63 percent of grant recipients had never received an SBIR grant before.17 As may be seen in Table 4.2-8, in most years more than half the grant recipients were new to the program.
4.3
PROGRAM ORGANIZATION AND STRUCTURE
4.3.1
Organization
The organization chart in Figure 4.3-1 shows how the SBIR program fits within the broader structure of the NSF. The SBIR program is housed within the Directorate for Engineering, one of seven directorates and three offices comprising NSF. The SBIR program is grouped with the Small Business Technology Transfer (STTR) program, the Innovation and Organizational Change (IOC) program, and the Grant Opportunities for Academic Liaison with Industry (GOALI) program, under the designation “Industrial Innovation Programs” within the Office of Industrial Innovation (OII). Until recently, the OII reported to the Directorate for Engineering’s Division of Design, Manufacture and Industrial Innovation, as shown by the solid black arrows in the figure. Now, the OII reports to the assistant director of the Directorate for Engineering, as indicated by the dotted red arrow.
NSF SBIR program management is centralized both organizationally and physically. The program’s team is contained within one unit, the staff is relatively small, and team members are all on the fifth floor of NSF headquarters in Arlington, Virginia. There appears to be a strong degree of homogeneity within the program; indeed, it is a single program, unlike the SBIR programs at some of the other agencies in this study. According to program administrators, “Centralized management allows consistency within the program, efficient follow-up and tracking of proposal and grant management, efficient administration and technical resource management, better resource accountability, and consistent and timely information exchange.”18
From the mid-to-late 1990s, the current centralized management replaced an earlier structure in which the program was largely distributed across the various NSF directorates and offices. Under the decentralized structure, the various NSF divisions had more of a stake in the program and could advocate for SBIR solicitations and grants that helped their fields. With the centralization, NSF program managers outside the program have much less involvement in the program. A potential effect may be that they are less supportive of the program.19
4.3.2
Staffing
Table 4.3-1 lists the SBIR/STTR management team, effective as of early September 2005. (Subsequent changes are not reflected.) In addition to the director and senior advisor, there were a total of seven program managers at that time. When program managers and assigned technical areas were examined
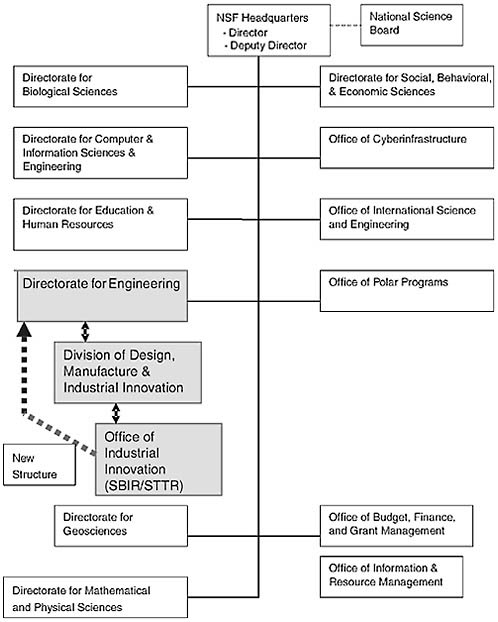
FIGURE 4.3-1 Organization Chart.
NOTE: The up-down black arrows represent the previous reporting path for the OII. The dotted red line represents the reporting path for the OII under the NSF’s reorganization. The diagram may not accurately represent all of NSF postreorganization; the focus here is only on the change for OII.
TABLE 4.3-1 The NSF SBIR/STTR Team as of September 2005
|
Director, OII |
Kesh Narayanan |
|
Senior Advisor |
Joseph Hennessey |
|
Program Managers |
Rosemarie Wesson |
|
Errol Arkilic |
|
|
Juan Figueroa |
|
|
Muralidharan Nair |
|
|
Sally Nerlove |
|
|
James Rudd |
|
|
Om Shai |
|
|
BT Expert |
George Vermont |
|
Administrative Officer |
Sandra Loving |
|
Program Assistants |
Caroline Hayer |
|
Jacqueline Moore |
|
|
Contract Program Manager |
Sonya Lucas |
|
Contract Records Manager |
Carla Lucas |
|
SOURCE: The NSF’s Web site (as of September 2005): <http://www.nsf.gov>. NOTE: The current staff directory shows a number of changes, among them the listing of seven “Program Directors,” six “Program Managers,” and three “Experts.” See <http://www.nsf.gov/staff/sub_div.jsp?org=IIP&orgID=115>. |
|
initially in 2003, several additional program managers were listed,20 and program managers were more clearly identified with specified technical areas than in 2004 or 2005. For example, in 2003, three program managers were listed for Advanced Materials, Manufacturing, and Chemical Processes; two were listed for Information-based Technologies and Electronics; and one was listed for Biotechnology. More recently, the program managers are posted on the NSF’s SBIR program Web site as a group without technical area affiliation. Posted topic solicitation areas do identify program managers as points of contact.21
4.4
DESCRIPTIVE OVERVIEW OF THE NSF’S SBIR PROGRAM
4.4.1
Primary Program Objectives
According to the NSF, the primary objective of its SBIR/STTR program is “to increase the incentive and opportunity for small firms to undertake cutting-
|
20 |
One program manager recently retired; another recently took another position within the NSF. |
|
21 |
In 2004 a change in posted program managers associated with Phase I areas occurred, with Electronics closed and Security newly opened. OII’s strategic plan of June 2005 made further changes. (Program topics are discussed in more detail in Chapter 8.) |
edge, high-risk, high-quality scientific, engineering, or science/engineering education research that would have a high potential economic payoff if the research is successful.”22 A recent strategic planning exercise has revisited and elaborated the OII’s vision, mission, and goals.23 Statements in the strategic plan emphasize accelerating industrial innovation by leveraging scientific R&D by small businesses so as to contribute to the U.S. economy. The NSF’s new strategic plan acknowledges that to date “very few efforts have been made to foster and encourage participation by minorities and disadvantaged persons in technological innovation” and expresses the need to take action toward this objective.24
4.4.2
Program Phases
The NSF’s SBIR program has the following phases: Phase I, Phase II, Phase IIB, and Phase III. Participation in Phase I is requisite to participation in Phase II, and participation in Phase II is requisite to obtaining a Phase IIB grant. Phase III, a phase without funding from the NSF, centers on commercialization and can start at any time following Phase I.
To reiterate, Phase I grants give up to $100,000 for an experimental or theoretical investigation of a proposed innovative research topic or activity over a six-month period. Phase II grants build on the Phase I research by funding additional research for up to two years. Phase II incorporates a reassessment of scientific, technical, and commercial merit and feasibility and provides funding up to $500,000. Phase IIB provides supplementary funding ranging from $50,000 to $250,000 for an extra year of research added to the existing Phase II period. A “supersized” version of Phase IIB, begun recently, provides up to $250,000 more and another year of funding. For every one dollar of Phase IIB funding sought, the applicant must show that it has obtained two dollars of financing from another source.
4.4.3
Use of Topics
The NSF’s SBIR program solicits proposals in broad topic areas. From its beginning until the mid-1990s, the program operated in a decentralized manner, and its solicitation topics were closely aligned with the scientific and engineering disciplines of the NSF’s scientific and engineering directorates. During this time there were 27 topics and over 100 subtopics reflecting the scientific interests of the directorates. After it was centralized, the program reduced the number of topics and subtopics and defined them in ways it thought to be more in tune with interests of the business sector. Until 2004, the five major topic areas were
|
22 |
From the NSF’s synopsis of its SBIR/STTR program found on its Web site, <http://www.nsf.gov/funding/pgm_summ.jsp?Phase Ims_id=13371&org=DMII>, in 2005. |
|
23 |
OII’s strategic plan, pp. 7–8. |
|
24 |
Ibid, p.18. |
(1) Advanced Materials and Manufacturing, (2) Biotechnology, (3) Chemical-based Technologies, (4) Electronics, and (5) Information-based Technologies. In 2004 a sixth topic, Security, was added.
OII’s 2005 strategic plan explains that the solicitation topics now fit into three broad areas: (A) investment business focused topics, (B) industrial market driven topics, and (C) technology in response to national needs. (A, B, and C below). The topics list given in the strategic plan includes seven topics:
-
Investment Business Focused Topics
-
Biotechnology (BT)
-
Electronics-Technology (EL)
-
Information-Based Technology (IT)
-
-
Industrial Market Driven Topics
-
Advanced Materials and Manufacturing (AM)
-
Chemical-Based Technology (CT)
-
-
Technology in Response to National Needs
-
Security-Based Technology (ST)
-
Manufacturing Innovation (MI)
-
It appears that areas A and B above are expected to be relatively stable and that area C is expected to change more frequently on short notice as national needs change.
In 2006 the Phase I solicitation (number 06-553) included one topic from each of categories A, B, and C: Advanced Materials, Information Technology, and Manufacturing Innovation. It included an additional topic, “Emerging Technologies” (also called “Emerging Opportunities”25) not included in the above list. This additional topic had a focus on near-term commercialization and was limited to a list of specific software and hardware areas.26 The FY2007 Phase I solicitation, which began accepting proposals on November 4, 2006, and closed on June 13, 2007, includes Advanced Materials, Chemical Technology, and Manufacturing Innovation, Biotechnology, Electronics, Information Technology, and Emerging Opportunities. This inclusion covers all the topics listed in the strategic plan, with the exception of Security-Based Technology, possibly indicating a broadening of topic coverage. Phase II submission deadlines are tied to the expiration dates of the Phase I grants.27
Topics are used in the Phase I solicitations. Once Phase I grants are selected, the topics of these grants determine the “topic pool” from which Phase II grants
|
25 |
SF SBIR Program Manager Errol Arkilic discussed the NSF’s use of the Emerging Opportunities topic, reportedly with the use of a higher percentage of reviewers with strong commercial credentials, in an interview with Robert Jaffe, “Words from a Winner,” SBTDC/SBIR Newsletter, October 2005. |
|
26 |
The topic area “Emerging Technologies” and the subtopics it includes were described in 2006 at the following NSF Web site: <http://www.nsf.gov/eng/sbir/eo.jsp>. |
|
27 |
Information on the FY2007 Phase I solicitation is provided at <http://www.nsf.gov/eng/iip/sbir>. |
|
Box B Nanosys: High-Performance Inorganic Nanostructures for Solar Cells Founded in 2001, Nanosys develops products based on a technology platform incorporating high performance inorganic nanostructures. Applications of this patented technology extend to a variety of industries, including energy, defense, electronics, computing, and the life sciences. One product with potential for significant commercial application is a new type of solar cell that is lightweight, flexible, and can be produced in large volumes using roll-to-roll mass manufacturing techniques. A practical solar cell technology that is low cost and widely available can contribute to the world’s growing energy needs without impacting the environment. In 2003 Nanosys applied for and received a grant from the NSF’s SBIR program to further their efforts to develop and commercialize a “novel nanocomposite solar cell technology that combines self-assembled inorganic semiconductor nanocrystals into a plastic composite to produce lightweight, flexible solar cells of almost any size and shape.” As the Nanosys leadership recognizes, the SBIR award confers the “stamp of approval” of the nation’s leading science agency that acknowledges both the commercial value as well as the scientific importance of the work. This validation is helping Nanosys develop additional funding fromprivate venture capital, further accelerating the development and commercialization of this technology. |
are selected. In turn, the selection of Phase II grants determines the topic pool from which Phase IIB grants are made. If a topic is not included in Phase I, it is also not included in the subsequent Phase II and IIB solicitations.
The distribution by topic area of Phase IIB grants from 1998 to 2005 is shown in Figure 4.4-1. It shows that these supplemental grants funded projects in just four topic areas: Advanced Materials, Information Technology, and, to a lesser extent, Electronics and Biotechnology. (For additional discussion of topic development, see Section 8.1.)
4.4.4
Proposal Selection Criteria and Process
Proposal selection is driven by the following two criteria:
-
Intellectual merit
-
Broader impacts
These criteria are explained in program guidance and will be addressed in more detail in Section 8.3. Peer review is used to assess each proposal against the criteria. These reviews provide advice to SBIR management in selecting grantees.
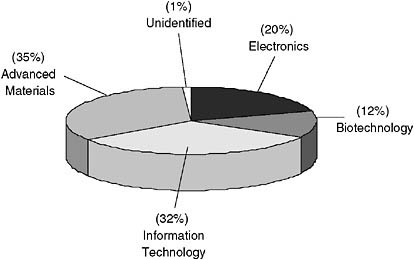
FIGURE 4.4-1 Phase IIB Grants by Topic, 1998–2005.
SOURCE: Developed from data provided by the NSF SBIR program.
Additional, less well-specified criteria are reportedly applied by program staff in the final selection decisions. (For more on selection criteria and process, see Section 8.3.)
4.4.5
Solicitations and Proposal Submissions
NSF solicitation schedules are published on its Web site. In 2004, for example, a Phase I solicitation was released on March 1, 2004, for two topics—Information-Based Technologies and Security Technologies. Proposals were due on June 9, 2004. A round of Phase II proposals for those topics for which Phase I projects were under way was due on July 27, 2005. Phase IIB proposals are due in 2007.
All proposals must be submitted via FastLane, an interactive real-time system used to conduct NSF business over the Internet.28 The program reportedly adheres to a six-month processing time for all proposals.29 (For more on the timing of solicitations, proposal submissions, and grant awards, see Section 8.6.)
4.4.6
Support for Commercialization
Because the NSF is not generally a procurer of the technologies it funds, it requires grantee companies to identify other routes to commercialization. The
|
28 |
For more about FastLane, see <http://www.fastlane.nsf.gov/fastlane.jsp>. |
|
29 |
Draft of OII’s strategic plan (June 2005), p. 18. |
program emphasizes commercialization and begins educational support for commercialization during Phase I. All grantees are required to attend a business development and training workshop during Phase I. Phase II grantees meet annually, where they are briefed on Phase IIB opportunities and requirements. The annual conference provides workshops intended to assist with commercialization and opportunities to network with potential funding sources and partners. The Phase IIB program provides additional grant funding predicated on a grantee’s ability to obtain third-party funding.
The NSF’s SBIR program operates a Matchmaker program, which seeks to bring together SBIR recipient companies and potential third-party funders such as venture capitalists. Just recently, the NSF has begun to support participation of its grantees in SBIR Opportunity Forums, run jointly with other agencies, to bring grantees together with potential investors and partners.
Despite these efforts, commercialization is difficult and the program faces challenges in achieving commercial results. (Commercialization efforts and results are discussed in more detail in Chapter 5.)
4.5
NSF SBIR “SUCCESS STORIES”
Like many federal agencies, the NSF regularly publishes “success studies” (also called “nuggets” by NSF). Exhibits 4.5-1 and 4.5-2 provide SBIR success stories from NSF files. Note that these are success stories as defined by the NSF; the actual longer-term success of these projects has not been verified by this study.
|
Exhibit 4.5-1 SBIR Success Story from the NSF’s Office of Legislative and Public Affairs. News Tip; March 20, 2003 Web’s “Best Meta-Search Engine” Organizes Documents from Anywhere in Any Language Industry experts at Search Engine Watch recently named Vivisimo the Web’s Best Meta-Search Engine for its ability to organize search results instantly into a computer-generated “index.” The software behind Vivisimo’s search engine can also be applied to any collection of documents, in languages ranging from English and German to Arabic and Korean. A success story from the National Science Foundation’s (NSF) Small Business Innovation Research and computer science programs, Vivisimo’s Web site was recognized for the second consecutive year for its “outstanding performance in helping Internet users gather results from many Web search engines by using a single service.” |
|
The Vivisimo Web site demonstrates how the technology filters and automatically categorizes responses from search requests. The results resemble a human-generated index that can help guide researchers in the right direction. “The clustering service on our Web site and underlying software technology show how users can comfortably explore much more information in an organized way, rather than being bombarded with disorganized information dumps,” said Raul Valdes-Perez, president of Vivisimo, Inc. “Our Web site shows our business customers—whether Web, government, corporate, or publishing—what they can expect by installing our software products for their uses.” Getting answers to broad, exploratory questions can leave searchers, especially those with little knowledge about a topic, slogging through a morass of information. For example, searching for “Iraq” among the news stories on any Web news source will result in a long list of articles on global politics. Searching the entire Web can produce a similar, mostly undifferentiated list of sites about Iraq. This is where Vivisimo steps in. Its Clustering Engine does a quick statistical, linguistic, and knowledge-based analysis of the search results which it then clusters into themes, thereby helping to identify trends or fine-tune searches without requiring users to know the correct terminology. For example, using Vivisimo to search news sites for “Iraq” might produce clusters of news articles under categories such as “weapons Inspectors,” “Bush,” “missiles,” and so on. (The categories will change depending on the latest developments in the news.) Vivisimo is supported by NSF’s SBIR program, which emphasizes high-risk, high-payback innovations that are tied to NSF’s mission of advancements in science, engineering, and education. All proposals are evaluated on the technical merit of their research and development, as well as their technology impact. NSF was the first of 10 federal agencies required to reserve a portion of their research and development funds for the SBIR program, which is coordinated by the U.S. Small Business Administration. Related Links: Vivisimo: <http://www.vivisimo.com>, Vivisimo News demo: <http://vivisimo.com/news/>, NSF SBIR Program: <http://www.eng.nsf.gov/sbir>. NSF Program Officers: Juan E. Figueroa, SBIR (703) 555-1212, jfiguero@nsf.gov, Ephraim P. Glinert, CISE (703) 555-1212, eglinert@nsf.gov, Principal Investigator: Raul Valdes-Perez, valdes@vivisimo.com, 412-422-2496 |
|
Exhibit 4.5-2 GPRA Fiscal Year 2004 “Nugget” Retrospective Nugget—AuxiGro Crop Yield Enhancers Emerald BioAgriculture Corporation (formally Auxein Corporation) of Lansing, MI, more than doubled sales of its commercial crop yield enhancer, AuxiGro®, over the past year. In research conducted under NSF’s Small Business Innovation Research (SBIR) program, Emerald Bio developed a crop yield enhancer based on GABA (gamma aminobutyric acid). Currently, the product is used on field crops such as potatoes and sugar beets, high-value vegetables, grapes, snap beans, fruit trees, almonds, and grass for seed production. Primary benefits of AuxiGro include increased yield on crops such as almonds and tomatoes, increased size and hence value on onions and potatoes, and increased sugar (Brix) content in crops such as grapes and sugar beets. Stress-protective benefits have also been realized with use of AuxiGro. When applied to cabbage, the plant can withstand extended exposure to freezing temperatures after treatment. When applied to grapes, the plant is better able to resist infection from powdery mildew disease. Since the active ingredient in AuxiGro is an amino acid that is naturally present in all living systems, AuxiGro can be considered a natural alternative to synthetic plant growth regulating compounds and in certain cases to synthetic chemical fungicides. Environmental stresses such as drought, temperature extremes, and disease are important factors limiting agricultural productivity. Because crops that have been treated with AuxiGrow are better able to withstand a variety of stresses, they show improvements in many aspects of plant growth including flowering, fruit set, and root growth. The beneficial effects on crop growth provide growers with substantially improved yields. For every $1 that growers spend on AuxiGro they typically receive on average $35 in additional yield value from onions and $15 and $16 in extra yield value from snap beans and almonds, respectively. AuxiGro is now being sold in the USA and countries in Europe, Asia, and Latin America. More than $8 million in private equity investment in Emerald Bio has followed the SBIR research support to date. This work is notable because: This research has developed GABA technology for large increases in agricultural productivity. Program Officer: Ritchie Coryell PI Name: Alan Kinnersley Institution Name: Auxein Corporation Grant Title: SBIR Phase II: “The Role of Gamma Aminobutyric Acid (GABA) in Plant Growth and Productivity” Entered by Joann L. Alquisa Approved for ENG by Joanne D. Culbertson |


