
5
Commercialization
5.1
COMMERCIALIZATION STRATEGIES
The National Science Foundation (NSF) appears to have recognized early on that addressing commercial and financial issues throughout the initial stages of technology development—concurrently gathering information about markets, potential customers, competitors, strategic direction, and finance—is critical to effective and timely commercialization. This view has been “long recognized” by American industry.1 It is a view also strongly embraced by other, more recently created, public-private partnership programs such as the Advanced Technology Program (ATP).2
The NSF’s relative aggressiveness in encouraging early attention to business issues is particularly noteworthy. A likely reason for this early attention is the fact that, unlike the Department of Defense and other agencies, the NSF itself does not generally provide a market for the technologies it funds through the Small Business Innovation Research (SBIR) program. It likely also reflects the business training of the founders of the NSF program. Early on, the NSF’s SBIR program specified a proposal selection criterion that relates to commercialization. It set forth the six-part “Commercialization Plan Guidelines” and in 2003 began requiring that grantees’ commercialization plans have more fully developed financial projections at the beginning of Phase II. It has required all SBIR Phase I grantees
to attend a commercialization planning workshop. Since 2001, it has engaged the services of Dawnbreaker, Inc., a company that specializes in providing commercialization assistance to small advanced technology firms, to help Phase I grantees to prepare NSF’s required commercialization plan for Phase II submissions.3 In addition, the NSF’s SBIR program has encouraged commercialization at the Phase II stage by offering its Phase IIB supplemental option, conditioned on the grantee obtaining third-party financing. The Phase IIB supplement stands out as an innovative method of encouraging companies to attract funding from other sources—a critical step toward commercialization. The development and enhancement of the NSF’s Web-based Matchmaker program to promote partnering may also encourage commercialization.
|
The NSF’s SBIR program is using Phase IIB Supplemental Grants as an innovative method of encouraging companies to attract funding from other sources, which
|
Management of NSF’s SBIR, the Office of Industrial Innovation (OII), has taken another recent step to provide more commercialization assistance to its Phase II grantees. The NSF’s SBIR program entered into a partnership with the Department of Energy’s (DoE) SBIR program to jointly sponsor the 2005 DoE Opportunity Forum.4 This forum brought selected SBIR grantees face-to-face with prospective investors and allowed them to present their commercialization opportunities to the investors.
In addition to the 2005 DoE Opportunity Forum, OII brings together Phase II grantees on a regular basis at its annual grantee conferences. For example, OII cosponsored a Phase II Grantee Conference on May 18–20, 2006, in Louisville, Kentucky, with the Ewing Marion Kauffman Foundation, a Kansas City-based
organization whose goal is to catalyze an entrepreneurial society.5 The conference showcased nearly 300 grantees to potential industrial strategic partners and venture capital investors. It also enabled one-on-one meetings of OII program officers with grantees, compensating at least in part for the general inability of program managers to conduct site visits to grantee companies due to a shortage of program administrative funding. At this conference, business and financial panels met, firms had poster presentations and maintained tables or booths, and the grantees made presentations grouped by industry sector.6
The NSF funds many very small, scientist-led firms that find commercialization quite challenging. OII’s strategic plan includes a number of additional initiatives aimed at firms needing assistance to encourage commercialization. OII hopes to: develop plans to work with incubators, business schools, and other resources; provide innovation management courses to grantees; revise Phase I requirements to include more commercial information upfront; bring more business reviewers into the Phase I process; and bring investors and corporate partners to grantee conferences and workshops. Thus, it appears that the NSF is formulating plans to continue and intensify strategies aimed at fostering commercialization.7
5.2
COMMERCIAL RESULTS
It seems clear that the NSF’s SBIR program intends for its grants to result in commercial goods and services. But how well is it doing in achieving this goal? In this section we examine evidence of commercial results drawn from five sources: (1) a survey of grantee firms that focuses on firm characteristics; (2) a survey of Phase II projects to focus on projects that went forward; (3) a survey of Phase I projects to find out why some projects did not continue into Phase II; (4) case studies of ten companies that received NSF SBIR grants; and (5) NSF-initiated data and analysis on commercialization. While each section following focuses on each of these sources in turn, to some extent findings from the various sources are interwoven.
5.2.1
Characteristics of SBIR-Funded Firms as Indicated by NRC Firm Survey Data
Influence of the SBIR program on Company Founding. The NRC Firm Survey found that 20 percent of 137 respondents attributed the founding of their
|
5 |
“About the Foundation,” Ewing Marion Kauffman Foundation Web site, <http://www.kauffman.org/foundation.cfm>. |
|
6 |
National Science Foundation, Office of Industrial Innovation, “SBIR/STTR Phase II Grantee Conference, Book of Abstracts,” May 18–20, 2006, Louisville, Kentucky. |
|
7 |
In 2003 the NSF expanded the Phase I commercialization assistance program and awarded three-year contracts to Dawnbreaker, Inc., and Foresight Science & Technology. In a new contract competition in 2006, the NSF awarded three-year contracts to Dawnbreaker and Development Capital Networks (DCN). |
companies to the SBIR program in full or in part. This finding was supported by the case studies in which several companies attested to the important role of the SBIR program in either the creation of their company (e.g., Language Weaver) or the restarting of their company after they encountered setbacks (e.g., ISCA Technologies).
Previous Business Experience. The survey found that founders of SBIR-awardee firms tended to have previous business experience. Fifty-six percent of the founders of respondent firms had started one or more other companies, and 52 percent of the founders had a business background. Furthermore, most of the founders had been employed with another private company prior to founding the survey firm.
Grants Received. Most of the respondent firms (86 percent) had received more than one Phase I grant from federal agencies. The reported range per firm was 1 to 462 Phase I grants, and the average number received was 31. Fourteen percent had received only one grant; 32 percent had received from two to five grants; 8 percent had received more than 100 Phase I grants. For most of the firms, these grants were spread over a number of years.
Most of these firms also had received more than one Phase II grant from federal agencies, but fewer Phase II than Phase I grants. The reported range was 1 to 182 Phase II grants, and the average number received was 14—less than half the average number of Phase I grants. Twenty-three percent received only one Phase II grant; 44 percent received from two to five grants; 7 percent received more than 50 Phase II grants.
Company Growth. A large proportion of the firms surveyed attributed a considerable part of their companies’ post-SBIR grant growth to the SBIR program. Forty-six percent attributed more than 50 percent of their growth to the SBIR program. Table 5.2-1 summarizes the responses to the relevant survey question.
Surveyed firms reported employment growth from the time they received their first Phase II grant to the time of the survey. Figure 5.2-1 shows how the surveyed firms tended to increase their number of employees from the time of the firms’ first SBIR grants to the time of the survey. At the time they received their first Phase II award, 60 percent of the firms had 5 or fewer employees, whereas by the time of the survey, this percentage had been nearly cut in half. The average number of employees increased from 13 to 36, and the range increased from 1 to 175 employees to 1 to 750 employees. Three percent of the firms had more than 200 employees at the later time.
Firm Revenue. Figure 5.2-2 shows the distribution of surveyed firms by their total revenue. At the low end, 13 percent of firms had annual revenues under $100,000. At the high end, 4 percent of the firms reported $100 million or more
TABLE 5.2-1 Company Growth Attributed to the SBIR Program
|
Percentage Growth |
Percentage of Companies Attributing Growth to the SBIR Program |
|
< 25 |
27 |
|
25 to 50 |
28 |
|
51 to 75 |
24 |
|
>75 |
22 |
|
SOURCE: NRC Firm Survey. |
|
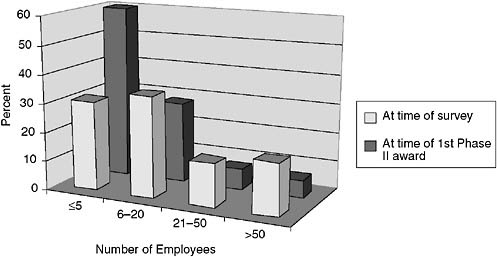
FIGURE 5.2-1 Firm Employment after First Phase II Award and at the Time of the Survey.
SOURCE: NRC Firm Survey.
in annual revenue. The largest group reported annual revenue of $1 million to $5 million.
Thirty-six percent of all the surveyed firms reported that more than half of their company’s revenue during its last fiscal year was comprised of SBIR and/ or STTR funding. Forty-two percent reported that SBIR and/or STTR funding comprised 10 percent or less of revenue in the company’s last fiscal year, and 28 percent reported that it comprised 0 percent of company revenue.
Business Activity. Four of the firms in the survey sample had made an initial public stock offering—one in 2004, one in 2000, one in 1994, and one in 1983. Two more planned an initial public stock offering in 2005/2006. Eighteen percent of the surveyed firms had established one or more spin-off companies, for a total of 49 new spin-off companies.
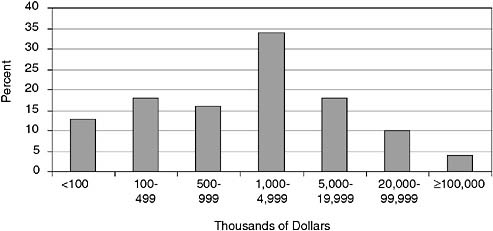
FIGURE 5.2-2 Distribution of Surveyed Firms by Annual Revenue.
SOURCE: NRC Firm Survey.
NSF-surveyed firms tended to be proactive in assessing the potential commercial markets for their SBIR products, processes, or services—slightly more so than the total of surveyed firms for all five of the agencies examined. Sixty-nine percent reported that they first determined potential commercial markets prior to submitting their Phase I proposal, and another 22 percent prior to submitting the Phase II proposal. Only 1 percent reported waiting until after Phase II.
The survey results revealed that market research/analysis in these firms is carried out by a variety of people, including the director of marketing, employees for whom marketing is their primary job, employees who take on marketing in addition to their regular duties, consultants, the principal investigator, and the company president or CEO. However, the company president or CEO was most often responsible for market research and analysis.
Similarly, sales were handled in various ways by the firms, as illustrated by Table 5.2-2. Corporate officers were most often responsible for sales, but a substantial percentage of firms surveyed reported having an in-house sales force. Firms designated as NSF grant recipients were more likely than firms in the total survey to achieve sales through the use of licensing, independent distributors or other companies with which they had formed marketing alliances, other companies that incorporate the product into their own, and spin-off companies.
Firm R&D Devoted to SBIR Activities. Thirty-six percent of the firms reported that more than half of their total R&D effort was devoted to SBIR activities during the most recent fiscal year, and 16 percent reported that more than 75 percent was devoted to SBIR activities. Thus, the SBIR funded a substantial share of the R&D activity of many grant-recipient firms.
TABLE 5.2-2 Methods of Accomplishing Sales of Product, Process, or Service
Protection of Intellectual Property. The 137 firms in the survey reported 842 patents resulting at least in part from their SBIR and/or STTR awards, for an average of 6 patents per firm related at least in part to SBIR awards. This was double the average reported for the total firm survey sample covering all five agencies. The range for the firms in the survey identified as recipients of NSF SBIR awards was from 0 to 66 patents per firm, with 26 percent reporting no patents from SBIR/STTR and 28 percent reporting more than six patents each. This result is distinct from later patent results (from the Phase I and Phase II Surveys) that relate patents to the technology developed with funding from an individual award. The average number of patents attributed to individual SBIR projects is substantially lower than the number reported for the firm as a whole as resulting “at least in part to SBIR awards.”
5.2.2
Commercialization Progress Indicated by NRC Phase II Survey Data
The NRC Phase II Survey provides recent evidence on the extent to which SBIR grant recipients have achieved commercialization and/or progress toward commercialization. The survey provides information on sales, on modes of commercialization, and on steps important to achieving commercialization, including marketing activities, interactions with other companies and investors, and attraction of funding from non-SBIR sources. It also provides information on employment effects, including the extent to which women and minorities are involved in the projects as principal investigators. Finally, it explores the extent to which the reported effects are believed by survey respondents to be attributable to impacts
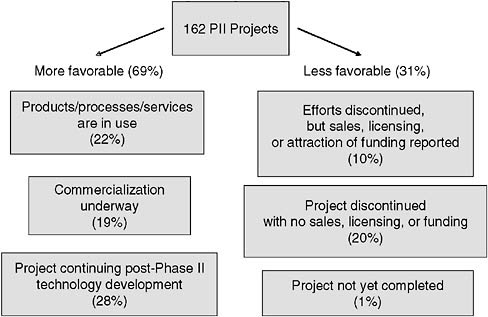
FIGURE 5.2-3 Commercialization Status of 162 Surveyed Phase II NSF SBIR Projects.
SOURCE: NRC Phase II Survey.
to the SBIR program. Figure 5.2-3 summarizes the commercialization status of 162 Phase II NSF SBIR projects.
Projects Achieving Commercialization and Continuing Progress. Twenty-two percent of 162 respondents indicated that the referenced projects had resulted in products, processes, or services that were in use and still active. Fifty-one percent of the 162 respondents in the survey indicated some form of commercialization or progress toward commercialization of the technologies resulting from the referenced projects. Included in this 51 percent are those for which commercialization was under way (19 percent); those that had already achieved commercial results (22 percent); and those that had achieved sales, licensing, or additional funding before discontinuing the projects (10 percent). Another 28 percent of respondents indicated that the project was continuing technology development in the post-Phase II period. Altogether, 69 percent of respondents indicated some form of continuing progress—either in terms of commercial development (41 percent) or technology development (28 percent).
Average Sales Data. Reported sales incorporating the technology developed in the referenced projects were compiled from the 162 survey respondents. Average sales across the 162 projects were nearly $400,000, and average sales
of associated licensees of the technologies exceeded $1.4 million. When respondents were asked to identify the types of sales either they or their licensees had experienced, 38 percent indicated sales of product, 22 percent, sales of services, and 3 percent, sales that involved processes.8
For projects with sales and those without sales who expected future sales from the technology developed in the referenced projects, respondents were asked to estimate the amount of sales expected for their company and its licensees between now (the time of the survey in mid-2005) and the end of 2006. Average expected sales across all 162 projects exceeded $800,000 for this time interval appropriate for the referenced projects.
These estimates of expected sales were based largely on educated guesses, ongoing negotiations, projections derived from current sales, and past experience. When asked the basis of the expected sales estimates, respondents said market research figured in only 26 percent of the future sales estimates. “Educated guess” was reported by 40 percent and “ongoing negotiations” was reported by 38 percent as the basis of the sales estimates. “Projection from current sales” was reported by 34 percent and “past experience” by 32 percent. In contrast, “consultant estimates” figured in 5 percent of the estimates.9 For novel/disruptive technologies, educated guesses may be all that is available for market estimates. At the same time, program officials should be skeptical when Phase I applicants initially are very positive in their educated guesses of expected market size, closely followed by an educated guess that there is insufficient commercial promise to warrant a follow-on proposal or other effort.
As has been observed in other technology programs, a few projects often account for the majority of sales revenue.10 This tendency was also observed in the SBIR survey results, where just eight of the projects—each of which had $2.3 million or more in sales—accounted for over half the total reported sales dollars for the surveyed projects. The project with the highest reported amount had $4.8 million in sales. Similarly, the results for sales by licensees of those survey projects’ technologies were highly skewed by a single licensee that accounted
TABLE 5.2-3 Customers for Sales Derived for the Referenced Grants
|
Types of Customers |
Percentage of Total Sales to Each Type of Customer |
|
Domestic private sector |
57 |
|
Department of Defense (DoD) |
11 |
|
Export markets |
11 |
|
Prime contractors for DoD or NASA |
5 |
|
State or local governments |
4 |
|
Other federal agencies |
2 |
|
NSF |
1 |
|
NASA |
1 |
|
Support to universities and other institutions |
9 |
|
SOURCE: NRC Phase II Survey. |
|
for over half the total licensee sales dollars, amounting to $200 million or more in licensee sales.
Customers. Respondents reporting sales from the referenced NSF SBIR projects were able to identify their customers. As shown in Table 5.2-3, the majority of these sales (57 percent) went to the domestic private (civilian) sector. A total of 20 percent went to federal agencies or their prime contractors. Of this, 11 percent went to DoD and 5 percent to DoD or NASA prime contractors. Responses to a separate question revealed that 4 percent reported that the resulting technology was used in a federal system or acquisition program.
As would be expected given that the NSF is, for the most part, not a procurement agency, only 1 percent of total sales went to the NSF. Sales to export markets accounted for 11 percent of the total, and state and local governments accounted for 4 percent. Customers other than those listed accounted for the remaining 9 percent.
Mode of Commercialization. Respondents with sales or expecting sales were asked about their mode of commercializing technologies resulting from the referenced projects. Table 5.2-4 summarizes the responses. The most frequent answer was “as hardware” (54 percent), followed by “as process technology” (32 percent)11 and “as software” (32 percent). The next most frequent responses were “as new or improved service capability” (24 percent) and “as a research tool” (21 percent). Twelve percent indicated the mode of commercialization to
TABLE 5.2-4 Mode of Commercializing
|
Mode |
Percentage of Respondents Choosing This Mode |
|
As hardware (final product, component, or intermediate hardware product) |
54 |
|
As process technology |
32 |
|
As software |
32 |
|
As new or improved service capability |
24 |
|
As a research tool |
21 |
|
As educational materials |
12 |
|
As a biologic |
3 |
|
No commercial product, process, or service was/is planned |
2 |
|
As a drug |
0 |
|
Other |
8 |
|
SOURCE: NRC Phase II Survey. |
|
be “as educational materials.” “As a drug” (0 percent) was not an avenue for commercialization, but “as a biologic” (3 percent) was occasionally indicated. Eight percent of the modes used or expected to be used apparently fell outside the modes listed, and 2 percent responded that no commercial product, process, or service was/is planned even though they previously had indicated the contrary.
Marketing Activities. Asked about their marketing activities, respondents who had not discontinued their efforts without sales or additional funding indicated an emphasis on market planning, with approximately three-quarters reporting they had planned, had under way, or had completed preparation of a marketing plan. Their attention was also on market research and publicity and advertising, with about two-thirds of respondents indicating they had planned, had under way, or had completed these activities. About half the respondents also had planned, had under way, or had completed the hiring of marketing staff and test marketing, but a near equal percentage indicated these marketing activities were not needed.
Interactions with Other Companies and Investors. Asked about their activities with other companies and investors in the United States and abroad, respondents for 121 Phase II projects indicated the frequency with which they either had ongoing negotiations or had finalized agreements with other companies or investors. Overall, interactions with domestic firms and investors far exceeded interactions with foreign firms and investors.
|
Prevalent forms of interaction with other companies and investors, both domestic and foreign, were licensing agreements, R&D agreements, marketing/distribution agreements, and customer alliances. |
For many small companies, forming licensing agreements with other companies offers a path to commercialization that might not otherwise be possible due to large capital requirements and the need for an established market presence. Thus, it is not surprising that NSF SBIR grantees often form licensing agreements with other companies. The NRC Phase II Survey found that 20 percent of respondents had finalized licensing agreements with U.S.-based companies and investors and 21 percent had ongoing negotiations for licensing agreements with U.S.-based companies and investors. Ten percent had finalized licensing agreements with foreign companies and investors, and 7 percent had ongoing negotiations for licensing agreements.
That part of commercialization that is accomplished through licensing agreements tends to make the assessment of commercial progress more complicated than if the grantee firms commercialize solely by manufacturing and selling their own stand-alone products. Grantee innovations that are incorporated into the products of licensee companies may become difficult to assess separately. While royalty rates and fees paid to the grantee can be used to estimate the sales value of the product, sometimes licensing information is reportedly overlooked in agency assessments of commercial outcomes.
The next most frequently mentioned form of interactions of grantee respondents with other companies and investors—in decreasing order of frequency—were R&D agreements, marketing/distribution agreements, and customer alliances. Although few domestic sales of technology were reported finalized, a number of negotiations were under way. Foreign interaction centered on licensing, R&D agreements, and marketing/distribution agreements. Reports of interactions to sell technology rights or to either partially or totally sell the company to foreign companies and investors were few.
Attraction of Additional Funding Prior to Phase II. The NRC Phase II Survey identified sources of funding that preceded the referenced Phase II grants. Table 5.2-5 shows the percentages of respondents who indicated the referenced technologies received funding from each source, including prior SBIR grants. Thirty-five percent received prior funding primarily from internal company investment, including borrowed funds. Twenty percent received prior SBIR grants. Fifteen percent received prior funding from private companies other than venture capital, and 14 percent received prior funding from private investors. At
TABLE 5.2-5 Funding Sources for Research and Development of the Technology Prior to the Referenced SBIR Grant
|
Funding Source |
Respondents Indicating Funding from Source Prior to Referenced SBIR Phase II Grant (%) |
|
Internal company investment (including borrowed money) |
35 |
|
Prior SBIR (excluding the Phase I which proceeded this Phase II) |
20 |
|
Other private company (not venture capital) |
15 |
|
Private investor |
14 |
|
Prior non-SBIR federal R&D |
13 |
|
Other |
9 |
|
State or local government |
5 |
|
College or university |
4 |
|
Venture capital |
2 |
|
SOURCE: NRC Phase II Survey. |
|
13 percent, prior non-SBIR federal R&D funding was also notable. Relatively few received funding from state and local governments and colleges and universities. And, notably, only 2 percent received prior funding from venture capitalists.
Attraction of Funding from Non-SBIR Sources for Development and/or Commercialization. Bringing a technology from the research stage to commercialization requires considerable investment beyond that provided by the SBIR program. Obtaining follow-on funding is requisite to commercialization. Thus, survey data on the attraction of non-SBIR funding for the development and/or commercialization of SBIR projects is quite relevant to this section on commercialization.
First, the survey investigated additional funding received in the Phase II stage for matching or cost-sharing. In the case of the NSF, it is likely that this funding was to meet the third-party match for Phase IIB grants. Nearly one-third of the respondents reported that there were matching funds or other types of cost-sharing in conjunction with their NSF Phase II proposals. Table 5.2-6 shows the sources of the matching or co-investment funding that were proposed for Phase II. Most of the projects that reported matching funds got the match from other companies and internal sources. Angel or other private investment sources were also a relatively important source. By contrast, venture capital sources provided few matching funds.
In addition to investigating matching or co-investment funding, the survey asked respondents about the receipt of additional development funding for the project. The majority of the respondents (63 percent) indicated there was additional developmental funding put into the project.
TABLE 5.2-6 Sources of Matching or Co-investment Funding Proposed for Phase II
|
Source of Matching or Co-investment Funding |
Percentage of Projects for Which Respondents Reported Matching Funds Who Reported Each Source |
|
Another company provided funding |
58 |
|
Our own company provided funding, includes borrowed funds |
38 |
|
An angel or other private investment source provided funding |
21 |
|
A federal agency provided non-SBIR |
4 |
|
Venture capital provided funding |
2 |
|
SOURCE: NRC Phase II Survey. |
|
TABLE 5.2-7 Sources and Amounts of Developmental Funding Reported for Phase II NSF SBIR Projects
|
Funding Source |
Average Amount per Project of Developmental Funding ($) |
|
Non-SBIR federal funds |
248,077 |
|
Private investment: |
|
|
(1) U.S. venture capital |
39,450 |
|
(2) Foreign investment |
19,290 |
|
(3) Other private equity |
196,141 |
|
(4) Other domestic private company |
57,925 |
|
Other sources |
|
|
(1) State or local governments |
19,938 |
|
(2) College or universities |
617 |
|
Not previously reported |
|
|
(1) Your own company (including borrowed money) |
54,617 |
|
(2) Personal funds |
22,154 |
|
SOURCE: NRC Phase II Survey. |
|
Companies were asked to identify how much development funding from each of a number of potential sources went to the further development of the technology in each referenced project. Of 162 respondents, slightly more than half (93) reported additional funding by non-SBIR sources. Table 5.2-7 lists the reported developmental funding amounts by funding source, averaged over the 162 respondents to the question.12
The largest funding amounts for development came from two sources. Non-SBIR federal funding sources provided the largest amount. Other private equity
sources provided the second largest amount. On average, U.S. venture capital provided substantially less than either the grant-recipient company or other domestic private companies.
Employment. Employment growth is relevant as an indicator of firm expansion often associated with commercialization. Describing employment changes in small companies associated with given project developments is more feasible than attempting the same in larger companies, yet ascribing causality remains difficult. While the data are descriptive rather than indicative of causality, the survey provides information on employment of respondent companies at the time the referenced proposals were submitted, and again at the time of the survey. On average, the companies had 21 employees at the time the referenced proposals were submitted and an average of 38 employees at the time of the survey, showing that the grant recipient firms grew on average over the period of the referenced projects.
To get at the employment effects directly associated with the referenced projects, respondents were asked how many employees were hired and how many were retained as a result of the technology developed by the project. On average, they reported 1.5 employees hired and 2 employees retained as a direct result of the technologies developed during these projects. Slightly less than half of the respondents reported no employees hired (48 percent) or retained (42 percent) as a result of the project. Women and minorities received 21 percent of the project principal investigator positions. These results emphasized employment in the grant-recipient firm, not in the larger economy where longer-term effects may be larger and measurement more difficult.
Attribution of Effects to the SBIR Grant. A challenge of evaluation is establishing attribution. Did the program cause the observed effect or would it have happened anyway? Asking counterfactual questions of participants about what they would have done without the SBIR grant is one approach to attempting to establish attribution of effect to the program.13
When asked if their companies would have undertaken the projects had there been no SBIR grant, approximately two-thirds of respondents responded either probably not (43 percent) or definitely not (24 percent). Nineteen percent were uncertain. Fourteen percent responded either probably yes (10 percent) or
definitely yes (4 percent). The 14 percent who said they definitely or probably would have undertaken the project in the absence of the SBIR grant were then asked about the project’s scope, timing, and progress in achieving similar goals and milestones. The majority (84 percent) of those who thought they would have continued without the SBIR grant said the project would have been narrower in scope, while a small number (13 percent) said it would be broader or similar in scope. Likewise, most of these companies (79 percent) reported that the start of the project would have been delayed without the SBIR grant, with the average delay being 15 months. Most of the responding companies (87 percent) reported that without the grant, the project would be behind in achieving similar goals and milestones. Table 5.2-8 shows how, in the opinion of the respondents, things would have been different had there not been the referenced SBIR grant.
Projects Discontinued. It is instructive to examine the 30 percent of survey respondents who indicated that efforts at the company related to the referenced Phase II grants had been discontinued. Why did these projects fail to take their innovations further?
Twenty percent of these projects were discontinued with no sales or additional funding resulting. Another 10 percent indicated that the project had resulted in sales or licensing or additional funding but subsequent efforts had been discontinued. Note that another 1 percent indicated that their projects had not yet completed Phase II.14
The 30 percent of projects that were discontinued were stopped for the various reasons given in Table 5.2-9. The table shows that usually the projects were discontinued for more than a single reason. It may be seen that the most commonly cited “primary reason” for discontinuing projects was “technical failure or difficulties,” followed by “market demand that was too small,” followed in turn by “insufficient funding,” “licensing to another company,” and “shifted priorities.” Of lesser importance were “departure of the principal investigator,” “lack of competitiveness of the product, process, or service,” and “achievement of the project goal”—all listed with equal frequency.
“Not enough funding,” “market demand too small,” and “shifted company priorities” were frequently listed as among the secondary reasons for discontinuing the referenced projects. “Inadequate sales capability,” “departure of the principal investigator,” and “too high technical risk” were least often given as secondary reasons for discontinuing the projects.
Thirty percent of Phase II projects not continuing into further development or commercialization would appear to represent a substantial loss to the program. Therefore, further analysis of project failure may be warranted. Learning how to avoid or abate those factors causing projects to be discontinued may be possible
TABLE 5.2-8 What Would Have Happened Without the SBIR Grant?
in some cases, providing an effective way for the program to get more out of its funded projects. At the same time, it should be realized that much can be learned from technical failure. Technical failure can reveal which technical paths not to follow. And, technical failures can become hurdles that others find new ways to overcome.
5.2.3
Projects Not Continuing into Phase II as Revealed by NRC Phase I Survey Data
The NRC Phase I Survey focused on Phase I projects that were not followed by a Phase II project. The survey data provide insight about the commercial and
TABLE 5.2-9 Reasons Given by Companies for Discontinuing Phase II Projects
noncommercial outcomes of Phase I grants. The data also provide insight about factors that contributed to the reported outcomes.
Of 248 projects for which survey responses were received, 46 percent did receive a follow-on Phase II project and were asked only several questions about assistance in preparing the Phase I proposal. The remaining 54 percent (135 respondents) did not receive a follow-on Phase II project and were questioned more extensively.
Figure 5.2-4 summarizes results for the 135 surveyed projects for which no Phase II follow-on grant was received. The branch to the left shows more favorable results for commercialization, the right less favorable results.
Why the Phase I Grant Was Not Followed by a Phase II. Nearly 60 percent of the Phase I grants were not followed by a Phase II grant because, even though the company applied, it was not selected by NSF. Another third of the companies did not apply for a Phase II grant. Of those that did not apply, slightly more than half did not apply because the Phase I did not demonstrate sufficient technical promise, and slightly more than a third did not apply because of lack of sufficient commercial promise. Another 16 percent indicated that the NSF was not interested in a Phase II, likely indicative of a lack of technical or commercial promise. Some other reasons given by the companies for not pursuing a Phase II
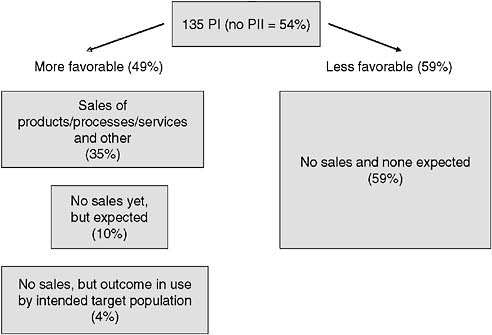
FIGURE 5.2-4 Commercialization Status of 135 NSF SBIR Phase I Projects.
SOURCE: NRC Phase I Survey.
were that proposal preparation was too difficult to be cost-effective, the company shifted priorities, the research goals were met by Phase I such that no Phase II was needed, and the principal investigator (PI) was no longer available.
Noncommercial Benefits from Phase I Grants. Of the Phase I grants not followed by Phase II grants, most respondents reported noncommercial benefits—primarily knowledge gains. The 135 Phase I grants resulted in 49 scientific publications of 52 submitted. The 135 Phase I grants also resulted in a total of 35 patents granted of 48 patent applications filed; 16 copyrights issued of 16 applications; and 14 trademarks issued of 15 applications filed. On an average basis, 0.3 patents were reported granted per Phase I grant.15 Other benefits reported by the responding firms were: enabling the founding of the firm or keeping the firm in business; employees hired and retained; and various benefits to the public, including environmental benefits, energy supply advantages, training, and public
|
15 |
As noted in Section 5.2.1, the average number of patents per grant is much less than the average number of patents per firm reported as being at least in part related to SBIR grants. While Phase I grants surveyed resulted in an average of 0.3 patents granted, firms surveyed reported an average of 6 patents related at least in part to SBIR grants. |
service benefits. Only 8 percent of these projects were reported to have no non-commercial benefits.
Post-Phase I Developments. Forty-five percent of the companies reported that they dropped the project after not getting a Phase II award. Forty-two percent went on to receive either another Phase I or a Phase II grant in the technology (though not as a direct follow-on). Ten percent went on to receive subsequent federal non-SBIR contracts or grants in the technology. Thirteen percent pursued the technology after Phase I, but the effort did not result in any subsequent grants, contracts, licensing, or sales.
Reported sales averaged close to $100,000 for the Phase I-only projects (compared to average sales of the Phase II survey projects of nearly $400,000). Licensing fees averaged under $1,000. The top five Phase I-only grants for which sales were reported accounted for 62 percent of total sales for this group and ranged from $700,000 to $2,033,589.
While most respondents reported that they did not attract additional funding for the Phase I technology development, 27 percent did report such funding. Additional development funding was obtained from a number of sources, with the largest amount coming from the company itself, followed by funding from other federal sources and from other domestic private companies. Less than 10 percent of the companies reported receiving developmental funding from U.S. venture capital sources.
Without the Phase I Grant: Had there been no Phase I grant, only 13 percent of the respondents thought they probably or definitely would have undertaken the research in approximately the same way. Forty-five percent thought they probably or definitely would not have. Another 21 percent thought they probably would have undertaken the research, but most of these thought either the scope of the project would have been reduced or its completion slowed if there had been no Phase I grant. Fifteen percent were uncertain.
5.2.4
Commercialization as Illustrated by Selected Case Study Data
Case studies tell the stories of actual companies who have received NSF SBIR grants—adding flesh to the bones of the survey data. Table 5.2.10 provides an overview of 10 cases.16 Although they differ in many respects, the ten companies in the case study set were found to be similar in at least three respects.
-
All of the companies were receiving revenue at the time of the study.
|
16 |
The case studies were developed by interview and supporting research. The set of case studies is presented in full in Appendix D of this report, together with an account of how the cases were selected. |
TABLE 5.2-10 Case Study Company Demographics
|
Company |
Location |
Founding Date |
Technology |
Annual Revenue ($) |
No. Employees |
Gov’t Grants and Contracts (%) |
Originations |
|
Faraday Technology, Inc. |
Clayton, OH |
1991 |
Electrochemical technologies |
2 million |
10 FT 9 PT |
48 |
Woman-owned (inactive) |
|
Immersion Corporation |
San Jose, CA |
1993 |
Sense of touch added to computer interfaces |
23.8 million |
141 |
4 |
Stanford U spin-off |
|
ISCA Technologies |
Riverside, CA |
1996 |
Pest monitoring and control |
2.4 million |
12 |
40 |
Founded by U of CA-Riverside researcher |
|
Language Weaver, Inc. |
Marina Del Rey, CA |
2002 |
Software for statistical machine language translation |
12 million |
28 |
60-70 |
Founded by 2 professors at USC |
|
Mer Corporation |
Tucson, AZ |
1985 |
Rapid manufacturing prototyping in metal and composites; other |
7.9 million |
75 |
60 |
Arco Chem spin-off |
|
MicroStrain, Inc. |
Williston, VT |
1987 |
Micro sensors and wireless sensor networks |
5 million |
20 |
>26 |
Founder started company upon leaving graduate school |
|
National Recovery Technologies (NRT), Inc. |
Nashville, TN |
1983 |
Sorting plastics; electronics-based metals recycling |
4 million |
14 |
NA |
Older company changing technology focus |
|
NVE Corporation |
Eden-Prairie, MN |
1989 |
Electronics based on electron spin |
12 million |
70 |
35 |
Founded by Honeywell former executive |
|
T/J Technologies |
Ann Arbor, MI |
1991 |
Nanomaterials for batteries and fuel cells |
2.5 million |
24 |
15-20 |
Minority-woman-owned (active) and operated |
|
WaveBand |
Irvine, CA (now owned by a company in Nevada) Founding |
1996 |
Electronically steerable smart antenna |
5.5 million |
24 |
>50 |
Spin-off of Physical Optics; acquired in 2005 by Sierra Nevada Corp (large co) |
|
NOTE: See Appendix D for details. |
|||||||
-
The companies expressed a belief that SBIR grants were critical to their ability either to get started at all or to develop capabilities critical to their existence and continued strength.
-
Without exception, the companies sought and received grants not only from the NSF but from SBIR programs operated by other agencies and, in a number of cases, from other kinds of government funding programs as well—notably the Defense Advanced Research Projects Agency (DARPA) and the Advanced Technology Program (ATP).
Given the limited number of case studies performed, and the diversity that characterizes them, the cases are illustrative only. They cannot be taken as necessarily representative of the universe of SBIR grant recipients. Yet, a number of common themes were found to run through this set regardless of their diverse locations, technology fields, year of founding, and other particulars.
Table 5.2-11 lists five broad and overlapping common themes that emerge from the cases, each of which has implications for commercialization, and each of which is discussed in turn in the following paragraphs.
No Linear Path from Phase I, Phase, II, and Phase IIB, into Phase III. The company interviewees made it clear that a simple linear model of Phase I, Phase II, and Phase IIB grants is woefully inadequate to mount the kind of
TABLE 5.2-11 Broad Common Themes Running Through the Cases Studies
|
Theme |
|
There is no linear path from NSF Phase I, Phase II, and Phase IIB into Phase III |
|
R&D finance is a major challenge to firms |
|
SBIR enables firms to
|
|
Firms pursue multiple paths to commercialization, including contract research as an ongoing line of business |
|
Commercializing is typically costly and challenging |
|
Multiple benefits result from commercialized technologies |
|
SOURCE: Analysis of 10 case studies. |
technology research and development program necessary to bring an advanced technology to the point of attracting private sources of funding on favorable terms. Some described how they might get a concept going with a Phase I SBIR grant from one agency, and later take it forward with an SBIR grant from another agency. Some spoke of using SBIR grants to get an idea to a certain point and then taking the idea forward with an ATP award. Some explained how they used DARPA funding to get an idea to the point that it could be taken forward with a combination of SBIR and ATP funding. Some leveraged government research grants into government research contracts, with the goal of that leading into commercial deals in the private sector. Others got a jump start in university research labs, often with government support, and then spun out a business. In none of the cases was there a simple sequence of NSF Phase I, Phase II, and Phase IIB grants that provided adequate preparation for a launch into Phase III commercialization.
|
“The SBIR grants served as building blocks for us,” explained Maria Thompson, President of an award-winning African-American, woman-owned firm, T/J Technologies, Inc. “Without the SBIR, we couldn’t have won the ATP. And, without the ATP and SBIR, we may not have had the technology with which to earn the larger contracts and joint development agreement…. They are all linked.” |
In all the cases, the story involved multiple funding sources and a complex path to Phase III. The brief examples that follow, drawn from the case studies, illustrate the lack of a simple, linear path leading from SBIR financing to commercialization.
Ongoing Search for Research Funding. A common theme among the case study companies was that to stay in the high-tech game, continuous research, and, hence, ongoing funding of research, is needed. Although several of the companies appeared to be shifting emphasis from research to commercial product development, all the firms referred to the need for continuous innovation to keep their edge. In no case was the story a one-way path of conducting research, developing a product, going to market, and then enjoying sales. These companies all seemed to define themselves as current—not past—innovators, and all appeared to be looking ahead to the next technical challenge.
|
Box A There Is No Linear Path from NSF Phase I, Phase II, and Phase IIB into Phase III Faraday Technologies, Inc. made the point that a “failed” Phase I grant provided the seed for later electronics work that now provides 35 percent of the company’s business and accounts for 8 of its patents. “It is not a tidy path; it is a cumulative process.” Immersion Corporation’s technology—adding sense of touch to computer applications—got its start in a university laboratory. SBIR funding from NIH, DoE, DoD, Navy, Army, and the NSF, as well as an ATP award, figured in its financing of technology development. Now the company has a number of products in the market and is relying principally on private equity funding. Language Weaver, which offers a seemingly straight path of NSF grants leading to commercialization, actually had about 20 years of university research heavily funded by DARPA underlying its technology development. ATP also provided funding for further development of the technology following a series of NSF SBIR grants. NVE Corporation initially licensed rights to civilian applications of its MRAM computer memory technology from Honeywell, where its development hadreceived military support. With a combination of SBIR grants from the NSF and other agencies, at least two ATP awards, funding from work on agency BAAs, and other sources of revenue, NVE developed sensors based on the MRAM technology and has continued to develop MRAM. T/J Technologies, Inc. started by taking over a DoD SBIR Phase I grant from a company that was divesting contractual obligations. This grant served as a building block for T/J to obtain a series of SBIR grants from multiple agencies, which in turn served as a building block for it to obtain larger ATP awards. As it developed its technology in advanced materials for energy storage and conversion devices, T/J was positioned to pursue research contracts with the Army under BAAs. From there, the company was able to develop partnerships with global firms. See Appendix D for more details. |
|
The emphasis on research to support ongoing innovation means that funding for research is a constant rather than a one-time issue for these companies. |
Because all these companies are in various stages of commercialization, usually involving more than one product, they have a continual need for financial support to get products, services, and processes to market. In most cases these
companies were receiving sufficient revenue from sales, licensing fees, and contract research to supplement their laboratory research and were no longer threatened by financing gaps in government grant programs. But in all the cases, the companies seemed to be wrestling with the issue of how to get the funding needed to sustain technological strength and make advances needed for survival and growth. Supplying research funding appeared to be an ongoing and constant concern for these innovative companies even though they all had successfully developed technologies and had made substantial progress in commercializing them.
As one company’s president explained its ongoing research needs, “We need a family of materials for multiple applications … to demonstrate a whole system, and that takes time and money.” Another company president described how his company had used SBIRs to rejuvenate its technical base as demand for existing products fell off. Even the company that most seemed to be shifting emphasis from research to commercialization indicated that it would continue its internal research and reliance on the fruits of ongoing university research.
Difficulty in Obtaining Private Funding. Most of the companies spoke of difficulties in obtaining private funding to develop their technology base and take it to the point of commercialization. One of the difficulties centered on the unfavorable negotiating power of a small firm that may be pressured to seek financial assistance from venture capitalists or other companies before the firm is ready. As one company president put it, “They are going to try to get all of your IP [intellectual property], for only a fraction of its value.” A representative of a company that has been successful in obtaining private funding also noted the difficult path in obtaining it, explaining that the company founders were turned down multiple times before they received confirmation of the technology by receiving an NSF SBIR grant and became able to demonstrate the technology’s potential.
Another difficulty in finding private funding centered on the type of technology. The two software companies in the set of case studies, both located in California, were more successful in obtaining venture funding than most of the other case study companies. As a company president of a materials research company put it: “Venture capitalists don’t fund manufacturing. They don’t fund materials research. The development time horizon is generally too long.”
It is also possible that companies located in venture capital hotbeds like the San Francisco Bay Area or Boston may have an easier time raising private funds than companies based in regions without such a large entrepreneurial community devoted to high technology.
|
… the company founders were turned down multiple times [by private funding sources] until they received confirmation of the technology by receiving an NSF SBIR grant and becoming able to demonstrate its potential. |
The SBIR Program as an Enabler and a Lifeline. All the companies that were interviewed described at least one important role played by the SBIR program, which varied depending on the needs of the company. In a number of the cases, an SBIR grant figured in the start-up of the company. In other cases, an SBIR grant helped the company survive when it had encountered hard times. In all the cases, SBIR grants were used to further the companies’ technical capabilities in ways that enabled them to bring new and improved products and services to customers. Furthermore, all the companies appeared to use the SBIR grants as a means to leverage other sources of funding. Several companies saw SBIR grants as a way to retain control of their companies. Several saw SBIR grants as a way to build capability in order to improve negotiating strength so as to attract partners and investors on more favorable terms. The following examples from the case studies illustrate various roles the SBIR program has played for these companies.
Intellectual Property as a Competitive Advantage. As a group, the case study companies appeared to pursue aggressive patenting and trade secret strategies, and they regarded intellectual capital as their core strength and the source of their competitive advantage. In all the cases, SBIR grants figured prominently in the development, extension, and renewal of the core technologies that comprised the companies’ intellectual property base and enabled the firm to file for patents.
Faraday Technology, for instance, has, since its founding in 1991, had 23 patents issued in the U.S. and three issued abroad, which historically amounts to 1.4 issued patents per employee. Patents and the fees they generate are the central focus of Faraday’s business strategy, and the company investigates citations by other companies of its patents to obtain knowledge about potential customers. (See Appendix D.)
Immersion Corporation has more than 270 patents issued in the United States, and another 280 patents are pending in the United States and abroad. According to Immersion, its patent portfolio is at the heart of its wealth-generation capacity. (See Appendix D.)
ISCA Technologies has received a trademark on its most recent insect lure technology—a technology that is expected to generate substantial growth for the company, as well as benefits for the environment.
|
Box B The SBIR Program as an Enabler and a Lifeline for High-Tech Companies Faraday Technologies, Inc.: The SBIR grant enabled the company to undertake research that it otherwise would not have done. It sped the development of proof of concepts and pilot-scale prototypes, opened new market opportunities for new applications, led to the formation of new business units in the company, and enabled the hiring of key professional and technical staff. The SBIR [program] “is well structured to allow taking on higher risk….” Immersion Corporation: SBIR grants gave Immersion the ability to grow its intellectual property portfolio, the core of its commercial success. The company leveraged the government funding to attract investment funding from private sources. It has grown to a capitalized value of $173 million. ISCA Technologies: The SBIR program was essential to the survival of the company after it hit a major financial setback on its initial path. “The NSF SBIR gave us lots of prestige; it gave us credibility.” The company used SBIR funding to upgrade its technology and find new markets. MER Corporation: The SBIR program allowed the company to steadily improve and advance its R&D capabilities. It also enabled the owners to not lose control of the company. Language Weaver: “The STTR/SBIR from NSF created Language Weaver and what we are today. Without that we would have shelved the technology.” MicroStrain, Inc.: The company found the NSF SBIR program, with its “more open topics,” particularly helpful in the early stages when the company was building capacity. National Recovery Technologies, Inc.: “Without the SBIR program, NRT wouldn’t have a business. We couldn’t have done the necessary technical development and achieved the internal intellectual growth…. SBIR saved our bacon.” NVE Corporation: The SBIR program is “the mother of invention.” SBIR and other government R&D funding programs are essential to NVE being able to perform the advanced R&D that has allowed the company to produce products for sale and to license intellectual property. T/J Technologies, Inc.: “The SBIR grants served as building blocks….Without the SBIR, we couldn’t have won the ATP. And, without the ATP and SBIR, we may not have had the technology with which to earn larger contracts and joint development agreements. So they are all linked…. The cutting edge intellectual property that we have developed through the SBIR and ATP programs has attracted multiple players to us. Small companies have a stronger negotiating position when more than one company competes for their technology.” WaveBand Corporation: Initially, the company (which is a spin-out of another company) was dependent on SBIR grants. After focusing on military objectives, the company went through a cycle of Phase I, Phase II, and Phase IIB NSF SBIR grants to develop not only technical prowess but also commercial strength for the company. “The technologies the company developed under Phase II SBIR research are vital to its commercialization success.” See Appendix D for more details. |
Language Weaver has more than 50 patents pending worldwide; these patents underpin its commercialization approach. (See Appendix D.)
The other companies in the set of case studies reported similar essential roles for their intellectual property. (See Appendix D.)
|
… intellectual capital—the core strength and source of competitive advantage |
Multiple Paths to Commercialization. The case study companies were found to be pursuing a mix of approaches to commercialization, including licensing, partnering, providing contract services, and producing and selling product (see Appendix D). Licensing was an important route to commercialization for about half the case study companies. This finding is consistent with NRC Phase II Survey results, which also showed the importance of licensing as a path to commercialization. For example, the major route to commercialization for Faraday Technology has been to license “fields of use” to interested customers. As another example, Language Weaver describes itself as “a core technology house based on licensing its software” directly to customers and indirectly through partners who license Language Weaver’s technology and incorporate it into their own products. And, as noted in the section that follows, licensing as a commercialization strategy was also emphasized by Immersion, MER Corporation, and NVE Corporation.
|
… agencies who collect information about SBIR impacts typically ask only about product sales, whereas, in fact, most SBIR grantees are not OEM suppliers of product. |
Most of these companies generally had not built, and did not plan to build, large, commercial-scale production facilities. However, it was not unusual for the companies to maintain small-scale production capabilities or to arrange for small-scale contract production and to sell directly to customers on a limited basis. Some maintained pilot-scale production facilities for making prototypes or limited production facilities to produce a single line of product. In keeping with this finding, interviewees frequently commented that the strength of the company was research, not manufacturing. Another comment heard several times was that the scale of a production facility needed for competitiveness was huge and the capital cost requirements were enormous—far beyond the capacity of a small
company. One company’s marketing director noted that agencies who collect information about SBIR impacts typically ask only about product sales, whereas in fact, most SBIR grantees are not OEM suppliers of product.
T/J Technologies, a materials development company facing a relatively long product development cycle and what were described as “prohibitive” costs to build production facilities, is emphasizing partnerships with large global companies to reach markets. MER Corporation is commercializing through a mix of strategic alliances, joint ventures, licensing, and production and sale of product. NVE is also pursuing a mixed strategy—commercializing its MRAM technology primarily through “an intellectual property business model,” while it continues to design, fabricate, and sell directly a variety of sensors and signal coupler devices for both commercial and defense applications. Although it has the largest annual sales revenue to date and the largest revenue from direct product sales among the companies in the case study set, Immersion Corporation has limited manufacturing operations, arranges for some contract manufacturing, and “far and away, depends on licensing fees as its major source of revenue.” NRT has maintained a steady annual revenue stream on the order of $2 million–4 million for a number of years from the sale of equipment and now is seeking larger markets through partnerships both to operate and to sell equipment.
Among the case study companies, those that appeared most focused on direct product sales as the major path to commercialization were ISCA Technologies and MicroStrain. Currently, ISCA’s annual revenue from sale of product is approximately $1.5 million. It has multiple product lines and is anticipating a dramatic increase in sales in the near future from a new trademarked product. Likewise, MicroStrain’s main path to commercialization has been the sale of sensors and systems of networked sensors. In the past, WaveBand has mainly focused on sales of antenna systems to defense agencies. More recently, it has also worked with suppliers in the auto industry on adaptive cruise control for cars and with suppliers in the avionics industry on guidance and landing systems. In any case, WaveBand’s recent acquisition by a large systems integrator may alter its commercialization strategies.
Contract Research as an Ongoing Line of Business. Another recurring theme from the case studies was that contract research is often used as a bridge to commercialization, and is also seen by some as a way of life. One interviewee, for example, characterized his company as “an innovation house for a number of companies that are not well positioned to innovate themselves.” Other interviewees said the large number of innovative small companies performing contract research had, in aggregate, provided a practical replacement for the large corporate research labs of the past that have been reduced in size or shut down. More often, the case study companies appeared to pursue contract research as a business sideline to generate revenue. For example, MER Corporation relies heavily on government engineering contracts as a source of revenue, and describes itself
as operating as an engineering services company. MicroStrain performs contract research as a source of revenue, but it reportedly focuses on product sales. T/J Technologies currently obtains most of its revenue from contract research, but its longer-term strategy is reportedly to develop partnerships for commercializing its material technologies.
|
Contract research appears to be important to most of these companies either as an interim or an ongoing commercialization strategy. |
Challenges of Commercializing. These 10 cases emphasize that even under the best of circumstances getting to market is difficult. Even those companies that were relatively successful in commercializing spoke of the difficult challenges faced by small companies trying to develop and commercialize a technology. “I think commercialization is very hard for people,” said an interviewee from one of the most rapid commercializers, commenting on the challenge of finding additional funding sources and partners as early as needed. Another interviewee noted the trepidation of entering into partnerships and negotiating arrangements with large, powerful companies early in development. But the difficulties did not end with start-up. Several of the companies that appeared to have achieved commercialization had then come close to folding as a result of events outside of their control, such as a default on product orders from a foreign buyer (see the ISCA Technologies case study in Appendix D) and a collapse of markets due to an adverse Supreme Court decision (see the National Recovery Technologies case study in Appendix D).
|
“… commercialization is very hard …” |
Multiple Benefits from Commercialized Technologies. All of these case study companies linked commercialization of their technologies to SBIR grants and, in turn, linked commercialization of their technologies to the generation of multiple benefits, including direct economic benefits. Though net income or profit data are confidential and not available, revenue data are available and summarized in Table 5.2-10. Annual revenue ranged from $2 million to nearly $24 million and averaged $7.7 million across the 10 companies.
Beyond the return to company owners, there may be employment benefits. Table 5.2-10 gives employment data as of the time the 10 case studies were
conducted. The number of employees ranged from 14.5 to 141 and averaged 42 employees per company. Although attribution of employment to the SBIR grant was not attempted, we can conclude that all these companies have grown since their founding and, from statements of the company founders, CEOs, and presidents, we have evidence that SBIR grants played an important role in the development of all of these companies.
Each of the companies identified a number of additional benefits conveyed by their products or services. For example, Faraday’s process technologies result in lower cost manufacturing and higher quality output for its customers, as well as potential beneficial environmental effects. Immersion’s technology can boost the productivity of software users, enhance online shopping experiences, enhance entertainment from computer-based games, improve skills of medical professionals, increase auto safety, enable industry to experience prototypes virtually before building costly physical prototypes, capture 3-D measurement from physical objects, and assist visually impaired computer users. ISCA’s technology offers cost savings, quality improvements, and increased profitability for its customers, as well as environmental, health, and safety benefits. Language Weaver’s technology offers a significantly higher rate of accuracy in language translation than counterpart rule-based machine translation systems and greater speed than human translators—this could have important military and civilian applications. MicroStain’s sensors and networks of sensors offer the benefits of alerting managers to emerging problems in time to take preventative action, conserve resources, improve performance, and increase safety.
|
Potential benefits from the resulting products and services—beyond those accruing to the companies—include lower costs and higher quality for customers, reduced threats to the environment, improved safety, improved outcomes for medical patients, alerts to emerging structural problems, and faster translations in military and civilian situations. |
5.2.5
Commercial Progress as Indicated by Agency-Initiated Data and Analysis
The NSF’s approaches to analysis and data compilation are discussed in Section 8.8. The results of program-initiated analysis of commercialization are summarized in this section. In addition to the routine publication of “nuggets” and “success stories” (see Exhibits 4.5-1 and 4.5-2), several ad hoc survey studies have been conducted by the program since 1995.
The survey studies have relied primarily on telephone interviews using a structured interview guide. The studies collected data to show measures of perfor-
mance for a selected group of companies. One such study was completed in 2004. It is referred to here either as the “2004 NSF SBIR Commercialization Survey” or the “Coryell Study,” after the NSF SBIR program manager who conducted it.17 Another study, conducted in 1996, will be called the “Tibbetts Study,” after another NSF SBIR program manager.18 A related study carried out by a contractor, but never completed and released, will be called the “Dawnbreaker Study,” after the contractor. All three studies were internal studies, not published in the open literature. A new internal effort to collect commercialization data was begun in the summer of 2005, and provides limited data.
The Tibbetts Study, according to the NSF’s SBIR program office, was the first agency-initiated study to produce program performance metrics. Study results were included in an earlier NRC report.19 The study covered a group of 50 companies, all of which had commercialized results of their SBIR grants.
The Dawnbreaker Study (intended to extend the Tibbetts Study but never completed) conducted interviews with 30 companies and developed approximately 20 “success stories” based on the interviews. The study also reported quantitative indicators of success for the 20 “successful companies,” including cumulative sales dollars, total investment, number of new jobs, number of patents and copyrights, use of trade secrets and trademarks, and number of collaborators from industry and universities. The results of this study were much less favorable for NSF commercialization than the previous Tibbetts Study.
Between 2000 and 2004, the Coryell Study surveyed 34 companies. Among the companies surveyed were 17 “stars” selected by program managers as companies for which they had high expectations of outstanding accomplishments.
Among the findings of the Tibbetts Study are the following:
-
100 percent of the 50 selected firms had commercialized their SBIR-funded innovation.
-
Sixteen of 50 firms said that the SBIR projects were key to starting the company.
-
Forty-five of the 50 companies said the SBIR projects were critical to their growth and/or survival.
-
$2.2 billion in sales were reported to be directly related to NSF SBIR.
-
The 50 companies were granted an estimated 377 U.S. and 732 foreign patents that related directly or indirectly to SBIR program research or funding.20
-
Private follow-on investment was $963 million, of which $527 million was considered directly related to NSF SBIR projects.
-
The 50 companies had 959 research collaborations: 404 with industrial firms, 394 with universities, and 111 with national laboratories (not attributed to specific projects).
-
The 50 companies achieved specific technical breakthroughs and innovations.
-
The 50 companies achieved specific commercial successes.
-
A table of performance indicators was developed from data compiled for the 50 companies.
Among the results of the Dawnbreaker Study (based on a draft report provided by the NSF’s SBIR program office) are the following:
-
Cumulative sales directly or indirectly attributable to the selected 20 NSF SBIR projects totaled $31.8 million—much lower than the amount reported in the Tibbetts Study even when adjusted for differences in the number of companies.
-
A conclusion that the 50 companies included in the Tibbetts Study represented the “cream of the crop,” including three of the most successful commercializers.
-
A conclusion that companies in the Tibbetts Study had been funded for a longer time prior to the interviews than those included in the Dawnbreaker Study, thus contributing to the larger revenues found by the Tibbetts Study.
-
Twenty draft “success stories.”
-
A table of indicator data for 20 companies.
The Coryell Study includes survey data for approximately 300 projects; those data are summarized in Table 5.2-12. Using a criterion of “fully successful”—defined as having achieved a “first sale”—the study (based on preliminary results) concluded that 40 percent of the companies surveyed (FY96–98) were “fully successful.”
The Coryell Study provided more extensive results for 34 grant winners: 10 with no Phase IIB grants and 24 with Phase IIB grants (fifteen of which had more than one). Figure 5.2-5 shows commercial results for 33 of the 34 companies reporting commercialization. Product sales attributed to NSF SBIR grants averaged $3.5 million for the 33 companies. (NOTE: Questions used to develop the findings given in Figure 5.2-5 are shown in Appendix E.)
The Postproject Annual Commercialization Report. A postproject annual
|
to the average of six per firm reported by the NRC Firm Survey, as reported in Section 5.2.1—that is, assuming that the NRC Firm Survey patents reported were U.S. patents. It would be expected that the Tibbetts group of firms would show a higher average than the NRC Firm Survey, because the Tibbetts firms were drawn from the highest achievers. |
TABLE 5.2-12 Survey Results of the “Coryell Study”
|
|
NSF Initial Survey Results, 2003 |
|||||||
|
Fiscal Year 1998 |
Fiscal Year 1997 |
Fiscal Year 1996 |
Fiscal Years 1996–1998 |
|||||
|
Number |
Percent |
Number |
Percent |
Number |
Percent |
Number |
Percent |
|
|
Full success |
36 |
29 |
55 |
46 |
31 |
53 |
122 |
40 |
|
Likely success |
20 |
16 |
25 |
21 |
2 |
3 |
47 |
16 |
|
Commercial failure |
35 |
28 |
22 |
18 |
16 |
27 |
73 |
24 |
|
Technical failure |
21 |
17 |
11 |
9 |
7 |
12 |
39 |
13 |
|
Other |
12 |
10 |
7 |
6 |
3 |
5 |
22 |
7 |
|
SOURCE: National Research Council Symposium, “The Small Business Innovation Research Program: Identifying Best Practice,” Washington, DC, May 2003. |
||||||||
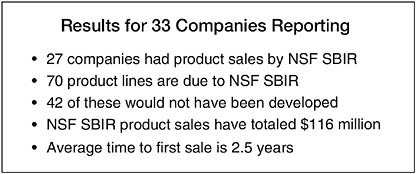
FIGURE 5.2-5 Commercial Findings from the Coryell Study.
SOURCE: NSF.
commercialization report was long required by the program of all Phase II grantees. While it would appear to be a potential source of evaluative information, reporting compliance by grantees has been low. Moreover, the reports that were filed have not been used to assess commercialization. Hence, there are no findings available from this effort.
New Monthly Postcompletion Telephone Interview of Grantees. A new interview survey was implemented in July 2005. Thirty companies reaching the third-, fifth-, or eighth-year anniversary after project start were interviewed by an NSF program manager in this telephone survey. Using the OII’s definition of commercial success,21 the first survey report found that half the 24 companies
responding were “fully successful,” and overall, the 24 companies had achieved in sales an amount that equaled at least the value of their grants.22 Of the half that were deemed not successful, the reasons given were technical failure, poor cost competitiveness, and insufficient demand. The postproject Annual Commercialization Report and the new monthly interview are discussed further in Section 8.8.
5.2.6
Commercialization Insights Provided by a Committee of Visitors
Expert review of the SBIR program is provided every three years by the NSF SBIR Committee of Visitors (COV). Findings from its 2004 review concerning commercialization are timely and relevant in a number of ways to the current NRC assessment of program performance and its efforts to provide recommendations for program improvements.
The COV recommended that “more consideration be given to commercial potential in evaluating Phase I proposals….” Specifically, it recommended that the review panels for Phase I proposals have more well-qualified representatives from the business sector. (The COV’s mode of assessment is discussed in Section 8.8.1.)
5.3
CONCLUSIONS ON COMMERCIALIZATION
Frequency of Commercialization. The NRC surveys, the case studies, the three surveys conducted by the NSF, and the new postcompletion telephone survey all show a range of commercialization results. The Tibbetts survey, which provides the largest revenue estimates, had a concentration of the most successful companies. The NRC Phase II Survey results showed that 22 percent of the referenced projects reported products/processes/services in use. An additional 10 percent of the referenced projects had produced sales, had licensing fees, or had attracted additional funding, but were discontinued.23 Because the 10 percent figure includes attracting additional funding, we cannot conclude that 32 percent (22 percent + 10 percent) achieved sales. Furthermore, we do not know to what extent “sales” includes samples put out to customers for trial or testing rather than commercial sales. Hence, we can conclude only that between 22 percent
and 32 percent of projects in the Phase II survey had achieved some degree of sales revenue.
Of course, the percentage of projects resulting in sales revenue may rise in the future, as indicated by the 19 percent of respondents reporting commercialization under way and the 28 percent of projects still active in the developmental stage. Yet, these could be offset in the future by some of those projects now active becoming inactive, and some of the prospective projects not achieving sales. If half those expecting commercialization achieve it and remain active, and if a quarter of those still in development achieve commercialization and remain active, this would raise the upper bound of projects achieving sales revenue and remaining active to as high as 38.5 percent. This projected upper-bounds figure approaches the finding of the larger Coryell Study, which found that 40 percent of the projects surveyed had achieved a first sale.
Commercialization as Signaled by Sales Revenue. The NRC Phase II Survey showed that relatively few of the projects had achieved significant sales revenue. When the total reported sales revenue was averaged across all survey projects, sales revenue averaged about $0.4 million per project and licensee sales averaged about $1.4 million per project. Furthermore, just eight of the projects—each of which had $2.3 million or more in sales—accounted for over half the total sales dollars reported by survey projects. The project with the highest reported annual sales amount had $4.8 million in sales. Similarly, a single licensee accounted for over half the total licensee sales dollars.
The set of 10 case study companies reported annual company revenue ranging from $2 million to nearly $24 million. The average annual company revenue per company was $7.7 million. This included revenue from all company projects—not just a single NSF project.
The Tibbetts Study, which included some of the most successful NSF SBIR projects and was taken over a longer period of time than did the other studies, found much larger sales revenue. It was reported cumulatively by the study rather than annually; hence, the data from the various sources are not comparable as reported. Cumulative direct sales attributable to NSF SBIR projects ranged from $1 million to $500 million. Cumulative direct and indirect sales ranged from $2 million to $2.6 billion.
To the extent that the past is a predictor of the future, more than half the projects funded by SBIR likely will not achieve commercialization. Somewhere between 20 percent and 40 percent will probably achieve some level of commercialization. For most of these projects, sales revenue will likely remain relatively small, with approximately 10 percent having more robust sales in the range of $2 million to $10 million annually—again, if the past is a predictor of the future. A smaller percentage of projects will likely achieve large growth and huge sales revenues, i.e., be commercial “home runs.” These patterns are similar to those found in other private and public investments in high-risk advanced
technology investments, where many research projects must be seeded to yield a few commercial home runs. Meanwhile, many small successes together will continue to comprise a potentially important component of the nation’s innovative capability.
Based on the counterfactual data, the NSF’s SBIR program can take credit for most, but not all, of the observed effects. A reported 14 percent of the surveyed firms believe that they definitely or probably would have done the referenced projects anyway, although most of these projects reportedly would have been narrower in scope, delayed in starting, and slower in progressing without the NSF SBIR program.


