
4
NIH SBIR Program—Outcomes
4.1
INTRODUCTION
The Congress has tasked the National Academies to assess whether and to what extent the SBIR program at NIH has met the congressionally mandated objectives for the program, and to suggest possible areas for improvement in program operations. Although Congress has over the years identified a number of objectives for the program, these mandated objectives are usually summarized as follows:
-
Supporting the commercialization of federally funded research.
-
Supporting the agency’s mission.1
-
Supporting small business and in particular woman- and minority-owned businesses.
-
Expanding the knowledge base.
These four areas define the structure and content of this chapter. A subsequent chapter reviews program management in more detail, and provides a basis for possible improvements to the program.
Such an assessment raises difficult methodological challenges, which are discussed and to the maximum extent possible resolved in the NRC’s Methodology
|
1 |
The mission of NIH is “… science in pursuit of fundamental knowledge about the nature and behavior of living systems and the application of that knowledge to extend healthy life and reduce the burdens of illness and disability.” Accessed at: <http://www.nih.gov/about/>. |
Report.2 One issue however should be briefly discussed here too—the question of comparators.
Assessment is usually done by comparison—comparing programs and activities, in this case. Three kinds of comparison seem possible: with other NIH programs, with SBIR programs at other agencies, and with early stage technology development funding in the private sector, such as venture capital activities.
Yet none of these comparisons is valid.
Other award programs at NIH have fundamentally different objectives, such as promoting basic research (e.g., RO1 awards), developing medical capacity (awards for medical centers), or training. No other NIH award programs have as a primary goal the commercial exploitation of research. This fundamental difference in objectives must be taken into account in evaluating the SBIR program at NIH.
SBIR programs at other agencies are organized very differently and—at DoD and NASA at least—have quite different objectives.
NIH SBIR might be compared with venture capital activities, but these are typically focused closer to market, and include much larger investment (an average investment round of $7 million in 2005 as against less than $1 million for SBIR). VC investments are also focused on companies, not projects, further invalidating comparisons.3
Finally, while the question of commercialization is the most readily subject to measurement—through accessible data on sales and licensing revenues and other metrics—Congress has not prioritized among the four mandated objectives and each is equally important to NIH.
4.2
COMMERCIALIZATION
How well has the NIH SBIR program fostered commercialization of funded research? The following sections examine a variety of relevant indicators.
4.2.1
Proposed Commercialization Indicators and Benchmarks
Three sets of indicators are used to evaluate the extent to which SBIR grantees have commercialized their funded research:
-
Sales and licensing revenues (“sales” hereafter unless otherwise noted). Revenues flowing into the company from the commercial marketplace
-
constitute an important measure of commercial success, as sales are an indicator of realized market demand for the output from a project.
There is however no single agreed benchmark against which to measure whether agencies have met the legislative objectives for commercialization. It seems, therefore, reasonable to assess commercialization against a range of benchmarks:
-
R&D investments and research contracts. Beyond sales, further R&D investments and contracts are also good evidence that results from the project are moving toward commercialization. These investments and contracts may include partnerships, further grants and awards, or government contracts. The benchmarks for success at each of these levels should be the same as those above, namely:
-
Any R&D additional funding.
-
Funding of $1 million or more.
-
Funding of $5 million or more.
-
Funding of $50 million or more.
-
-
Sale of equity constitutes a less clear-cut indicator of commercial activity. A company which is sold because its acquirer is seeking a successful product has generated returns. Key metrics include:
-
Equity investment in the company by independent third party.
-
Sale or merger of the entire company.
-
Using these metrics, to what extent have NIH SBIR companies commercialized?
4.2.2
Sales and Licensing Revenues from NIH SBIR Awards
Data from three sources indicate that 30-40 percent of NIH projects funded between 1992 and 2002 have reached the marketplace. (These three data sources all refer here only to NIH projects. Note however that subsequent NIH resurveys suggest that this may substantially understate the eventual commercialization rate.)
The projects underlying the percentages in Figure 4-1 have generated posi-
|
BOX 4-1 A Note on Data Sources Research on the NIH SBIR program has benefited from the existence for three independent data sources on outcomes from the program.a These are:
|
tive revenue from sales or licensing. Follow-on surveys at NIH indicate that this figure could eventually grow to about 60 percent of projects. However, determining that projects have generated some revenues is insufficient, in three respects: First, the distribution of sales by size of revenue is important: Projects generating $50 million in sales have substantially greater commercial returns than those generating $100,000. Second, data on sales to date are insufficient: Accurate analysis requires the adjustment of this raw data set to take account projections of future sales. Third, it is useful to distinguish between sales and licensing revenues.
4.2.2.1
Sales Ranges
Figure 4-2 shows the number of grantees achieving each of the specified sales benchmarks. There are general similarities between the three data sources. The majority of sales (at least 68 percent for all three sources) are concentrated in the $0-$1 million range. None of the sources indicate that more than 10 percent of projects generated $5 million in cumulative revenues. Each data source recorded one (different) project with more than $50 million in revenues.
The DoD database indicates lower commercialization results than the two surveys. Entries in the DoD database constitute a formal part of the SBIR application process, capturing updated data at that time about commercialization from all previous SBIR Phase II awards, and companies may therefore be more
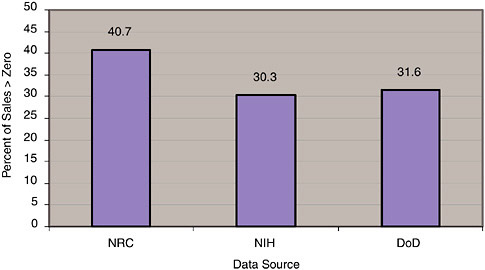
FIGURE 4-1 Percentage of NIH SBIR projects reaching the market from 1992-2002.
SOURCE: NRC Phase II Survey, DoD Commercialization database, and National Institutes of Health, National Survey to Evaluate the NIH SBIR Program: Final Report, July 2003.
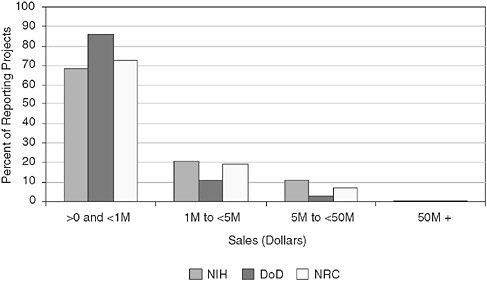
FIGURE 4-2 Sales by sales range, total for 1992-2002.
SOURCE: National Institutes of Health, NRC Phase II Survey, and DoD Commercialization database.
|
BOX 4-2 Multiple Sources of Bias in Survey Response Large innovation surveys involve multiple sources of bias that can skew the results in both directions. Some common survey biases are noted below. These biases were tested for and responded to in the NRC surveys.a
|
|
single survey.e This underscores the importance of follow-on research based on the now-established survey methodology. 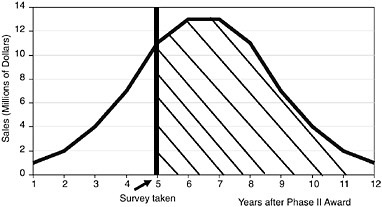 FIGURE B-4-1 Survey bias due to commercialization lag.Survey takenYears after Phase II Award These sources of bias provide a context for understanding the response rates to the NRC Phase I and Phase II Surveys conducted for this study. For the NRC Phase II Survey for NIH, of the 1,127 firms that could be contacted out of a sample size of 1,680, 496 responded, representing a 44 percent response rate. The NRC Phase I Survey captured 10 percent of the 7,049 awards made by NIH between 1992 and 2001. See Appendixes B and C for additional information on the surveys.
|
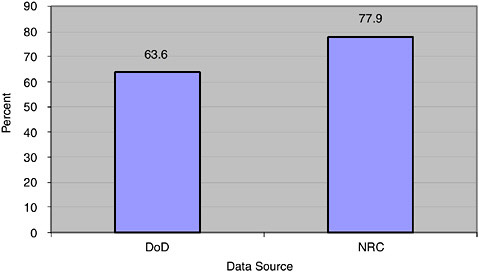
FIGURE 4-3 Degree of all sales concentrated in companies reporting $5 million+ in sales.
SOURCES: NRC Phase II Survey, DoD Commercialization database.
likely to ensure that their responses are conservative. The DoD responses are also from fewer companies, as they include a number of companies with numerous responses: Only 108 companies accounted for all the DoD responses, compared with 495 companies for the NIH Survey.4
Sales are highly concentrated. Figure 4-3 shows that the few projects generating at least $5 million per year in revenues account for most of the revenues reported for all projects, ranging from slightly over 60 percent for DoD respondents to more than 75 percent for NRC respondents.
This degree of sales concentration confirms the view that from the perspective of sales, the SBIR program at NIH generates a considerable number of projects that reach the market, no more than 10 percent of which generate sales greater than $5 million in total from the surveyed projects. Two of these larger winners, Optiva5 and Martek, are discussed in Box 4-3 and Box 4-4.
|
BOX 4-3 Optiva Corporation Medicine and dentifrice dispensing sonic brush, sonic toothbrush Optiva, formed as Tech in 1987 by an entrepreneur and two University of Washington professors, controls more than 26 percent of the U.S. power-toothbrush market, generating a $300 million business and 500 jobs mostly in Snoqualmie, Washington. By 1997, Optiva was named the fastest-growing company in the U.S. by Inc. magazine, and its CEO was selected as the Small Business Person of the Year. In August 2000, Philips agreed to acquire Optiva for an undisclosed price (reputed to be approximately $1 billion). At the time, Optiva had more than 600 employees and more than $175 million in annual sales from the Sonicare line. By 2001, Optiva had sold its 10 millionth power toothbrush, and had become the #1 producer of power toothbrushes in the U.S. market. |
|
BOX 4-4 Martek Biosciences Corporation Products from microalgae Martek Biosciences Corporation develops and commercializes products from microalgae. Martek’s products include fatty acids (omega-3 docosahexaenoic acid and omega-6 arachidonic acid) which are used as ingredients in infant formula and animal feeds. Martek’s DHA-rich oil can also be used in nutritional supplements and functional foods for older children and adults. Martek also produces fluorescent algal pigments used for diagnostic and pharmaceutical research purposes. Martek has become an important player in three markets:
Martek developed the technology underlying these products directly as a result of SBIR funding, according to Henry Linsert, founder and CEO. The result has been explosive growth for the company, rising from about $5 million in 2000 to more than $185 million in 2004. |
4.2.2.2
Sales Expectations
Nineteen percent of NRC Phase II Survey respondents did not yet report sales but expected sales in the future (see Figure 4-4). Table 4-1 shows that these expectations are strongly concentrated in the immediate out years.
These expectations may, however, be overly optimistic. Table 4-2 shows the elapsed time between the end of the Phase II award and the date of first sales. In some cases, possibly where the award is for improvements to existing technologies, first sales may occur before the Phase II award is even completed.
The data set in Table 4-2 shows that the median elapsed time to sale is less than two years—more than half of all projects reporting sales claim a date of first sale within two years of the start of the Phase II award. This number can be negative in cases where companies were using SBIR to improve products already in the market.
Further, NRC Phase II Survey responses indicate that more than 85 percent of first sales occurred before the end of the 4th year after the date of the award.
About 19 percent of all NRC Phase II Survey respondents claimed that they anticipated sales in the future. However, if the survey data accurately predicts the distribution of first sales across elapsed time since award, these respondents appear to be overly optimistic.
The likelihood of a project generating initial sales diminishes with time elapsed since the award. Table 4-3 focuses on the projects from the NRC Phase II Survey that still anticipate sales. It identifies the award year, and assigns a percentage likelihood of first sales, based on the distribution in Table 4-2. The NRC Phase II Survey data indicate that a vast majority (86.2 percent) of first sales are made within 4 years after the date of award. Consequently, projects that have not
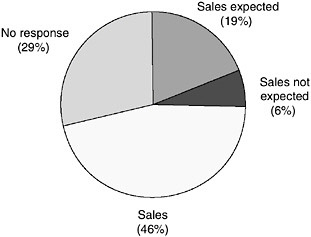
FIGURE 4-4 Sales expectations.
SOURCE: NRC Phase II Survey.
TABLE 4-1 Year of Expected Sales
|
Year of Expected Sales |
Number of Projects |
|
2005 |
22 |
|
2006 |
20 |
|
2007 |
20 |
|
2008 |
11 |
|
2009 |
1 |
|
2010 |
6 |
|
2011 |
2 |
|
2012 |
1 |
|
SOURCE: NRC Phase II Survey. |
|
generated a first sale within four years have a 13.8 percent likelihood that they will do so—historically, 86.2 percent of projects will have reported sales by then if they are going to have sales at all.
These percentages can be used to adjust the claims of respondents, in Table 4-3. They indicate that while 95 projects report that they still expect sales, we estimate that in the end only five will actually reach the market.
It is important to note that this analysis refers only to first sales. The bulk of sales in almost all cases occur at different and unknown periods after the first sale. This is an important point: The sales data from the survey are effectively a snapshot of sales taken at a specific point in the lifetime of a product. Most product revenue returns are bell-shaped—ramping up from initial sales to a maximum
TABLE 4-2 Years Elapsed Between Start of Phase II Award and Year of First Sale
|
Elapsed Years |
Number of Projects |
Percentage of Responding Projects |
|
−11 |
1 |
0.4 |
|
−7 |
1 |
0.4 |
|
−4 |
1 |
0.4 |
|
−3 |
4 |
1.8 |
|
−2 |
6 |
2.7 |
|
−1 |
9 |
4.0 |
|
0 |
18 |
8.0 |
|
1 |
29 |
12.9 |
|
2 |
50 |
22.3 |
|
3 |
48 |
21.4 |
|
4 |
26 |
11.6 |
|
5 |
17 |
7.6 |
|
6 |
8 |
3.6 |
|
7 |
3 |
1.3 |
|
8 |
1 |
0.4 |
|
9 |
2 |
0.9 |
|
SOURCE: NRC Phase II Survey. |
||
TABLE 4-3 Frequency by Award Year for Companies Still Expecting Sales, 1992-2001.
|
Award Year |
Number of Projects |
Elapsed Years between Award and Survey |
Historical Success (%) |
|
1992 |
1 |
13 |
0.0 |
|
1993 |
3 |
12 |
0.0 |
|
1994 |
3 |
11 |
0.0 |
|
1995 |
3 |
10 |
0.0 |
|
1996 |
3 |
9 |
0.9 |
|
1997 |
13 |
8 |
0.4 |
|
1998 |
12 |
7 |
1.3 |
|
1999 |
20 |
6 |
3.6 |
|
2000 |
19 |
5 |
7.6 |
|
2001 |
18 |
4 |
11.6 |
|
NOTE: The results are calculated as follows: Y= time elapsed between date of award and date of NRC Survey); D = 100-sum of percentages from Table 4-2 column three for that number of elapsed years (e.g., for four elapsed years, the sum = sum (all years up to and including 4) = 100; 86.2 percent = 13.8 percent. SOURCE: NRC Phase II Survey. |
|||
and then declining as the product is overtaken in the marketplace. As the bulk of responses to all surveys tend to be concentrated among more recent awards, the “snapshot” in aggregate may therefore be focused on the early ramp up stage.
This hypothesis is supported by recent data from NIH, where the 2002 survey was followed up in 2005. During this period, the percentage of firms with sales increased from 47 percent to 63 percent, and the estimated aggregate sales doubled, to approximately $1.6 billion.6 None of this subsequent sales growth could be captured during the initial 2002 survey, and we would expect to see a similar trajectory for the NRC survey completed in 2005.
4.2.2.3
Imminent Sales
While the analysis above shows that claims of future sales can be regarded with some caution, focusing attention on imminent sales—those expected to be made within the next 18 months—may provide a more reliable metric, and case studies indicate that company managers have a better understanding of the near future markets for their products.
The NRC Phase II Survey asked firms winning SBIR Phase II awards to estimate the approximate amount of total sales resulting from the technology
developed during the project expected over the next 18 months, by the end of FY2006.
Of the 496 survey recipients, 225 (45.4 percent) anticipated sales within the next 18 months. The overall mean amount of anticipated sales was $559,622. On average, companies without sales to date that anticipated any sales over the 18-month period estimated an average of $1,233,656 in anticipated sales. However, this figure may be optimistic: Less than 30 percent of the projects that reported existing sales claimed that they have had sales of at least this magnitude.
4.2.2.4
Sales by Industry
Do the data show differences in commercialization by industry sector? Based on the NIH Survey (which asked for the primary customer base) Table 4-4 shows that four industry groups (biotechnology, information and research, instrumentation, and medical devices) account for 77 percent of the 205 projects reporting sales.
However, this data set needs to be adjusted to account for the number of respondents in each industry group. Figure 4-5 provides average sales per respondent, by industry. It shows that information and research, and health care provide average sales about twice the amount of other leading sectors. NIH might wish to consider further what makes projects in some sectors more commercially successful than others—and might even consider whether shifting SBIR resources toward those more successful sectors might be warranted.
4.2.2.5
Sales by Size of Company (Employees)
Do commercialization results vary with the number of employees at the time of the award? Although none of the agencies currently gather data about company size during the application process itself, size may be an important predictor of commercial success. Data in Table 4-5 show that there are differences by size of company.
Firms with 10 employees or less account for 41.5 percent of respondents, and 50 percent of projects with some sales but less than $1 million. Firms with 11-25 employees account for 28.3 percent of respondents, 27.2 percent of sub-$1 million returns, and 35.4 percent of respondents with sales of more than $1 million and less than $50 million.
The comparison above shows that companies with no more than 75 employees consistently outperform companies with more than 75 employees in terms of the percentage of projects that generate sales. The former group of companies account for 76.6 percent of respondents to the NRC survey, but 86.1 percent of all projects with sales.
In fact, the “sweet spot” by size is concentrated around 20 employees: com-
TABLE 4-4 Sales—By Industry Sector
|
Industry |
Number of Sales by Industry, by Size |
Grand Total |
|||||||
|
MISSING |
<$50,000 |
>$50K-<$100K |
$100K-<$500K |
$500K-<$1M |
$1M-<$5M |
$5M-<$50M |
$50M+ |
||
|
Biotechnology |
3 |
8 |
2 |
11 |
5 |
7 |
6 |
|
42 |
|
Chemical technology |
1 |
1 |
2 |
3 |
2 |
1 |
1 |
|
11 |
|
Computer hardware, software |
2 |
7 |
4 |
8 |
2 |
11 |
|
|
34 |
|
Diagnostics |
|
1 |
1 |
4 |
|
1 |
1 |
|
8 |
|
Environment, ergonomics |
1 |
1 |
|
4 |
|
|
|
|
6 |
|
Health care |
1 |
|
2 |
1 |
1 |
|
3 |
|
8 |
|
Information & research |
|
|
2 |
|
1 |
|
4 |
|
7 |
|
Instrumentation |
1 |
|
2 |
17 |
3 |
7 |
3 |
|
33 |
|
Medical devices |
6 |
6 |
2 |
4 |
9 |
11 |
4 |
1 |
43 |
|
Medical education, health promotion |
4 |
11 |
2 |
6 |
3 |
1 |
|
|
27 |
|
Other |
|
|
|
1 |
1 |
|
|
|
2 |
|
Pharmaceuticals |
|
|
|
|
|
3 |
|
|
3 |
|
Grand Total |
19 |
35 |
19 |
59 |
27 |
42 |
22 |
1 |
224 |
|
|
19 |
35 |
19 |
59 |
27 |
159 |
22 |
1 |
|
|
SOURCE: National Institutes of Health, National Survey to Evaluate the NIH SBIR Program: Final Report, July 2003. |
|||||||||
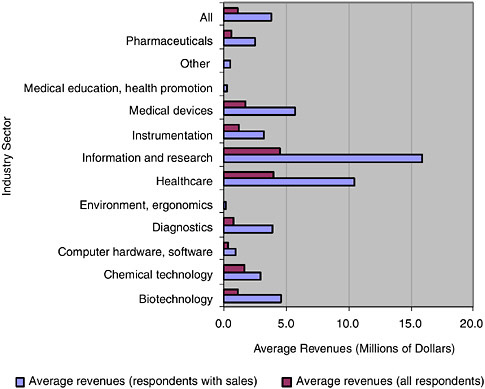
FIGURE 4-5 Per respondent sales, by industry sector (millions of dollars).
SOURCE: National Institutes of Health, National Survey to Evaluate the NIH SBIR Program: Final Report, July 2003, NRC estimates.
panies with 11-30 employees accounted for 20.8 percent of respondents, but 31.7 percent of projects with sales.
4.2.2.6
SBIR-only Focus
One question about the role of the SBIR program concerns the extent to which simply acquiring SBIR awards can substitute for further commercial activity. As shown in Table 4-6, some companies’ revenues are made up largely of SBIR awards, but the percentage reliance on SBIR awards tend to decline as the size of the company grows.
The data show responding firms’ current SBIR focus and current revenue, which may of course be quite different from that during the time period of the SBIR. Very small companies that won SBIRs in the past may not now have one (hence the 31 companies with zero revenues and zero SBIR focus).
Despite these caveats, the data confirm that as companies get larger, their
TABLE 4-5 Sales by Company Size
|
Employees |
Sales ($) |
Percent |
||||
|
<1M |
>1M to <5M |
>5M to <50M |
>50M |
Total |
||
|
0-5 |
39 |
3 |
1 |
|
43 |
21.3 |
|
6-10 |
35 |
6 |
|
|
41 |
20.3 |
|
11-15 |
15 |
7 |
6 |
|
25 |
12.4 |
|
16-20 |
16 |
1 |
2 |
|
18 |
8.9 |
|
21-25 |
9 |
4 |
2 |
|
14 |
6.9 |
|
26-30 |
6 |
1 |
|
|
7 |
3.5 |
|
31-40 |
2 |
5 |
5 |
|
10 |
5.0 |
|
40-50 |
6 |
1 |
1 |
|
8 |
4.0 |
|
51-75 |
3 |
3 |
2 |
|
7 |
3.5 |
|
76-100 |
|
1 |
|
|
1 |
0.5 |
|
100-200 |
6 |
2 |
2 |
1 |
11 |
5.4 |
|
201-300 |
1 |
|
1 |
|
2 |
1.0 |
|
301-500 |
2 |
1 |
|
|
3 |
1.5 |
|
500+ |
1 |
2 |
|
|
3 |
1.5 |
|
Missing |
6 |
2 |
1 |
|
9 |
4.5 |
|
Total |
147 |
39 |
23 |
1 |
202 |
100.0 |
|
Percentage |
72.8 |
19.3 |
11.4 |
0.5 |
100.0 |
|
|
SOURCE: NRC Phase II Survey. |
||||||
reliance on SBIR funds tends to decline. Of the 38 companies with at least $5 million in revenues, 30 (78.9 percent) reported no more than a 10 percent focus on SBIR. Conversely, of the 102 firms reporting at least 76 percent focus on SBIR, 100 reported annual firm revenues of no more than $1 million.
4.2.2.7
Licensing Revenues
Up to this point, we have focused on sales and licensing revenues accruing to the respondent. However, it is possible that licensing has some kind of multiplier effect by providing the licensee with a critical piece of technology. This could potentially create a substantially larger commercial impact than is captured in the direct sales data of the licensor, and this larger impact would be based on technologies developed with SBIR funding.
Licensing revenues constitute a fairly small fraction of overall sales: The $32,664,380 in licensing revenues reported by NRC respondents constitutes 8.8 percent of all reported revenues. Only a small fraction of SBIR grantees generate substantial revenues from licensing.
This suggests that few companies can rely on licensing alone as a means of generating significant revenues, even though case studies indicate that some companies—and possibly many smaller SBIR recipients without manufacturing capabilities—have business plans that depend on licensing revenues.
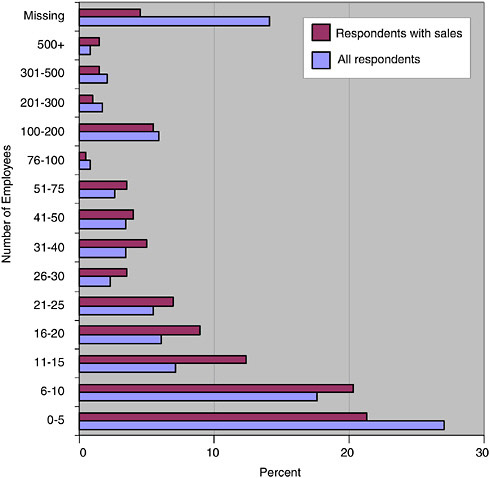
FIGURE 4-6 Distribution of companies by number of employees.
SOURCE: NRC Phase II Survey.
Beyond the firm receiving the award, licensing creates opportunities for the licensee, and the NRC Phase II Survey attempts to quantify how some companies capitalize on this opportunity. It should be borne in mind that these responses are from the licensor company, and may not be an accurate picture of licensee activity.
As with direct sales data, the responses shown in Table 4-8 suggest that a large majority of licensee sales are less than $1 million, and that there are only a few very large responses.
Total sales reported for licensees as $336,677,403. Of this, $324,588,050 (96.4 percent) came from the eight responses (2 percent of all projects responding) reporting at least $5 million in licensee sales. These data indicate that licensing revenues are much more concentrated in a handful of respondent companies
TABLE 4-6 Firm Revenues by Percentage Dependence on SBIR
|
Firm Revenues ($) |
Percent of Firm Revenues that Come from SBIR (Number of responses in each percent range) |
Total |
|||||
|
0 |
1-10 |
11-25 |
26-50 |
51-75 |
76-100 |
||
|
0 |
31 |
41 |
2 |
2 |
2 |
14 |
61 |
|
<100K |
12 |
15 |
7 |
16 |
14 |
29 |
81 |
|
100K-<500K |
10 |
16 |
7 |
9 |
18 |
25 |
75 |
|
500K-<1M |
28 |
33 |
17 |
28 |
21 |
32 |
131 |
|
1M-<5M |
13 |
26 |
3 |
10 |
20 |
2 |
61 |
|
5M-<20M |
2 |
21 |
5 |
2 |
2 |
0 |
30 |
|
20M-<100M |
0 |
3 |
0 |
1 |
0 |
0 |
4 |
|
100M+ |
2 |
2 |
0 |
0 |
0 |
0 |
2 |
|
SOURCE: NRC Firm Survey. |
|||||||
TABLE 4-7 Revenues from Licensing
|
$5M+ (Number of Respondents) |
2 |
|
$1M-<$5M (Number of Respondents) |
3 |
|
$1-<$1M (Number of Respondents) |
22 |
|
Total Dollars |
29,184,380 |
|
Average Dollars |
1,080,903 |
|
Average Dollars—All Respondents |
58,839 |
|
SOURCE: NRC Phase II Survey. |
|
TABLE 4-8 Sales by Licensees, as Reported by Licensor Respondents
|
Revenues Reported for Licensee ($) |
Number of Responses |
|
<1M |
39 |
|
1M-<5M |
5 |
|
5M-<50M |
5 |
|
50M+ |
3 |
|
SOURCE: NRC Phase II Survey. |
|
than direct company sales revenues (discussed earlier in this chapter). Note that respondents indicate three licensees with revenues of more than $50 million. This compares with only one such claim for the responding projects themselves.
Despite the apparent difficulties in generating substantial revenues from licensing, the latter may be the most realistic method of commercializing a product for some companies because, as noted above, small companies may not have the manufacturing, marketing, or distribution resources to effectively sell their own innovations. (See Box 4-5).
|
BOX 4-5 Applied Health Science and the Wound and Skin Intelligence System™ orWSIS™ The purpose of the Applied Health Science’s (AHS) early SBIR grant work was to validate and automate a standardized assessment instrument (the Pressure Sore Status Tool, originally authored by Dr. McNees’ (Dr. McNees is CEO/Chief Scientists for Applied Health Sciences) colleague, Dr. Barbara Bates-Jensen) for use in field settings for describing and tracking status changes in chronic wounds (e.g., pressure ulcers). The WSIS (Wound and Skin Intelligence System (tm) or WSIS(tm)) provides clinicians with the ability to assess risk and request a “case specific” prevention plan for reducing the probability that a wound will develop. The system tracks prevention and treatment outcomes over time and relates these outcomes to individual risk and wound profiles and interventions employed. Thus, the system has the capacity to “learn” from its own experience. The product was commercialized through the sale of rights to ConvaTec, a wholly owned unit of Bristol Myers-Squibb and the largest wound products company in the world. ConvaTec provided Phase III funding leading to commercialization. In exchange, it received a right-of-first-refusal for licensing the system, which it subsequently executed. This merged AHS technology and research capabilities with ConvaTec’s marketing power—reflected in its presence in about 80 countries world-wide. ConvaTec subsequently bought all rights to the software. AHS retained the worldwide data “pipelines”, and analytical functions. AHS also has a right-to-first-review for any elaborations of or changes to the system. AHS has announced current projections of $30 million in annual sales from the U.S. market, and expects to add one employee for each 75 users of the system. AHS and ConvaTec are also forming a series of strategic alliances with companies prepared to supply or develop add-on capabilities (e.g., a telemedicine home health company in Chicago and a long-term care claims processing company in Nashville). The sale of technology rights to ConvaTec funded further development, situated AHS strategically where it wanted to be—focused on research and data analysis, not marketing—and took advantage of each partner’s strategic strengths. |
4.2.2.8
Additional Investment Funding
Further investment in an SBIR project may be further—though by no means sufficient—evidence that the work is of value, at least to the funding party. About 37 percent of NIH Survey companies received some funding other than further SBIR awards, although the NIH Survey did not ask about amounts of investment.
The NRC data differ from the DoD and NIH data in that its respondents reported a higher likelihood of their projects attracting third-party funding other than SBIR.
According to Table 4-9, a substantial number—23-58 percent—of NIH SBIR projects have been able to attract additional funding. A much smaller number—4-9 percent—have been able to attract at least $1 million in additional funding.
A more detailed comparison of the NRC and DoD data is contained in Table 4-10.
The NRC survey reports much stronger further investment than does the DoD database of NIH awards—the average investment per respondent was about $1 million, compared with about $250,000 for the DoD-reporting companies. Fourteen companies—about 7 percent of those reporting investments—received at least $5 million.
Once again, though to a somewhat lesser degree than for sales, investments are heavily concentrated in the few companies receiving substantial investments. The 14 companies with more than $5 million in investments accounted for a total of $383.5 million (76.3 percent) of all investments.
4.2.2.9
Sources of Investment Funding
The NRC Phase II Survey also sought information about the source of third-party funding. Table 4-11 contains the first detailed data on sources of additional
TABLE 4-9 Additional Investment/Funding other than SBIR
|
Any Investment |
Investment >$1M |
||||
|
|
Number of Responses |
Percentage |
|
Number of Responses |
Percentage |
|
NRC Survey |
|
|
NRC Survey |
|
|
|
No |
193 |
42.2 |
No |
416 |
91.0 |
|
Yes |
262 |
57.8 |
Yes |
41 |
9.0 |
|
Total |
457 |
100.0 |
Total |
457 |
|
|
DoD Data |
|
|
DoD Data |
|
|
|
No |
721 |
76.6 |
No |
901 |
95.7 |
|
Yes |
220 |
23.4 |
Yes |
40 |
4.3 |
|
Total |
941 |
|
Total |
941 |
|
|
NIH Survey |
|
|
NIH Survey |
|
|
|
No |
487 |
63.4 |
Not available.* |
|
|
|
Yes |
281 |
36.6 |
|
|
|
|
Total |
768 |
|
|
|
|
|
NOTE: (*) The NIH Survey did not ask respondents how much funding had been provided, only whether there had been some amount of further non-SBIR funding, as well as the sources of the funding. SOURCE: NRC Phase II Survey, DoD commercialization database, and National Institutes of Health, National Survey to Evaluate the NIH SBIR Program: Final Report, July 2003. |
|||||
TABLE 4-10 Further Investments in SBIR Projects
|
|
Number of Investments by Size of Investment |
Total Investment by Size of Investment |
||
|
DoD Data |
NRC Survey |
DoD Data |
NRC Survey |
|
|
$50M+ |
1 |
3 |
77,000,000 |
203,600,000 |
|
$5M-<$50M |
3 |
11 |
32,329,122 |
179,979,409 |
|
$1M-<$5M |
36 |
37 |
80,492,819 |
77,691,224 |
|
<$1M |
180 |
202 |
38,637,715 |
40,699,881 |
|
None |
721 |
243 |
0 |
0 |
|
Total investments |
220 |
253 |
228,459,656 |
501,970,514 |
|
Percent of all respondents |
24.4 |
51.0 |
|
|
|
Average (all) |
|
|
253,562 |
1,012,037 |
|
Average (with investment) |
|
|
1,038,453 |
1,984,073 |
|
SOURCE: NRC Phase II Survey, DoD Commercialization Database. |
||||
funds for NIH SBIR-funded projects. As expected, venture funding provided both the largest total amount of additional support ($155 million), and also the largest average support per project funded ($10.3 million). However, venture funding supported only 15 projects—less than 4 percent of all responses.
Conversely, internal funding was by far the most widespread form of support, being reported by almost 50 percent of all respondents. Average funding was much lower, at $437,000 per project.
Investments from government and academic sources were relatively few in number (less than 8 percent of the total) and relatively small in amount on a per project basis.
TABLE 4-11 Sources of Investment Funding
|
Source of Investment |
Total Investment ($) |
Percent |
Number of Investments |
Percent |
Average Investment ($) |
|
Private Investment from U.S. Venture Capital |
154,617,045 |
33.9 |
15 |
3.9 |
10,307,803 |
|
Private Investment from other Private Equity |
141,992,212 |
31.1 |
40 |
10.4 |
3,549,805 |
|
Private Investment from Foreign Investment |
39,616,075 |
8.7 |
12 |
3.1 |
3,301,340 |
|
Private Investment from other Domestic Private Company |
21,624,866 |
4.7 |
31 |
8.1 |
697,576 |
|
Your Own Company |
82,118,851 |
18.0 |
188 |
49.1 |
436,802 |
|
State or Local Government |
6,290,000 |
1.4 |
23 |
6.0 |
273,478 |
|
Personal Funds |
9,850,408 |
2.2 |
67 |
17.5 |
147,021 |
|
College or Universities |
236,500 |
0.1 |
7 |
1.8 |
33,786 |
|
Total |
456,345,957 |
100.0 |
383 |
100.0 |
1,191,504 |
|
SOURCE: NRC Phase II Survey. |
|||||
TABLE 4-12 Most Important Source of Non-SBIR Funding
|
|
Number of Responses |
Percent |
|
None |
487 |
|
|
Non-SBIR federal funds |
19 |
6.8 |
|
Your own company |
85 |
30.6 |
|
Other private company |
61 |
21.9 |
|
U.S. venture capital |
22 |
7.9 |
|
Foreign venture capital |
3 |
1.1 |
|
Private individual investor |
37 |
13.3 |
|
Personal funds |
22 |
7.9 |
|
State or local government funds |
15 |
5.4 |
|
College or university |
5 |
1.8 |
|
Other |
5 |
1.8 |
|
Foundations |
4 |
1.4 |
|
|
278 |
100.0 |
|
SOURCE: National Institutes of Health, National Survey to Evaluate the NIH SBIR Program: Final Report, July 2003. |
||
The NIH Survey generated responses approximately in line with those from the NRC Phase II Survey. Personal and in-house corporate funds accounted for 20.2 percent of the total funding reported, with other private companies providing another 4.7 percent. It appears that VC funding is underreported: About 40 percent of companies identified by NRC as having received VC funding responded to the NIH Survey as having done so.7
However, neither the NIH Survey nor the NRC Phase II Survey align well with a third source of information on further investment—data from venture capital databases.8 Though reported in more detail in that section our analysis indicates that of the top 200 Phase II award winners at NIH, 50 received venture funding (see Figure 4-7).
We have identified a total VC investment of approximately $1.59BN in these 50 companies, a total that dwarfs the $272 million investment in these companies via the NIH SBIR program.
There are four particularly striking findings regarding the data on external funding:
-
Sixty-five percent of all respondents reported no additional funding for their project. Thus, in terms of the external funding indicator only, about two-thirds of all projects did not commercialize.
-
Venture capital funding was of mixed importance, accounting for only
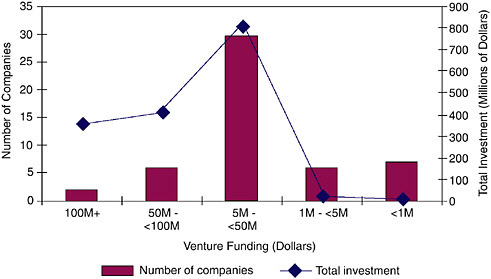
FIGURE 4-7 Venture funding for NIH Phase II winners.
SOURCES: VentureSource and other VC databases; NIH awards database.
-
3.5 percent of all investments, but almost 30 percent of investments by value.
-
The amount of state and local funding provided was small, providing funding for 5.4 percent of projects with funding, or no more than 2.5 percent of all NIH respondents. By contrast, more than half of all respondents received additional SBIR funding related to the project (see below).
-
In fact, on the basis of additional funding alone, it is fair to conclude that SBIR provided additional funding to more projects than did all other sources of additional funding combined.
4.2.2.10
SBIR Impact on Further Investment
Both the NIH and NRC surveys sought additional information about the impact of the SBIR program on company efforts to attract third-party funding. This “halo effect” was mentioned by some case study interviewees who suggested that an SBIR award acted as a form of validation for external inventors.
Case study interviews provided mixed views on this. Some interviewees strongly supported the view that SBIR helps to attract investment; others claimed that the effect was not that important. This is to be expected insofar as two-thirds of SBIR respondents did not attract outside funding, and only 3.5 percent received venture funding. This suggests that SBIR awards do not in themselves guarantee further external funding.
Survey responses, however, painted a more positive picture of these effects: 69 percent of NIH survey respondents said that the SBIR award had helped them in their efforts to raise additional capital (although only 29 percent reported actually received additional capital). Of the NIH grant recipient respondents that did receive additional funding other than SBIR, 78 percent agreed that this “resulted from” their SBIR participation.
4.2.2.11
Additional SBIR Funding
Aside from third-party investment, the federal government in many cases makes further investments via the SBIR program itself. Both the NIH Survey and NRC Phase II Survey attempted to determine how many additional SBIR awards followed each initial award (see Table 4-13).
Both surveys suggest that over one-third of grant recipients receive at least one additional related Phase II award. Approximately 14 percent of respondents reported receiving at least two additional awards, but as one might expect given the skew in results, and the competition for awards, two-thirds of respondents report no additional related SBIR awards at all.
4.2.2.12
Employment Effects
Employment resulting from the Phase II project is another indicator of commercialization. It is also an indirect indicator of the SBIR program’s support for small businesses.
TABLE 4-13 Related Phase II SBIR Awards
As shown by Figure 4-8, the median size of companies receiving SBIR awards is relatively small—far lower than the 500 employee limit imposed by the SBA. The median size of grant recipient companies is 10 employees, and 60 percent of respondent companies had 15 employees or fewer at the time of the survey.
However, while the median size of grant winners is small, and most awardees have 20 or fewer employees, employment is skewed across company size. Total reported employment at the 319 companies is 15,467.5 full-time equivalent employees (FTEs), but 8,090 (52 percent) of those FTEs work for the top ten companies—and three of those companies are no longer eligible for SBIR awards because they employ more than 500 persons.
These results broadly match the data from the NIH Survey, which also shows that most employment is concentrated in the larger companies (Figure 4-9).
4.2.2.12.1
Employment Gains
The NRC Phase II Survey sought detailed information from respondents about the number of employees they had at the time of the award, the number of employees they had at the time of the survey, and the direct impact of the award on their employment levels. Overall, it showed that the mean employment gain at each responding firm since the date of its SBIR award was 29.9 FTEs. In addition, respondents estimated that as a result of their SBIR projects their companies were, on average, able to hire 2.7 FTE employees, and to retain 2.2 FTE existing
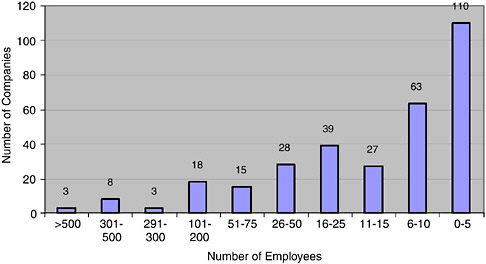
FIGURE 4-8 Distribution of companies, by employees.
SOURCE: NRC Phase II Survey.
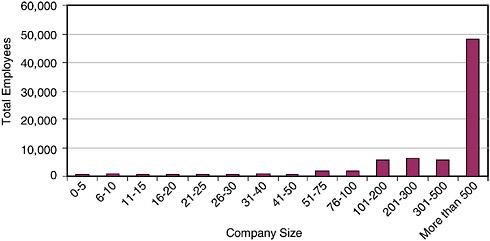
FIGURE 4-9 Employment at SBIR companies, by company size.
SOURCE: National Institutes of Health, National Survey to Evaluate the NIH SBIR Program: Final Report, July 2003.
employees that might not otherwise have been retained.9 Case study interviewees noted that a Phase II award typically provides direct funding equivalent to the addition of slightly more than one full-time researcher plus overhead for two years.
The NRC Phase II Survey results show that the median post-award change in employment was 27.5 FTE employees. Companies that expanded their workforce rapidly pulled the mean employment change up much higher than the median. One company grew by 3,700 employees after receiving the surveyed SBIR award.
In the NIH Survey, 94 percent of respondents claimed that they had increased staff as a direct result of the SBIR award, although the survey did not ask about the size of employment gain.
4.2.2.13
Sales of Equity and other Corporate-level Activities
The NRC Phase II Survey explored several ways in which equity-related activities might be finalized or underway at surveyed projects (see Table 4-14). The data show that marketing-related activities were most widespread, with marketing/distribution agreements related to 33.9 percent of projects, and licensing agreements to 38.1 percent. Agreements likely to involve the direct transfer of equity—mergers (3.2 percent), partial sales of the company (6.5 percent), and complete sales of the company (5.0 percent)—were much less widespread. Note,
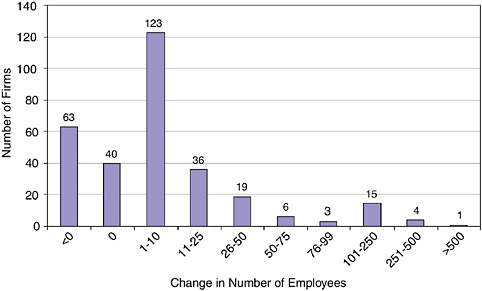
FIGURE 4-10 Employment change at firms since SBIR Phase II.
SOURCE: NRC Phase II Survey.
TABLE 4-14 Equity- and Marketing-related Activities Stemming from the Surveyed SBIR Project
|
Activities |
U.S. Companies/Investors |
Foreign Companies/Investors |
||||
|
Done (%) |
Under way (%) |
Total (%) |
Done (%) |
Under way (%) |
Total (%) |
|
|
Licensing agreement(s) |
19 |
16 |
35 |
9 |
6 |
15 |
|
Sale of company |
1 |
4 |
5 |
0 |
1 |
1 |
|
Partial sale of company |
2 |
4 |
6 |
0 |
1 |
1 |
|
Sale of technology rights |
6 |
7 |
13 |
1 |
1 |
2 |
|
Company merger |
0 |
3 |
3 |
0 |
1 |
1 |
|
Joint venture agreement |
3 |
9 |
12 |
1 |
3 |
4 |
|
Marketing/distribution agreement(s) |
21 |
10 |
31 |
12 |
6 |
18 |
|
Manufacturing agreement(s) |
7 |
4 |
11 |
2 |
2 |
4 |
|
R&D agreement(s) |
15 |
11 |
26 |
4 |
3 |
7 |
|
Customer alliance(s) |
8 |
10 |
18 |
3 |
1 |
4 |
|
Other |
2 |
2 |
4 |
0 |
1 |
1 |
|
SOURCE: NRC Phase II Survey. |
||||||
however, that the question asked specifically for outcomes that were the “result of the technology developed during this project”10—a very tight, and limiting, description for activities that occur at the level of the company, not the project.
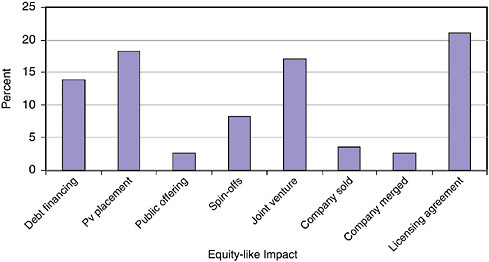
FIGURE 4-11 Equity-like impacts.
SOURCE: National Institutes of Health, National Survey to Evaluate the NIH SBIR Program: Final Report, July 2003.
Activities with foreign partners were substantially less common than similar activities with U.S. partners. Once again, marketing-related activities were the most widespread.
Similar results were found from the NIH Survey. Figure 4-11 shows the percentage of NIH respondents who agreed that the specific outcome in question had occurred “because of the product, process, or service developed during this project”11
In addition, the NRC Firm Survey determined that three firms with NIH SBIR awards had had initial public offerings, and that a further three planned such offerings for 2005/2006. Seventy-five out of 445 companies (16.9 percent) had established one or more spin-off companies. This percentage is slightly higher than that for all SBIR companies at all agencies during the study timeframe. NIH-related firms accounted for 126 spin-offs, approximately 52 percent of all spin-offs reported.
The impact of these activities on commercialization, on the spread of biomedical knowledge, and on small businesses is hard to gauge using quantitative assessment tools only. The case study in Box 4-6 illustrates how research conducted using SBIR funding seeded an entire generation of spin-off companies and joint ventures based on a technology of potentially critical significance for homeland security.
|
BOX 4-6 Intelligent Optical Systems Distributed, sensitive chemical and biochemical sensors and sensor networks Intelligent Optical Systems (IOS) has developed a system for using the entire length of a specially-designed fiber-optic cable as a senor for the detection of toxins and other agents. This bridges the gap between point detection and standoff detection, making it ideal for the protection of fixed assets. SBIR-supported research has been followed by a focus on the development of subsidiaries and spin-offs at IOS. This activity has generated private investments of $23 million in support of activities oriented toward the rapid transition to commercially viable products. Since January 2000, IOS has formed two joint ventures, has spun out five companies to commercialize various IOS proprietary technologies, and has finalized licensing/technology transfer agreements with companies in several major industries. Optimetrics manufactures and markets active and passive integrated optic components based on IOS-developed technology for the telecommunication industry. Maven Technologies was formed to enhance and market the Biomapper technologies developed by IOS. Optisense manufactures and distributes gas sensors for the automotive, aerospace, and industrial safety markets, and will be providing H2 and O2 optical sensor suites designed to enhance the safety of NASA launch operations. OSS, which is IOS’s newest spin-off company, was formed to commercialize chemical sensors for security and industrial applications. The company currently employs 40 scientists, and its current sales mix is almost 80 percent non-SBIR business. IOS currently holds 13 patents, with an additional 13 applications pending. |
4.2.2.14
Commercialization and FDA Approval
One final metric is relevant in considering commercialization at NIH: the number of projects that seek and receive FDA approval.
Of the projects surveyed, 20 percent reported that the product they were developing would require FDA approval. Table 4-15 shows the stages of FDA approval that the projects had reached. This data set is comparable to that from the NIH survey, which asked similar questions (see Figure 4-12). NIH data also allow us to review FDA approval stage by industry. (See Table 4-16.)
NIH has recently provided additional data on FDA approval, tracking the same population of projects 3 years later. These data indicate that there has been some increase in meeting FDA milestones. (See Table 4-17.)
These data show that the number of approvals had increased to 60 or 7.8 percent of the projects originally selected for survey. A further 25 (3.1 percent) have reached the intermediate milestone of approval for clinical trials. No data
TABLE 4-15 FDA Approval
|
Approval Stage |
Percent of Responding Projects which Require FDA Approval |
|
Applied for approval |
5.0 |
|
Review ongoing |
3.0 |
|
Approved |
38.5 |
|
Not approved |
6.5 |
|
IND: Clinical trials |
16.0 |
|
Other |
32.0 |
|
SOURCE: NRC Phase II Survey. |
|
are available on the number of projects that would have required FDA approval before they can reach the market.
Further analysis is required to determine whether projects focused on products that will require FDA approval consistently commercialize more or less successfully than others. These data also have implications for the recent NIH Competing Continuation Awards (CCA) SBIR initiative, described in Chapter 3. The CCA aims to support companies through the FDA approval process.
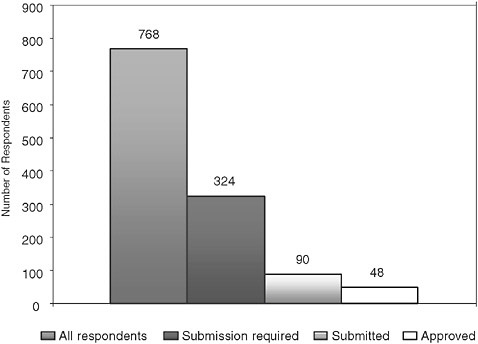
FIGURE 4-12 NIH data on FDA approval stage.
SOURCE: National Institutes of Health, National Survey to Evaluate the NIH SBIR Program: Final Report, July 2003.
TABLE 4-16 FDA Approval Requirements by Industry
|
Business Type |
FDA Approval Required |
All Respondents |
Percent Requiring FDA Approval |
|
Pharmaceuticals |
47 |
58 |
81.0 |
|
Medical devices |
102 |
145 |
70.3 |
|
Biotechnology |
87 |
175 |
49.7 |
|
Diagnostics |
21 |
43 |
48.8 |
|
All Respondents |
323 |
767 |
42.1 |
|
Other |
5 |
12 |
41.7 |
|
Instrumentation |
31 |
88 |
35.2 |
|
Chemical technology |
6 |
20 |
30.0 |
|
Health care |
5 |
21 |
23.8 |
|
Computer hardware, software |
14 |
85 |
16.5 |
|
Engineering, fabrication |
2 |
17 |
11.8 |
|
Environment, ergonomics |
1 |
13 |
7.7 |
|
Information and research |
1 |
25 |
4.0 |
|
Medical education, health promotion |
1 |
65 |
1.5 |
|
SOURCE: National Institutes of Health, National Survey to Evaluate the NIH SBIR Program: Final Report, July 2003. |
|||
4.2.2.15
Commercialization: Conclusions
The data described above support the view that there has been an effort to bring projects to market, with some measurable success. Even though the number of large (e.g., > $5M) commercial successes has been few, the overall commercialization effort is substantial. Of the 40 percent of surveyed projects that had already reached the market, more than half did so within two years of the project start date. More than one-third of projects received additional outside funding, and 32.5 percent received additional related SBIR awards. These summary statistics support a conclusion that many award recipients are commercializing their products, services, and processes.
TABLE 4-17 FDA Milestones Updated to 2007
|
|
Number of Projects |
|||||
|
2002 Survey |
2004 Update |
January 2005 Update |
August 2005 Update |
March 2007 Update |
Total Unique Projects Approved |
|
|
FDA approval received |
48 |
9 |
2 |
0 |
|
60 |
|
FDA approval for clinical trials, IND |
11 |
0 |
7 |
7 |
1 |
25 |
|
TOTAL |
59 |
9 |
9 |
7 |
1 |
85 |
|
SOURCE: National Institutes of Health, National Survey to Evaluate the NIH SBIR Program: Final Report, July 2003. |
||||||
|
BOX 4-7 The NIH Mission The NIH mission is science in pursuit of fundamental knowledge about the nature and behavior of living systems and the application of that knowledge to extend healthy life and reduce the burdens of illness and disability. |
4.3
AGENCY MISSION
NIH’s primary mission is improving public health through the development and application of knowledge.
However, measuring the impact of the NIH SBIR program on public health is extremely difficult. By the time the results of SBIR research become part of the health care system, they are deeply intertwined with other inputs, making measurement difficult. And as with commercial outcomes, data collection is a serious problem.
The data provided below, and the cases used to explicate the data, are therefore to be understood as an effort to answer a question for which no conclusive data exist. Instead, we offer a series of efforts to provide indirect evidence about support for agency mission in the NIH SBIR program.
4.3.1
Targeted Populations
One way to evaluate the support provided by SBIR to the agency mission is to assess the populations targeted by SBIR projects, and the NIH Survey seeks to do so. Figure 4-13 shows the distribution of projects by size of affected population for (a) projects reported to have reached the market and be in use, and (b) those projects still in commercialization. Projects still in earlier stages of development or discontinued have been filtered out. Note that percentages do not add up to 100 percent, as respondents were permitted to select more than one affected population.
Quantifying the impact that the products in use have on the affected populations is however problematic for at least two reasons.
First, the distribution of products across user groups does not measure the intensity of the benefit received from use. A product that reduces the incidence of hangnails in a potential population of 150,000,000 has a different impact than a product which saves the lives of 1 percent of heart attack victims annually—4,944 people.12
|
12 |
Heart attack data for 2004 from American Heart Association <http://www.americanheart.org/presenter.jhtml?identifier=4591>. |
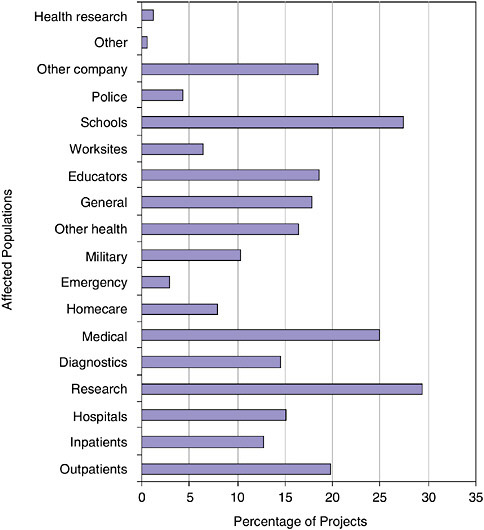
FIGURE 4-13 Distribution of projects, by type of affected population.
SOURCE: National Institutes of Health, National Survey to Evaluate the NIH SBIR Program: Final Report, July 2003.
Second, many impacts from products are indirect. Medical technology improvements often affect final populations only through a long causal chain, sometimes through indirect effects such as improvements in the efficiency with which the user operates. Chatten Associates, for example, successfully used SBIR to fund technology that automated the review of videotapes used to monitor epileptic patients for seizures. Previously, videos were reviewed manually by nurses, which took many hours of work for each 24-hour tape. By linking the monitoring system to an EEG, and automatically picking up anomalies, the Chat-
ten technology reduced the amount of time spent by nurses reviewing a 24-hour tape from hours to minutes. This dramatic reduction had no obvious impact on epileptic patients—but released nurses for hours of other work. It is also worth noting that there are no data from Chatten or elsewhere on the numbers of nurses affected by the product.
Thus, while we acknowledge the NIH effort described below to quantify the impact of SBIR projects on public health, for both these reasons, it is probably misleading at best to draw solid conclusions from statistics of affected populations derived from untested company estimates.
The data categories themselves are somewhat general and difficult to distinguish from each other, and they provide only limited insight into the markets targeted by each project. The figure contains one surprise—the 27 percent of projects are targeted at schools. However, this result may partly reflect projects targeted at pediatric populations, which are not otherwise identifiable by respondents in the context of this survey.
These data cover projects with products both in use and in the commercialization stage. Figure 4-14 disaggregates the data, and shows that there are significant differences between the two groups. Companies with products in use are much less optimistic about the size of their affected population: Only 27.3 percent of respondents expected to affect at least 500,000 people, while 41.3 percent of respondents with projects still in development felt that they had such a large market.
Table 4-18 focuses on products in use, and distinguishes between “high-impact” projects affecting more than 500,000 users, and other projects.
There are some substantial differences between the distribution of projects among “all projects” and among the “high-impact projects. “All projects” are much more heavily focused on research labs (26.9 percent), and much less focused on medical practitioners and the general public. The table shows that there was some clustering of “high-impact projects” around services to medical practitioners and the general public.
4.3.2
Agency-identified Requirements and SBIR Contracts
At the agencies where the results of SBIR-funded research are purchased for in-agency use (primarily at DoD and NASA), the agency’s mission is closely identified with the procurement process. In general, these agencies’ SBIR programs support agency goals if the outputs produced by funded projects—weapons or spacecraft, for example—are eventually procured by the agency.
At NIH, in-house use is rare, as contracts account for only about 5 percent of all SBIR awards and the agency directly utilizes very few of its funded projects’ outputs.
Still, it is important to recognize that in some cases, the SBIR program has
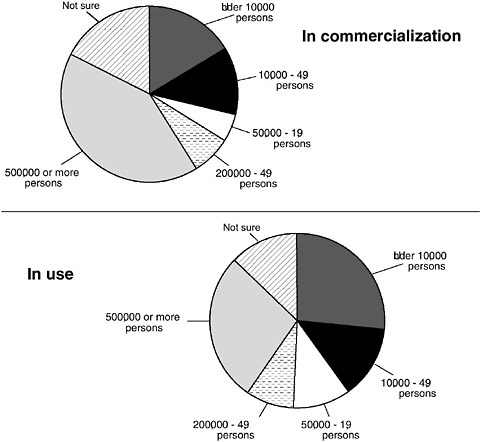
FIGURE 4-14 Distribution of projects by size of most important affected user population.
SOURCE: National Institutes of Health, National Survey to Evaluate the NIH SBIR Program: Final Report, July 2003.
generated outcomes that have been of direct use to the agency in fulfilling its mission. A case describing such an outcome is briefly described in Box 4-8.
4.3.3
Identifying Mechanisms for Supporting Public Health Through Qualitative Approaches
The cases completed by the research team, descriptions of successful projects collected by NIH, and interviews with NIH staff paint a complex picture of how SBIR activities can support the agency’s mission.
Table 4-19 identifies a number of ways in which SBIR has successfully supported the mission of NIH. SBIR companies have had significant beneficial
TABLE 4-18 High-impact Projects—By Target Sector
|
BOX 4-8 Celadon Laboratories, Inc. Multi-Method Software Platform for Primer and Probe Design At the National Cancer Institute’s (NCI) Core Genotyping Facility (<http://cgf.nci.nih.gov/home.cfm>), one critical bottleneck to high-throughput genotyping has been slow, tedious assay design that requires highly-trained personnel, which results in an unacceptably high assay failure rate. The ProbITy expert system developed by Celadon through SBIR has nearly eliminated that substantial bottleneck. As a result, the NCI expects to recoup the cost of the project within a year. |
TABLE 4-19 Mechanisms for Supporting Agency Mission (public health)
|
Educational impacts |
Standards |
|
Cost savings |
Knowledge pipeline |
|
Visionary research |
Technology platform development |
|
Niche products |
Geographical spread |
|
Deployment of public goods |
Collaborative technologies |
|
Agency technology needs |
Contracting and manufacturing |
|
Diversification and R&D |
|
effects in all of these areas, though these effects may not directly and obviously contribute to a substantial commercial success. This session discusses some of these areas, and the SBIR activities within them.
4.3.4
Education
NIH has long since recognized that education is a critical component of public health.13 About 10 percent of SBIR projects are targeted at the general public, and others are focused more tightly on health educators.14
Many education-developing companies work on a short product cycle, which allows SBIR project products to reach the market quickly and efficiently. Sociometrics, for example, has claimed that every one of its more than 20 SBIR awards has been directly translated into a product. Similarly, Morphonix has used SBIR funding to develop the award winning children’s video game described in Box 4-9.
4.3.5
Cost Savings
Given that health care expenditures have increased at more than twice the general rate of inflation for the past five years,15 and given that the subsequent competition for scarce health care dollars, projects that generate substantial cost savings are extremely important. However, the fragmented nature of health care markets, and the disconnect between health care patients and health care funding, mean that incentives in this sector are sometimes perverse and the value of cost savings is not always reflected simply in sales data.
One powerful example of cost savings which are reflected only partly in official sales is provided by the case of Chatten Associates, outlined in Box 4-10.
4.3.6
Visionary and Long-term Research
Much policy attention has been focused on the need for measurable outputs from the SBIR program. Yet it is also important to see that the program has been used to support very high quality projects that have large long-term potential pay-offs but a high chance of technical failure.
It is sometimes difficult to distinguish such visionary research from simple failures (projects that have not yet and will never generate any useful commercial outcomes or other important effects). Yet, by looking at individual cases, this
|
13 |
All the larger ICs and most of the smaller one’s have specific components dedicated to health care education. E.g., the Health Education Programs at the National Institute of Diabetes and Digestive and Kidney Diseases (NIDDK) at <http://www.niddk.nih.gov/health/edu.htm>. |
|
14 |
Data in this section are derived, unless otherwise noted, from the NIH Survey. |
|
15 |
Statistical Abstract of the United States 2007, Table 118, <http://www.census.gov/compendia/statab/health_nutrition/health.pdf>. |
|
BOX 4-9 Morphonix, Inc. Journey into the Brain Journey into the Brain is CD-ROM adventure game for children. It is marketed as both a consumer product for 11-14 year olds and a supplemental learning program for middle schools. Morphonix notes that the purpose of the game “is not just to teach about the brain, but to find the fun inherent in the subject.” This kind of product may not generate huge commercial returns, but it may reach a large audience and have a substantial and perhaps long term impact. The evidence gathered by Morphonix suggests that the product:
Journey into the Brain has won many awards including: Best of Show, 1999 Best of the Northbay Awards; the 2000 National Parenting Publications Gold Award; All-Star Rating from Children’s Software Review; Finalist, 1999 Educational Title of the Year (The Academy of Interactive Arts and Sciences); and Finalist, Independent Games Festival at the 1999 Computer Game Developers Conference. Journey into the Brian was released in 1999, and has sold more than 36,000 copies. Many copies were sold to school systems and libraries, meaning that the product has reached a much greater number of final users. |
kind of project can be identified. One such case is SAM Technologies, of San Francisco.
4.3.7
Niche Products
Many companies working with the SBIR program are focused on small markets, where niche products can make a large difference to the lives of a small client group. Analogous to orphan drug research, projects like these are, according to economists, classic cases for government subsidy or support. One such case is the SmartWheels product created by a small company in Arizona (see Box 4-12).
Another example is the cancer informatics suite developed by Humanitas.
|
BOX 4-10 Chatten Associates/Telefactor Long Term Epilepsy Monitoring Facilities for long-term monitoring of serous epileptics in specialized facilities and hospitals were traditionally highly labor intensive. Patients would be recorded on synchronized EEG-video 24 hours per day, and nurses would then review the tapes visually by fast forwarding to find epileptic events. This process could take up to 6 hours per patient per day—a huge and expensive burden on highly trained nursing staff. Chatten worked to automate this process by processing the EEG as it was recorded, and creating a file which highlighted possible epileptic events. Because this occurred in real time, staff in the area could be alerted while an episode was in progress. The new approach reduced the 6 hours per day spent monitoring an epileptic patient down to a few minutes, providing significant cost savings. However, these technologies were typically embedded into larger systems, so independent sales did not capture their commercial impact. According to Dr. Chatten, the new technology provided the critical edge in the sale of larger integrated systems. There is no sales data available to suggest the number of nurses affected by this technology, the total amount of time saved, or even the amount of time saved per nurse. The evidence does suggest that this technology—which the company says was developed only because SBIR funding was available—must have released substantial resources for use elsewhere in the hospitals and facilities where it was used. The product’s estimated total sales of approximately $30 million (at $5-7,000 per unit) also shows that its use was widespread. |
The technology developed includes software for grading toxicity using a handheld computer, distance learning applications featuring searchable transcripts and audiovisual slide presentations, and an online document/proposal management system (<http://www.epanel.cc>). The suite is now distributed free over the Web by Humanitas—by definition generating zero revenues, but delivering value nonetheless in that the project has users.
4.4
SUPPORT FOR SMALL, WOMAN-OWNED, AND MINORITY BUSINESS
SBIR is funding entirely devoted to small business. It is therefore by definition support for small businesses. However, this is not the entire story. Beyond the share of funding going to small business, the quality of that impact is important. We have seen that a variety of commercial and other impacts are associated with the SBIR program. SBIR recipients themselves offer a range of positive testimony about the impact of SBIR on their companies.
In addition, the NRC Firm Survey and NRC Phase II Survey and the NIH
|
BOX 4-11 SAM Technologies The Mental Meter Project SAM Technologies (SAM) was founded by Dr. Alan Gevins in 1986 to pursue a project he had conceived many years earlier as an undergraduate at MIT: to build a Mind Meter (MM) that could directly measure the intensity of mental work in the brain. The benefits of such a project are likely to be very substantial and to extend beyond the medical applications envisaged for the first product. SAM has high expectations for the Online Mental Meter, a computer peripheral that will provide continuous information about the user’s state of alertness and mental overload or under-load. As Gevins notes, “This neuroadaptive capability will enable a system to adapt itself to the user, as contrasted with the current situation in which the user must adapt to the computer.” SAM has been funded by the Air Force, the Navy, DARPA, NASA, NSF and 7 NIH institutes through SBIR and other contracts. It has turned down opportunities with a number of VC firms in order to maintain focus on the long-term objective. This is a highly focused project, using the same core staff over a long period. The 8 most senior scientists and engineers (out of 13 in total) have been with SAM an average of 11 years. SAM is now reaching the marketplace. In 2005, SAM will release the first commercial product in the MM line—the world’s first medical test that directly measures brain signals regulating attention and memory. In addition, SAM has generated a substantial flow of knowledge: more than 50 peer reviewed papers, and 18 patents. In the end, even though there have been peripheral benefits along the way, what is striking is the extent to which the SBIR program has facilitated such an extended research project. According to Gevins, more than 94 percent of annual funding comes from the SBIR program, from multiple agencies. This is a testimony to the flexibility of the program. |
Survey all seek to address the question of what would have happened to companies had they not received SBIR awards.
4.4.1
Small Business Shares of NIH Funding
SBIR provides support for small business in that it provides funding only to businesses with no more than 500 employees—the SBA definition of a small business. At NIH, that support is now over $500 million annually (see Figure 4-15). Moreover, SBIR grants and contracts are spread out across a lot of companies. At NIH, few companies receive very large numbers of awards, and many receive one or two.
The very rapid and sustained increase in SBIR funding from 1999 to 2004
|
BOX 4-12 Three Rivers Holdings, Inc. The SmartWheel: Development of Wheelchair Pushrim Force and Measurement Device SmartWheel is a product designed to measure accurately all the key parameters involved in the propulsion of wheelchairs by their occupants. These include including stroke frequency, propulsion angle, acceleration, forces applied to the handrim, velocity, and distance traveled. According to the company, “The SmartWheel is the only commercial product in the world that measures propulsion biomechanics in the natural environment of the wheelchair user.” SmartWheel has by now been in use as a research tool for more than ten years as a means of measuring and analyzing pain and injury among wheelchair users and also as a means of assessing interventions to address problems. Currently, SmartWheels are in use at leading research institutions including the Rehabilitation Institute of Chicago, the University of Michigan, the Rehabilitation Institute of Montreal, the University of Washington, the Kessler Medical Rehabilitation Research and Education Corporation, the University of Pittsburgh, and the University of Alberta. SmartWheels is now being adapted for use as a clinical product. It has four main uses:
The company notes that SBIR awards were used to facilitate its transformation from a hard-wired noncommercial research tool to a wireless, user-friendly commercial clinical and research tool. Leading experts were hired as consultants, and speed to market was accelerated. All the evidence suggests that use of SmartWheel will continue to expand clinically, and that increasing numbers of wheelchair users will benefit from the technology. Yet commercially, this will never be a major success: The company expects that if sales double in 2005 and continue to grow thereafter, revenues will still only be $1 million in 2006. Still, the social benefits for the specific niche of SmartWheel users greatly exceed any commercial return. |
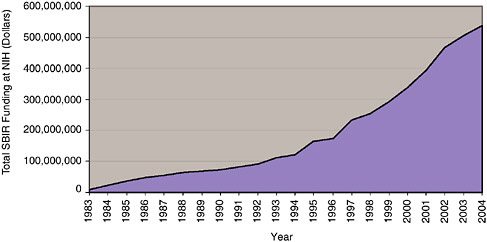
FIGURE 4-15 Total SBIR funding for small business at NIH, 1983-2004.
SOURCE: NIH awards database.
has been driven by the doubling of the overall NIH extramural research budget over that period, with a proportion of that funding allocated for small business.
However, this data set does not answer a related question: To what extent has the SBIR program replaced other funding for small businesses at NIH. This question can be addressed by comparing the level of SBIR funding with that available through all other small business funding mechanisms at NIH (see Figure 4-16).
The awards data show quite clearly that the share of small business funding being disbursed through the SBIR program has fallen steadily since soon after
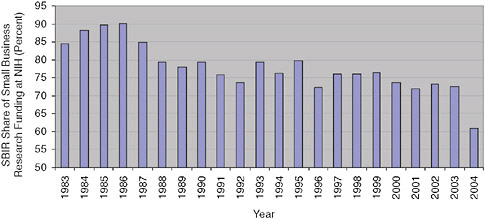
FIGURE 4-16 SBIR share of small business research funding at NIH, 1983-2004.
SOURCE: National Institutes of Health.
the inception of the program at NIH in 1983. After peaking at 90 percent of all small business research funding in the mid-1980’s, the SBIR program’s share fell steadily to about 72 percent in 2003, before falling further in 2004 (which may be an outlier).
These data clearly invalidate the hypothesis that SBIR has replaced other forms of small business funding at NIH.
4.4.2
The Decision to Begin the Project
Figure 4-17 shows that almost half of NRC Phase II Survey respondents were sure that their projects would not have occurred at all without SBIR funding. Altogether, almost 75 percent thought that would have been the case. NIH Survey data are comparable, with 64 percent of respondents anticipating that the projects would have been a “no go” in the absence of SBIR funding. These
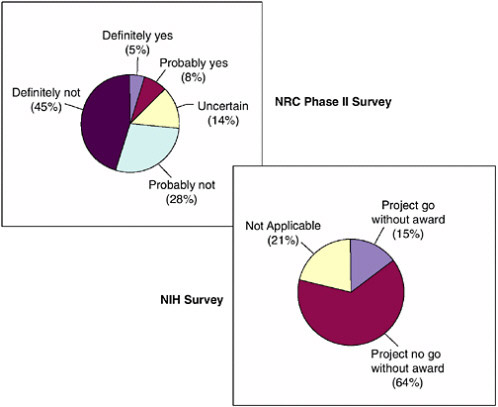
FIGURE 4-17 Greenlighting the project.
SOURCE: NRC Phase II Survey and National Institutes of Health, National Survey to Evaluate the NIH SBIR Program: Final Report, July 2003.
figures suggest that SBIR often makes the difference between a research project being pursued or not.
Even for projects that would have continued in the absence of SBIR funding, delays and other changes would have been caused by the resulting paucity of funds. 51 percent of these respondents noted that the scope of their projects would have been narrower; 19 of the 43 firms that would have continued anyway expected their project would have been delayed. Fifteen firms expected this delay would have been at least 12 months, and 13 expected a delay of at least 24 months, generating an average expected delay in project start of 8 months. Sixty-three percent expected that project completion would also have been delayed.
4.4.3
Company Foundation
Responses to the NRC Firm Survey indicate that almost 25 percent of NIH firms that received SBIR Phase II awards were founded entirely or in part as a result of SBIR awards (see Table 4-20).
4.4.4
Company Foundation and Academia
Case study interviews suggest that SBIR has facilitated of the movement of technologies and researchers from university labs to the commercial environment. Data from the NRC Firm Survey strongly support this hypothesis. More than 80 percent of NIH respondent companies had at least one founder from academia (see Table 4-21). The same survey found that about a third of founders were most recently employed in an academic environment before founding the new company. This data set, thus, strongly suggests that SBIR has indeed encouraged academic scientists to work in a more commercial environment.
4.4.5
Growth Effects
While there are no data about the effect of SBIR awards on company growth, except for the employment data discussed above (which do not seek to explain
TABLE 4-20 SBIR Awards and Firm Foundation: Was the Firm Founded Wholly or Partly Because of the Referenced SBIR Award?
|
|
Number of Responses |
Percent of Responses |
|
No |
342 |
74.8 |
|
Yes |
49 |
10.7 |
|
Yes, in part |
66 |
14.4 |
|
|
457 |
100.0 |
|
SOURCE: NRC Firm Survey. |
||
TABLE 4-21 Academics as Founders
|
|
Number of Responses |
Percent |
|
None |
86 |
18.9 |
|
At least one |
369 |
81.1 |
|
All |
455 |
100.0 |
|
SOURCE: NRC Firm Survey. |
||
the cause of growth,) the NRC Firm Survey did ask respondents to provide their own estimates of SBIR impacts on growth (see Table 4-22).
Almost half of respondents indicated that more than half of the growth experienced by their firm was directly attributable to SBIR. This too is evidence of the powerful impact winning an NIH SBIR award can have on the development of a small business.
4.4.6
Support for Woman- and Minority-owned Businesses
One of the congressional mandates for the SBIR program is to support the work of women and minorities in science. The primary metric for this support is the extent to which SBIR programs fund woman- and minority-owned businesses.
There is an extensive analysis of awards to woman- and minority-owned firms in Chapter 3 of this report.
A review of the available data in Chapter 3 draws the following conclusions:
-
Together, woman- and minority-owned firms account for an average of about 15 percent of Phase I awards at NIH (2003-2006).
-
The trend for minority-owned firms is downward since 1993, with some annual variation, and minority-owned firms have accounted for less than 4 percent of Phase I awards since 2003.
TABLE 4-22 SBIR Impacts on Company Growth (percentage impact of SBIR on overall company growth)
|
|
Number of Responses |
Percent |
|
Less than 25 |
132 |
29.5 |
|
25 to 50 |
100 |
22.4 |
|
51 to 75 |
78 |
17.4 |
|
More than 75 |
137 |
30.6 |
|
Total |
447 |
100.0 |
|
SOURCE: NRC Firm Survey. |
||
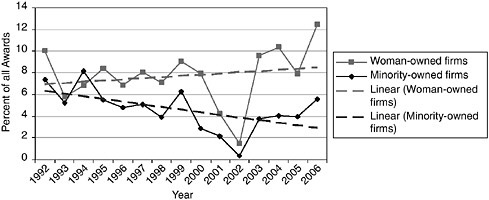
FIGURE 4-18 Phase I Award share of woman- and minority-owned firms, 1992-2006.
SOURCE: National Institutes of Health.
-
The share of Phase I applications from woman- and minority-owned firms has declined since early 1992, although absolute numbers have risen.
-
This is true in particular of minority-owned firms, whose share of applications has declined from about 10 percent in 1996 to just over 5 percent in 2005.
-
Lower levels of awards are partly explained by lower success rates—the rate at which applications are selected to become awards. The data show that woman- and minority-owned firms are consistently less successful in the Phase I selection process—that lower percentages of their applications generate awards. Minority applicants saw a particularly steep decline in success rates from 1999 to 2004, with some recovery in 2005-2006.
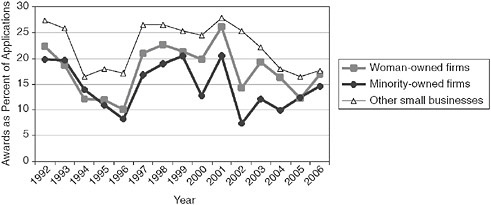
FIGURE 4-19 Success rates for Phase I awards by demographic, 1992-2006.
SOURCE: National Institutes of Health.
-
However, success rates for minority-owned firms remain about five percentage points lower than the rates for firms that are neither woman- or minority-owned.
The data themselves provide no answer to the question of why woman- and minority-owned firms have lower success rates. One promising hypothesis is that these firms tend to be formed more recently, and have both a shorter track record and less experience principal investigators, both of which may militate against success in the NIH selection process.
Finally, it is important to note that while woman-owned firms have maintained and even slightly increased their share of SBIR Phase I awards at NIH, they remain at an average of about 10 percent of all awards (2003-2006). At the same time, the percentage of women among recent life sciences doctorates has increased dramatically. According to NSF, in 1999 and 2000 women accounted for more than 61 percent of all life sciences doctorates awarded.16 In that context, maintaining a ten percent share of awards is much less impressive, and NIH might well wish to undertake further analysis to determine why so few of these new doctorates appear to be applying for NIH SBIR funding (note that there is no requirement that a company exist in order to apply for an award, although a company must be formed in order to accept one.)
4.5
SBIR AND THE EXPANSION OF KNOWLEDGE
Metrics for assessing knowledge outputs from research programs are well-known, but far from comprehensive. Patents, peer-reviewed publications, and, to a lesser extent, copyrights and trademarks, are all widely used metrics. They are each discussed in detail below. However, it is also important to understand that these metrics do not capture the entire transfer of knowledge involved in programs such as SBIR.
4.5.1
Patents
The NRC Phase II Survey data indicate that about 34 percent of respondents received patents related to their SBIR-funded project (see Table 4-23). About 41 percent of projects generated at least one patent application, and about 82 percent of those applications were successful.
The NIH Survey generated similar data indicating that 37 percent of respondents received a patent related to their SBIR award (although wording of the question makes it impossible to know whether the patent was awarded for work completed before or after the award). It is possible that a positive response
TABLE 4-23 Projects Reporting Patent Applications and Patent Awards
|
|
Applications |
Awarded |
||
|
|
Number |
Percent |
Number |
Percent |
|
No |
249 |
58.7 |
280 |
66.0 |
|
Yes |
175 |
41.3 |
144 |
34.0 |
|
|
424 |
100.0 |
424 |
100.0 |
|
Total |
679 |
|
305 |
|
|
SOURCE: NRC Phase II Survey. |
||||
reflects a patent application rather than patent approval. The very small number of “pending items” reported suggests that this may sometimes have been the case.
A negative correlation found between projects with patents and those with marketing activities could indicate differences between projects targeted at products and those focused on knowledge. However, marketing activities are positively strongly correlated with knowledge outputs, indicating that this kind of substitution effect is not detectable.
Once again, relationships between survey results and other variables might provide extremely useful insights. For example, Figure 4-22 shows patenting outputs by size of firm. Analysis of the scientific importance of the patents listed was not possible because the patents themselves were not disclosed in the course of the survey.
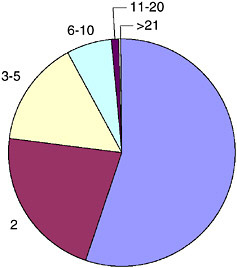
FIGURE 4-20 Number of patents per company reporting patenting activity.
SOURCE: National Institutes of Health, National Survey to Evaluate the NIH SBIR Program: Final Report, July 2003.
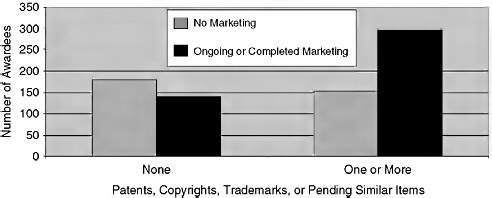
FIGURE 4-21 Awardees with one or more patents, copyrights, or trademarks—by marketing status.
SOURCE: NRC Phase II Survey.
4.5.2
Scientific Publications
The NIH Survey did not distinguish between scientific publications and articles in the trade and popular press. However, the NRC Phase II Survey did so, and it determined that slightly more than half (53.5 percent) of the respondents
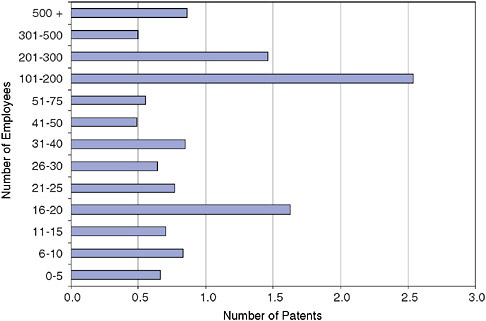
FIGURE 4-22 Number of patents, projects with at least one reported patent—by size of company.
SOURCE: NRC Phase II Survey.
had published at least one scientific paper related to their SBIR grant. About 33 percent of those with publications had published only a single paper, but one company had published 165 papers on the basis of its SBIR project, and several others had published at least 50 (as shown in Table 4-24).
This data set fits well with case studies and interviews, which suggest that SBIR companies are proud of the quality of their research. Publications are featured prominently on many grantee Web sites, and companies like Advanced Brain Monitoring, SAM Technologies, and Polymer Research all made a point of stating during interviews that their work was of the highest technical quality, as measured in the peer-reviewed publications.
Publications therefore fill two important roles in the study of SBIR programs.
First, they provide an indication of the quality of the research being conducted with program funds. More than half of the funded projects appear to be of sufficient value to generate at least one publication.
Second, publications are themselves the primary mechanism through which knowledge is transmitted within the scientific community. The existence of articles based on SBIR projects is therefore direct evidence that the results of these projects are being disseminated widely. This, in turn, implies the NIH SBIR is meeting its congressional mandate to support scientific outcomes. It is useful to note that the non-SBIR portion of the NIH research program does not have any mechanism in place for determining whether similar knowledge effects are being generated at the same rate as in the SBIR program. Note also that comparisons with SBIR programs at other agencies may be less than completely valid, as the publishing culture may be different outside the biomedical scientific world.
4.5.3
SBIR and Universities
SBIR can have further effects on the spread of knowledge through the involvement of university staff and students in SBIR projects. For example,
TABLE 4-24 Publications
|
Number of Publications |
Number of Responses |
Total Publications |
|
1 |
72 |
72 |
|
2 |
52 |
104 |
|
3 |
32 |
96 |
|
4 |
19 |
76 |
|
5 |
15 |
75 |
|
6-10 |
15 |
133 |
|
11-30 |
9 |
146 |
|
30+ |
7 |
420 |
|
Totals |
236 |
1,122 |
|
SOURCE: NRC Phase II Survey. |
||
TABLE 4-25 University Involvement in SBIR Projects
|
4% |
The Principal Investigator (PI) for this Phase II project was a faculty member. |
|
7% |
The Principal Investigator (PI) for this Phase II project was an adjunct faculty member. |
|
34% |
Faculty or adjunct faculty member (s) work on this Phase II project in a role other than PI, e.g., consultant. |
|
15% |
Graduate students worked on this Phase II project. |
|
16% |
University/College facilities and/or equipment were used on this Phase II project. |
|
5% |
The technology for this project was licensed from a University or College. |
|
6% |
The technology for this project was originally developed at a University or College by one of the participants in this Phase II project. |
|
24% |
A University or College was a subcontractor on this Phase II project. |
|
SOURCE: NRC Phase II Survey. |
|
Advanced Targeting Systems, in San Diego, has forged an extended and very successful research partnership with a senior scientist at the University of Utah. Other companies have made similar arrangements.
Just ov er half (54 percent) of all respondents indicated that there had been involvement by university faculty, graduate students, and/or a university itself in developed technologies. This involvement took a number of forms, as shown by Table 4-25.
The wide range of roles played by university staff and students indicates once more the multiple ways in which SBIR projects feed the knowledge base of the nation. Involvement in these projects provides opportunities for university staff different than those available within the academy.


