
3
SBIR Awards at NIH
3.1
INTRODUCTION
This chapter reviews awards made by NIH. The analysis uses data supplied by NIH, and as such reflects some of the advantages and disadvantages of NIH methods of capturing and providing data.
NIH provides data separately for each year of an award, and awards cannot in all cases be connected consistently across award years. Some analysis is therefore presented by award year, rather than by award. Thus, in some cases, our analysis is based on indirect estimates rather than directly on primary data. (These cases are identified below.)
In addition, NIH, citing confidentiality concerns, has not provided NRC with complete access to NIH data. This also means that there may be some areas where NRC analysis is incomplete or not possible.
Finally, NIH has been working since 2005 to correct some problems in the NIH data related to the distribution of awards to woman- and minority-owned businesses that were originally identified by the NRC study.1
While about 95 percent of all NIH SBIR awards are grants, a small number of SBIR contracts are awarded each year. These are selected based on the same review criteria but using procedures different than the SBIR award review cycle,
|
1 |
Note: Following discussions with the NRC staff, the NIH made an effort to recalculate the data for woman and minority owners’ participation in the SBIR program. In September 2007, the NIH provided corrected data, which is shown in Appendix A and in several figures in this report. However, apparent anomalies in the NIH data on the participation of women and minorities in 2001-2002 could not be resolved by the time of publication of this report. |
and they are designed to meet specific technical needs of NIH Institutes and Centers (ICs).2 This chapter focuses primarily on awards.
3.2
PHASE I AWARDS
3.2.1
Number of Phase I, Year One Awards
While funding for NIH and thus for the NIH SBIR program has substantially increased in recent years, the number of Phase I, year one awards awarded has not.3 In fact, the number of Phase I awards grew by about 25 percent between 1999 and 2004, before falling by 18.5 percent in 2005.4 It is possible that the decline shown in Figure 3-1 represents an important shift in the NIH SBIR program, as fewer Phase I awards might indicate an effort to concentrate resources of fewer, larger, Phase I awards or on Phase II.
3.2.2
Phase I—Award Size
Unlike almost all other agencies and units, NIH does not strictly cap the size of Phase I and Phase II awards. Instead, NIH has applied for and received a blanket waiver from the SBA SBIR administrator. Figure 3-2 shows that the mean size of Phase I, year one awards has increased substantially at NIH in recent years.
Even though there was no change in the Congressionally mandated maximum award size, the mean size of a Phase I, year one award5 increased by approximately 70 percent between 1998 and 2005, reaching $171,806 in the latter year.
A comparison of Figures 3-1 and 3-2 shows that the post-1999 increase in NIH SBIR funding has been directed more at increasing the size of Phase I awards than at increasing their number. This is consistent with the opinion expressed by some NIH SBIR staffers that funding should be more heavily concentrated on the highest-quality applications. This effect is more pronounced for Phase II awards, as we shall see below.
In fact, NIH now consistently makes Phase I awards that are substantially
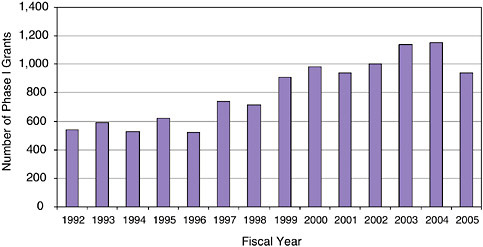
FIGURE 3-1 Number of Phase I awards at NIH, 1992-2005.
SOURCE: National Institutes of Health.
larger than SBA guidelines. The percentage of awards made at or below $100,000 has fallen from 99.7 percent in 1997 to 40.1 percent in 2005.
A comparison of the mean and median size of Phase I awards suggests that the growing mean results from a few large awards. The median award size stayed constant at $100,000 from 1995 to 2002; only in FY2003 did it rise to $106,000. However, by 2003, 16.7 percent of awards were for at least $200,000.
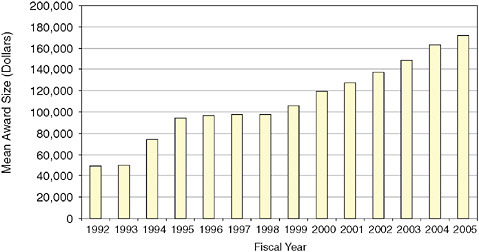
FIGURE 3-2 Phase I, Year One: Mean award size, 1992-2005.
SOURCE: National Institutes of Health.
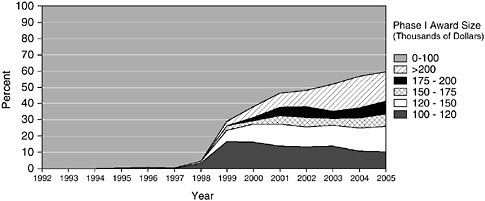
FIGURE 3-3 Oversize Phase I awards at NIH, 1992-2005.
SOURCE: National Institutes of Health
The role and implications of the changing size of NIH awards are discussed separately in Chapter 5—“Program Management.”
3.2.3
Phase I New Winners
The percentage of new entrants in the SBIR program is an important indicator of its openness. The figures underscore that the NIH program is not limited to a subset of possible awardees.
Three data sets are especially relevant: the percentage of applications from firms that have previously not won SBIR awards6; the percentage of awards going to firms that have not previously won; and the success rate of previous winners vs. new applicants.7 These data are discussed below.
3.2.3.1
New Applicants
NIH tracks firms that have not previously won SBIR awards at NIH. Some of course will have applied unsuccessfully during previous solicitations; others may have won at other agencies, so the data on previous nonwinners at NIH do not show firms that are necessarily completely new to the SBIR program. However, analysis of previous nonwinners at NIH provides useful metrics for determining the openness or inclusiveness of the program.
Overall, the data show that a very substantial number of applications continue to come in from firms that have not previously won SBIR awards at NIH,
and that more than a third of SBIR awards go to previous nonwinners. The NIH SBIR program is substantially open to new entrants.
The data in Figure 3-4 show that since 2000, an average of 61.8 percent of all Phase I applications are from firms that have not previously won SBIR awards at NIH.
This is strong evidence that the opportunities inherent in the NIH SBIR program for the small business biomedical research community are widely understood, and are not limited to a small subset of firms. These data are especially impressive as the number of previous winners has continued to grow sharply during that period, as described immediately below.
3.2.3.2
New Winners
Among all companies winning a Phase I award, an average 41.6 percent are first time winners in the NIH SBIR program.
At least 35 percent of awards went to previous nonwinners in each year since 2000, although that share has declined from 47 percent in 2000. This decline might partly reflect the fact that the number of previous winners has increased sharply during this period, and that many of these new “previous winner” firms continue to apply for more awards.
3.2.3.3
Success Rates
The NIH data permit a comparison of success rates (share of applications that are successful) between new applicants and previous winners. Here there is
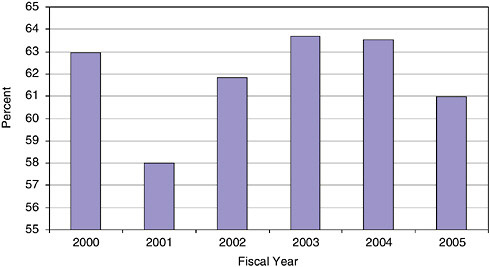
FIGURE 3-4 “New” Phase I applicants (percent of all applicants), 2000-2005.
SOURCE: National Institutes of Health.
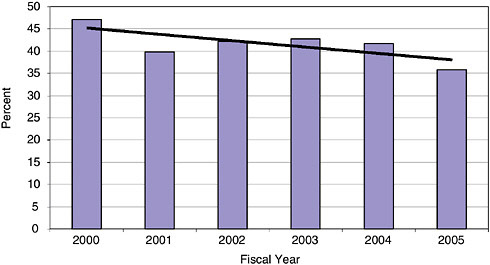
FIGURE 3-5 Percentage of winning companies new to the NIH SBIR program, 2000-2005.
SOURCE: National Institutes of Health.
a clear difference: Previous winners have a success rate more than twice that of previous nonwinners. This may be because previous winners are in a sense already certified as bona fide research companies, while the “previous nonwinners” category includes the entire range of applicants. Moreover, previous winners are likely to have a better understanding of the selection process, and to be able to write applications that better address concerns raised by reviewers.
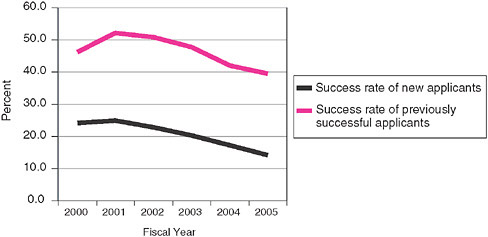
FIGURE 3-6 Phase I success rates of previous winners and nonwinners, 2000-2005.
SOURCE: National Institutes of Health.
The declining rates for both populations since 2001 reflects an increase in the number of applications from 2001-2004, as well as the more recent (FY2005) decline in the absolute number of Phase I awards.
3.2.4
Phase I—Distribution Among the States and Within Them
One of the persistent questions about SBIR is the extent to which awards are distributed among the states. Unsurprisingly, NIH Phase I SBIR awards go disproportionately to states with well-established traditions of life-science entrepreneurship (see Table 3-1). For example, California and Massachusetts together account for 34.7 percent of all Phase I awards between 1992 and 2005.
The top five award-winning states received approximately 51 percent of all awards between 1992 and 2005, ranging from a high of 57.9 percent in 1994 to a low of 47.3 percent in 2002.
Concentration at the top is mirrored in the limited number of awards given to companies in low-award states (see Figure 3-7). The bottom 15 states received 2 percent of all awards 1992-2005, and 1.5 percent in 2005, when six states received zero Phase I awards, and a further five states received only one.
However, outreach efforts by the SBIR program at NIH have supported an increase in the percentage of awards going to the bottom 15 states, which have expanded from barely 0.5 percent of awards in FY1995 to over 3 percent in FY2002 (Figure 3-7).
Further analysis suggests that the raw number of awards conceals other significant differences. Although the National Science Foundation (NSF) does not provide data on the number of life scientists in the workforce, it does offer data on life and physical scientists combined. While not a perfect match for the population of NIH primary investigators, this may be a useful proxy for our purposes here.
The NSF data show that when awards are denominated by the number of life and physical scientists employed, a few states are very successful, but that many are not.
Analysis suggests that the geographical distribution of NIH SBIR awards is understandable. First, Table 3-2 shows that to a considerable extent, awards are made to states which have a high concentration of life scientists. Second, normalizing the data by number of life scientists generates results that place New Hampshire, Vermont, and Oregon among the most successful states, even though these states are not the states that receive the most awards. Finally, and perhaps most persuasively, the selection process (discussed in Chapter 5) is such that the geographical location of applicants is unlikely to play any part in decisions, and awardees interviewed for case studies—even from low award states—indicated that they saw no geographical bias in the selection of awardees.
TABLE 3-1 Phase I Awards—By State, 1992-2005
|
State |
Number of Phase I Awards by Fiscal Year |
||||||||||||||
|
1992 |
1993 |
1994 |
1995 |
1996 |
1997 |
1998 |
1999 |
2000 |
2001 |
2002 |
2003 |
2004 |
2005 |
Grand Total |
|
|
AK |
|
|
|
|
|
|
|
|
|
|
|
2 |
|
1 |
3 |
|
AL |
5 |
11 |
6 |
4 |
7 |
5 |
6 |
10 |
8 |
11 |
9 |
8 |
6 |
4 |
100 |
|
AR |
2 |
|
|
|
|
1 |
|
3 |
1 |
2 |
1 |
3 |
4 |
5 |
22 |
|
AZ |
14 |
11 |
2 |
10 |
8 |
7 |
10 |
11 |
11 |
15 |
26 |
14 |
12 |
8 |
159 |
|
CA |
110 |
114 |
133 |
144 |
117 |
153 |
136 |
201 |
226 |
240 |
238 |
275 |
232 |
178 |
2,497 |
|
CO |
8 |
14 |
8 |
12 |
17 |
22 |
20 |
19 |
36 |
22 |
31 |
36 |
34 |
27 |
306 |
|
CT |
17 |
11 |
13 |
13 |
9 |
19 |
12 |
15 |
13 |
13 |
21 |
26 |
19 |
11 |
212 |
|
DC |
4 |
6 |
6 |
6 |
2 |
3 |
6 |
7 |
11 |
11 |
16 |
10 |
5 |
4 |
97 |
|
DE |
|
2 |
2 |
2 |
2 |
5 |
1 |
6 |
8 |
7 |
4 |
7 |
6 |
4 |
56 |
|
FL |
10 |
11 |
9 |
14 |
11 |
18 |
8 |
11 |
30 |
18 |
23 |
32 |
20 |
16 |
231 |
|
GA |
5 |
3 |
3 |
6 |
8 |
5 |
4 |
4 |
16 |
12 |
12 |
14 |
19 |
6 |
117 |
|
HI |
8 |
5 |
4 |
3 |
3 |
3 |
3 |
2 |
3 |
6 |
3 |
1 |
1 |
1 |
46 |
|
IA |
|
1 |
|
|
1 |
1 |
1 |
3 |
3 |
4 |
5 |
9 |
4 |
2 |
34 |
|
ID |
1 |
1 |
|
|
|
|
1 |
|
2 |
4 |
1 |
1 |
1 |
1 |
13 |
|
IL |
13 |
21 |
15 |
22 |
11 |
25 |
22 |
19 |
36 |
35 |
28 |
31 |
22 |
29 |
329 |
|
IN |
5 |
5 |
5 |
6 |
5 |
5 |
3 |
7 |
7 |
9 |
7 |
14 |
11 |
12 |
101 |
|
KS |
1 |
2 |
|
1 |
1 |
|
|
4 |
2 |
4 |
5 |
6 |
4 |
1 |
31 |
|
KY |
2 |
3 |
2 |
1 |
2 |
4 |
1 |
3 |
9 |
13 |
10 |
2 |
4 |
4 |
60 |
|
LA |
3 |
2 |
3 |
1 |
|
2 |
|
|
5 |
2 |
3 |
3 |
2 |
1 |
27 |
|
MA |
91 |
114 |
105 |
100 |
105 |
111 |
120 |
175 |
212 |
193 |
189 |
170 |
152 |
106 |
1,943 |
|
MD |
68 |
58 |
52 |
54 |
24 |
60 |
38 |
67 |
63 |
84 |
77 |
114 |
85 |
58 |
902 |
|
ME |
2 |
2 |
1 |
6 |
2 |
|
1 |
3 |
3 |
2 |
5 |
3 |
2 |
2 |
34 |
|
MI |
15 |
18 |
13 |
17 |
10 |
9 |
22 |
20 |
19 |
35 |
24 |
31 |
27 |
24 |
284 |
|
MN |
11 |
13 |
10 |
21 |
11 |
12 |
16 |
7 |
17 |
21 |
24 |
28 |
18 |
19 |
228 |
|
MO |
6 |
8 |
2 |
1 |
3 |
3 |
4 |
5 |
6 |
8 |
12 |
12 |
10 |
8 |
88 |
|
MS |
|
|
1 |
1 |
1 |
1 |
|
2 |
1 |
1 |
2 |
2 |
1 |
|
13 |
|
MT |
|
|
2 |
|
1 |
|
3 |
2 |
3 |
4 |
3 |
1 |
4 |
2 |
25 |
|
State |
Number of Phase I Awards by Fiscal Year |
||||||||||||||
|
1992 |
1993 |
1994 |
1995 |
1996 |
1997 |
1998 |
1999 |
2000 |
2001 |
2002 |
2003 |
2004 |
2005 |
Grand Total |
|
|
NC |
22 |
10 |
15 |
10 |
14 |
21 |
23 |
21 |
32 |
37 |
39 |
35 |
39 |
28 |
346 |
|
ND |
1 |
|
|
|
|
|
|
|
|
1 |
2 |
1 |
3 |
|
8 |
|
NE |
1 |
3 |
1 |
1 |
|
4 |
2 |
1 |
3 |
3 |
4 |
3 |
3 |
5 |
34 |
|
NH |
4 |
7 |
6 |
3 |
8 |
13 |
4 |
6 |
12 |
18 |
18 |
20 |
7 |
3 |
129 |
|
NJ |
12 |
20 |
14 |
15 |
21 |
18 |
17 |
27 |
34 |
34 |
42 |
33 |
29 |
23 |
339 |
|
NM |
7 |
2 |
1 |
3 |
1 |
4 |
2 |
8 |
8 |
10 |
8 |
12 |
11 |
4 |
81 |
|
NV |
|
|
|
|
|
3 |
1 |
|
1 |
2 |
3 |
5 |
|
3 |
18 |
|
NY |
47 |
38 |
32 |
31 |
25 |
28 |
42 |
43 |
62 |
54 |
71 |
53 |
52 |
45 |
623 |
|
OH |
17 |
19 |
12 |
19 |
12 |
26 |
34 |
26 |
39 |
47 |
47 |
50 |
37 |
35 |
420 |
|
OK |
4 |
3 |
|
2 |
2 |
|
3 |
2 |
2 |
3 |
7 |
5 |
4 |
5 |
42 |
|
OR |
9 |
11 |
13 |
19 |
16 |
16 |
14 |
18 |
32 |
27 |
34 |
29 |
19 |
12 |
269 |
|
PA |
22 |
19 |
14 |
24 |
21 |
27 |
28 |
24 |
46 |
57 |
56 |
49 |
47 |
41 |
475 |
|
PR |
|
|
|
|
|
|
1 |
1 |
1 |
|
|
|
|
|
3 |
|
RI |
|
|
1 |
1 |
|
|
1 |
3 |
8 |
9 |
10 |
7 |
10 |
8 |
58 |
|
SC |
|
|
|
|
1 |
1 |
3 |
2 |
3 |
6 |
12 |
8 |
3 |
2 |
41 |
|
SD |
|
|
|
1 |
1 |
1 |
1 |
2 |
|
2 |
3 |
1 |
1 |
|
13 |
|
TN |
3 |
3 |
4 |
3 |
2 |
8 |
3 |
2 |
6 |
9 |
8 |
9 |
4 |
4 |
68 |
|
TX |
29 |
25 |
23 |
24 |
22 |
35 |
24 |
39 |
64 |
43 |
46 |
65 |
55 |
37 |
531 |
|
UT |
14 |
11 |
10 |
10 |
7 |
14 |
16 |
14 |
23 |
25 |
23 |
11 |
17 |
8 |
203 |
|
VA |
20 |
23 |
21 |
21 |
14 |
29 |
23 |
22 |
36 |
50 |
37 |
57 |
30 |
20 |
403 |
|
VT |
3 |
6 |
3 |
3 |
1 |
1 |
|
2 |
3 |
2 |
2 |
8 |
4 |
2 |
40 |
|
WA |
16 |
18 |
17 |
22 |
24 |
30 |
28 |
44 |
48 |
47 |
59 |
48 |
37 |
28 |
466 |
|
WI |
4 |
5 |
12 |
9 |
7 |
10 |
15 |
15 |
16 |
29 |
25 |
27 |
18 |
15 |
207 |
|
WV |
|
|
|
|
|
|
|
|
1 |
1 |
|
|
|
|
2 |
|
WY |
|
|
|
|
|
1 |
2 |
3 |
2 |
1 |
4 |
2 |
|
|
15 |
|
Grand Total |
636 |
659 |
596 |
666 |
560 |
764 |
725 |
931 |
1,233 |
1,293 |
1,339 |
1,393 |
1,135 |
862 |
12,792 |
|
SOURCE: U.S. Small Business Administration, Tech-Net Database. |
|||||||||||||||
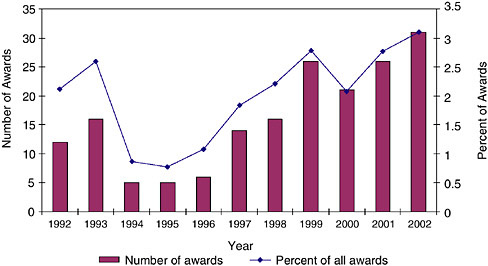
FIGURE 3-7 Phase I awards to the 15 lowest award-receiving states, 1992-2002.
SOURCE: National Institutes of Health.
3.2.4.1
Concentration Within States
Geographic concentration goes considerably further than the state level. Awards are heavily concentrated by zip code.
The data for Massachusetts indicate that 590 zip codes received no awards at all, while the top ten zip codes received more than half of all awards.
The single top winning zip code at NIH, in San Diego, California, where there is a very high concentration of biomedical firms, received more than twice as many Phase I awards as the second most successful zip code.
Concentration can of course be substantially affected by the presence of a single firm: The second most successful zip code in California, Mountain View (94043), received 114 awards, but 69 of those went to a single firm, Panorama Research.
3.2.4.2
Success Rates by State
Table 3-3 shows that success rates vary among states. The range is from 0 percent for Alaska to nearly 31 percent for Massachusetts. Table 3-3 shows the relationship between the ranking of states by number of Phase I applications and Phase I awards.
Variations in success rates across states could be due to a number of factors, such as:
TABLE 3-2 NIH Phase I Awards per 1,000 Life and Physical Scientists Employed
|
|
Life and Physical Scientists, 2003 |
NIH Phase I, 2003 |
NIH Phase I per 1,000 Life and Physical Scientists, 2003 |
|
New Hampshire |
1,480 |
14.0 |
9.5 |
|
Vermont |
850 |
6.0 |
7.1 |
|
Massachusetts |
20,380 |
140.0 |
6.9 |
|
Maryland |
17,910 |
90.0 |
5.0 |
|
Oregon |
5,870 |
23.0 |
3.9 |
|
Connecticut |
5,670 |
22.0 |
3.9 |
|
California |
64,390 |
248.0 |
3.9 |
|
Virginia |
13,030 |
40.0 |
3.1 |
|
Ohio |
15,100 |
45.0 |
3.0 |
|
Iowa |
3,130 |
9.0 |
2.9 |
|
Colorado |
11,710 |
33.0 |
2.8 |
|
Indiana |
4,070 |
11.0 |
2.7 |
|
Rhode Island |
1,580 |
4.0 |
2.5 |
|
Michigan |
9,390 |
23.0 |
2.4 |
|
Arizona |
5,580 |
13.0 |
2.3 |
|
Nevada |
2,510 |
5.0 |
2.0 |
|
Wyoming |
1,510 |
3 |
2.0 |
|
Delaware |
2,020 |
4.0 |
2.0 |
|
Minnesota |
11,200 |
22.0 |
2.0 |
|
Washington |
16,940 |
33.0 |
1.9 |
|
New Mexico |
3,200 |
6.0 |
1.9 |
|
Wisconsin |
11,220 |
21.0 |
1.9 |
|
New Jersey |
17,530 |
32.0 |
1.8 |
|
Utah |
5,060 |
9.0 |
1.8 |
|
South Carolina |
4,610 |
8.0 |
1.7 |
|
Maine |
1,830 |
3.0 |
1.6 |
|
SOURCE: National Institutes of Health; and National Science Board, Science and Engineering Indicators 2005, Arlington, VA: National Science Foundation, 2005. |
|||
-
Level of entrepreneurial activity.
-
University R&D capacities.
-
Trained scientists and engineers in the state.
-
Access to capital.
-
State support activities.8
Quantifying the impact of any one of these factors, or of other factors, was be-
|
|
Life and Physical Scientists, 2003 |
NIH Phase I, 2003 |
NIH Phase I per 1,000 Life and Physical Scientists, 2003 |
|
Pennsylvania |
25,080 |
41.0 |
1.6 |
|
District of Columbia |
5,210 |
8.0 |
1.5 |
|
Oklahoma |
3,350 |
5.0 |
1.5 |
|
North Dakota |
1,420 |
2.0 |
1.4 |
|
New York |
30,330 |
41.0 |
1.4 |
|
North Carolina |
17,770 |
24.0 |
1.4 |
|
Missouri |
9,240 |
12.0 |
1.3 |
|
Kansas |
3,910 |
5.0 |
1.3 |
|
Florida |
19,440 |
24.0 |
1.2 |
|
Alabama |
5,170 |
6.0 |
1.2 |
|
Texas |
42,440 |
49.0 |
1.2 |
|
Illinois |
18,300 |
21.0 |
1.1 |
|
Arkansas |
2,700 |
3.0 |
1.1 |
|
Louisiana |
5,540 |
5.0 |
0.9 |
|
Nebraska |
3,920 |
3.0 |
0.8 |
|
Kentucky |
2,660 |
2.0 |
0.8 |
|
Alaska |
2,800 |
2.0 |
0.7 |
|
South Dakota |
1,420 |
1.0 |
0.7 |
|
Georgia |
11,410 |
8.0 |
0.7 |
|
Tennessee |
7,130 |
4.0 |
0.6 |
|
Hawaii |
1,790 |
1.0 |
0.6 |
|
Montana |
2,790 |
1.0 |
0.4 |
|
Idaho |
3,100 |
1.0 |
0.3 |
|
Mississippi |
3,650 |
1.0 |
0.3 |
|
West Virginia |
2,510 |
0.0 |
0.0 |
|
Average |
|
|
3.2 |
yond the scope of this phase of the study, but it would be useful to assess the relative impact of these different factors.
3.2.5
Phase I Awards—By Company
Some companies are very successful in winning Phase I awards. The most successful applicant between FY1992 and FY2003 won 69 Phase I awards. Twenty of the 3,155 companies that received Phase I awards over this period accounted for 776 of the 8,706 Phase I awards awarded (8.9 percent).
However, such individual company success is rare. Only 13 companies re-
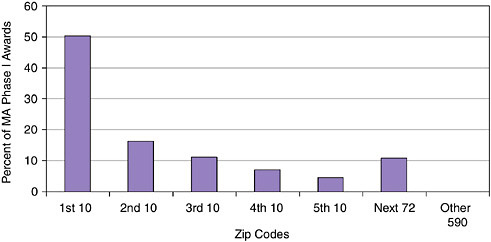
FIGURE 3-8 Concentration of Phase I awards by Zip code in Massachusetts, 1992-2005.
SOURCE: National Institutes of Health.
TABLE 3-3 Phase I Success Rates—By State (Winning applications as percent of total applications)
|
State |
Phase I Success Rate |
State |
Phase I Success Rate |
State |
Phase I Success Rate |
State |
Phase I Success Rate |
|
MA |
30.8 |
WY |
25.4 |
NH |
21.2 |
VA |
18.2 |
|
UT |
30.5 |
HI |
25.1 |
FL |
21.2 |
MS |
18.2 |
|
MO |
29.7 |
AZ |
24.3 |
RI |
21.0 |
NY |
18.0 |
|
WA |
29.2 |
NJ |
24.2 |
MI |
21.0 |
NC |
17.8 |
|
KY |
28.5 |
LA |
24.2 |
TN |
20.8 |
AR |
16.9 |
|
TX |
27.9 |
NV |
24.2 |
IL |
20.4 |
MD |
16.5 |
|
IA |
27.2 |
PR |
24.0 |
IN |
20.3 |
NE |
15.4 |
|
CT |
26.2 |
PA |
24.0 |
OK |
20.2 |
AL |
15.4 |
|
MT |
25.8 |
SC |
23.8 |
DC |
20.2 |
WI |
14.1 |
|
DE |
25.8 |
MN |
23.5 |
OH |
19.7 |
GA |
9.8 |
|
KS |
25.8 |
ID |
23.2 |
VT |
19.3 |
ND |
7.8 |
|
CA |
25.8 |
ME |
21.6 |
CO |
19.1 |
OR |
7.7 |
|
WV |
25.7 |
NM |
21.6 |
SD |
18.6 |
AK |
0.0 |
|
SOURCE: NRC calculations base on National Institutes of Health data. |
|||||||
ceived more than 30 Phase I awards during from FY1992 to FY2003, and only 33 received at least 20. In contrast, more than 3,000 (3,025) companies received less than 10 awards, and 2,237 received only one or two.9
TABLE 3-4 Multiple-award Winning Companies at NIH FY1992-2003—Top 20 Winners
|
Organization |
Number of Awards |
|
Panorama Research, Inc. |
69 |
|
Inotek Pharmaceuticals Corporation |
63 |
|
Radiation Monitoring Devices, Inc. |
56 |
|
Lynntech, Inc. |
51 |
|
Inflexxion, Inc. |
44 |
|
Oregon Center For Applied Science |
44 |
|
New England Research Institutes, Inc. |
42 |
|
Creare, Inc. |
40 |
|
Insightful Corporation |
40 |
|
Hawaii Biotech, Inc. |
38 |
|
Physical Optics Corporation |
33 |
|
Biomec, Inc. |
30 |
|
Surmodics, Inc. |
30 |
|
Biotek, Inc. |
29 |
|
Spire Corporation |
28 |
|
One Cell Systems, Inc. |
27 |
|
Compact Membrane Systems, Inc. |
26 |
|
Osi Pharmaceuticals, Inc. |
26 |
|
Personal Improvement Computer Systems |
25 |
|
Physical Sciences, Inc. |
25 |
|
Total |
766 |
|
SOURCE: National Institutes of Health. |
|
3.2.6
Phase I Awards—Woman- and Minority-owned Firms
In 2005, the NRC identified some significant problems in the collection of data for woman- and minority-owned business firms participating in the NIH SBIR program. Following an NRC request for clarification of the data, NIH investigated the problem and found that it was rooted in the data entry software.10
3.2.6.1
Award Shares
The share of awards held by woman- and minority-owned firms has remained relatively constant at about 12 percent, with the exception of 2001-2002 data (see note to Figure 3-9).
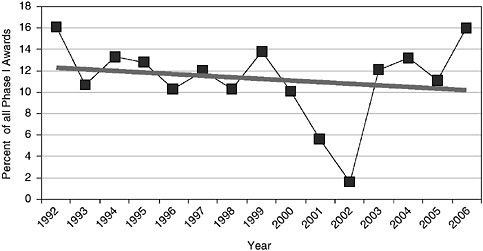
FIGURE 3-9 Award shares of woman- and minority-owned firms, 1992-2006.
NOTE: Following discussions with the NRC staff, the NIH made an effort to recalculate the data for woman- and minority-owners’ participation in the SBIR program. In September 2007, the NIH provided corrected data, which is shown in Appendix A and in several figures in this report. However, apparent anomalies in the NIH data on the participation of women and minorities in 2001-2002 could not be resolved by the time of publication of this report.
SOURCE: National Institutes of Health.
However, these data partly conceal a long-term decline in the share of awards going to minority-owned firms, which have fallen from an average of 6.9 percent in 1992-1994 to 4.3 percent in 2003-2006.
3.2.6.2
Share of Applications
One possible explanation for the declining minority share may be in the number of applications received. These are captured in Figure 3-10.
In fact, the data show that applications from minority-owned firms have declined, from more than 10 percent of all applications in 1996, to under 4 percent 2006. Applications share for woman-owned firms has remained approximately constant.
3.2.6.3
Success Rates
A different explanation for declining award shares may lie in relative success rates. These are described in Figure 3-11.
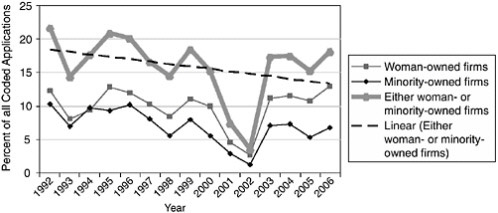
FIGURE 3-10 Woman- and minority-owned firms—Phase I percentage share of all coded applications, by demographic, 1992-2006.
NOTE: Following discussions with the NRC staff, the NIH made an effort to recalculate the data for woman and minority owners’ participation in the SBIR program. In September 2007, the NIH provided corrected data, which is shown in Appendix A and in several figures in this report. However, apparent anomalies in the NIH data on the participation of women and minorities in 2001-2002 could not be resolved by the time of publication of this report.
SOURCE: National Institutes of Health.
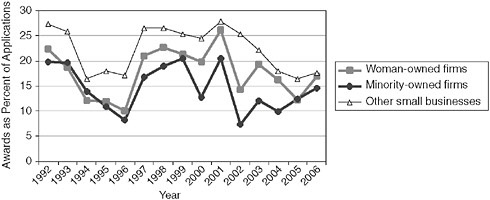
FIGURE 3-11 Success rates for Phase I awards by demographic, 1992-2006.
NOTE: Following discussions with the NRC staff, the NIH made an effort to recalculate the data for woman and minority owners’ participation in the SBIR program. In September 2007, the NIH provided corrected data, which is shown in Appendix A and in several figures in this report. However, apparent anomalies in the NIH data on the participation of women and minorities in 2001-2002 could not be resolved by the time of publication of this report.
SOURCE: National Institutes of Health.
The data show that woman- and minority-owned firms are consistently less successful in the selection process—that lower percentages of their applications generate awards. Minority applicants saw a particularly steep decline in success rates from 1999 to 2004, with some recovery in 2005-2006. However, they remain about five percentage points lower than the rates for firms that are neither woman- or minority-owned. Note that it is not possible, using the data provided by NIH, to test the impact of other factors such as whether these woman- and minority-owned firms are disproportionately new applicants. Follow-on research could address this possibility.
The data provide no immediate answer as to why woman- and minority-owned firms have lower success rates. One promising hypothesis is that these firms may tend to be formed more recently, and have both a shorter track record and less experienced principal investigators, both of which may mitigate against success in the NIH selection process.
3.2.6.4
Woman- and Minority-owned Firms in Phase I
While we can conclude that woman- and minority-owned firms receive a significant share of awards, the data suggest that further analysis is needed, and that NIH may in particular need to take more aggressive steps to encourage high-quality applications from these firms. A review of the selection process from this perspective is also warranted.
Finally, it is important to note that while woman-owned firms have maintained and even slightly increased their share of SBIR Phase I awards at NIH, they remain at about 10 percent of the total (over 2003-2006). At the same time, the percentage of women among recent life sciences doctorates has increased dramatically.11 According to NSF, in 2005 women accounted for more than 48 percent of all biological sciences doctorates awarded.12 This growth is also reflected in employment data: Women account for 36.5 percent of employed life scientists in 2005.13 These are the likely founders of firms that might be seeking seed funding from the NIH SBIR program.
In that context, maintaining a ten percent share of awards is much less impressive, and NIH might well wish to undertake further analysis to determine why so few of these new doctorates appear to be applying for NIH SBIR funding (note
that there is no requirement that a company exist in order to apply for an award, although a company must be formed in order to accept one.)
3.2.7
Phase I Awards—By IC
The substantial size differences among the various institute centers (IC) at NIH are reflected both in Phase I and Phase II, as can be seen in part in Table 3-5.
Together, the three largest ICs (National Cancer Institute, National Heart Lung and Blood Institute, and NIAID) accounted for 44.4 percent of all NIH SBIR Phase I awards. Only two other ICs account for more than 5 percent of the total. Conversely, the 10 smallest ICs together accounted for 9.7 percent of the total, with none providing more than 2 percent individually.
3.2.8
Phase I—Extended Awards: Year Two of Support
NIH is unique among the granting agencies in providing extended support for Phase I awards. Interviews with NIH personnel and awardees suggest that, to a considerable extent, the normal timeframe for completing a Phase I project has become one year, rather than six months. “No-cost extensions”—extensions of time without additional funding—up to one year total are relatively easy to get.
NIH is also unique in providing additional funding beyond the first year for some Phase I awards. This practice is relatively rare but growing in importance at NIH.
While the median size of second year Phase I awards appears to have stabilized at around $200,000, the number of second year awards continues to climb sharply. From 1992 to 1999, there were always less than five such awards per year. By FY2003, more than 10 percent (80) of all Phase I awards went to second-year support.
3.2.9
Phase I—Supplementary Funding
NIH offers one further form of funding flexibility. Program officers can add limited additional funds to an award in order to help a recipient pay for unexpected costs. While practices vary among individual ICs, it appears that awards of up to 25 percent of the annual funding awarded can be made by a program manager without further IC or NIH review. More substantial supplements must be more extensively reviewed.
For Phase I, supplements remain relatively rare, recently averaging less than 20 per year. They are also not especially large; in no fiscal year have they totaled more then $1 million for all awards combined. They are more important for Phase II, as will be explained below.
TABLE 3-5 Percentage Phase I Awards—By IC, 1992-2002
|
Funding IC |
Percentage Phase I Awards |
|||||||||||
|
1992 |
1993 |
1994 |
1995 |
1996 |
1997 |
1998 |
1999 |
2000 |
2001 |
2002 |
Total |
|
|
NIAA |
0.7 |
1.2 |
0.6 |
1.1 |
0.8 |
1.6 |
0.6 |
1.5 |
1.5 |
1.0 |
1.2 |
1.1 |
|
NIA |
2.2 |
2.4 |
5.3 |
2.6 |
1.0 |
4.6 |
3.6 |
3.2 |
3.5 |
4.1 |
2.8 |
3.3 |
|
NIAID |
11.7 |
12.3 |
9.2 |
11.9 |
13.4 |
13.5 |
11.6 |
10.0 |
10.2 |
11.4 |
12.9 |
11.6 |
|
NIAMS |
0.9 |
2.7 |
3.2 |
4.2 |
5.5 |
3.4 |
2.8 |
3.0 |
2.3 |
3.0 |
1.5 |
2.9 |
|
NCCAM |
0.0 |
0.0 |
0.0 |
0.0 |
0.0 |
0.0 |
0.0 |
0.2 |
0.6 |
0.8 |
0.7 |
0.3 |
|
NCI |
29.6 |
26.5 |
21.5 |
15.3 |
15.3 |
20.8 |
19.3 |
21.2 |
18.7 |
20.5 |
22.4 |
20.9 |
|
NIDA |
2.4 |
1.5 |
4.2 |
3.9 |
3.6 |
1.8 |
2.0 |
3.5 |
3.1 |
3.0 |
2.1 |
2.8 |
|
NIDCD |
1.1 |
1.7 |
2.3 |
1.3 |
1.0 |
1.6 |
1.1 |
2.2 |
2.2 |
2.0 |
1.0 |
1.6 |
|
NIDCR |
1.1 |
1.3 |
1.1 |
2.3 |
1.3 |
0.8 |
2.0 |
0.9 |
3.2 |
3.7 |
1.3 |
1.8 |
|
NIDDK |
3.0 |
3.7 |
6.8 |
7.9 |
7.5 |
6.7 |
5.6 |
7.7 |
8.5 |
7.1 |
7.1 |
6.7 |
|
NIBIB |
0.0 |
0.0 |
0.0 |
0.0 |
0.0 |
0.0 |
0.0 |
0.0 |
0.0 |
0.0 |
1.8 |
0.2 |
|
NIEHS |
1.5 |
1.3 |
1.5 |
1.4 |
1.9 |
1.1 |
1.3 |
1.2 |
2.4 |
3.1 |
3.2 |
1.9 |
|
NEE |
3.0 |
2.4 |
4.7 |
4.5 |
5.2 |
2.4 |
2.5 |
2.0 |
2.0 |
2.1 |
3.1 |
2.9 |
|
NIGMS |
7.8 |
10.6 |
9.1 |
6.8 |
10.1 |
9.2 |
10.3 |
9.7 |
8.2 |
8.8 |
8.0 |
8.9 |
|
NICHD |
5.7 |
8.8 |
4.5 |
4.3 |
6.7 |
5.7 |
4.5 |
4.1 |
5.3 |
3.3 |
4.3 |
5.0 |
|
NHGRI |
1.1 |
0.8 |
0.8 |
0.8 |
1.0 |
1.1 |
2.4 |
1.9 |
0.9 |
0.9 |
2.3 |
1.3 |
|
NHLBI |
12.6 |
8.6 |
10.6 |
16.6 |
15.1 |
11.2 |
10.1 |
12.0 |
13.7 |
12.3 |
9.0 |
11.9 |
|
NLM |
0.4 |
0.5 |
0.4 |
0.0 |
0.0 |
0.4 |
0.8 |
0.4 |
0.4 |
0.1 |
0.2 |
0.3 |
|
NIMH |
3.1 |
4.0 |
3.8 |
5.3 |
4.0 |
4.9 |
4.7 |
4.5 |
3.2 |
4.0 |
4.4 |
4.2 |
|
NINR |
0.7 |
1.2 |
0.2 |
1.0 |
0.2 |
0.4 |
0.8 |
0.6 |
0.5 |
0.2 |
0.2 |
0.5 |
|
NINDS |
4.6 |
3.9 |
6.6 |
6.4 |
3.6 |
4.2 |
6.3 |
5.6 |
5.2 |
4.6 |
5.3 |
5.1 |
|
NCRR |
6.7 |
4.6 |
3.8 |
2.1 |
2.7 |
4.4 |
5.6 |
4.3 |
4.2 |
4.0 |
3.5 |
4.2 |
|
Shared |
0.0 |
0.0 |
0.0 |
0.3 |
0.2 |
0.4 |
2.2 |
0.1 |
0.3 |
0.2 |
1.7 |
0.6 |
|
Total |
100 |
100 |
100 |
100 |
100 |
100 |
100 |
100 |
100 |
100 |
100 |
100 |
|
SOURCE: National Institutes of Health. |
||||||||||||
3.3
PHASE II AWARDS
As funding for NIH has increased, with a 5-year doubling of the NIH budget started in 1999, both the number and the average size of Phase II awards have grown in nominal terms, but to different degrees.
After increasing from fewer than 300 new Phase II awards in 1992, the number of new awards at NIH grew to almost 800 in 2002. Since then, the number has remained almost flat, with a slight decline to 774 awards in 2005.
However, this period of stable award numbers coincides with substantial growth in SBIR funding at NIH. Consequently, this additional funding is being distributed in other ways—one of which is increased average award size.
NIH maintains a different record for each year of an award. The average size of the first year of the NIH Phase II award has increased in nominal terms considerably, from around $230,000 in 1994 to more than $500,000 in 2005, with a jump of $55,000 (or 11.9 percent) in 2005 alone. Increased size of year one awards is matched by growth in the size of year two awards as well.
3.3.1
Phase II—Extended Awards
Beyond the size of awards, NIH is also distinctive in the way it provides additional support beyond the second year of Phase II. For example, in FY2003, 39 companies were in their third year of Phase II support, and two more were in their fourth year.
Figure 3-12 shows that there has been a substantial increase in the number of companies receiving third-year Phase II support. In FY2003, 39 companies
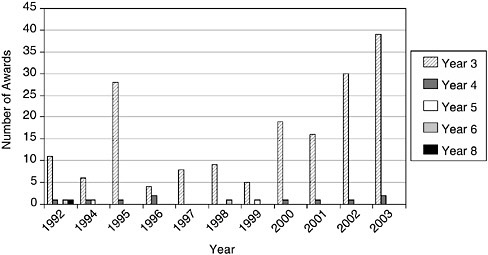
FIGURE 3-12 Phase II—Extended support, 1992-2003.
SOURCE: National Institutes of Health.
received such support; this is equivalent to about 10 percent of the companies that received their initial Phase II awards in FY2001 (the first year of Phase II support for this cohort of awards).
These additional years of support have also provided a growing amount of funding per award.
These data both document the ongoing growth in support beyond year two (see Figure 3-13); they indicate that the average amount of support has continued to grow, and is now at approximately $725,000. Some projects receive more than one year of additional support, as documented in Figure 3-12.
3.3.2
Competing Continuation Awards
NIH has recently initiated a new program aimed at supporting companies during the difficult period of clinical trials, where outsider funding can be especially scarce. Competing Continuation Awards (CCAs) are a competitive program that provides three years of additional support at $1 million per year for companies needed support during trials.
As the data in Table 3-6 indicate, CCAs are now ramping up. It is still much too early to tell whether CCA’s will be successful. At least one large IC—NCI—has withdrawn from the program partly on the grounds that it does not require matching funds. This criticism—drawn from the experience at NSF with their Phase IIB program—may however not be easily addressed at NIH, where matching funds are difficult to find for projects before the end of clinical trials.
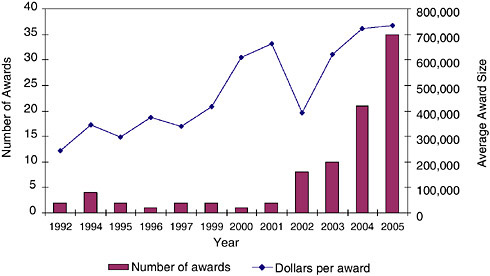
FIGURE 3-13 Support for Phase II beyond Year Two, 1992-2005.
SOURCE: National Institutes of Health.
TABLE 3-6 Competing Continuation Awards at NIH, 2003-2005
|
Fiscal Year |
Total Awards |
Competing Awards |
Non-competing Awards (Yr2/3) |
|||
|
Number |
Amount ($) |
Number |
Amount ($) |
Number |
Amount ($) |
|
|
2003 |
2 |
975,649 |
1 |
799,709 |
1 |
175,940 |
|
2004 |
3 |
2,298,561 |
2 |
1,498,562 |
1 |
799,999 |
|
2005 |
21 |
15,494,168 |
19 |
13,890,358 |
2 |
1,603,810 |
|
SOURCE: National Institutes of Health. |
||||||
It is also worth noting that if CCAs continue to be funded at the current rate, they would account for more than $40 million annually, about 6.5 percent of the NIH SBIR program, and equivalent to 400 standard Phase I awards. That trade-off does not appear to have been systematically addressed by NIH.
3.3.3
Phase II Awards—By Company
As with Phase I, some companies have received numerous Phase II awards, although at levels far lower than at DoD where questions about the role of frequent award winners in the SBIR program have been focused. The companies receiving many Phase I awards are often also successful in applying for multiple Phase II awards.
The correlation is not perfect, however, as shown by Table 3-7. For example, the top Phase I winner—Panorama Research—is only seventh on the list of Phase II winners. Some big winners in Phase I, such as Abiomed, Individual Monitoring, and Sociometrics, have conversion rates from Phase I to Phase II of over 80 percent. Others, by contrast, such as Panorama Research, only convert 20 percent of their Phase I awards into Phase II awards.
In general, NIH awards do not appear to be overly concentrated in a few firms. Only three companies have received 30 or more Phase II awards between 1992 and 2003. Overall, the top 20 winners account for 11.1 percent of all Phase II awards during this period, while more than 1,500 companies received at least one Phase II during this period.14
3.3.4
Phase II Awards—By State
The geographical distribution of Phase II awards approximates but does not equal the distribution for Phase I awards. As can be seen by comparing Table 3-1 and Table 3-8, the states with many Phase I award winners tended to get the
TABLE 3-7 Conversion Rates of Top 20 Phase II Award Winners, 1992-2003
|
Organization |
Number of Phase II Awards |
Number of Phase I Awards |
Conversion Rate (%) |
|
NEW ENGLAND RESEARCH INSTITUTES, INC. |
34 |
42 |
81.0 |
|
INFLEXXION, INC. |
32 |
44 |
72.7 |
|
RADIATION MONITORING DEVICES, INC. |
30 |
56 |
53.6 |
|
OREGON CENTER FOR APPLIED SCIENCE |
27 |
44 |
61.4 |
|
INSIGHTFUL CORPORATION |
22 |
40 |
55.0 |
|
LYNNTECH, INC. |
17 |
51 |
33.3 |
|
PANORAMA RESEARCH, INC. |
15 |
69 |
21.7 |
|
INOTEK PHARMACEUTICALS CORPORATION |
14 |
63 |
22.2 |
|
SOCIOMETRICS CORPORATION |
13 |
16 |
81.3 |
|
ABIOMED, INC. |
13 |
13 |
100.0 |
|
PERSONAL IMPROVEMENT COMPUTER SYSTEMS |
13 |
25 |
52.0 |
|
CREARE, INC. |
13 |
40 |
32.5 |
|
CLEVELAND MEDICAL DEVICES, INC. |
13 |
23 |
56.5 |
|
INDIVIDUAL MONITORING SYS, INC. (IM SYS) |
12 |
14 |
85.7 |
|
BIOTEK, INC. |
12 |
29 |
41.4 |
|
SURMODICS, INC. |
11 |
30 |
36.7 |
|
ADVANCED MEDICAL ELECTRONICS CORPORATION |
11 |
18 |
61.1 |
|
ELECTRICAL GEODESICS, INC. |
11 |
19 |
57.9 |
|
WESTERN RESEARCH COMPANY, INC. |
11 |
20 |
55.0 |
|
PHYSICAL SCIENCES, INC. |
11 |
25 |
44.0 |
|
Total (top 20 award winners) |
335 |
681 |
49.2 |
|
All Awards |
3,027 |
|
|
|
Top 20 as percent of all Phase II awards |
11.1 |
|
|
|
SOURCE: National Institutes of Health. |
|||
most Phase II awards. Not surprisingly, states with few Phase I awards had few Phase II awards.
States vary substantially in the degree to which their companies successfully convert Phase I awards into Phase II. Table 3-9 also shows the percentage share of Phase II awards between 1992 and 2003, by state, expressed as a percentage of the Phase I awards between 1992 and 2003, by state. This metric indicates states whose firms appear to be particularly successful at converting Phase I awards into Phase II awards.
More research is needed to understand why companies in some states are so much more likely to be successful in moving from Phase I to Phase II. While part of this phenomenon is due, in part, to the geographic location of particular companies that have in the past been successful, more information is needed to
TABLE 3-8 Phase II, Year One Awards, 1992-2002, By State, 1992-2002
|
State |
Number of Phase II, Year One Awards |
Percent of Total |
Percent of Phase I |
|||||||||||
|
1992 |
1993 |
1994 |
1995 |
1996 |
1997 |
1998 |
1999 |
2000 |
2001 |
2002 |
1992-2002 |
|||
|
AL |
1 |
1 |
2 |
3 |
1 |
2 |
1 |
2 |
2 |
2 |
4 |
21 |
0.8 |
92.1 |
|
AR |
|
|
1 |
|
|
|
|
|
|
|
1 |
2 |
0.1 |
77.9 |
|
AZ |
1 |
5 |
1 |
1 |
1 |
4 |
3 |
9 |
4 |
2 |
12 |
43 |
1.6 |
131.3 |
|
CA |
24 |
36 |
21 |
32 |
34 |
58 |
54 |
46 |
40 |
69 |
48 |
462 |
17.3 |
85.8 |
|
CO |
|
5 |
|
5 |
5 |
5 |
4 |
10 |
8 |
5 |
12 |
59 |
2.2 |
95.7 |
|
CT |
4 |
5 |
4 |
6 |
3 |
5 |
2 |
3 |
6 |
3 |
2 |
43 |
1.6 |
91.1 |
|
DC |
|
2 |
1 |
1 |
1 |
4 |
|
6 |
5 |
4 |
5 |
29 |
1.1 |
158.5 |
|
DE |
|
|
|
|
2 |
1 |
|
3 |
1 |
2 |
|
9 |
0.3 |
77.9 |
|
FL |
4 |
8 |
2 |
2 |
1 |
9 |
|
5 |
7 |
3 |
5 |
46 |
1.7 |
94.3 |
|
GA |
|
1 |
2 |
|
1 |
4 |
3 |
4 |
3 |
1 |
2 |
21 |
0.8 |
89.6 |
|
HI |
1 |
1 |
1 |
1 |
1 |
|
|
1 |
1 |
1 |
|
8 |
0.3 |
60.8 |
|
IA |
1 |
|
|
|
|
1 |
1 |
1 |
|
3 |
2 |
9 |
0.3 |
140.2 |
|
ID |
|
1 |
|
|
|
|
|
1 |
|
|
|
2 |
0.1 |
56.6 |
|
IL |
3 |
9 |
1 |
3 |
3 |
8 |
6 |
11 |
7 |
14 |
5 |
70 |
2.6 |
101.0 |
|
IN |
2 |
|
|
3 |
2 |
3 |
|
4 |
1 |
4 |
3 |
22 |
0.8 |
112.4 |
|
KS |
|
|
|
2 |
|
1 |
1 |
|
1 |
2 |
1 |
8 |
0.3 |
118.7 |
|
KY |
1 |
1 |
|
|
1 |
|
|
1 |
1 |
3 |
1 |
9 |
0.3 |
96.7 |
|
LA |
|
1 |
|
|
|
|
|
|
1 |
1 |
2 |
5 |
0.2 |
91.6 |
|
MA |
33 |
33 |
18 |
41 |
39 |
49 |
34 |
51 |
51 |
67 |
51 |
467 |
17.5 |
108.7 |
|
MD |
9 |
23 |
10 |
15 |
9 |
17 |
20 |
11 |
17 |
27 |
21 |
179 |
6.7 |
97.7 |
|
ME |
1 |
|
2 |
|
|
2 |
1 |
1 |
|
1 |
2 |
10 |
0.4 |
124.6 |
|
MI |
5 |
4 |
3 |
5 |
6 |
8 |
9 |
4 |
6 |
9 |
4 |
63 |
2.4 |
118.2 |
|
MN |
3 |
6 |
3 |
3 |
7 |
8 |
4 |
3 |
4 |
4 |
9 |
54 |
2.0 |
110.7 |
|
MO |
|
1 |
1 |
|
|
1 |
1 |
2 |
1 |
2 |
5 |
14 |
0.5 |
96.9 |
|
MS |
|
|
|
|
|
|
|
|
|
|
1 |
1 |
0.0 |
38.9 |
|
MT |
|
|
|
|
1 |
|
1 |
1 |
1 |
1 |
|
5 |
0.2 |
82.0 |
|
State |
Number of Phase II, Year One Awards |
Percent of Total |
Percent of Phase I |
|||||||||||
|
1992 |
1993 |
1994 |
1995 |
1996 |
1997 |
1998 |
1999 |
2000 |
2001 |
2002 |
1992-2002 |
|||
|
NC |
2 |
7 |
5 |
2 |
4 |
8 |
6 |
8 |
2 |
11 |
12 |
67 |
2.5 |
100.8 |
|
NE |
1 |
|
|
2 |
|
1 |
|
1 |
2 |
1 |
|
8 |
0.3 |
178.0 |
|
NH |
1 |
1 |
1 |
5 |
1 |
3 |
3 |
4 |
2 |
4 |
|
25 |
0.9 |
90.6 |
|
NJ |
4 |
3 |
3 |
4 |
3 |
3 |
6 |
12 |
8 |
12 |
13 |
71 |
2.7 |
99.2 |
|
NM |
|
1 |
1 |
|
2 |
1 |
|
|
3 |
2 |
1 |
11 |
0.4 |
74.5 |
|
NV |
1 |
|
2 |
|
1 |
|
|
|
1 |
2 |
2 |
9 |
0.3 |
164.9 |
|
NY |
6 |
16 |
8 |
13 |
11 |
13 |
9 |
12 |
11 |
18 |
22 |
139 |
5.2 |
99.5 |
|
OH |
3 |
5 |
4 |
6 |
3 |
10 |
7 |
8 |
7 |
9 |
16 |
78 |
2.9 |
104.7 |
|
OK |
1 |
1 |
1 |
|
|
|
1 |
|
|
1 |
1 |
6 |
0.2 |
116.8 |
|
OR |
3 |
3 |
5 |
5 |
6 |
8 |
9 |
9 |
11 |
11 |
8 |
78 |
2.9 |
133.5 |
|
PA |
4 |
4 |
2 |
10 |
6 |
7 |
8 |
11 |
7 |
20 |
16 |
95 |
3.6 |
99.0 |
|
PR |
|
|
|
|
|
|
|
|
1 |
|
|
1 |
0.0 |
155.8 |
|
RI |
1 |
|
|
|
|
|
|
2 |
1 |
2 |
2 |
8 |
0.3 |
69.2 |
|
SC |
|
|
|
|
|
|
|
|
1 |
|
5 |
6 |
0.2 |
69.2 |
|
SD |
|
|
|
|
|
|
|
2 |
|
1 |
1 |
4 |
0.1 |
207.7 |
|
TN |
|
2 |
2 |
2 |
|
1 |
4 |
1 |
1 |
1 |
2 |
16 |
0.6 |
95.9 |
|
TX |
5 |
7 |
5 |
10 |
4 |
11 |
8 |
9 |
12 |
11 |
14 |
96 |
3.6 |
93.5 |
|
UT |
5 |
7 |
3 |
4 |
1 |
2 |
2 |
5 |
3 |
7 |
6 |
45 |
1.7 |
96.0 |
|
VA |
2 |
7 |
9 |
11 |
5 |
6 |
8 |
5 |
8 |
11 |
10 |
82 |
3.1 |
97.1 |
|
VT |
1 |
|
2 |
2 |
1 |
1 |
|
|
1 |
|
1 |
9 |
0.3 |
116.8 |
|
WA |
4 |
7 |
5 |
9 |
4 |
11 |
18 |
16 |
7 |
22 |
20 |
123 |
4.6 |
131.7 |
|
WI |
|
1 |
|
2 |
3 |
4 |
3 |
4 |
9 |
5 |
3 |
34 |
1.3 |
80.2 |
|
WV |
|
|
|
|
|
|
|
|
1 |
|
1 |
2 |
0.1 |
311.5 |
|
SOURCE: National Institutes of Health. |
||||||||||||||
TABLE 3-9 Phase II Awards—Over- and Underachieving States
|
Top Ten Overachievers |
Top Ten Underachievers |
||
|
State |
Percenta |
State |
Percenta |
|
WV |
311.5 |
MS |
38.9 |
|
SD |
207.7 |
ID |
56.6 |
|
NE |
178.0 |
HI |
60.8 |
|
NV |
164.9 |
RI |
69.2 |
|
DC |
158.5 |
SC |
69.2 |
|
PR |
155.8 |
NM |
74.5 |
|
IA |
140.2 |
AR |
77.9 |
|
OR |
133.5 |
DE |
77.9 |
|
WA |
131.7 |
WI |
80.2 |
|
AZ |
131.3 |
MT |
82.0 |
|
aPercent of total Phase II awards as percent of Phase I awards (shows successful transitions from Phase I to Phase II) SOURCE: NRC calculations based on National Institutes of Health data. |
|||
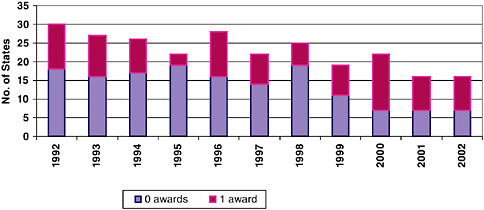
FIGURE 3-14 Phase II—Number of low-award states, 1992-2002.
SOURCE: National Institutes of Health.
explain the award pattern. Understanding this process better would likely be of value to state economic development agencies.15
NIH has, as discussed earlier, made considerable outreach efforts toward low-award states. These efforts appear to be generating positive results. Figure 3-14 shows that the number of states receiving zero or one Phase II awards
TABLE 3-10 Phase II—Top Award Winning States (Percent of all new Phase II awards), 2006
|
State |
Percent |
|
CA |
18.5 |
|
MA |
13.1 |
|
PA |
5.9 |
|
MD |
4.6 |
|
OR |
4.4 |
|
OH |
4.1 |
|
IL |
3.8 |
|
TX |
3.6 |
|
NY |
3.3 |
|
WA |
3.3 |
|
SOURCE: U.S. Small Business Administration, Tech-Net Database. |
|
in a particular year has declined steadily from 30 in 1992 to 16 in 2002. At the other end of the spectrum, California is the top award-winning state, followed by Massachusetts (see Table 3-10).
3.3.5
Phase II Women and Minorities
As with Phase I, several key factors affect the participation of woman- and minority-owned firms in the NIH SBIR program.
The data show that the participation of woman- and minority-owned firms in the NIH SBIR program have diverged over the past ten years.
While participation of woman-owned firms has trended up since 1998, participation of minority-owned firms is both very low and declining. The consistent minority-owned participation at less than 4 percent of awards since 2003 is a matter for considerable concern.
As noted in Section 3.2.6.4, women account for a large and growing percentage of recent Ph.Ds in the life sciences. In light of those figures, a participation level of 12 percent for woman-owned firms is still a matter that merits further analysis by NIH.
One obvious question is whether these award levels are primarily the result of application patterns, or of success rates. Obviously, application patterns in part stem from Phase I patterns overall, as success at Phase I is a requirement before applying for Phase II.
Still, success rates do provide useful information. The data show that minority-owned firms have, as in Phase I, consistently generated lower success rates at Phase II than either woman-owned firms or firms that are neither woman-or minority-owned.
Over the past four years (2003-2006), this gap has averaged 9.3 percentage
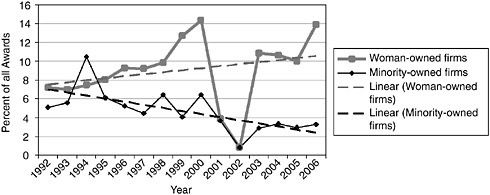
FIGURE 3-15 Share of Phase II awards to woman- and minority-owned firms, 1992-2006.
NOTE: Following discussions with the NRC staff, the NIH made an effort to recalculate the data for woman and minority owners’ participation in the SBIR program. In September 2007, the NIH provided corrected data, which is shown in Appendix A and in several figures in this report. However, apparent anomalies in the NIH data on the participation of women and minorities in 2001-2002 could not be resolved by the time of publication of this report.
SOURCE: National Institutes of Health.
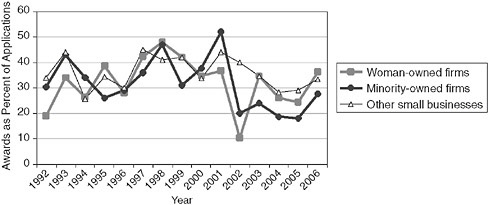
FIGURE 3-16 Success rates for Phase II applications by woman- and minority-owned firms, 1992-2006.
NOTE: Following discussions with the NRC staff, the NIH made an effort to recalculate the data for woman and minority owners’ participation in the SBIR program. In September 2007, the NIH provided corrected data, which is shown in Appendix A and in several figures in this report. However, apparent anomalies in the NIH data on the participation of women and minorities in 2001-2002 could not be resolved by the time of publication of this report.
SOURCE: National Institutes of Health.
points (31.3 percent vs. 22.0 percent) as minority-owned firms have succeeded about one third less often than firms that are not minority owned.
This is troubling, and warrants immediate attention from NIH.
3.3.6
Phase II—Awards by IC
Phase II award distribution by IC follows a pattern similar to Phase I awards. The two largest ICs—NCI and NHLBI—account for 30.8 percent of all awards FY1992-2003, while the five largest IC’s account for 54.9 percent.
3.4
PHASE I APPLICATIONS
3.4.1
Phase I Applications—By IC
The number of awards made does not closely track success rates at the level of the IC. Success rates vary very widely by IC, from a high of 29 percent at NS to a low of 5 percent at the Library of Medicine (in 2003). Success rates at the three largest ICs average about 24 percent.
It should be noted that the number of applications has declined quite sharply at NIH in 2005 and 2006—down 11 percent and 16 percent respectively.
3.4.2
Resubmissions
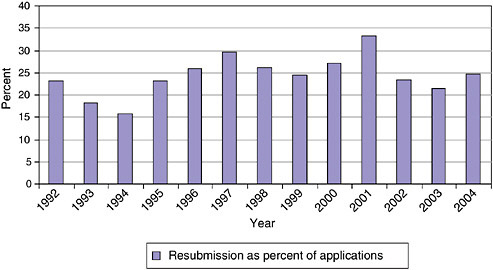
It is normal practice at NIH to allow companies to resubmit Phase I proposals. The resubmissions include responses to questions and criticisms from the initial reviewers. This process usually requires a delay of eight or more months, as responses are not usually returned to applicants in time to resubmit during the next funding cycle.16
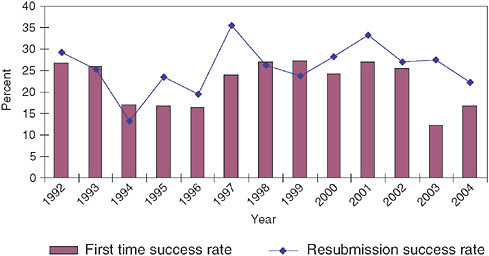
Figure 3-17 and Figure 3-18 show the percentage of resubmissions in total submissions and the relative success rates for resubmissions and original applications, respectively.
Resubmission rates fluctuate somewhat, but the trend since 1992 has been relatively stable; about 20-25 percent of all submissions are resubmissions. Though the success rates of submissions and resubmissions vary by year, resubmissions are overall slightly more likely to be successful than original submissions, even though all resubmissions have been rejected at least once and hence are—one might assume—less convincing applications.
This suggests that there is often room in proposals for improvements and clarifications that would then permit funding. Perhaps the NIH SBIR program should test mechanisms for improving original proposals, thus saving both the applicant and SBIR staff the time and effort of going through the application process twice.
|
16 |
See Chapter 5, Program Management, for more details on funding cycles at NIH. |
3.5
PHASE II APPLICATIONS
3.5.1
Success Rates
The average success rate over all years is approximately 55 percent, and there is no apparent trend in success rates.
3.5.2
Phase II—Resubmissions
Resubmissions are still an important part of the application and selection process during Phase II. As shown in Figure 3-19, approximately 30 percent of all Phase II applications are resubmissions. This percentage has remained steady in recent years.
These resubmissions can cause a substantial delay in the research of affected companies—in most cases of at least 8 months. Mechanisms for improving the initial selection process to reduce the number of applications where resubmission is needed to clear up minor difficulties should therefore be considered in order to reduce unnecessary delays.
Figure 3-20 shows that resubmission success rates are consistently lower than those for initial submissions. This is not surprising, as initial applications will include all applications, while resubmissions will not include the better applications because they were funded initially. It is not clear why this should be true for Phase II and not Phase I, however.
Success rates do fluctuate, ranging from a low of 15 percent of 1994 to a
TABLE 3-11 Phase II Success Rates, 1992-2005
|
Fiscal Year |
All Applications (#) |
Total Funded (#) |
Success Rate (%) |
|
1992 |
551 |
278 |
50.5 |
|
1993 |
637 |
360 |
56.5 |
|
1994 |
744 |
351 |
47.2 |
|
1995 |
780 |
370 |
47.4 |
|
1996 |
798 |
390 |
48.9 |
|
1997 |
800 |
468 |
58.5 |
|
1998 |
827 |
541 |
65.4 |
|
1999 |
897 |
539 |
60.1 |
|
2000 |
1,023 |
587 |
57.4 |
|
2001 |
1,074 |
683 |
63.6 |
|
2002 |
1,248 |
797 |
63.9 |
|
2003 |
1,299 |
788 |
60.7 |
|
2004 |
1,410 |
792 |
56.2 |
|
2005 |
1,451 |
774 |
53.3 |
|
SOURCE: National Institutes of Health. |
|||
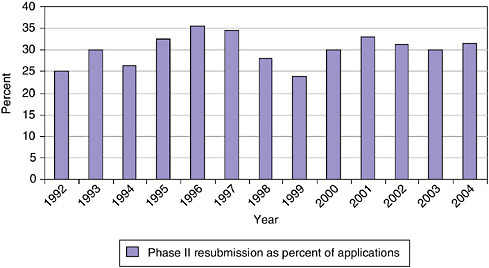
FIGURE 3-19 Phase II—Resubmission rates, 1992-2004.
SOURCE: National Institutes of Health.
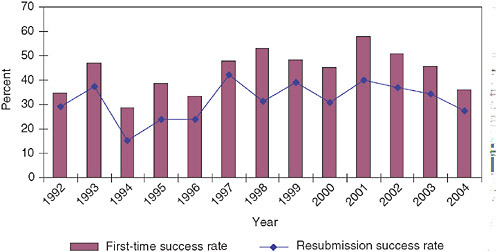
FIGURE 3-20 Phase II—Success rates for resubmitted and initial applications, 1992-2004.
SOURCE: National Institutes of Health.
high of 42 percent in 1997. Since 1997, resubmission success rates have trended downward to 27 percent in 2003. In recent years, changes in resubmission success rates have tracked quite closely with first-time success rates, though at a lower level.
3.6
CONTRACTS AT NIH
As noted earlier, more than 95 percent of all NIH SBIR awards are grants, not contracts. For Phase I in FY2000, there were 28 contracted Phase I awards, for a total of $2.4 million, in comparison to 969 Phase I grants totaling 114.1 million. Phase I contracts were 2.8 percent of all NIH Phase I SBIR awards. Contracts for Phase II are more prominent, accounting for 28 awards worth $9.1 million, while there were 267 grants totaling $119.7 million. Contracts were 9.75 percent of Phase II awards.
Total funding committed for Phase I contracts appears to have increased over time (mostly in line with the general increase in the size of Phase I from $50,000 to $100,000 in FY1998); the number of contracted awards has not increased. Updated to 2005, 42 contracts were awarded for a total value of about $5 million.
It is worth noting that Phase II contracts are relatively more important, accounting for 7.7 percent of all contracts and 5.5 percent of first-year commitments in FY2005. Also, it appears that companies winning Phase I contracts are much more likely to be selected for Phase II contracts than Phase I grantees are to be awarded a Phase II award. Updated to 2005, there were 28 contracts (out of 391 awards), for a total of $21.2 million (out of $409 million total).
3.7
PROGRAM ANNOUNCEMENTS AND REQUESTS FOR APPLICATIONS
NIH uses four different funding avenues to support extramural research.
-
Investigator-Initiated Research. Unsolicited: The investigator initiates the research and submits a award application within an area that is relevant to the NIH. Most applications for NIH support are unsolicited.
-
Program Announcement (PA). Solicited: NIH announces funding opportunities through award applications or cooperative agreements in a given research area representing a new, ongoing or expanded interest and/or high-priority program; Generally, no set-aside of funds, and applications submitted in response are often considered investigator-initiated in that the applicant has responsibility for the planning, direction, and execution of the proposed project.
-
Request for Applications (RFA). Solicited: NIH solicits research grant applications for a one-time competition on a specific topic. They describe an IC initiative in a well-defined scientific area to stimulate research in a priority area; SBIR funds are set aside to cover a certain number of awards.
-
Request for Proposals (RFP). Solicited: NIH solicits submissions of research proposals for a one-time competition on a specific IC topic. SBIR funds are set aside to cover a certain number of awards.
RFAs (grants/cooperative agreements) and RFPs (contracts) tend to be used more in problem-oriented research efforts, such as disease-specific programs, especially in their beginning stages (for example, in the early years of the War on Cancer and of research on AIDS and Alzheimer’s disease).
There has been an important procedural change with electronic submission of grant applications in that all applications must be submitted in response to a Funding Opportunity Announcement (FOA). FOA is Grants.gov’s terminology for what NIH refers to as Program Announcement (PA), Request for Application (RFA), Program Announcement with special receipt, referral and/or review consideration (PAR) and Program Announcement with a set aside (PAS).
NIH has issued Parent announcements for the SBIR and STTR program (and developed Omnibus Parent Announcements in November, 2005 for the December 2005 receipt date), for use by applicants who wish to submit, what were formerly termed, “unsolicited” applications. Responding to such an omnibus or umbrella Parent FOA ensures that the correct application package is used and enables NIH to receive the application from Grants.gov. This process in no way diminishes the interest of NIH Institutes and Centers in investigator-initiated, unsolicited research grant applications.
Thus an increased use in RFAs could indicate an ICs shift toward identifying key areas as “high priority.” However, PAs are, according to NIH staff, better
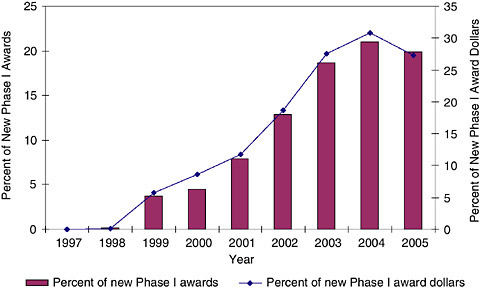
FIGURE 3-21 Phase I—Program announcements, 1997-2005.
SOURCE: National Institutes of Health.
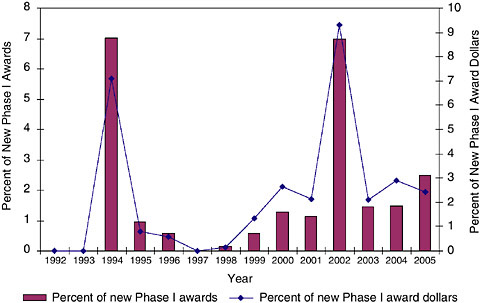
FIGURE 3-22 Phase I RFAs, 1992-2005.
SOURCE: National Institutes of Health.
understood as ways to articulate scientific areas NIH supports, but where all ideas are still investigator-initiated/investigator-driven.17
In fact, the data show that SBIR awards have increasingly come from PAs and RFAs. For Phase IIs, RFAs have been used for a minimal share of awards, reaching a maximum of less than 2 percent in 2004 and 2005. PAs have been more important. (See Figures 3-21, 3-22, and 3-23.)
The data show that overall, PAs have become an increasingly important component of the award flow within the NIH SBIR program, and that the trend suggests that this importance will continue to increase. This may be of particular importance as PAs can have extra funding or extra years of support attached to them.18
However, it is also apparent RFAs have remained of much lower importance. This is a significant difference, in that RFAs are much more heavily directed by
|
17 |
Jo Anne Goodnight, NIH SBIR Program Coordinator, Personal Communication, November 1, 2006. |
|
18 |
See for example the recent announcement seeking applications for “New Technology for Proteomics and Glycomics (SBIR [R43/R44])” (<http://grants.nih.gov/grants/guide/pa-files/PA-06-128.html>). This provides for up to two years, with $200,000 in support for each year for Phase I, and 4 years and up to $400,000 per year for Phase II. This award was simply the first announcement identified by Google. It was not selected because it was especially large or long term. |
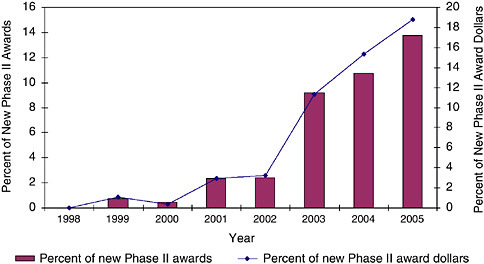
FIGURE 3-23 Phase II use of PAs at NIH, 1998-2005.
SOURCE: National Institutes of Health.
|
BOX 3-1 A Note on Data NIH data collection approaches presents some challenges for the purposes of this study. In principle, NIH collects data by award year—which means that each year of an award is separately identified within the database. There are occasionally difficulties in connecting every award year of each award, as grant ID numbers can change, as do other possible connecting fields such as company name and award title. As a result, we have for the purposes on this study developed approximations for award numbers and sizes. Numbers of Phase I awards are estimated by using the first year of SBIR support. Numbers of Phase II awards are estimated by using the second year of support where the award ID indicates that this is a Phase II award. Year two of Phase II support is estimated using year three of support where the award is Phase II, and year three of Phase II support is estimated using year four of support where the award is Phase II. These estimates are undoubtedly not completely accurate. Where companies have received a second year of support during Phase I, the third year of support could be only the first year of Phase II support. In a similar vein, we have generated estimates for average award size by adding the average for different years of Phase II support. It would facilitate future assessments if NIH would find ways to address these data difficulties as the agency refines its ongoing evaluation and assessment program. |
the agency—proposals made in response to PAs remain, in the words of the SBIR Program Coordinator, “viewed as investigator-initiated.”
The data suggest that NIH is moving quite cautiously toward a model where some funding is specifically allocated for agency-directed research, and a much larger amount of funding is distributed so as to encourage research in particular areas.


