
1
NASA and Applied Sciences
INTRODUCTION AND STUDY SCOPE
Images of Earth from space have become globally familiar and have permeated many aspects of daily life, from public school settings, where they are used as educational tools, to Internet map search programs that have become the modern way to locate oneself nearly anywhere on the globe. While numerous public and private space organizations around the world operate satellites that provide these remote sensing images, the National Aeronautics and Space Administration (NASA) was one of the first to collect these images on a regular basis and subsequently make its images generally freely accessible.
While Earth images are visually appealing and relatively easy to interpret at a basic level for the layperson (Figure 1.1a), many people do not realize the existence of a vast amount of important data, research, and models that accompany and underlie these images and are being collected simultaneously from space about Earth’s surface, oceans, and atmosphere (Figure 1.1b). These data and associated research provide key inputs to many public and private applications including weather forecasting, aviation, climate observations and modeling, famine early warning, monitoring of ocean current and surface conditions, agricultural planning, emergency planning and response, and natural hazard monitoring. NASA has decades of experience in application of its Earth observation data and research models to societal issues in these and other areas, usually working in conjunction with other federal agencies, academia, or the private sector.
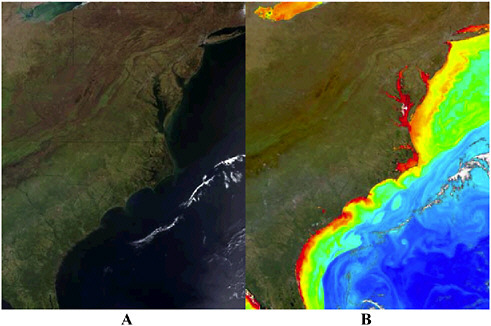
FIGURE 1.1 Sample data types collected with different NASA satellite sensors over the eastern seaboard of North America. (A) ”True color” image of data collected on April 13, 2003 with the MODIS (Moderate Resolution Imaging Spectroradiometer) instrument on the Terra satellite launched in 1999. (B) Phytoplankton pigment concentration data collected with the Sea-viewing Wide Field-of-view Sensor (SeaWiFS). This instrument captured the biological signature of the dynamic ocean surface conditions along the same part of the eastern coast of the United States as that in (A) also on Sunday, 13 April 2003. Both images are based on visible radiance (color) measurements collected in multiple bands with each sensor, but processed in different ways. The MODIS image combined three bands (red, green, and blue) so that the green vegetation of the Carolinas becomes apparent, while the Appalachian Mountains appear brown. The ocean in the SeaWiFS image was constructed using ratios between blue and green bands; this ratio becomes smaller with higher concentrations of marine phytoplankton or of colored riverine discharge in coastal zones. High biomass is indicated by reds and yellows, while greens and blues show lower biomass. Both sensors measured sunlight reflected from the Earth after being absorbed and scattered by the land or the ocean. SOURCE: (A) NASA Visible Earth–http://visibleearth.nasa.gov/view_rec.php?id=5292 (B) NASA Ocean Color Archive–http://oceancolor.gsfc.nasa.gov/cgi/image_archive.cgi?c=CHLOROPHYLL
While many portions of the NASA organization conduct applied research using Earth observation data, a specified unit within NASA has, since the 1970s, been tasked with ensuring the transfer of NASA Earth observation data and associated research into practical applications for society through external private and federal partnerships. The NASA Applied Sciences Program (ASP) currently fulfills this bridging role between NASA data and observations and external partners who apply those data. The ASP has operated in its present structure since 2001. Table 1.1 lists the historical predecessors to the current program. NASA’s draft plan for ASP was reviewed by the National Research Council (NRC, 2002a), and NASA refined its draft plan in response to the NRC report (NASA, 2004). This Earth Science Applications Plan
firmly established the background, structure, and goals of the program. One of the recommendations from the NRC (2002a) report was to allow the ASP several years to establish itself and allow projects to come to fruition before further external evaluation was undertaken. With a number of years having elapsed with the current ASP structure in place, and a growing, government-wide emphasis on societal benefits in its Earth-observing system programs, NASA and ASP leadership asked the NRC in 2005 to form an ad hoc committee to assess their approach to extending research results to practical, societal applications (Box 1.1). In response to this request the NRC established the Committee on Extending Observations and Research Results to Practical Applications (Appendix A). This report is the committee’s response to that request. The committee’s process and report structure are described at the close of this chapter.
The committee notes two important distinctions regarding “basic” and “applied” research at NASA. Basic remote sensing research develops and uses NASA remote sensing data to obtain new knowledge about how to do something; for example, in an attempt to link vegetation to the climate and weather in an area, recognition of the regional changes in leaves and foliation might be important. Basic research at NASA might focus on how to design a satellite sensor that measures the appropriate indices of leaves to differentiate various characteristics of the vegetation that may not be obvious from standard visual photograph. Applied remote sensing research uses remote sensing data, such as the results from the basic research project on foliation, to provide information that is valuable for a specific task like predicting agricultural crop production or drought early warning. Because NASA’s mandate does not usually allow it to put its research results or data directly into practice, applied remote sensing usually requires NASA to partner with another federal agency or nongovernment entity to use the NASA observations for these practical applications. While basic and applied research occur throughout the NASA organization and often in conjunction with each other, the distinction between the two is important to understanding how NASA engages partners to employ its Earth data and results in societal applications.
|
BOX 1.1 Statement of Task The Committee will examine NASA’s Applied Sciences Program and
The review will focus on NASA’s overall approach at the level of the Applied Sciences Program, not on the many specific projects within the program. |
CONTEMPORARY GOVERNMENTWIDE EMPHASES AFFECTING NASA’S APPROACH TO APPLICATIONS
The Executive Branch under President George W. Bush has strongly emphasized decision support in its science and technology (S&T) programs, in general, and environmental programs, in particular. This focus is on assuring and documenting benefits for society from investments of taxpayer dollars in public science and technology programs. “Benefits” are interpreted to represent a value in terms of better policy and decision making, associated not only with federal agencies but also with U.S. society, more broadly.
Since 2001 this emphasis has been expressed very clearly in the Administration’s two main environmental programs:
-
The U.S. Group on Earth Observations (US GEO [http://usgeo.gov/]) is an interagency working group with participation from 15 member agencies, including NASA (and ASP), and three White House offices. US GEO is associated with the international agreement to support a Global Earth Observing System of Systems (GEOSS). The U.S. contribution to GEOSS is the Integrated Earth Observation System (IEOS). GEOSS aims to deliver global social benefits in nine subject areas (http://www.earthobservations.org/progress/societal_benefits/societal_benefits.html).
-
The interagency Climate Change Science Program (CCSP), pursuant to the Global Change Research Act of 1990, which has defined five goals, one of which is decision support (http://www.climatescience.gov/). CCSP focused its 2005 national workshop on the issue of climate science for decision support.
This emphasis became clear a few years ago when NASA assumed an active role in these interagency programs for two reasons:
-
Since its infancy in the 1950s NASA has focused its organizational practices on applying S&T to meet mission agency needs. Its space programs are one of the nation’s best examples of applying S&T to support specific decisions and implementing them successfully.
-
Partly because of its organizational history, which has been more focused on tangible outcomes, NASA has developed an organizational style that is mission oriented and decisive. As a result, while other agencies were trying to ascertain what decision support means and how seriously it should be taken, NASA established a top-down definition of needs rooted in a culture of aerospace engineering, with elaborate road mapping of goals and implementation strategies.
NASA’s dominant paradigm has thus been embodied in strategy documents for both US GEO and CCSP. This deep integration in these large programs is somewhat at odds with policy constraints that seem to limit NASA to providing data, technology, and models to other agencies (other users) that are responsible for operational aspects of remote sensing systems and are also the direct providers of decision support (see, for example, U.S. National Space Policy, August 2006, http://www.ostp.gov/html/US%20National%20Space%20Policy.pdf). If NASA is limited to providing products rather than directly assuring outcomes, it not only is kept at a distance from desirable outcomes, for which others can obtain most of the credit, but its social value depends on the performance of others. A recent NRC report (NRC, 2007a), henceforth called the “Decadal Study”, was prepared by the Committee on Earth Science and Applications from Space: A Community Assessment and Strategy for the Future. The Decadal Study (NRC, 2007a) recommended the primary issues that NASA should consider during the next decade in applying its Earth data and research to achieve societal benefits. Some of these recommendations have direct relevance for ASP; these are examined briefly in this chapter.
RECENT NRC FEEDBACK TO NASA ON EARTH SCIENCE AND APPLICATIONS FROM SPACE
The Decadal Study (NRC, 2007a) contains visions, discussion, and recommendations that will influence the context and nature of ASP operations. “Understanding the complex, changing planet on which we live, how it supports life, and how human activities affect its ability to do so in the future is one of the greatest intellectual challenges facing humanity. It is also one of the most important challenges for society as it seeks to achieve prosperity, health, and sustainability” (NRC, 2007a, p. 1). These declarations are the foundation of the report’s “Decadal Vision” of a program of Earth science research and applications in support of society, a vision that includes advances in fundamental understanding of Earth and increased application of this understanding to serve the nation and the world. The declarations call for a renewal of the national commitment to a program of Earth observations from space in which practical benefits to humankind play an equal role with the quest to acquire new knowledge about Earth. The Decadal Study supports its discussion by connecting some of its recommended Earth science missions to societal benefits in areas like human health, extreme event warnings, earthquake early warnings, improved weather prediction, sea level rise, climate prediction, freshwater availability, ecosystem services, and air quality.
To fulfill its Decadal Vision the report recommends that “the United States government, working in concert with the private sector, academia, the public, and our international partners, should renew its investment in Earth observing systems and restore its leadership in Earth science and applications.” (NRC, 2007a, p. 3) The report further states that “a fundamental challenge for the coming decade is to ensure that established societal needs help guide scientific priorities more effectively, and that emerging scientific knowledge is actively applied to obtain societal benefits. New observations, analyses, better interpretive understanding, enhanced predictive models, broadened community participation, and improved means for information dissemination and use are all required” (NRC, 2007a, p. 4).
One Decadal Study panel identified potentially useful actions for realizing societal benefits from Earth observations through scientific research and application development (Chapter 5, NRC, 2007a). These actions include incorporating the applications community in planning phases of space missions, directly incorporating social scientists and studies from the social science literature in all phases of the mission planning cycle, developing better relationships between the basic and applied sciences communities, facilitating better community access to NASA data
and products, and enhancing education and training of potential users of Earth data and information.
The panel also identified a desire for a greater number of successful applications to arise by design rather than serendipity. They noted particularly that lack of knowledge or experience in understanding the needs, organizational structures, and abilities of potential users inhibits the design of successful applications. Part of the process to involve the nonfederal community in agency planning cycles for applications and to ensure that the needs or requirements of user communities are met is to establish more comprehensive and formalized communication and feedback between the communities and federal agencies, including NASA. The panel recognizes that “an overall Earth science strategy that merges scientific research and societal application must acknowledge that different research and operational applications will require different approaches to measurement, and provide a means of optimizing potential benefits against available resources for the total observing system.” Statements of this nature have direct relevance for the ASP and its activities.
HISTORICAL CONTEXT
A chronology of applied sciences at NASA covers nearly 50 years and is important to understanding applied sciences at NASA, generally, and the ASP, today (Table 1.1). Applications at NASA have manifested themselves through multiple administrations and programs, some of which were explicitly aimed at applications, while others were not. NASA’s applications programs since the late 1950s developed during five relatively distinct eras (Table 1.1).
NASA’s Charge to Extend the Benefits of Space to the Community: 1958
The enabling NASA applications or applied science legislation emerged in 1958 when language was crafted to “extend benefits of space to the community” (http://www.nasa.gov/offices/ogc/about/space_act1.html). Applications to benefit the community are implicit in this language even though NASA is an organization responsible for space and aeronautics research, technology development, and associated data collection and is not tasked to conduct operations and decision-support functions.
Table 1.1 NASA Earth Science Applications from 1958 to 2007
Suborbital Earth Remote Sensing Applications Era: 1960-1971
NASA-funded applied research on suborbital Earth remote sensing research in this period was conducted primarily at academic research
centers (for example, Laboratory for Applications of Remote Sensing at Purdue University; the Willow Run Laboratory at the Environmental Research Institute of Michigan; the Forestry Department at the University of California, Berkeley and other centers at the University of California, Davis, Riverside, and Santa Barbara (Estes and Jensen, 1998)). Scientists at these laboratories worked closely with national, regional, and local government agencies. Initially they worked with high spatial resolution multispectral data from aircraft-mounted sensors and developed digital image processing algorithms to extract useful information. Progress on this research prompted the U.S. Geological Survey (USGS) and NASA to develop a satellite remote sensing system that could be used for Earth resource applications: the Earth Resource Technology Satellite (ERTS).
Earth Resource Technology Satellite (Landsat) Transfer Era: 1972-1982
The launch of the ERTS (later renamed “Landsat”) in 1972 provided the greatest impetus for applied remote sensing research in the 20th century. Its launch was followed by additional Landsat launches through 1999. Landsat satellites were launched in 1975, 1978, 1982 (Landsat 4 Thematic Mapper [TM]), 1984 (Landsat 5 TM), 1993 (Landsat 6, which did not achieve orbit), and 1999 (Landsat 7 ETM+). Some of the most important NASA-sponsored applied remote sensing demonstration projects were conducted over the first decade after Landsat’s initial launch (Box 1.2), and this period generated significant grassroots interest in and excitement about remote sensing technology. In 1977, for example, the NASA Ames Western Regional Applications Program developed a mobile laboratory that traveled throughout the United States demonstrating remote sensing (especially Landsat) applications to state and local agencies. Owing at least in part to this initial introduction to remote sensing and similar contributions from programs in NASA’s Office of University Affairs, the universities and some regional users in Arizona, California, Georgia, Nevada, South Carolina, Utah, Indiana, Kansas, and South Dakota became robust users of remote sensor data, and had an encouraging effect on their state governments to begin employing remote sensor data with more regularity.
|
BOX 1.2 Large Area Crop Inventory Experiment (LACIE) The LACIE was a NASA-U.S. Department of Agriculture (USDA) partnership established to use Landsat data to conduct foreign crop inventories. It was initiated in 1974 after a poor grain harvest in the Soviet Union. The United States had been unaware of the Soviet harvest problem, and was unprepared for the Soviet purchase of surplus wheat, which significantly affected the global wheat price and the accessibility of this primary crop. Remotely sensed data collected on global crop inventories was subsequently used to assess future markets and trading, functions which are today manifested in the activities of the USDA’s Foreign Agricultural Service (http://www.fas.usda.gov/). |
Technology transfer was the theme of two programmatic emphases during this period: (1) Beginning in 1973 NASA and the National Oceanic and Atmospheric Administration (NOAA) partnered on the Operational Satellite Improvement Program (OSIP) in which NASA developed prototype sensors, flew them on aircraft, transferred them to research spacecraft for evaluation, and then provided successful instruments to NOAA for transition to operational status (NRC, 2003). (2) The second program was directed to university applications and was initiated in 1971, prior to Landsat’s launch. Using Landsat data, this program engaged university centers in research projects with state and local governments. NASA’s Office of University Affairs (OUA) played a significant role in promoting Earth resource applications at this time. From 1975 to 1978 OUA operated four programs oriented toward applications with: (1) state and local governments (for example, departments of natural resources and environment), (2) federal departments (for example, USDA and the Department of the Interior), (3) the private sector (for example, forestry, oil and gas, utilities), and (4) international partners.
In 1978 these four programs were reorganized and redefined into four new programs: University Applications, User Requirements and Awareness, Application System Verification and Transfer, and Regional Applications (Box 1.3). These programs operated until 1982 when applied science as a distinct program or concept at NASA was largely phased out. OSIP was also cancelled in 1982 because of NASA budget pressures and a desire on the part of the Office of Management and Budget to offload “routine” functions from NASA (NRC, 2003) (see also Chapter 3).
|
BOX 1.3 Programs at NASA’s Office of University Affairs Between 1978 and 1982 University Applications. NASA established grants with 30 to 50 universities nationwide to support university remote-sensing research and infuse university research programs with NASA technology. The research grants allowed students to learn about remote sensing technology and contribute to remote sensing science. Many of these students are now major influences in the remote sensing field. User Requirements and Awareness. Cognizant that its technology was not reaching the broader community, NASA reached out to the community to understand its needs. In parallel NASA used many avenues to improve public awareness of its science through brochures, letters, county associations, the National Governors Association, and the media, among many approaches. Application System Verification and Transfer. This program matched NASA technology to applications and verified the success through use by federal and nonfederal users. In addition to direct investment NASA headquarters funded applications projects with the Environmental Protection Agency and the Department of the Interior, for example. Regional Applications. This program was oriented toward state and local governments and was conducted through the regional NASA centers (Ames, Marshall, Goddard, and Stennis). |
Era of Limited Applications Research: 1982-1994
University Applications was the only program element (Box 1.3) that continued through this period. The program element remains today, having survived all subsequent manifestations and reorganizations of applied sciences. NASA did not pursue partnerships with federal, state, or local government agencies again until 1992.
In general, NASA support for applied remote sensing research fluctuated from 1982 to 1994, and NASA management migrated to a philosophy of trying to understand or measure biophysical phenomena rather than focus on data collection and research for specific societal applications. NASA headquarters promoted a basic research program in which global Earth science proposals were driven by NASA employees. Applications typically had an engineering focus and often were not sustained after transfer to users, in part because NASA’s unique level of engineering expertise could not be carried over to other partners or users.
Mission to Planet Earth and Earth Science Enterprise Era: 1994-2001
Applied Sciences in a programmatic format similar to today’s approach is about a decade old. Applications during this era slowly revitalized through NASA’s university program, which worked with nonfederal as well as federal partners. The philosophy of the program was to build a bridge between NASA and research community partners. The main links to state and local users were established through regional associations rather than individual states or local groups.
Starting in the mid-1990s scientists could also obtain applied remote sensing science funding through the Mission to Planet Earth Program from NASA headquarters—primarily through ad hoc application or through a few national solicitations. The balance of applied versus basic funding from Congress gradually increased from pre-1994 levels. Congress in this period was interested in obtaining nearer-term results that could more readily be tied to local needs.
During this era, and separate from the main applications program, scientists at Stennis Space Center in Mississippi developed an applied Commercial Remote Sensing Program Office (CRSPO) (Davis and Macaulay, 2000) (Box 1.4). The goal of the program was to help university scientists to work with the commercial sector to use remote sensing-data (hopefully of NASA origin) in commercial products. The program led to the incorporation of remote sensing data in many companies product lines (for example, Fluor Daniel, Bell South, Westvaco Paper Co., Westinghouse, International Paper Company, Sun Microsystems, Norfolk Southern).
In 1997 CRSPO and the applications program were merged under a new Applications, Commercial, and Education (ACE) Division. This was one of four divisions in the newly created Earth Science Enterprise (ESE) that replaced the Mission to Planet Earth. Another division in ESE—the Research Division—also funded applications. ACE partnered with this and other NASA divisions and centers on projects of mutual interest.
|
BOX 1.4 NASA’s Commercial Remote Sensing Program With funding from NASA headquarters and congressional earmarks, the Commercial Remote Sensing Program Office (CRSPO) at Stennis Space Center focused on developing a working relationship among academic institutions (referred to as NASA Affiliate Research Centers), NASA centers, and commercial firms. In addition, CRSPO administered a $50 million congressionally directed program to purchase commercial Earth science data to support and accelerate progress in Earth research applications (NASA, 1999). A further $20 million was dedicated to evaluation of various types of NASA scientific data. NASA scientists were encouraged to use commercial data for research, and they continue to do so today. |
To determine its high-priority themes, ACE relied heavily on an advisory committee (the Applications Steering Committee), the National Academies, and input from a broad-ranging user community. Feedback was a key element of the communication between NASA and the nonfederal sector at this time. NASA focused on community meetings (for example, regional and local workshops, town hall meetings) where state and local participants, regional associations, and the private sector could present their issues, needs, and ideas, and NASA managers and scientists could develop solutions with these groups. This process gave participants the opportunity to become stakeholders with a direct interest in the future of the program. Community meetings with state and local participants in the late 1990s and early 2000s provided the initial ideas for what are now the “12 Applications of National Priority” for ASP. Examples of these approaches are presented at: http://geospatial.arid.arizona.edu/slg/ and http://www.state.hi.us/dbedt/gis/nasa.htm. The 12 applications areas are discussed in Chapter 2.
Applications-related projects at NASA in this period were perceived by some as very successful in reaching the general public through regional and local projects with good feedback from this community. NASA’s implementation of its applications program at this point has been characterized as using a bottom-up, or demand-driven, approach (NRC, 1995), in contrast with the concurrent, centralized Earth Observing System Data and Information System data distribution model. Despite the apparent successes of aspects of this demand-driven approach, the applied sciences at NASA were viewed by a number of people, internal and external to NASA, as a collection of projects distributed throughout NASA without a clear focus or direct connections to NASA's basic research programs. The absence of an official structure at the national level to coordinate and communicate with operational agencies also was criticized, particularly as concerns arose over potential duplication of efforts by several agencies.
The new approach with the ASP adopted by NASA in 2001 could arguably be described as being closer to a supply-driven, or top-down, model. With this new approach to applied sciences, NASA sought to clarify the practical benefits of NASA Earth science and reduce perceived and real duplication of effort with other federal agencies. Under the new approach regional programs were phased out and state and local entities, while not excluded, were not explicitly included in project development or implementation. In addition, the emphasis of the ASP moved from university partnerships to partnerships with federal agency programs. The new approach of ASP is described in the next chapter.
COMMITTEE APPROACH AND REPORT ROADMAP
The committee consisted of 12 individuals with diverse backgrounds and expertise in generating and applying remote sensing data in decision-support projects, with a balance of end users of decision-support tools and products, researchers producing results incorporated in the decision-making tools, and scientists with experience in determining the types of information and tools that end users need. Committee member backgrounds included geography, sustainable development, energy and environmental policy, population and community ecology, meteorology, risk assessment and engineering design, remote sensing and spatial information, cryospheric observations and climate change, marine sciences, statistics, resource management, and population health (Appendix A). To address the statement of task, the committee reviewed relevant NRC reports and information submitted by external sources, including presentations at open meetings, published reports and other literature, and information from the committee’s own experience. NASA ASP was also asked to provide specific types of data and information to the committee and complied with the committee’s request (Appendix B).
The committee held four meetings in Washington, D.C., in 2006 (Appendix C) and completed its report in 2007. Its first three meetings focused on gathering information. At the first meeting, in January 2006, the committee heard from the study sponsor and representatives from the user community. At the second meeting in April 2006, the one-day panel discussed the NASA-NOAA partnership and academic and private-sector perspectives on use of NASA data for decision support in aviation, weather, and oceans. The final open meeting, in July 2006, extended the panel discussions to a broad spectrum of users of NASA data, with contributions from five federal agencies and five nonfederal user groups. At its closed meeting, in October 2006, the committee shaped its recommendations and the report.
This chapter has summarized the background to the study by placing the NASA ASP in context of the broader federal and NASA framework within which ASP operates, the important national programs that are current drivers of applications beneficial to society, and the historical development of applied sciences at NASA. Chapter 2 examines the approach used by ASP to extend data into operations and decision support (item 1 of this committee’s task). Chapter 3 describes ASP’s partnerships with federal agencies (item 2 of this committee’s task). Chapter 4 discusses ASP’s interactions with nonfederal users (item 3 of this committee’s task). Chapter 5 presents issues in achieving ASP’s objectives (and examines item 4 of the committee’s task, as well as portions of
the other three tasks). Chapter 6 presents the committee’s conclusions and recommendations.
This report is intended primarily for the sponsor of the study, NASA and the ASP, to provide constructive evaluation of ASP’s approach to extending NASA Earth data and research to decision-support systems with societal applications. However, open communication between providers of Earth data, operators of decision-support tools that employ the data, and eventual recipients of the results from these tools is an implicit part of achieving societal benefits. Thus, this report is also written to be accessible to the broad community of decision makers, remotely sensed data users, and regional and local users who help stimulate new ideas for research in practical applications of Earth data.


