
7
Ocean Dynamics and Energy Transfer: Some Examples of Climatic Effects
D. JAMES BAKER, JR.
University of Washington
7.1
INTRODUCTION
Over the long periods pertinent to climate variability, the ocean’s large heat capacity and energy storage temper and modify the atmosphere, which in turn affects the ocean. Cause and effect are not easy to distinguish in the dynamics of this coupled system. Since the ocean responds to external changes more slowly and on smaller space scales than the atmosphere, the interaction and feedback processes are difficult to observe and to model.
These points are noted in Chapters 6 and 9, in which it is pointed out that one of the real shortcomings of the existing climate models is the lack of an adequate parameterization of oceanic processes. In spite of a greatly increased effort in both observation and modeling of the ocean in the past few years, we do not yet have models that could yield the necessary parameterizations.
Thus the oceanographer is faced with an especially difficult task when asked to contribute to the topic of this volume. Oceanographers are now engaged in trying to learn which ocean processes are essential to climate dynamics and how to monitor these in an effective way. We are, therefore, one step removed from the question of how to monitor man’s effect on these processes. One particularly good example of our basic lack of knowledge here is given in Section 7.2 below.
The second point to be made is that man’s effects on oceanic processes through increased use of energy are apparently negligible, at least in terms of ratios of estimated energy production (see Chapters 1 and 6) to total energy involved in particular natural phenomena. However, we must keep in mind the fact that large-scale fluid flow in nature tends to be unstable: that is, small changes can have large effects. Through man’s influence, a relatively small amount of energy could be magnified drastically by the release, via flow instability, of available energy in the system.
In any case, it is clear that the subject of ocean dynamics and the interaction of the ocean with the atmosphere must be pursued vigorously if w e are to gain a practical understanding of climate and man’s influence on it. Note that the question of the global cycle of CO2, including the interaction of CO2 with the ocean, has been covered in Chapter 4.
To illustrate the role of the ocean in global climate dynamics, and to show how ocean processes may be involved in local
climate change, I have chosen to describe a few examples below. Man’s potential effect is noted where possible. I suspect that the reader will find the resulting story somewhat qualitative and unsatisfactory, especially when compared with the quantitative results quoted in the preceding chapters. If so, I have made my point—that the subject is important, our knowledge is poor, and much work remains to be done.
In view of the existence of other reports (IOS, 1969; Ocean Sciences Committee, 1975), which already suggest a plan of action for study of the role of the ocean in global climate dynamics, I shall not outline here a plan for global ocean monitoring but conclude the chapter with a few general remarks only. The reader is referred to the relevant sections of those reports for details. I also note that the Global Atmospheric Research Program, as it continues into the 1980’s, will include a substantial oceanic component aimed at its objective of understanding the physical basis of climate (Joint Organizing Committee for GARP, 1975; U.S. Committee for the Global Atmospheric Research Program, 1975).
7.2
THE OCEAN IN THE GLOBAL ENERGY BALANCE
Radiation data from satellite measurements (Vonder Haar and Oort, 1973 and Figure 7.1) reveal the significant share of heat carried by the ocean in the global energy balance. The ocean transport has been estimated here by subtracting the known atmospheric heat transport from the total required to balance the net loss of heat at the poles. The ocean transport appears to be dominant at low latitudes and midlatitudes even within the measurement uncertainty. Since the transport is a significant component of the global energy balance, its monitoring is an essential element of a climate-prediction system. Unfortunately, we do not yet know enough about the general circulation of the ocean to devise a practical global monitoring scheme. The heat could be carried by mean circulation, wind drift, or eddy processes, but we do not know the relative importance of these. [See Bryan (1962) for a careful discussion of the problems of measuring meridional heat transport in the ocean.]
Our knowledge of the general circulation of the ocean suggests that the heat could be transported northward by the great western boundary currents of the ocean like the Gulf Stream or the Kuroshio current: a stream of water flowing with a speed of 0.5 m/sec, 100 km wide, and 1 km deep represents a potential heat flux of 2 × 10⁸ MW per °C of temperature difference from the surroundings. Only a few such fluxes would make up the necessary total. The variations of these currents could be significant; for example, observations by Niiler and Richardson (1973) show that the seasonal variability of the northward heat transport by the Florida current is 3 × 10⁸ MW (half-amplitude). Even though it is difficult to calculate the magnitude of this variability unambiguously (Montgomery, 1974; Niiler and Richardson, 1974), its importance seems established.
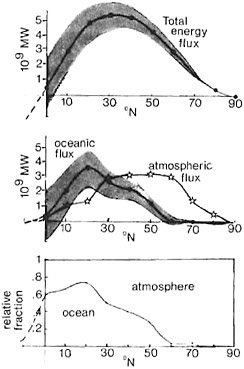
FIGURE 7.1 Variation of net energy transport with latitude over the northern hemisphere [from Vonder Haar and Oort (1973)]. The shading represents uncertainties in the satellite measurements. For reference in magnitudes, recall that the energy input to the atmosphere from a cyclone is about 108 MW (see Chapter 5).
If man can influence these western boundary currents, he could affect the overall heat balance. For example, consider a nuclear power park located in a western boundary current for cooling. Since a large power park represents an energy input of about 4 × 10⁴ MW (see Chapter 5), it appears that the change in total heat transport of the western boundary current would be negligible. However, the park could raise the local temperature. For example, a park 25 km2 by 100 m deep dissipating 40,000 MW could raise the local temperature by 1°C in about 3–10 days depending on the rate of flow of cooling water. If this thermal anomaly were advected northward, its eventual communication with the atmosphere in the western boundary current extension regions to the north could lead to local heating and increased cloud formation and precipitation. Local heating could be avoided by using deep cold water as coolant, raising its temperature only to the local surface temperature. Then the current would be changed in mass, and hence total heat transport would be changed also. Some quantitative modeling is required here.
The suggestion that the kinetic energy of these strong ocean currents could be used to generate electric power by the use of turbine arrays has been raised frequently. Von Arx, Stewart, and Apel (Stewart, 1974) estimate the effect on the Gulf Stream near the coast of Florida of extracting
energy for electrical power by use of such arrays. They suggest that a reasonable turbine array could yield about 1000 MW, a significant contribution to the local power requirements. Since the total kinetic energy of the current here is about 25,000 MW, the turbine array would extract at least 4 percent of the kinetic energy. Unfortunately, we do not know the effect of such an extraction on the Gulf Stream dynamics. It could be important because of the potential sensitivity of the meandering path of such western boundary currents to local changes (see below) and the possible importance of that path to air-sea exchange in the subpolar regions. Further modeling and observational studies are clearly required.
The fluctuating motion in the ocean (various kinds of “eddies”) could also transport heat just as heat is transported by atmospheric eddies. Such ocean fluctuations also include the large-scale sea-surface thermal anomalies and the deeper energetic motions. Newton (1961) has calculated that a single Gulf Stream eddy could transfer as much as 5 × 10⁷ MW from the ocean to the atmosphere. Thus not many eddies are required in order to achieve the necessary heat transfer.
Holland and Lin (1975) have shown in a numerical model that meandering eddies in the Gulf Stream seem to drive large transports in the deep water under the Gulf Stream. These transports result in a heat flux toward the south, but the magnitude of this flux in the real ocean is not known. As mentioned earlier, both observational and modeling studies will be required to establish the importance of these processes.
The large sea-surface temperature anomalies in the ocean described by Namias and others (e.g., see Namias, 1972) are demonstrably linked to climate variability. However, it is unlikely that man-made energy sources will be able to either affect these anomalies or have effects similar in magnitude. For example, a 40,000-MW power park would generate 4 × 10¹⁷ J/year; the heat stored in a typical sea-surface temperature anomaly (5000 km × 1000 km × 100m, 1/2°C different from surroundings) is about 8 × 10²⁰ J.
Locally, such a park has a power dissipation of about 64 W/m2, which is comparable with the components of the surface energy balance over the ocean [for example, the fluxes of radiation, sensible heat, and latent heat in different regions of the ocean are estimated to lie in the range 0 to 500 W/m2 (Sellers, 1965)]. However, the small size of a single park compared with the area of the effective heat-transfer regions of the ocean suggests that the global climatic effect will be negligible. Large numbers of such parks could have a more important effect.
We have discussed heat dissipation in the upper layers. A second point is the interaction of the ocean with increased CO2 in the atmosphere. The positive feedback process, in creased CO2 in atmosphere ![]() increased heating of ocean
increased heating of ocean ![]() less absorption of CO2 in ocean
less absorption of CO2 in ocean ![]() increased CO2 in atmosphere, has been suggested. W. Broecker of Lamont-Doherty Geological Observatory, Columbia University (private communication) has pointed out that the ability of the ocean to absorb excess CO2 is not dependent on temperature in any significant way. The feedback effect does exist, but its magnitude is apparently small enough to be ignored according to our current knowledge of ocean dynamics. Such a process could have a significant effect if a general warming greatly reduced vertical mixing in the ocean. In that case, the surface layers would be cooled less by the deep ocean and heated more by the atmospheric warming associated with an increase in CO2.
increased CO2 in atmosphere, has been suggested. W. Broecker of Lamont-Doherty Geological Observatory, Columbia University (private communication) has pointed out that the ability of the ocean to absorb excess CO2 is not dependent on temperature in any significant way. The feedback effect does exist, but its magnitude is apparently small enough to be ignored according to our current knowledge of ocean dynamics. Such a process could have a significant effect if a general warming greatly reduced vertical mixing in the ocean. In that case, the surface layers would be cooled less by the deep ocean and heated more by the atmospheric warming associated with an increase in CO2.
7.3
THE OCEAN AND THE LOCAL ENERGY BALANCE
The ocean currents can also have a major effect on local climate. Our example here is the Kuroshio current. Figure 7.2 (Robinson and Taft, 1972) shows how this current occasionally takes a path that loops south of the island of Honshu instead of hugging the coast. The periods when the current loops are associated with lower temperatures, decreased rainfall, and poor rice crops in northern Japan (Uda, 1964).
Could or does man have an effect on this variability of the path of the current? The numerical study of the local dynamics of the Kuroshio (Robinson and Taft, 1972) shows that important contributions to the guiding of the path are the bottom velocity and the bottom topography of the local seabed. Relatively minor changes of either could reguide the path.
It is unlikely, however, that man would have a direct effect on either of those two parameters. It is possible that he could affect the path through the influence of local air-sea interaction: increased convection over land could lead to stronger onshore winds. The warm surface water would then tend to be pushed closer to the coast, thus stabilizing the more productive of the two states.
Such arguments must be viewed with some caution, how ever, if we recall the difficulties of predicting El Niño (warm currents off the coast of Peru), which apparently exhibits links with more global phenomena (Quinn, 1974; Wyrtki, 1973).
7.4
OCEAN HEAT TRANSPORT: THE ARCTIC BASIN
Most climate models (e.g., see Kellogg, 1974) show sensitivity to the size of the Arctic ice pack. This is understandable, because the existence of the ice causes a drastic change in the surface albedo and thus the surface heat balance. But the surface heat balance is also determined by the amount of heat advected in by ocean currents and the amount of ice exported.
As we noted above, the magnitude of the ocean heat transport into the Arctic basin is relatively small, about 7 × 10⁷ MW (Aagaard et al., 1973). However, the input from the ocean is crucial to the size of the Arctic ice pack. The more heat that is brought into the ocean, the thinner the pack.
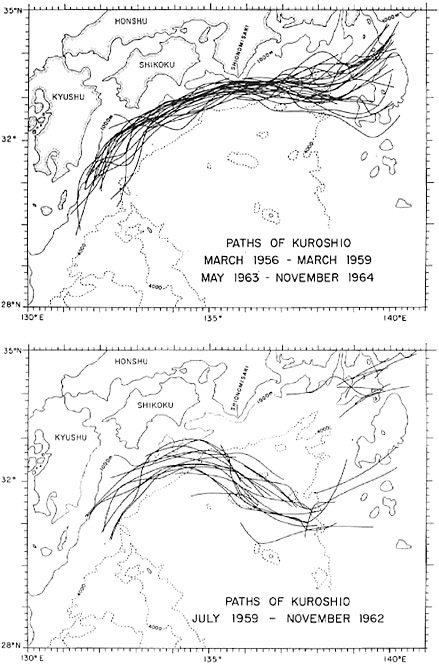
FIGURE 7.2 Composite of slope paths for two periods. The 1000-m and 4000-m isobaths are shown. Composite of meander paths for one period. The 1000-m and 4000-m isobaths are shown.
Most of the heat is transported in through the passage between Greenland and Spitsbergen: a relatively cold (the Greenland) current out, and a relatively warm (the West Spitsbergen) current in. The final contribution to the heat input is the ice export between Greenland and Scandinavia.
A recent study of the water, heat, and ice budgets (Aagaard and Greisman, 1975) based on a year-long deployment of instruments in the Greenland-Spitsbergen passage shows a heat transport larger than that apparently required to melt the Arctic ice pack. The uncertainties from both the measurements and the ice pack models (Maykut and Untersteiner, 1971) make such a conclusion more provocative than definite. However, it does show the sensitivity of this element of climate variability to ocean dynamics and the importance of long-term measurements here.
The influence of man’s increased use of energy is not yet clear in this region. The magnitude of heat input from one large power park, about 4 × 10⁴ MW, is still too small
to have any apparent significant effect on the total heat input to the Arctic basin. Our knowledge of the basic dynamics and stability of the air-sea-ice system is still too crude, however, to draw any further conclusions.
7.5
RIVER RUNOFF AND THE ARCTIC ICE PACK
Man can produce local climate changes by diverting rivers. In response to chronic flooding of the western Siberian taiga, there have been Soviet proposals to divert south-ward the Ob and the Yenisei. These rivers discharge onto the shelf bordering the southern Eurasian basin. The magnitude of such an engineering task is enormous, but it is of interest to note potential climatic effects.
Aagaard and Coachman (1975) have pointed out that the relatively small accumulation of freshwater in the southern Eurasian basin is an important feature, because the shallow and weak salinity gradient forms a lid on the warmest and most saline water in the Arctic Ocean. Their heat-budget studies indicate that even under the present conditions of salinity stratification, the upward heat flux from the deep water is an order of magnitude larger in this local region than in the Arctic Ocean as a whole. They note that were the thin veneer of freshwater to be substantially removed in this sensitive area, the high sensible heat content of the Atlantic water could become more readily available for surface exchange. In the absence of other feedback mechanisms, this could lead to prolonged icefree conditions because of the deep-reaching convection in the Arctic Ocean.
The sensitivity of even this simplified system to possible man-made influence shows clearly the need for a correct Arctic Ocean air-sea-ice interaction model.
7.6
OIL SPILLS AND THE ARCTIC ALBEDO
In man’s increased use of energy, the potential of oil spills increases. The effect of these spills and of natural seepage has been the subject of much published literature. However, we do not know yet the quantitative effects of this change in surface properties of the ocean on the climate. One example has been suggested by Campbell and Martin (1973). They note that the slow rate of biological degradation of oil at near-zero temperatures has led biologists to suggest that oil spills in the Arctic Ocean might remain there for periods of 50 years or more. Campbell and Martin point out that the dynamics of the ice pack combined with the long life of the oil could allow an oil spill to have a major effect on the albedo in certain regions of the Arctic. They estimate that the transit time of an oil spill on the fringes of the Beaufort Sea around the circumference of the Beaufort gyre would be about 7–10 years. Several mechanisms act both to diffuse the oil and to put the oil on the surface of the ice. Therefore, as the source continued its journey, the area affected by the spill would grow. By the time the original spill site returned to its original approximate geographic coordinates, a considerable area of the Beaufort Sea could have its albedo changed.
The significance of the resultant albedo change for the Arctic heat balance is moot (Ayers et al., Martin and Campbell, 1974), but most scientists agree that the Arctic environment will require special precautions to minimize the risks of accidental oil spills. Man’s increased use of resources in the Arctic will be primarily aimed at obtaining oil for energy: the potential effect on the Arctic heat balance due to changing albedo must be studied together with the more basic environmental studies carried on there.
7.7
OCEAN MONITORING FOR EFFECTS OF INCREASED ENERGY USE
As mentioned above, recommendations for global ocean monitoring are listed in the references (IOS, 1969; Joint Organizing Committee for GARP, 1975; Ocean Sciences Committee, 1975; U.S. Committee for the Global Atmospheric Research Program, 1975) and will not be repeated here. It is of interest to note, however, that satellite monitoring (Allison et al., 1975) is beginning to come into its own now and that it will be of use for both local and global measurements. Figure 7.3 is an example of a picture of the Gulf Stream in the visible band, enhanced by special techniques by NOAA scientists. Small-scale structures are clearly visible. Global data on sea-surface temperature from satellites will also be an essential input to climate modeling.
In terms of this report, we note that monitoring of CO2 and waste heat are paramount. In this regard it is notable that a climatic baseline of the major chemical constituents of the ocean has been established during the past three years by the GEOSECS program. In addition, the Integrated Global Ocean Station System (IGOSS), coordinated by the Intergovernmental Oceanographic Commission (IOC/UNESCO, 1969) is developing a worldwide system of oceanic data collection. The current phase of IGOSS involves an international exchange of oceanographic data; it is planned to extend this to the routine production of oceanic data summaries and predictions.
To summarize the monitoring problem, we can say that a beginning has been made for ocean monitoring, but that we are still too ignorant of basic processes to be able to establish a network that will reveal the significant variability of the ocean climate variables. Part of the reason lies in our ignorance of the dynamics of the system, part lies in the absence to date of the proper instrumentation, and, finally, part of our ignorance arises from the scale of information collection needed; unlike the atmosphere over land, man’s activities in and over the open ocean are still infrequent and can never be taken for granted. The cost of comprehensive global oceanic monitoring using present technology is staggering, but oceanographers are hopeful that the use of satellites and the continuing development of other large-scale measurement techniques will help to point the way toward an affordable and efficient monitoring system.
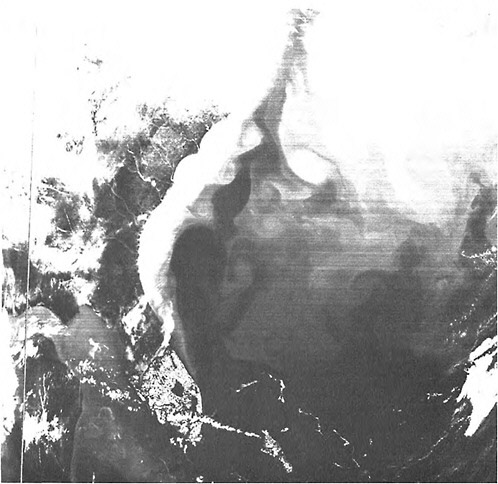
FIGURE 7.3 This infrared image of the sea-surface temperature made by the NOAA-3 satellite on April 1, 1974, uses the Very High Resolution Radiometer, which can resolve temperature changes of 0.5°C over a spatial distance of 1 km. The warmest water of the Gulf Stream is black, and the coldest inshore water is white. The temperature range for the water is 11°C. The southern part of Florida is actually hotter than the Gulf Stream, but it was made to appear white for contrast. (Figure supplied by R. Legeckis, National Environmental Satellite Service, NOAA.)
REFERENCES
Aagaard, K., and L. K. Coachman (1975). Diversion of western Siberian rivers towards an ice-free Arctic Ocean, Trans. Am. Geophys. Union 56, 484.
Aagaard, K., and P. Greisman (1975). Toward new mass and heat budgets for the Arctic Ocean, J. Geophys. Res. 80, 3821.
Aagaard, K., C. Darnall, and P. Greisman (1973). Year-long current measurements in the Greenland-Spitsbergen Passage, Deep-Sea Res. 20, 743.
Allison, L. J., A. Arking, W. R. Bandeen, W. E. Schenk, and R. Wexler (1975). Meteorological satellite accomplishments, Rev . Geophys. Space Phys. 13, 737.
Ayers, R. C., Jr., H O. Johns, and J. L. Glasser; S. Martin and W. J. Campbell (1974). Oil Spills in the Arctic Ocean: Extent
of spreading and possibility of large-scale thermal effect, Science 186, 843.
Bryan, K. (1962). Measurements of meridional heat transport by ocean currents, J. Geophys. Res. 67, 3403.
Campbell, W. S., and S. Martin (1973). Oil and ice in the Arctic: Possible large-scale interactions, Science 181, 56.
Holland, W. D., and L. B. Lin (1975). On the generation of meso-scale eddies and their contribution to the oceanic general circulation, Parts 1 and 2, J. Phys. Oceanog. 5, 642.
IOS (1969). General plan and implementation of IGOSS for Phase I, IOC /UNESCO Document No. SC/IOC/VI/21.
Joint Organizing Committee for GARP (1975). The Physical Basis of Climate and Climate Modelling, GARP Publ. No. 16, Geneva.
Kellogg, W. W. (1974). Climatic feedback mechanisms involving the polar regions, in Proceedings of Climate of the Arctic, U. of Alaska, College, Alaska, Aug. 15–17, 1973.
Maykut, G. A., and N. Untersteiner (1971). Some results from a time-dependent thermodynamic mode of sea ice, J. Geophys. Res. 76, 1150.
Montgomery, R. B. (1974). Comments on “seasonal variability of the Florida Current,” J. Marine Res. 32, 533.
Namias, J. (1972), Large-scale and long-term fluctuations in some atmospheric and oceanic variables, in Nobel Symposium 20, D. Dryssen and D. Jagner, eds., Almquist and Wiksell, Stockholm, pp. 27–48.
Newton, D. W. (1961). Estimates of vertical motions and meridional heat exchange in Gulf Stream eddies and a comparison with atmospheric disturbances, J. Geophys. Res. 66, 853.
Niiler, P. P., and W. S. Richardson (1973). Seasonal variability of the Florida Current, J. Marine Res. 31, 144.
Niiler, P. P., and W. S. Richardson (1974). Reply, J. Marine Res. 32, 534.
Ocean Sciences Committee (1975). Panel on Ocean-Atmosphere Interaction, The Ocean’s Role in Climate Prediction, National Academy of Sciences, Washington, D.C.
Quinn, W. H. (1974). Monitoring and predicting El Niño invasions, J. Appl. Meteorol. 13, 825.
Robinson, A. R., and B. A. Taft (1972). A numerical experiment for the path of the Kuroshio, J. Marine Res. 30, 65.
Sellers, W. D. (1965). Physical Climatology, U. of Chicago Press, Chicago, Ill., p. 108.
Stewart, H. B., ed. (1974). Proceedings of the MacArthur Work shop on the Feasibility of Extracting Usable Energy from the Florida Current, Palm Beach Shores, Fla., Feb. 27-Mar. 1.
Uda, M. (1964). On the nature of the Kuroshio, its origin and meanders, in Studies in Oceanography, K. Yoshida, ed., U. of Tokyo Press, Tokyo, pp. 89–107. U.S. Committee for the Global Atmospheric
Research Program (1975). Panel on Climatic Variation, Understanding Climatic Change: A Program for Action, National Academy of Sciences, Washington, D.C.
Vonder Haar, T. H., and A. Oort (1973). New estimate of annual poleward energy transport by northern hemisphere oceans, J. Phys. Oceanog. 3, 169.
Wyrtki, K. (1973). Teleconnections in the Equatorial Pacific Ocean, Science 180, 66.


