
10
The Carbon Dioxide Cycle and the Biosphere
ROGER REVELLE and WALTER MUNK
Scripps Institution of Oceanography, University of California, San Diego
10.1
INTRODUCTION
The industrial revolution and the accompanying rapid rise of human population have resulted in a flux of perhaps more than 200 Gt of carbon dioxide to the atmosphere. Two thirds of this quantity came from fossil-fuel combustion and one third from clearing of forests and other wild-lands for agriculture. Only about 40 percent of the carbon dioxide produced in these ways remains in the atmosphere. Two models are developed that account for absorption of the remainder in the biosphere and the oceans. Both models depend on the assumptions that the increase in atmospheric carbon dioxide has caused net primary photosynthetic production to exceed oxidation of organic matter by heterotrophic respiration and fires and that absorption of carbon dioxide by the oceans has been limited up to the present time to about 20 percent of the total carbon dioxide produced because of the buffer mechanism of seawater and the slow exchange of surface and deep ocean waters. In our preferred model, we assume that the biomass that carries out photosynthesis is constant in amount. The equilibrium partition of carbon among the atmosphere, the oceans, and the biosphere is then uniquely determined by the total quantity of carbon in the system. Computations using this model indicate that the atmospheric carbon dioxide content could rise to about 5 times the preindustrial value in the early part of the twenty-second century.
10.2
OBSERVED SECULAR INCREASE IN CARBON DIOXIDE
From 1959 to 1973 inclusive, 51.8 Gt of carbon dioxide in terms of carbon were produced by the worldwide combustion of fossil fuels and cement manufacture (Chapter 4). Accurate measurements of atmospheric carbon dioxide at the South Pole and the Mauna Loa Observatory show that during this 15-year period the atmospheric carbon dioxide content increased by 13.8 parts per million, from 316.2 to 330.0 parts per million, or 4.36 percent, corresponding to an addition of 29.2 Gt of carbon to the atmosphere. The difference of 22.6 Gt between the quantity of carbon released by industrial activity and the quantity remaining in the atmosphere is 43.6 percent of the industrial carbon.
This difference can be accounted for only by absorption in the oceans and biosphere.
Carbon dioxide produced by industrial activity from 1860 to 1973 inclusive was equivalent to 128 Gt of carbon (Keeling, 1973; Chapter 4). If the proportion between carbon remaining in the air and that produced by fossil-fuel combustion during this 113-year period was the same as during 1959–1973, the carbon dioxide content of the air should have increased by 34 parts per million, from 296 to 330 parts per million, or 11.5 percent of the initial value, corresponding to 72 Gt of carbon. The actual increase may have been significantly greater. Although nineteenth-century data on the atmospheric carbon dioxide content are much less accurate than modern measurements, a best value for the middle of the nineteenth century is 290 parts per million (Chapter 4). The increase in atmospheric carbon dioxide up to 1973 is then 40 parts per million, corresponding to 85 Gt of carbon. This is 66 percent of the carbon added by fossil-fuel combustion and 13.8 percent of the carbon in the atmosphere in 1860. Industrial carbon dioxide production during 1860–1973 corresponded to 60 parts per million, or about 20.7 percent of the nineteenth-century atmospheric carbon dioxide.
As we shall see, carbon dioxide has also been released from part of the biosphere, primarily by clearing of forest lands for agriculture. The total quantity produced between 1860 and 1973 may have been between 70 and 80 Gt of carbon. Thus around 205 Gt of carbon (one third of the original atmospheric content) must be accounted for by partitioning among the atmosphere, the ocean, and the biosphere. In this chapter we present models of the atmosphere-ocean-biosphere system that are consistent with these data and provide a range of projections of future atmospheric carbon dioxide content.
10.3
PROCESSES IN THE TERRESTRIAL BIOSPHERE
The portion of organic matter in the terrestrial biosphere that exchanges carbon with the atmosphere consists of two components: (1) the biomass of living plants and animals, mostly the trunks, branches, roots, and leaves of trees, and (2) litter, detritus, and soil organic matter (humus). Whittaker and Likens (1975) have compiled and evaluated data on the biomass (see Table 10.1). They conclude that 90 percent of the total of around 830 Gt is in the world’s forests, which cover nearly 50 million km2, Tropical forests, with an area of 24.5 km2, contain more than half of the total. Woodland and shrubland, savannas, grasslands, desert and semi-desert scrub, swamps and marshes, and cultivated land together contain only 84 Gt, or 10 percent of the total biomass, although they cover nearly 75 million km2. Net primary production of organic matter (photosynthesis minus plant respiration) is more evenly divided: forests produce 33 Gt of carbon per year, and all other vegetation produces nearly 20 Gt. These estimates correspond to an average efficiency of photosynthetic conversion of solar
TABLE 10.1 Estimated Standing Crop and Net Photosynthetic Production of the World Biomassa,b
energy on the earth’s land surface of about 0.1 percent. In a steady state, net primary production must be balanced by the oxidative activities of animals and microorganisms (heterotrophic respiration) and fires. Thus about 8 percent of the carbon dioxide content of the atmosphere is turned over each year by terrestrial biological activities, including the oxidation of organic carbon in soils.
As Loomis (1977) has emphasized, both the quantity of organic carbon in the biomass and the rates of turnover are subject to considerable uncertainty. Reiners (1973) has given a range of 37 to 64 Gt yr−1 for the rate of carbon turnover between the atmosphere and biosphere.
Bohn (1976) has recently estimated, from the FAO-UNESCO (1971) Soil Map of the World and other sources, that the content of organic carbon in the top meter of the world’s soils is somewhat less than 3000 Gt, about three times the previously accepted value (Baes et al., 1976), Of this total, about 860 Gt is in peaty materials (dystric and gelic histosols in the FAO nomenclature), covering 4.3 million km2, which presumably exchange carbon very slowly, if at all, with the atmosphere. The remaining approximately 2000 Gt of carbon in soil organic matter can be assumed to lose carbon to the atmosphere by oxidation at about the same rate as carbon is added by the accumulation of dead plant material. According to Bohn, the annual percentage rates of increase of cultivated area have been estimated by the U.S. Department of Agriculture (1965,1970; Chugg, 1965; Hertford, 1971; Atkinson, 1969; Hermann, 1972) for various intervals between 1950 and 1970 for a group of Asian and Latin American countries together with two African countries, Sudan and Tanzania. For the Soviet Union, the rate of increase of cultivated area was estimated between 1940 and 1963 inclusive (U.S. Department of Agriculture, 1964). These data are shown in Table 10.2 together with estimates by Hayami and Ruttan (1971) on the increase of cultivated land in Japan and the United States between 1880 and 1940 and 1880 and 1920, respectively, Assuming that the annual rates of increase were constant from 1950 to 1970, we may estimate the total increase in cultivated land over this 20-year period in Asia and Latin America as 84 million hectares and 50 million hectares, respectively (Table 10.3). The data for Africa are obviously insufficient, since the cultivated areas of Sudan and Tanzania are less than 15 percent of the total cultivated area in Africa south of the Sahara in 1970. Nevertheless, assuming that these two countries were typical of the remainder of the sub-Saharan part of the continent, we estimate that the increase in cultivated land over the years from 1950 to 1970 was 74 million hectares.
For the Soviet Union, we estimate that the increase in the 20 years from 1950 to 1970 was 88 million hectares. We have been unable to find data for Australia and New Zealand or China, but we estimate that the 1950–1970 increase in these two regions was small—6 million hectares for Australia and New Zealand and 7 million hectares for China. The total estimated increase over the 20-year period was about 310 million hectares, or 30 percent of the world’ s cultivated area in 1950.
The world’s soils contain on the average 18 kg/m2 of exchangeable soil organic matter in the top meter, or 180 t/ha (tons per hectare). There is a wide variation in different soil types from 40 to 600 t/ha.
The average residence time of carbon in the terrestrial biosphere is simply the total mass of organic carbon in the part of the biosphere that exchanges with the atmosphere, about 2800 Gt, divided by 53 Gt per year (the rate of heterotrophic respiration plus fires), or 53 years. Variations in global temperature and precipitation should bring about short-term variations in the rates of photosynthesis and oxidation of organic matter in the terrestrial biosphere, but over periods of 10 years or more these changes should be small and tend to balance out. They are likely to be considerably less than the changes brought about by the secular increase in atmospheric carbon dioxide, or by human activities such as clearing of forests, reforestation, and destruction of soil humus.
Several effects of human activities during the past 100 years may have tended to change the size of the terrestrial biosphere and, correspondingly, the content of carbon dioxide in the atmosphere.* Perhaps the most important of these is the clearing of forests and woodlands for agriculture, which is now taking place with the rapid increases of population and food needs in the less-developed countries and occurred in both developed and less developed countries until recent decades. The losses of carbon from agricultural clearing during the past 100 years can be estimated from the probable increase in the area of cultivated land.
Except for the United States and Japan, we have not found any direct information on changes in the world’s cultivated area prior to World War II, although careful historical search should yield useful information. However, we may roughly estimate the increases in cultivated land between 1860 and 1950 from the growth of human population in different regions.
During this 90-year period, the earth’s total population nearly doubled, growing from somewhat more than 1200 million people to nearly 2400 million people (Table 10.4). The populations of the developed regions increased by 137 percent, and those of the developing regions by 77 percent. After World War II, the rates of increase in the developing regions speeded up and in the developed regions slowed down. Nevertheless, by 1970, the world’s population was almost three times what it had been in 1860. Especially in the earlier period, the necessary increase in food production for this expanding population was almost certainly achieved largely by increasing the areas of cultivated land. The demand for food must have risen even more rapidly than population because of the approximate doubling of per capita incomes in the poor countries between 1860 and 1950. In these countries at present, the income elasticity of food demand is about 60 percent, that is, for each dollar increase in per capita income, 60¢ is spent for food. Assuming that
TABLE 10.2 Increase in Cultivated Land in 35 Countries
|
|
Rates of Increase in Cultivated Area |
|
|
|
|
|
Region and Country |
% per Year |
Millions of Hectares per Year |
Years |
Cultivated Land in 1970, Millions of Hectaresa |
Estimated Increase in Cultivated Land 1950–1970, Millions of Hectares |
|
Asia |
|
|
|
|
|
|
Burma |
1.9b |
|
1954–1967 |
18.92 |
5.96 |
|
Sri Lanka |
1.1b |
|
1951–1967 |
1.98 |
0.39 |
|
Cambodia |
2.5b |
|
1954–1967 |
1.84 |
0.72 |
|
India |
1.3b |
|
1952–1965 |
165.68 |
37.93 |
|
Indonesia |
2.2b |
|
1951–1967 |
18.10 |
6.44 |
|
Iran |
2.2c |
|
1948–1963 |
16.15 |
6.05 |
|
Iraq |
2.1b |
|
1950–1967 |
10.16 |
3.48 |
|
Malaysia |
1.6b |
|
1954–1967 |
3.52 |
0.96 |
|
Pakistan |
1.2b |
|
1950–1967 |
19.24 |
4.10 |
|
Philippines |
2.7b |
|
1950–1967 |
11.14 |
4.65 |
|
S. Korea |
1.5b |
|
1950–1967 |
2.31 |
0.60 |
|
Thailand |
2.4b |
|
1950–1967 |
13.94 |
5.31 |
|
Turkey |
1.5b |
|
1950–1967 |
27.61 |
7.16 |
|
Laos |
2.0d |
|
1937–1962 |
0.95 |
0.32 |
|
Japan |
|
0.2e |
1880–1940 |
6.10 |
— |
|
TOTAL ASIAN COUNTRIES |
|
|
|
317.64 |
84.07 |
|
Sudan |
2.7c |
|
1948–1962 |
7.10 |
2.96 |
|
Tanzania |
3.1c |
|
1948–1963 |
16.24 |
7.51 |
|
Soviet Union |
|
2.96f |
1940–1963 |
238 |
88 |
|
United States |
|
2.83c |
1880–1920 |
189 |
— |
|
Central America and Caribbean |
|
|
|
|
|
|
Costa Rica |
2.3b |
|
1950–1967 |
0.91 |
0.34 |
|
El Salvador |
1.4b |
|
1950–1967 |
0.65 |
0.16 |
|
Guatemala |
3.4b |
|
1950–1967 |
1.82 |
0.90 |
|
Jamaica |
2.8b |
|
1950–1961 |
0.28 |
0.12 |
|
Mexico |
3.2b |
|
1950–1965 |
27.47 |
12.98 |
|
Nicaragua |
4.4b |
|
1950–1967 |
1.19 |
0.70 |
|
Panama |
3.0b |
|
1950–1966 |
0.54 |
0.25 |
|
South America |
|
|
|
|
|
|
Argentina |
1.1b |
|
1950–1967 |
26.03 |
5.14 |
|
Bolivia |
2.3b |
|
1950–1967 |
1.51 |
0.56 |
|
Brazil |
4.1b |
|
1950–1967 |
34.08 |
19.07 |
|
Chile |
0.7b |
|
1950–1967 |
4.80 |
0.63 |
|
Colombia |
1.6b |
|
1950–1967 |
5.05 |
1.38 |
|
Ecuador |
2.8b |
|
1950–1967 |
3.82 |
1.64 |
|
Peru |
2.1b |
|
1950–1967 |
2.87 |
0.99 |
|
Uruguay |
−2.4b |
|
1950–1967 |
1.85 |
−1.14 |
|
Venezuela |
4.2b |
|
1950–1967 |
7.61 |
4.32 |
|
TOTAL LATIN AMERICA |
|
|
|
120.48 |
48.04 |
|
aFood and Agricultural Organization (1975). bU.S. Department of Agriculture (1970). cU.S. Department of Agriculture (1965). dChugg (1965). eHayami and Ruttan (1971). fU.S. Department of Agriculture (1964). |
|||||
the ratio between the percentage increase in cultivated area and the percentage increase in population was approximately the same from 1860 to 1950 as it was between 1950 and 1970, we arrive at the estimates for the 1860–1950 increases in cultivated land given in Table 10.3.
During this period, the cultivated land in the presently
TABLE 10.3 Agricultural Land in Different Regions, 1860–1970a
|
|
Agricultural Land, Millions of Hectares |
Increase, Millions of Hectares |
||||
|
Regions and Countries |
1860 |
1950 |
1970 |
1860–1950 |
1950–1970 |
1860–1970 |
|
Developed Regions |
|
|
|
|
|
|
|
Northern Americab |
58 |
235 |
23 |
177 |
— |
177 |
|
Europe |
100 |
144 |
144 |
44 |
— |
44 |
|
Soviet Union |
44 |
150 |
238 |
106 |
88 |
194 |
|
Australia and New Zealand |
2 |
12 |
18 |
10 |
6 |
16 |
|
Japan |
5 |
6 |
6 |
1 |
— |
1 |
|
TOTALS |
209 |
547 |
641 |
338 |
94 |
432 |
|
Developing Regions |
|
|
|
|
|
|
|
Africa S. of Saharac |
35 |
91 |
165 |
56 |
74 |
130 |
|
Latin America |
18 |
71 |
121 |
53 |
50 |
103 |
|
China |
115 |
120 |
127 |
5 |
7 |
2 |
|
Other Asiad |
136 |
228 |
312 |
92 |
84 |
76 |
|
TOTALS |
304 |
510 |
725 |
206 |
215 |
421 |
|
GLOBAL TOTALS |
513 |
1057 |
1366 |
544 |
309 |
853 |
|
aSources: 1970 areas of agricultural land from FAO (1975), pp. 3–7. 1950 areas extrapolated from last column of Table 10.2. 1860 areas for Africa, Latin America, and other Asia computed from assumed constancy of the ratio between percentage change in land area from 1860 to 1950 and percentage change in population during this period, relative to 1950–1970. For other areas, see text. bUnited States and Canada. cIncldes Sudan. dOmitting 19 countries with less than 3 million inhabitants and also Afghanistan, Hong Kong, North Korea, Taiwan, Nepal, Saudi Arabia, Syria, Yemen, and North Vietnam, These 28 countries had a total population of 105 million people in 1970. |
||||||
TABLE 10.4 Populations in Different Regions, 1860–1970a
|
|
Population in Millions |
Percentage Increase |
||||
|
Regions and Countries |
1860 |
1950 |
1970 |
1860–1950 |
1950–1970 |
1860–1970 |
|
Developed Regions |
|
|
|
|
|
|
|
Northern Americab |
35 |
166 |
226 |
374 |
36 |
546 |
|
Europe |
209 |
392 |
459 |
88 |
17 |
120 |
|
Soviet Union |
74 |
180 |
243 |
143 |
35 |
228 |
|
Australia and New Zealand |
1 |
10 |
15 |
900 |
50 |
1400 |
|
Japan |
32 |
84 |
104 |
163 |
57 |
225 |
|
TOTALS |
351 |
832 |
1047 |
137 |
26 |
198 |
|
Developing Regions |
|
|
|
|
|
|
|
Africa S. of Saharac |
76 |
167 |
226 |
120 |
59 |
250 |
|
Latin America |
37 |
164 |
283 |
343 |
73 |
665 |
|
China |
443 |
558 |
772 |
26 |
39 |
74 |
|
Other Asiad |
318 |
661 |
1050 |
108 |
59 |
230 |
|
TOTALS |
874 |
1550 |
2371 |
77 |
53 |
171 |
|
GLOBAL TOTALS |
1225 |
2382 |
3418 |
94 |
43 |
179 |
|
aSources: Populations in 1860 (except for Africa) computed from data given in Zimmerman (1965). Population of Africa south of Sahara in 1860 interpolated from data given by Hauser (1971). Populations in 1950 and 1970 from United Nations (1975). bUnited States and Canada. cIncludes Sudan. dOmitting same 28 countries as in Table 10.3. |
||||||
TABLE 10.5 Estimated Original Biomass Categories of Cleared Land, 1860–1870a
|
|
Original Biomass, Millions of Hectares |
|||||||||
|
Region |
Tropical Rain Forest |
Tropical Seasonal Forest |
Temperate Evergreen Forest |
Temperate Deciduous Forest |
Boreal Forest |
Woodland and Scrubland |
Savanna |
Grassland |
Swamp and Marsh |
Totals |
|
Northern America |
— |
— |
20 |
25 |
10 |
— |
— |
122 |
— |
177 |
|
Europe |
— |
— |
— |
11 |
— |
— |
— |
11 |
11 |
44 |
|
Soviet Union |
— |
— |
40 |
— |
20 |
— |
— |
134 |
— |
194 |
|
Australia and New Zealand |
— |
— |
— |
8 |
— |
— |
— |
8 |
— |
16 |
|
Africa S. of Sahara |
15 |
15 |
— |
— |
— |
50 |
50 |
— |
— |
130 |
|
Latin America |
15 |
16 |
— |
— |
— |
36 |
36 |
— |
— |
103 |
|
China |
— |
— |
— |
— |
— |
5 |
3 |
2 |
2 |
12 |
|
Other Asia |
15 |
50 |
— |
— |
— |
71 |
40 |
— |
— |
176 |
|
TOTALS |
45 |
81 |
60 |
44 |
30 |
173 |
129 |
277 |
13 |
852 |
|
Carbon in biomass, tons/hectare |
202.5 |
157.5 |
157.5 |
135 |
90.0 |
27.0 |
18.0 |
7.2 |
67.5 |
|
|
Total biomass carbon, Gt |
9.1 |
12.8 |
9.4 |
5.9 |
2.7 |
4.7 |
2.3 |
2.0 |
0.9 |
49.8 |
|
aIt is assumed that the developed regions are all in the temperate zones and that all the developing regions (except China) are in the tropics or subtropics. The cleared areas in forests and nonforest are approximately in proportion to the ratios of these categories indicated in Table 10.1. |
||||||||||
developed regions increased by nearly 340 million hectares and in the less-developed regions by over 200 million hectares. Table 10.5 shows the total biomass carbon that could have been transferred to the atmosphere by land clearing. This table has been constructed on the assumption that the areas of forests and other wildlands cleared for agriculture were approximately in proportion to the original ratios of these biomass categories in different regions. It may be seen that 30 percent of the cleared land was originally in forests and 70 percent in woodland and scrubland, savanna, grassland, and swamp and marsh. We note that 50 Gt of carbon were removed by clearing, most of it by the clearing of forests from 1860 to 1870.
There is good reason to believe that the content of soil humus diminishes when forests and other wildlands are cleared for agriculture (Loomis, 1977). Reiners (1973) has given a model in which the total loss of detritus from human activity between 1860 and 1970 was about 200 Gt. On the other hand, Loomis (1977) suggests that in recent decades the content of soil carbon in at least some areas of agricultural land may have increased through the effects of irrigation, legume rotation, use of fertilizers, and soil conservation, all practices that enhance inputs of organic matter to the soil. Bolin (1977) estimates that the total loss of soil carbon to the atmosphere has been between 10 and 40 Gt. We have rather arbitrarily assumed that there was about a 15 percent decrease in the average humus content of recently cleared lands, corresponding to 30 tons per hectare. Combining the figures for the reduction in biomass and the reduction in soil humus, we find that the total loss of carbon from the biosphere to the atmosphere resulting from land clearing was about 75 Gt between 1860 and 1970. If the newly cleared land was immediately planted to agricultural crops, the biomass in the cultivated areas would have been about 4.5 tons per hectare (Table 10.1), and this must be subtracted from the total loss by clearing and destruction of soil humus. We arrive at an estimate of 72 Gt loss from the biosphere to the atmosphere by land clearing over the 110-year period. This is 57 percent of the carbon produced by fossil-fuel combustion. The total addition to the atmosphere from fossil-fuel combustion and land clearing was thus about 200 Gt, roughly a third of the initial atmospheric carbon content.
Populations in the less-developed countries have increased roughly exponentially, and agricultural clearing may well have followed the same course, with an annual growth rate of about 3 percent from 1860 to the present. The total potential arable land on earth is limited, however, to 2600 million hectares (Revelle, 1976a) compared with a presently cultivated area of about 1400 million hectares. Even assuming that all presently uncultivated but potentially arable land is now in forests, the maximum future addition of carbon dioxide from land clearing is only about 240 Gt, less than 5 percent of the total carbon reserve in fossil fuels. Land clearing in the future is likely to follow a logistic curve, similar to that used by Keeling and Bacastow (see Chapter 4) for fossil-fuel carbon dioxide production but with a maximum rate of clearing around A.D. 2010 compared with the maximum carbon dioxide production from fossil fuels near the end of the twenty-first century.
Reforestation, the planting of trees in previously cleared areas, will tend to increase the size of the terrestrial biosphere at the expense of atmospheric carbon dioxide. According to Bolin (1977), reforestation has occurred over 30 million to 60 million hectares in China and about 10 million hectares in other less-developed countries, while
in the developed countries it is not certain whether there has been an increase or a decrease in the forested area by as much as 12 million hectares. The increase in net primary production, less oxidation and fires, resulting from reforestation may be as much as 2.5 tons per hectare per year; hence, the annual subtraction of carbon from the atmosphere by reforestation may lie between 70 million and 200 million tons.
Bolin (1977) suggests that wood cut for lumber, paper pulp, and especially firewood may exceed net primary production in existing forests. Wood is the poor man’s oil, and in the rural areas of Africa, Latin America, and parts of Asia the average per capita use of firewood (primarily for cooking) is probably much greater than it is today in the developed countries. Table 10.6 gives estimates, based on a variety of sources, of annual fuel wood consumption in the rural areas of 11 countries, with a total rural population of 1400 million people. The average per capita consumption is somewhat less than 700 kg/yr, with a carbon content of 350 kg. Extrapolating to an estimated total rural population of 2500 million people in the developing world gives a total firewood use of 0.875 Gt per year.
This is more than the FAO (1974) estimate of the harvest of roundwood (including fuel wood) from the world’s forests. But, even accepting this figure, the total wood harvest is only 5 percent of the estimated net primary production in tropical and subtropical forests (Table 10.7). Thus, it seems unlikely that wood cutting has resulted in a net addition of carbon to the atmosphere.
As Loomis (1977) and G. C. Delwiche (University of California at Davis, personal communication) have pointed out, several other human activities may result in adding or subtracting carbon from the biosphere or the inorganic components of the soil. Cultivation of calcareous soils in arid and semiarid regions, and expansion of areas of irrigated land, may result in an uptake of carbon by the soil as calcium carbonate or organic matter. Drainage of swamps and marshes will liberate organic carbon to the atmosphere, as will some improved forest practices. At present, we are unable to estimate the magnitude of these various effects.
Besides clearing of land for agriculture, the two principal effects of human activities on the biosphere should be an increase in net primary production over oxidation, resulting from the fertilization of the biosphere by carbon dioxide added to the air (Botken et al., 1973; Lemon, 1976; Showcroft et al., 1973), and a similar increase resulting from the excess of nitrogen fixation over denitrification.
According to G. C. Delwiche and G. K. Likens (University of California at Davis, personal communication) the present annual fixation of atmospheric nitrogen from human activities amounts to 68 million tons (40 million tons of nitrogen in fertilizer, 10 million tons in other chemical products, and 18 million tons in combustion of fossil fuels). This is 35 percent of total world nitrogen fixation. The remaining 65 percent (127 million tons) is fixed by terrestrial and marine bacteria—including blue-green algae—and in lightning discharges. Denitrification is estimated at 160 million tons annually. Thus, the excess of nitrogen fixation over denitrification is on the order of 30 million tons per year. If this increment of fixed nitrogen were stored in the terrestrial biomass, principally in the wood of forest trees that have a high carbon-to-nitrogen ratio, the carbon added annually to the biosphere would be 2300 million tons. If it were stored in soil humus, the additional carbon would be only 350 million tons. It seems unlikely that the excess fixed nitrogen has had much effect on the quantity of organic matter in the marine biosphere, which is limited by the flux of phosphorus as well as nitrogen to ocean surface waters (Broecker, 1974).
Any uptake of carbon dioxide by the biosphere requires
TABLE 10.6 Estimated Use of Fuel Wood in Rural Areas of Less-Developed Countries
|
Country |
kg of Fuel Wood per Capita per Year |
Rural Population in 1970, Millions |
Total Fuel Wood, Metric Tons per Year |
Total Carbon, Metric Tons per Year |
|
Indiaa |
285 |
440 |
125 |
63 |
|
Nepalb |
730 |
11 |
8 |
4 |
|
Bangladeshc |
95 |
70 |
7 |
4 |
|
Chinad |
830 |
660 |
550 |
275 |
|
Thailande |
1100 |
30 |
33 |
16 |
|
Tanzaniae |
1800 |
12 |
22 |
11 |
|
Gambiae |
1200 |
1 |
1 |
1 |
|
Nigeriad |
1000 |
50 |
60 |
30 |
|
Mexicod |
970 |
45 |
44 |
22 |
|
Boliviad |
2250 |
10 |
22 |
11 |
|
Brazilf |
1000 |
70 |
70 |
35 |
|
TOTALS |
|
1399 |
472 |
942 |
|
aRevelle (1976b). bRevelle and Smith (1977). cTyers (1977). dMakhijuni and Poole (1975). eOpenshaw (1974). fAdams et al. (1977). |
||||
TABLE 10.7 FAO Estimates of Wood Harvest in Different Regions Compared with Biomass Production in Forests, 1963 and 1974a
|
|
Region |
|||||||
|
|
North and Central America |
South America |
Europe |
Africa |
Asia |
Oceania |
Soviet Union |
World Total |
|
Harvest of round wood including fuel wooda |
(108 Tons of Carbon/yr) |
|||||||
|
1963 |
1.23 |
0.57 |
0.86 |
0.71 |
1.83 |
0.07 |
0.78 |
6.05 |
|
1974 |
1.49 |
0.67 |
0.92 |
0.90 |
2.06 |
0.08 |
1.10 |
7.22 |
|
Forested area |
(108 Hectares) |
|||||||
|
1963 |
8.26 |
8.90 |
1.44 |
7.10 |
5.50 |
0.96 |
9.10 |
41.26 |
|
Wood harvest per hectare |
(Tons of Carbon/ha/yr) |
|||||||
|
1963 |
0.149 |
0.064 |
0.597 |
0.100 |
0.333 |
0.073 |
0.085 |
0.147 |
|
1974 |
0.180 |
0.075 |
0.639 |
0.127 |
0.374 |
0.083 |
0.121 |
0.175 |
|
Estimated net biomass production in forests |
(Tons of Carbon/ha/yr) |
|||||||
|
|
5.6 |
7.2 |
5.6 |
8.0 |
7.0 |
6.5 |
3.6 |
6.85 |
|
Ratio of wood harvest to net biomass production in 1974 |
(Percent) |
|||||||
|
|
3.2 |
1.0 |
11.4 |
1.6 |
5.3 |
1.3 |
2.84 |
2.6 |
|
aSource: FAO (1974), and Table 10.1. bIncluding bark, estimated as 15 percent of wood by weight; original figures are given in cubic meters of wood without bark; assumed density of dry wood = 0.5; assumed carbon content = 50 percent of dry weight of wood. |
||||||||
that the rate of net primary production by photosynthesis be greater than the rate of oxidation by microorganisms, animals, and fires. It has long been known that photosynthetic production increases when crop plants are bathed in a carbon dioxide-rich atmosphere, provided other factors of production are not limiting. In the natural world, however, plant production is limited by the availability of nitrogen, phosphorus, and minor nutrients; the intensity of solar radiation; the adequacy of the supply of water; and environmental stresses, such as low and high temperatures, in addition to the concentration of atmospheric carbon dioxide. Experimental data (Waggoner, 1969; Hardman and Brun, 1971) indicate that in the absence of other limiting factors, net primary production increases with the logarithm of the increase in carbon dioxide. In the heterogeneous conditions of the natural world we may introduce a factor β that takes account of the presence of other limiting factors. In the following section, we present models of the partitioning of carbon dioxide among the ocean, the atmosphere, and the biosphere in which the calculated value of β ranges from 0.05 to 0.3. For these models, we have divided the organic carbon in the biosphere into two components: the portion of living plants that takes part in photosynthesis, designated as y′, and the wood of trees, plus organic detritus and soil humus, called y″, which are not directly involved in photosynthesis. We assume that all the biomass material not in forests, amounting to 84 Gt, is required for the net primary production of 19.6 Gt per year by this portion of the biosphere and that a proportionately larger amount of organic material in forests accounts for a net primary production of 33.2 Gt per year. The initial quantity, y0′, is then about 200 Gt (Table 10.1).
10.4
MODELS FOR THE PARTITION OF CARBON DIOXIDE AMONG THE ATMOSPHERE, THE OCEAN, AND THE BIOSPHERE
DEFINITIONS
x(t), Atmospheric CO2;
y(t), Total organic carbon in biosphere (biomass plus organic detritus in soil), y = y′ + y″;
y′(t), Biomass that engages in photosynthesis;
z(t), Oceanic carbon, z = z′ + z″, z′ is carbon in mixed layer (assumed 100 m thick);
w(t), CO2 produced by industrial revolution;
υ(t), CO2 produced by clearing land;
![]() time constant for deep-sea mixing;
time constant for deep-sea mixing;
![]() time constant for surface layer.
time constant for surface layer.
ASSUMED RELATIONSHIPS
Net production of biomass carbon by photosynthesis, where β depends on limitations of photosynthesis by factors other than atmospheric carbon dioxide.
Consumption of biosphere carbon by respiration and fires; a and b are constants.
MAGNITUDES*
t = 0 in 1860.
x0 = 617 Gt.
y0 = 2800 Gt, y0′ = 200 Gt, y0″ = 2600 Gt.
z0′ = 864 Gt.
0 ≤ β ≤ 1. Buffer factor: R = R0 + d(x − x0)/x0,
R0 = 9, d = 4
P0 = 53 Gt yr−1.
Ocean mixing: ![]()
PRODUCTION OF CARBON DIOXIDE PROM FOSSIL-FUEL COMBUSTION
We model the production of CO2 during the industrial revolution (see Chapter 4) by
(10.1)
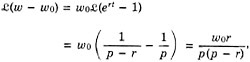
with the solution
(10.2)
(10.3)
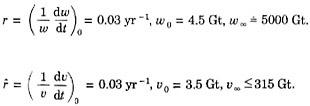
Taking w0 = 4.5 Gt of carbon, w = 5000 Gt, and r = 0.03 yr−1 gives ∆w = w − w0 as tabulated below in comparison with observed values.
|
Years |
∆w Computed from Eq. (10.1) |
∆w Observed [Keeling (1973) and Chap. 4] |
|
1860–1959 |
82 Gt of carbon |
81 Gt of carbon |
|
1860–1973 |
126 Gt of carbon |
128 Gt of carbon |
|
1959–1973 |
46 Gt of carbon |
52 Gt of carbon |
The peak rate of combustion of fossil fuels can be computed by setting the second derivative of Eq. (10.2) equal to zero, from which we find that the peak rate of combustion will occur in A.D. 2094, when w = w∞/2, or 2500 Gt. The computed annual rate of production of carbon at that time is 39 Gt yr−1, or about 9 times the observed average annual rate between 1969 and 1973.
LAND CLEARING
Let dυ/dt be the rate at which CO2 in the biomass is released to the atmosphere by clearing. We shall use the same formalism as for w(t), so that
(10.4)
(10.5)
Using ![]() υ0 = 3.5 Gt, υ∞ = 315 Gt, Eq. (10.4) gives 72 Gt for the period 1860–1970, the same as our earlier estimates, based on the world’s increase in cultivated area, of 72 Gt. The computed peak rate of release of carbon dioxide to the air from land clearing corresponds to about 2.3 Gt yr−1 of carbon. This should occur at or
υ0 = 3.5 Gt, υ∞ = 315 Gt, Eq. (10.4) gives 72 Gt for the period 1860–1970, the same as our earlier estimates, based on the world’s increase in cultivated area, of 72 Gt. The computed peak rate of release of carbon dioxide to the air from land clearing corresponds to about 2.3 Gt yr−1 of carbon. This should occur at or
near the end of the first decade of the twenty-first century. From Eq. (10.1), the rate of release of fossil-fuel carbon at this time should be approximately 10 Gt yr−1, more than 4 times as great as the biosphere release.
RATES OF CHANGE IN THE BIOSPHERE
We have
(10.6)
(10.7)
(10.8)
where
(10.9a)
for “indiscriminate” clearing, thus removing y′, y″ in the ratio of their existing mass. If the deforested area is immediately replanted with a crop having equal photosynthesizing biomass,
(10.9b)
Table 10.1 suggests that
(10.9c)
Further
(10.10)
where z refers to ocean storage and the subscript 0 refers to time 0 (1860). ![]() is the amount of y′ going into y″. We assume that
is the amount of y′ going into y″. We assume that
(10.11)
Further, we have taken
(10.12)
(10.13)
INITIAL CONDITIONS IN THE BIOSPHERE
We assume that the conditions are stationary at t = 0; strictly this applies to t = −∞, but the error involved is negligible. Equations (10.6) and (10.7) then yield
For further work, let q′ or a = 0, since p refers to net photosynthetic production of organic matter. Hence,
or
(10.14)
We now have
(10.15)
(10.16)
THE OCEANS
Let z′ refer to the storage in the mixed layer and z″ to the remaining ocean storage. Chemical equilibrium with the mixed layer is assumed to be relatively instantaneous. The buffer mechanism of seawater causes a fractional rise of CO2 in the mixed layer that is only one ninth of that in the atmosphere (under present conditions). To a good approximation (Bacastow and Keeling, 1973),
(10.17)
with
(The buffer factor, as given, is not applicable for ![]() )
)
Now for the deep ocean, we take a box model:
(10.18)
where
represent the relative concentrations in the mixed layer (depth h′) and remaining ocean, h″. ![]() is the time constant for diffusing a surface contaminant into the bulk oceans. There have been many ways for estimating
is the time constant for diffusing a surface contaminant into the bulk oceans. There have been many ways for estimating ![]() and usually these fall between 500 and 1500 years. The simplest conceivable ocean model consisting of a balance between vertical upwelling w (1 cm day−1) and vertical eddy diffusivity κ (1 cm2 sec−1) leads to exponential distributions with scale
and usually these fall between 500 and 1500 years. The simplest conceivable ocean model consisting of a balance between vertical upwelling w (1 cm day−1) and vertical eddy diffusivity κ (1 cm2 sec−1) leads to exponential distributions with scale
height κ/w (~1 km) and scale time κ/w2 (~300 years) (Munk, 1966).
Here F is associated with various fluxes, such as that resulting from the settling of calcareous skeletons and particles of dead organic matter. Initial balance requires that
so we can write Eq. (10.18) in the form
(10.19)
We assume that F is unaffected by the increase in CO2,
(10.20)
Equations (10.17), (10.19), and (10.20) can be combined into the combined ocean effect:
(10.21)
with
(10.22)
Observed Tritium Distribution
Suppose an amount z of tritium is initially added to the upper layer (as happened as a result of nuclear weapons tests in the early 1960’s) and then diffuses downward, with the total z′ = z′ + z″ remaining constant, after allowing for radioactive decay. The solution to Eq. (10.19) for constant z is given by
(10.23)
Thus z′ diminishes from z to z/e in a time ![]() If we set
If we set ![]() years, h′/h, then
years, h′/h, then ![]() years, which is consistent with the observed result (H. G. Östlund, Institute of Marine Science, Miami, Florida, personal communication, 1977) that the tritium has mixed to an average depth of 360 m in 12 years.
years, which is consistent with the observed result (H. G. Östlund, Institute of Marine Science, Miami, Florida, personal communication, 1977) that the tritium has mixed to an average depth of 360 m in 12 years.
Our conclusion is that the box model with ![]() years can give a rough idea of the fraction of CO2 lost to the deep ocean.
years can give a rough idea of the fraction of CO2 lost to the deep ocean.
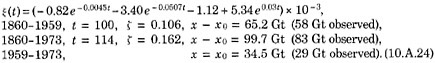
We now return to Eqs. (10.19) and (10.20). For an arbitrary z′(t), the solution is
(10.24)
Thus with x(t) given, z′(t) − z0′ is found from Eq. (10.17) and z″ − z″0 from Eq. (10.24).
THE GENERAL PROBLEM
Taking into account fossil fuels and indiscriminate clearing, and the role played by the oceans,
(10.25)
(10.26)
(10.27)
(10.28)
(10.29)
with
(10.30)
(10.31)
(10.32)
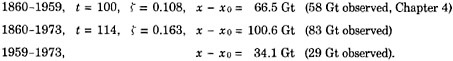
We chose a value for β (=0.05) such that x − x0 has the observed value
Numerical solutions are shown graphically in Figures 10.1 and 10.2. In Figure 10.1, the effects of land clearing are omitted [υ(t) = 0], while they are included in Figure 10.2. The two calculations give almost identical results for the quantities of carbon in the atmosphere and the ocean. The atmospheric carbon content rises to a maximum of about 1400 Gt near the end of the twenty-first century and diminishes to less than the initial value a century later. After the year 2200 the carbon dioxide in the air slowly approaches the initial value in 1860. The content of carbon absorbed by the ocean follows a similar course, but it diminishes more slowly than the carbon in the atmosphere. More than half of the added carbon is absorbed in the biosphere by the end of the twenty-first century, and eventually all of it resides in the biosphere, as we shall now demonstrate
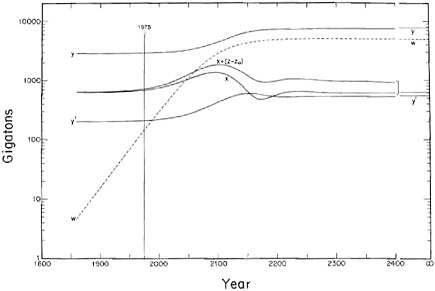
FIGURE 10.1 Partition of carbon dioxide from fossil-fuel combustion (w) among the atmosphere (x), the ocean (z − z0), and the biosphere (y) under the condition that the quantity of carbon in the photosynthesizing portion of the biomass varies with time and that the rates of both net primary photo-synthetic production and production of dead organic matter are proportional to the size of the photosynthesizing biomass (β = 0.05). Note that organic carbon in the atmosphere and the ocean ultimately return to their original value, and all carbon added from fossil-fuel combustion is absorbed in the biosphere.
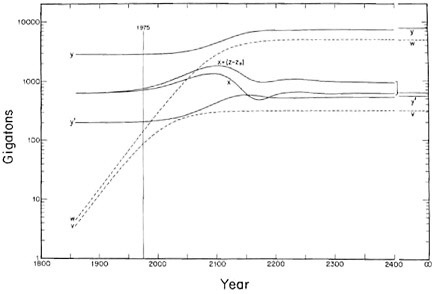
FIGURE 10.2 Partition of carbon dioxide from fossil-fuel combustion (w) and land clearing (v) among the atmosphere (x), the ocean (z − z0), and the biosphere (y) under the condition that the quantity of carbon in the photosynthesizing portion of the biomass varies with time and that the rates of both net primary photosynthetic production and production of dead organic matter are proportional to the size of the photosynthesizing biomass (β = 0.05). As in the case of Figure 10.1, all carbon added by fossil-fuel combustion and land clearing is eventually absorbed in the biosphere.
THE FINAL BALANCE
A steady balance requires all time derivatives to vanish. From Eqs. (10.26) and (10.27) we then obtain
(10.33)
Then from Eqs. (10.30), (10.31), and (10.32),
(10.34)
Equations (10.34) are satisfied for t = 0; hence x = x0, y′ = y0′, y″ = y0″. At the final balance, x = x∞, and the first Eq. (10.34) implies that
(10.35)
Thus the atmosphere returns to its initial state. This is a consequence of p and ![]() having the same functional dependence on y′ (in our case p and
having the same functional dependence on y′ (in our case p and ![]() vary linearly with y′). It would not be the case if, for example, p ~ y′ and
vary linearly with y′). It would not be the case if, for example, p ~ y′ and ![]()
![]() or if β = β(y′)
or if β = β(y′)
From Eq. (10.28) we have z∞′ = z0′, and from Eq. (10.29), z∞″ = z0″. Equation (10.25) then yields
(10.36)
so that the biosphere has absorbed the entire carbon output from the industrial revolution. The effects of clearing are totally gone.
We also have from Eq. (10.34) that y∞″/y0″ = y∞′/y0′, which can be combined with Eq. (10.36) to give
(10.37)
(10.38)
so that the two components of the biosphere have gained industrial CO2 in the proportion of their original fractional mass.
STABILITY OF PREINDUSTRIAL SYSTEM
To illustrate that the atmosphere-biosphere system is stable to small perturbations, ignore the ocean and take the equation
(10.39a)
(10.39b)
(10.40)
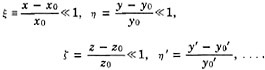
If we write,
(10.41)
then it follows from Eq. (10.39b) that
(10.42)
The simplest model is one involving an equal fractional increase of y, y′ y″, hence η = η′ = η″. Accordingly, the right-hand side of Eq. (10.39a) is
(10.43)
and so dy/dt is negative and drifts back to y0. The complete free perturbation solution [as distinct from the solution forced by w(t) and υ(t)] is given by
(10.44)
with pk given by Eq. (10.A.13). The real parts of pk are all negative; hence the system, for a constant carbon content, is stable to perturbations.
THE SIZE OF THE BIOSPHERE
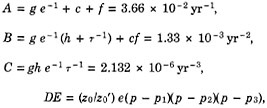
But this does not come to grips with the question of what determines the magnitude of the biosphere in the first place. Suppose we set
(10.45)
A, B, C, D are physiological constants that can presumably be determined by laboratory experiments. For example, C is the fractional rate of respiration of dead plant tissue and soil organic matter. The model is quite specific about these constants:
(10.46)
For f(x) the model involves two empirical constants, β and xT, where xT is the threshold CO2 content of the atmosphere for photosynthesis:
(10.47)
with
(10.48)
Suppose A, B, C, D, β, and xT were in fact known a priori. Then we can compute the equilibrium conditions as follows: from Eq. (10.26), dy′/dt = 0 implies ![]() or
or
hence
(10.49)
Further, from dy/dt = 0, we have ![]() hence
hence
(10.50)
Finally, from the known buffer mechanism, we have a known relation of oceanic to atmospheric CO2:
(10.51)
Equations (10.48), (10.49), and (10.50), together with
(10.52)
provide the necessary four relations for computing the equilibrium values x0, y0′, y0″, z0 for a given CO2 content T0 of atmosphere, ocean, and biosphere combined.
For illustration, ignore the oceans, and set T0 = 3417 Gt. Then using the specified values of A, D and xT, β, Eq. (10.49) yields
(10.53)
or
(10.54)
From Eq. (10.52) we compute
Finally from Eq. (10.50),
or
and
An important result is that the equilibrium content of the atmosphere is not a function of T0 but depends only on the physiological constants A, D, β, xT. It follows that if T0 is increased (as during the industrial revolution), it all ends up in the biosphere. This is a result of having taken p and ![]() proportional to y′ and would not be the case if, for example, p varied as y′ and
proportional to y′ and would not be the case if, for example, p varied as y′ and ![]() as
as ![]() nor if β is a function of y, say. In that case,
nor if β is a function of y, say. In that case,
A LID ON THE BIOSPHERE
It is difficult to accept a model that suggests that the present biomass is so much smaller than its potential size, given enough CO2. Other factors, such as the availability of nutrients and water, and ultimately lack of space, must impose an upper limit.
Such considerations led Keeling and Bacastow (see Chapter 4) to clamp an arbitrary lid on the biosphere by setting β = 0 after A.D. 2025. More generally, we may designate the lid by y1, lying somewhere between y0 = 2800 Gt and y∞ = 7800 Gt. Let this stage be reached by t1. Thus for t < t1 we have essentially the previous situation:
(10.55)
and for t > t1,
(10.56)
But we can derive the ocean storage from the time history of x(t), and so with w(t) given, x(t) is then determined. As ![]() we have from Eq. (10.21)
we have from Eq. (10.21)
(10.57)
(10.58)
Equations (10.56), (10.57), and (10.58) can be combined into
where
Suppose y1 = 3500 Gt; then Δ = 4300, B = 9.3, C = −15.7, ξ∞ = 1.46, and z∞ − z0 = 3400 Gt. Most of the carbon dioxide produced by fossil-fuel combustion is finally absorbed in the ocean, and the final amount of carbon dioxide in the atmosphere is 2.5 times the amount in 1860. This does not take into account solution of marine calcareous sediments or weathering processes on land, which would ultimately remove most of the excess carbon dioxide from the atmosphere.
A SECOND MODEL
A more satisfactory model would not only limit the mass of the biosphere to a reasonable maximum value but would also provide a definite relationship within the model itself between the atmospheric carbon dioxide content and the amount of organic carbon in the biosphere. This can be accomplished most simply by assuming that the photo-synthesizing biomass y′ remains constant. Suppose that prior to t0 the land area was already used by plants as effectively as possible. Thus y′ = y0′ and Eq. (10.11) no longer holds. For the final balance,
(10.59)
(10.60)
Substituting,
gives
For equilibrium p∞ = q∞″, and so, with ξ = (x − x0)/x0,
(10.61)
(10.62)
Numerical solution yields ξ∞ = 1.46, x∞ − x0 = 900 Gt, y∞ − y0 = 700 Gt, and z∞ − z0 = 3400 Gt for β = 0.3
and storage of carbon in the entire ocean. Equation (10.54) becomes
The equilibrium carbon dioxide content of the atmosphere depends on the total amount of carbon in the atmosphere plus that in the biosphere.
If we wish to compute the total time history, then we use the complete set of Eqs. (10.25) to (10.32) (or their perturbation counterpart), where y′ < y0′, but write y′ = y0′ for subsequent calculations. This takes into account a slight initial dip in y′ associated with clearing. A simple case is that associated with k′ = 0, where there is no initial dip in y0′, so that y′ = y0′ holds throughout.
For this case, set
(10.63)
Then with y′ = y0′ = constant,
(10.64)
(10.65)
and
(10.66)
The results are plotted in Figure 10.3 and shown numerically in Table 10.8.
In agreement with Keeling and Bacastow (see Chapter 4), a maximum of atmospheric carbon dioxide is reached in the latter half of the twenty-second century but at a lower level than their estimate, about 4.7 times the original content in 1860. Their computed maximum for the same fuel-consumption pattern is 7 to 8 times the 1860 content, assuming no dissolution of surface ocean carbonate.
The difference is chiefly due to the larger uptake of carbon in the biosphere in our model, over 1000 Gt at the time of maximum atmospheric carbon content. Also, our projection gives a somewhat more rapid uptake of carbon by the deep sea than assumed by Keeling and Bacastow in Chapter 4.
After the middle of the twenty-second century, the combined contents of carbon in the atmosphere and the biosphere slowly diminish, as the ocean absorbs a larger and larger fraction of the total fossil-fuel carbon dioxide. By the beginning of the twenty-fifth century, our projected value for the carbon content of the atmosphere is only 3.3 times the content in 1860.
As would be expected, the biosphere lags somewhat behind the atmosphere, reaching a maximum carbon content 40 percent higher than the assumed 1860 value in the first half of the twenty-third century.
The projected rise in atmospheric carbon during the course of the next 100 years is the most important aspect of this calculation, since beyond that time the uncertainty in the quantity of fossil fuels consumed becomes very large. By the year A.D. 2000, we find that the carbon content of the air should be about 790 Gt, or 370 parts per million of carbon dioxide, nearly 14 percent above the 1970 value and 27.5 percent above that in 1860. The carbon content of the air will be twice the 1970 value by the middle of the twenty-first century, only 75 years from now, and will increase rapidly thereafter to more than 3 times the
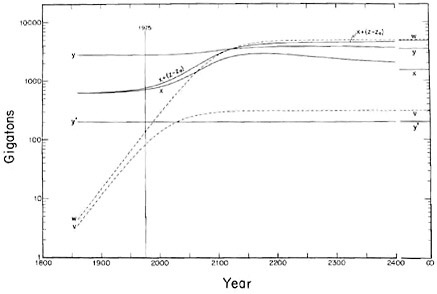
FIGURE 10.3 Partition of carbon dioxide from fossil-fuel combustion (w) and land clearing (υ) among the atmosphere (x), the ocean (z – z0), and the biosphere (y) under the condition that the photosynthesizing portion of the biomass (y′) remains constant and β = 0.3. The ultimate quantities of atmospheric carbon, ocean carbon, and biosphere carbon are shown on the right-hand side. Note the absence of oscillations around the initial value of atmospheric carbon dioxide shown in Figures 10.1 and 10.2.
TABLE 10.8 Partition of Added Carbon Dioxide among the Atmosphere, the Ocean, and Biospherea


1970 value by the year 2100. When Keeling and Bacastow (see Chapter 4) assume a faster rate of growth of fossil-fuel consumption (over 4percent per year until the late 1980’s), they find an atmospheric carbon dioxide content of 389 parts per million in A.D. 2000, a doubling of the 1970 content by A.D. 2035, and a fivefold increase by A.D. 2100. Both our values and those of Keeling and Bacastow fall well within the range of possibilities defined by Baes et al. (1977).
Our calculations indicate that up to A.D. 1973 the total quantity of organic material in the biosphere should have remained relatively constant since 1860. That is, the release of carbon to the atmosphere by land clearing has been almost exactly balanced by the increase in the net photosynthetic production and storage of organic material resulting from the higher atmospheric carbon dioxide content. Most of this increased photosynthetic production and storage of organic carbon should have occurred in the forest areas remaining after land clearing. But in 1970, the total increase in production and storage over the previous 110 years amounted to only 4 percent of the original mass of organic carbon in the world’s forests, including the humus in forest soils. This is probably not detectable with present methods of estimating forest biomass and soil humus.
The slow rate of uptake of carbon by the oceans is notable. By 1970, only 38 Gt of carbon had been lost to the ocean, or about 21 percent of the total added during the previous 110 years of fossil-fuel combustion and land clearing. According to the model, the fraction of added carbon absorbed in the sea should remain at about 21 percent throughout the twenty-first century.
With the slowing down in the rate of fossil-fuel combustion that we have postulated for the late twenty-second century, the proportion of added carbon dioxide taken up by the ocean rapidly increases, because the deeper waters begin to play a larger and larger role. This effect would be observed at an earlier time and at a much lower concentration of atmospheric carbon dioxide if the rate of fossil-fuel combustion were not allowed to increase significantly after
the next few decades. Additional model computations should be made to explore the implications of such a slowing of fossil-fuel use.
ACKNOWLEDGMENT
We are grateful to John Spiessburger for carrying out the numerical calculations shown in the figures and in Table 10.8.
APPENDIX 10A:
SMALL TIME PERTURBATIONS
Our calculations of the effects of small time perturbations involve two sets of assumptions:
-
The disturbance in the initial balance of atmosphere, biosphere, and ocean is relatively small:
(10.A.1)
-
The release of new CO2 by fossil fuel and by clearing is still small compared with the total potential release:

(10.A.2)
The first set of assumptions permits the linearization of the model, thus neglecting the squares and products of all perturbation parameters. The second set permits us to use the simple exponential growth rates
(10.A.3)
in the place of Eqs. (10.2) and (10.4). These limits correspond roughly to the years 2000 and 1975, respectively. The conclusion is that we can justifiably use the perturbation method for the analysis of data up to the present but not for prediction purposes.
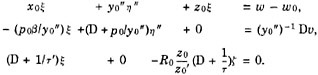
We now consider the set of four differential equations, (10.10), (10.15), (10.16), and (10.21) in the independent variables x, y′, y, z. The corresponding equations in the perturbation variables are
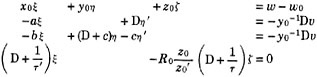
(10.A.4)
where we have written D for d/dt. Numerical values are
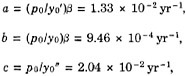
(10.A.5)
based on an estimate β = 0.05. We now perform the Laplace transform
(10.A.6)
In particular, ![]() since ξ0 = 0, and similarly for η, η′, ζ. Further
since ξ0 = 0, and similarly for η, η′, ζ. Further
(10.A.7)
(10.A.8)
The solution can be written ![]() with
with
(10.A.9)
(10.A.10)
We can write
(10.A.11)
where
and this can finally be written
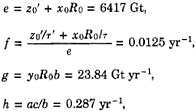
where
(10.A.12)
where
(10.A.13)
Similarly
(10.A.14)
From now on we restrict ourselves to the special case ![]() . We then have
. We then have
(10.A.15)
Then by the rules of inverse Laplace transforms,
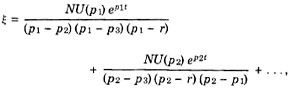
(10.A.16)
where the additional terms are obtained from cyclical rotation of subscripts 1, 2, 3, r. This gives
(10.A.17)
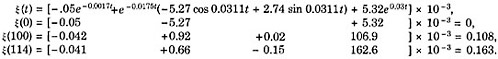
Thus
(10.A.18)
The last term predominates after a century. The forecast oscillations have a frequency of 2π/0.0311 = 202 years and decay to e–1 in 57 years. The first term decaying in 588 years is presumably associated with ocean coupling.
For the model in which y′ is constant, in the place of the four perturbation equations (10.A.4) we now have only three equations:
(10.A.19)
The determinant of the Laplace transform is
(10.A.20)
with
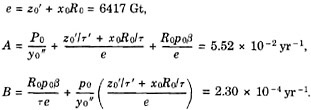
(10.A.21)
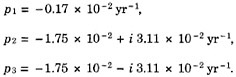
Note that e and A are the same as in Eq. (10.A.12), except that we are now using β = 0.3. The roots are
(10.A.22)
Similarly
(10.A.23)
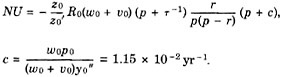
The solution is of the same form as Eqs. (10.A.15) and (10.A.16), except for the new definition of c (note that w0 and υ0 now enter not merely as their sum) and the fact that p3 = 0 and that β is now 0.3. The result is
REFERENCES
Atkinson, L. F. (1969). Changes in Agricultural Production and Technology in Colombia, Foreign Agricultural Economic Rep. No. 52, U.S. Department of Agriculture Economic Research Service, Washington, D.C., p. 55.
Adams, J. A. S., M. S. Matonari, and L. L. Lundell (1977). Wood versus fossil fuel as a source of excess carbon dioxide in the atmosphere, Science 196, 54.
Bacastow, R. B., and C. D. Keeling (1973). Atmospheric carbon dioxide and radio-carbon in the natural carbon cycle: Changes from A.D. 1700 to 2070 as deduced from a geochemical model, in Carbon and the Biosphere, G. M. Woodwell and E. V. Pecan, eds., U.S. Atomic Energy Commission, Washington, D.C., pp. 86– 135.
Baes, C. F., Jr., H. E. Goeller, J. S. Olson, and R. M. Rotty (1976). The Global Carbon Dioxide Problem, Oak Ridge National Laboratory Rep. ORNL-5194.
Baes, C. F., Jr., H. E. Goeller, J. S. Olson, and R. M. Rotty (1977). Carbon dioxide and climate: the uncontrolled experiment, Am. Scientist 65, 310.
Bohn, H. L. (1976). Estimate of organic carbon in world soils, Soil Sci. Soc. Am. J. 40, 468.
Bolin, B. (1977). Changes of land biota and their importance for the carbon cycle, Science 196, 613.
Botkin, D. B., J. F. Janak, and J. R. Wallis (1973). Estimating the effects of carbon fertilization on forest composition by ecosystem simulation, in Carbon and the Biosphere, Proceedings of the 24th Brookhaven Symposium on Biology, G. M. Woodwell and E. V. Pecan, eds., Technical Information Center, Office of Information Services, U.S. Atomic Energy Commission, Washington, D.C.
Broecker, W. S. (1974). Chemical Oceanography, Harcourt Brace Jovanovich, Inc., New York.
Chugg, B. A. (1965). Agriculture in the Southeast Asia Rice Bowl and Its Relation to U.S. Farm Exports, Foreign Agricultural Economic Rep. No. 26, U.S. Department of Agricultural Economic Research Service, Washington, D.C., pp. 15, 17, 65.
FAO-UNESCO (1971). Food and Agriculture Organization of the United Nations Soil Map of the World, 1:5,000,000, UNESCO, Paris,
FAO (1974). FAO Yearbook of Forest Products, Food and Agriculture Organization of the United Nations, Paris, pp. 3, 4, 17, and 35.
FAO (1975). Production Yearbook 1974, Food and Agricultural Organization, United Nations, Rome, pp. 3–7.
Hardman, L. L., and W. A. Brun (1971). Effects of atmosphere enriched with carbon dioxide on different developmental stages from growth and yield components of soybeans, Crop Sci. 11, 886.
Hauser, P. H. (1971). in Rapid Population Growth, National Academy of Sciences, Johns Hopkins Press, Baltimore, Md., p. 106.
Hayami, N., and V. W. Ruttan (1971). Agricultural Development, An International Perspective. Johns Hopkins Press, Baltimore, Md., p. 113.
Hermann, L. F. (1972). Changes in Agricultural Production in Brazil, 1947– 65, U.S. Department of Agriculture, Economic Research Service, Washington, D.C., pp. 23–26.
Hertford, R. (1971). Sources of Change in Mexican Agricultural Production, Foreign Agricultural Economic Rep. No. 73, U.S. Department of Agricultural Economic Research Service, Washington, D.C., pp, 25–27.
Keeling, C. D. (1973). Industrial production of carbon dioxide from fossil fuels and limestone, Tellus 25, 174.
Lemon, E. R. (1976). The land’s response to more carbon dioxide, in The Fate of Fossil-Fuel CO2, U.S. Office of Naval Research Conference, Honolulu, Hawaii, in press.
Loomis, R. S. (1977). CO2 and the biosphere, manuscript prepared for ERDA Miami workshop on Environmental Effects of Carbon Dioxide from Fossil Fuel Combustion, March 7–11, 1977, Miami Beach, Florida, 25 pp. (in press).
Makhijani, A., and A. Poole (1975). Energy and Agriculture in the Third World, Ballinger Publishing Co., Cambridge, Mass. pp. 46, 52, 54.
Munk, W. H. (1966). Abyssal recipes, Deep-Sea Res. 13, 707.
Openshaw, K. (1974). Wood fuels the developing world. New Scientist 61, 271.
Reiners, W. A. (1973). Terrestrial detritus and the carbon cycle, in Carbon and the Biosphere, Proceedings of the 24th Brookhaven Symposium on Biology, G. M. Woodwell and E. V. Pecan, eds., Technical Information Center, Office of Information Services U.S. Atomic Energy Commission, Washington, D.C.
Revelle, R. (1976a). The resources available for agriculture, Sci. Am. 235, 165.
Revelle, R. (1976b). Energy use in rural India, Science 192, 969.
Revelle, R., and D. Smith (1977). Personal observations, March.
Showcroft, R. W., E. R. Lemon, and B. W. Stewart (1973). Estimation of internal crop water states from meteorological and climatic parameters, in Plant Response to Climatic Factors, R. O. Slater, ed., UNESCO, Paris, pp. 449–459.
Tyers, R. (1977). Harvard Center for Population Studies, personal communication.
United Nations (1975). Demographic Yearbook, 1974, United Nations, New York.
U.S. Department of Agriculture (1964). Soviet Agriculture Today, Foreign Agricultural Economic Rep. No. 13, Washington, D.C., pp. 4–6.
U.S. Department of Agriculture (1965). Changes in Agriculture in 26 Developing Nations, Foreign Agricultural Economic Research Service Rep. No. 27, Washington, D.C., pp. 15–16.
U.S. Department of Agriculture (1970). Economic Progress of Agriculture in Developing Nations, 1950–1968. Economic Research Service, Foreign Agricultural Economics Rep. No. 59, Washington, D.C., pp. 9, 16.
Waggoner, P. E. (1969). Environmental manipulation for higher yields, in Physiological Aspects of Crop Yield, Am. Soc. Agron. and CSSA, Madison, Wisconsin.
Whittaker, R. H., and G. E. Likens (1975). The biosphere and man, in Primary Productivity of the Biosphere, H. Lieth and R. H. Whittaker, eds., Springer Verlag, New York.
Zimmerman, L. J. (1965). Rich Lands, Poor Lands, the Widening Gap, Random House, New York, pp. 34– 37.


