
5
The Effect of Localized Man-Made Heat and Moisture Sources in Mesoscale Weather Modification
CHARLES L. HOSLER
The Pennsylvania State University
HELMUT E. LANDSBERG
University of Maryland
5.1
INTRODUCTION
Human interference had altered the surface of the earth long before the present era (Thomas, 1956). The first major change started about 7000 years ago when man developed agriculture. This led to systematic changing of forested areas to fields and pastures. Other reasons for deforestation were the needs for structural timber and lumber. In recent times, paper requirements have led to large-scale reductions of forests. Only gradually is a systematic harvesting and replacement policy taking over.
Agriculture and lumbering have undoubtedly led to mesoscale climatic changes, but these are poorly documented, although one can make some approximate guesses at their magnitude. In many instances secondary changes have been more far-reaching. After the clearing, wind and water erosion have washed or blown the top soil away. Bare rock has become exposed, and now far more extreme temperatures and lower humidities prevail where once the even-tempered mesoclimate of the forest dominated. Stretches of Anatolia, the Spanish plateau, and some slopes of the Italian Apennines are silent witnesses to this development.
But by far the most alarming development has been the substitution of rocklike, well-compacted, impermeable surfaces for vegetated soil, a development that is the natural consequence of urbanization. Square kilometer after square kilometer has yielded to the bulldozer and has been converted to buildings, highways, and parking lots. Reservoirs and irrigation also have become important.
5.2
ENERGY BALANCE
Every change in the surface entails as an inescapable consequence a change in the energy balance. It should be recalled here that 80 or more percent of the solar radiation, the principal forcing function of climate, is transformed at the earth’s surface into other forms of energy. A look at the basic balance equation tells the story.
(5.1)
where
QN is the net energy balance;
QI is the incoming solar energy;
QL1 is the long-wave atmospheric radiative energy;
QL1 is the long-wave terrestrial outgoing radiation ![]() for which
for which ![]() is emissivity, σ is the Stefan-Boltzmann constant, and T is absolute surface radiative temperature;
is emissivity, σ is the Stefan-Boltzmann constant, and T is absolute surface radiative temperature;
QH is the sensible heat energy;
QE is the latent heat energy;
QS is the energy stored in soil or water;
QM is heat rejection from man-made combustion and processing; and
A is the albedo.
Only the terms QI, QL1, and QH are not directly affected by changes in the surface. All other terms are altered, some of them quite substantially. But even the sensible heat transfer is indirectly affected because all the surface changes alter the surface roughness, which partially governs heat transfer. Scientists engaged in the study of micrometeorology and microclimatology have long been aware of these changes (Geiger, 1961), but these seemingly small-scale phenomena were generally ignored in discussions of climatic change until they reached proportions that began to affect meteorological mesoscale phenomena.
Although the quantitative changes in the physical characteristics may seem to be small, the consequences can be large because of the magnitude of the energies involved. The first notable parameter that changes is the albedo (A), which is the percentage of incident radiation reflected. Table 5.1 gives a small sample of measured albedos of natural and man-made surfaces.
It should be noted, as a generalization, that albedos of cultivated vegetation are higher than those of the forests they replaced. Similarly, much of the urbanized area has a lower albedo than the fields that were there before. The differences in the albedos are immediately reflected in the surface temperatures (Lorenz, 1973a). This, in turn, of course, affects the outgoing long-wave radiation. But it is not only the albedo but also the emissivity that is changed by man’s activities. This also is reflected in the long-wave radiation term of the energy equation. A few characteristic values of emissivity are listed in Table 5.2.
Very profoundly affected by man’s works are the heat conductivity and heat capacity of surficial materials. Veg
TABLE 5.1 Selected Values of Surface Albedosa
TABLE 5.2 Emissivities of Selected Surfaces (in the Long-Wave Spectral Band 8–14 µm)
|
Surface |
Emissivity |
|
Growing crops and grass |
0.98 (Fuchs and Tanner, 1966) |
|
Natural freshwater |
0.97 (Davies et al., 1971) |
|
Aspalt |
0.95 (Lorenz, 1966) |
|
Concrete |
0.94 (Lorenz, 1966) |
|
Land (dry) |
0.91 (Gorodetsky and Filipov, 1967) |
|
Granite |
0.90 (Buettner and Kern, 1965) |
etated surfaces usually have considerably lower values of these parameters than building materials such as brick, stone, concrete, and asphalt. Representative values, for example for thermal diffusivity, are
|
Dry vegetation |
0.002 cm2 sec−1, |
|
Concrete |
0.02 cm2 sec−1. |
They are an order of magnitude apart. Add to this the fact that man artificially compacts the soil under roads and parking lots to increase the bearing strength and it is easily envisaged that considerably more of the incoming energy from sun and sky is transferred to deeper layers and stored. This will then become available for transfer back to the surface during intervals of net outgoing energy flux. Thus the factor QS is the one most profoundly disturbed by urbanization.
Not far behind is the change produced by the evaporation term, QE. This is also prominently interfered with in farming operations. Not only is the evapotranspiration of forests different from that of cultivated fields, but the widespread use of irrigation has a profound influence on the local heat balance, Indirectly, shelter belts affect this factor too. Yet, the rural alterations are small compared with those produced in urban areas. There, vegetation, and consequently evapotranspiration, is sharply reduced. But the water, and hence evaporation balance, is even more radically altered by the large amount of impermeable surface, with every effort being made to drain precipitation away as rapidly as possible. The reduced evaporation will, of course, reduce the energy needed for this purpose.
This and the other changes in physical parameters are responsible for a major portion of the urban heat island. The other is the heat rejection from man-made combustion processes, QM. However, it is essential to realize that the other elements of the energy balance are quite sufficient to produce a substantial urban heat island. Measurements of surface temperatures by infrared emission techniques from the air (Lorenz, 1973b) show that on sunny days in the summer the urban surface is materially warmer than that of the surroundings. These larger-scale surveys closely resemble infrared thermometer measurements from the surface (Landsberg and Maisel, 1972; Kessler, 1971). These measurements show that (up to a conversion of 50 percent of the surface buildup) the midday temperature difference
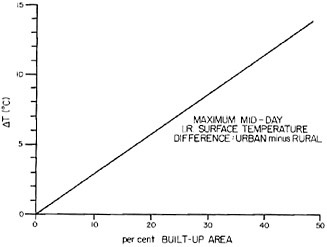
FIGURE 5.1 Midday surface (radiative) temperatures in degrees Celsius as a function of the percentage of built-up area on a sunny day.
∆T in degrees Celsius on a clear sunny day is directly proportional to the percentage of the area built up, a, approximately by the formula ∆T = 0.28a (Figure 5.1).
A number of estimates have been made of the total contribution of anthropogenic heat rejection. This varies with season and latitude. In the cold northern climates during winter, anthropongenic heat in metropolitan areas may equal or exceed the amounts received at the surface of the earth from the low and often cloud-hidden sun. But heat production even of large cities, on the whole, at present does not exceed 33 percent of the solar radiation and averages around 20 percent for the year, as documented for Montreal (East, 1971). Yet the amounts of heat produced are quite formidable. In major U.S. cities they amount to 0.03– 0.06 cal cm−2 min−1 (21–42 W m−2) in summer and 0.25– 0.30 cal cm−2 min−1 (174–209 W m−2) in winter. A metropolitan area such as New York has been estimated to produce 2.8 × 10¹⁷ cal per year (37,000 MWe) (Bornstein, 1968).
It needs emphasizing, however, that the pronounced heat island effect of calm, clear evenings after sunny days owes its existence to the storage of absorbed solar energy in the urban structures and unvegetated surfaces.
5.3
EFFECTS ON WEATHER
One of us (H.E.L.) followed the development of urban-rural air-temperature differences in the growing town of Columbia, Maryland, in a project studying atmospheric changes.* This gave the opportunity to document the changes over the past seven years, an interval in which the town grew from 2 × 10² to 2 × 10⁴ inhabitants (Figure 5.2). The projected growth over the next decade is expected to see another fivefold increase in population. We can, with reasonable assurance, predict the magnitude of increase in the heat island. The estimated values are well borne out by observations in existing, developed urban areas.
The meteorological literature abounds with accounts of the influence of local heat islands in modifying weather or in generating clouds. The effect of cities on the weather is documented in papers by Landsberg (1972) and more recently in papers by Changnon (1973) and Schickedanz (1974). Among others, Dessens and Dessens (1964) and Stout (1961) have placed on record the influence of localized man-made heat sources in generating clouds. The effect of individual cooling-tower installations in generating cumulus clouds is noted in a photograph by Scorer and Wexler (1968) and similar photographs by Hosler (1971). Recent high-resolution satellite photography in both the visible and infrared regions shows these effects downwind of cities and major industrial centers in a dramatic fashion. In one case, thunderstorms and tornadoes are occurring along a cloud band to a distance of 370 km north of Mobile, Alabama. The cloud band was clearly spawned by the thermal effects of the city. The effects of small islands in midocean where local relief is insignificant but creating temperature anomalies has been noted through the centuries, and it was utilized by early mariners to locate islands. The induced cloud streets and showers often persist for hundreds of kilometers downwind.
The critical matter, however, in answering the question of how important is man’s impact on local weather and climate is how these impulses compare with and compete with already existing thermal, stress, and moisture anomalies. Soil and rock type, vegetative cover, soil moisture, antecedent precipitation patterns, surface roughness, and other factors combine with changes in stability and low-level wind structure to give rise to extremely complex patterns of background convergence, divergence, and convection. Many of these natural influences in any given place are of magnitude as great as or greater than the localized heat source induced by man. In most situations these existing disturbances will set the pattern of convection, and man’s influence will be lost within it. If, however, the wind tends to be from the same direction during periods when impulses of the magnitude of those induced by man can have an effect, it is reasonable to expect that a precipitation anomaly will be produced downwind. Also, if natural impulses in the area are below the threshold necessary to overcome atmospheric stability, then there may indeed be occasions when man-made heat sources added to the natural impulses can overcome that stability and organize circulations that would not have developed naturally.
Since nature is predisposed to favor existing circulations rather than new ones, subsequent natural changes in the atmospheric stability will provide the energy to feed the pre-existing man-made circulation, thus localizing natural precipitation release downwind of man-made heat sources. Over the open sea in low latitudes or over a flat plain of uniform character one would expect maximal effects of this
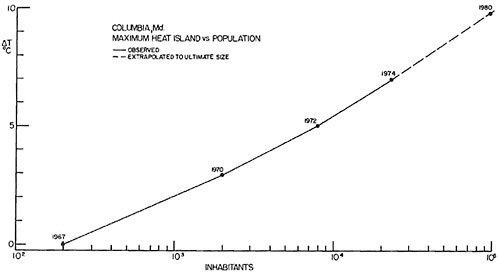
FIGURE 5.2 Maximum value heat island in degrees Celsius (urban-rural air temperatures) on calm, clear evenings at Columbia, Maryland, correlated to population increase.
kind. Where land forms, land use and character are varied, the influence of man-made heat sources may be hard to find and of little consequence. Also, highly variable wind direction and speed in a given locality may spread a small effect over a large area of high natural variability making it impossible to find. The ability of small orographic or thermal sources of lift to produce large effects in producing clouds and precipitation under conditions of marginal stability has been documented by Bergeron (1965) and more recently by Browning et al. (1974). The release of convection may produce rain in cases of deep instability, or it may produce low clouds that feed the precipitation from higher clouds. Table 5.3, produced in part from data given by Huff et al. (1971) and Hanna (1971), presents a comparison of some man-made heat sources and natural phenomena in terms of the megawatt equivalent input into the atmosphere. It is obvious that large cyclonic storms will not be influenced in their overall behavior by man’s works. However, we see that the city of St. Louis does produce measurable downwind effects on rainfall, hail frequency, etc. (see Tables 5.4–5.6), and there are indications of similar phenomena occurring downwind of other cities (Changnon, 1973). One might debate the degree to which pollutants, acting to change cloud microphysics, contribute to these effects. Schickedanz (1974) finds evidence of two types of effect, one a result of the heat island and another possibly due to microphysical changes. One can observe the effect of islands such as Aruba both from satellites and with radar, and it is obvious that they produce profound effects on cloudiness and rainfall downwind without a large microphysical component and almost certainly due to heat island effects. It appears from Table 5.3 that it would be reasonable to assume that a 20,000-MW power park (releasing 40,000 MW of heat locally) might produce effects of the same magnitude as St. Louis, Chicago, or the island of Aruba, the latter serving as a heat island in the ocean and the former as heat islands over land caused by a combination
TABLE 5.3 Comparison of Man-Made and Natural Energy Releases
|
Heat Source |
Area (sq. km) |
Approximate MW Equivalent Input to the Atmosphere |
|
St. Louis |
250 |
16,100 |
|
Chicago |
1,800 |
52,700 |
|
Aruba |
180 |
35,000 |
|
One-megaton nuclear device (heat dissipated over 1 hour) |
|
1,000,000 |
|
20,000-MW power park |
26 |
40,000 |
|
Cyclone (1 cm of rain/day) |
10 × 105 |
100,000,000 |
|
Tornado (kinetic energy) |
10 × 10−4 |
100 |
|
Thunderstorm (1 cm of rain/30 min) |
100 |
100,000 |
|
Great Lakes snow squall (4 cm of snow/hour) |
10,000 |
10,000,000 |
TABLE 5.4 Summary of Urban Effects on Summer Rainfall at Eight Citiesa
|
|
|
Maximum Change |
Approximate Location |
|
|
City |
Effect Observed |
Millimeters |
% |
|
|
St. Louis |
Increase |
41 |
15 |
16–19 km downwind |
|
Chicago |
Increase |
51 |
17 |
48–56 km downwind |
|
Cleveland |
Increase |
64 |
27 |
32–40 km downwind |
|
Indianapolisb |
Indeterminate |
— |
— |
— |
|
Washington |
Increase |
28 |
9 |
48–64 km downwind |
|
Houstonc |
Increase |
18 |
9 |
Near city center |
|
New Orleansc |
Increase |
46 |
10 |
NE side of city |
|
Tulsa |
None |
— |
— |
— |
|
Detroit |
Increase |
20 |
25 |
City center |
|
aSource: Changnon (1973). bSampling density not adequate for reliable evaluation. cUrban effect identified only with air mass storms—apparently little or no effect in frontal storms. |
||||
of the effects of the city on albedo and the man-controlled heat releases due to intensive energy utilization.
A 1-Mton nuclear device (assuming the heat from it is dissipated over 1 hour) represents a larger impulse, as does a weak cyclonic storm or a Great Lakes snowstorm. A tornado, on the other hand, is a relatively minor phenomenon in terms of its kinetic energy as compared with the energy impact of the large power park to the atmosphere. The tornado is the result of a larger thunderstorm system. The latent heat released in a thunderstorm is at a rate an order of magnitude greater than that of the energy application at a power park; however, it is not unreasonable to assume that the power-park energy applied to the atmosphere is of a magnitude comparable with the initial impulse that started the cumulus cloud that later may have developed into a thunderstorm.
The extent to which heat sources of the size man has created will cause meaningful changes under a wide variety of synoptic situations with varying stability, wind, moisture distribution, and other variables can best be determined by improved physical and mathematical models.
TABLE 5.5 Thunder-Day Summary for Eight Citiesa
TABLE 5.6 Hail-Day Summary for Eight Citiesa
The state of modeling of circulations created by cities or large energy sources created by a power park does not permit us to answer all of our questions. However, the crude two-dimensional models available tend to indicate that energy sources of the magnitude that we are talking about will create circulations of adequate size and intensity to initiate cumulus development and focus subsequent natural shower development. One would hope that in time model sensitivity will reach a level where the results can be used for predict ion. Modeling progress is also limited by the inability of present computers to handle physical processes in sufficient detail and with a sufficient data base. This forces gross simplification of structure and parameterization of important processes. Calculations by Black (1963) indicate that heat sources of comparable magnitude with those of power plants or cities can be produced by asphalting large areas of desert near the seacoast to decrease the albedo. The resulting circulation would be sufficient to over-
come the stability on some days, and the result would be induced cloud streets and showers downwind comparable with those found downwind of islands.
A preliminary attempt to determine whether the effects of atmospheric heating by large power plants can be assessed numerically has been made by Dennis Deaven of the National Center for Atmospheric Research, His model uses a form of isobaric coordinates (sigma coordinates) in the boundary layer and isentropic coordinates above. The surface temperature at the central gridpoints was brought up to a value that eventually produced a quasi-steady sensible heat flux of 1340 MW km2. The quasi-steady structure of the isentropes after 5.6 hours is shown in Figure 5.3, and the streamlines for the flow induced by the surface heating are shown in Figure 5.4.
The model used was two-dimensional and did not include condensation effects. It is to be expected that a three-dimensional process of the magnitude shown would necessarily result in formation of a vortex flow and that the inclusion of moisture effects would result in additional instability. Even so, the disturbance in the flow shown in the diagrams makes it clear that a significant local circulation results when a large power park or city imposes a thermal anomaly of this magnitude upon a marginally stable atmosphere. For more stable soundings the effect is less, and for less stable soundings greater.
During 1960 and 1961, showers in central Pennsylvania were analyzed as to their direction of movement, speed of movement, and persistence (Hosler et al., 1962). For middle latitudes these data probably serve as a clue to how serious downwind effects might be and over what area they might be expected. This study shows that there is a prevalent direction of shower motion from 260° with almost all showers moving between 220° and 280°. Any effects of a heat source on shower development might be concentrated in this case in a direction slightly to the north of east of the heat source. The average shower moved 21 km after the radar echo formed before dissipating. These were summers,
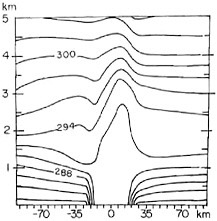
FIGURE 5.3 Disturbance of isentropic surfaces by a 20,000-MWe power park. (Source: Dennis Deaven, NCAR.)
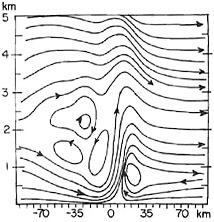
FIGURE 5.4 Streamlines resulting from a 20,000-MWe power park. (Source: Dennis Deaven, NCAR)
however. In winter, some snow flurry activity may be similarly initiated; however, the natural energy available for convection is so much less in winter that the amplitude of any effect would probably be small.
Because at least 20 minutes is required in the development of precipitation in a cumulus cloud, a shower developing downwind as a result of the influence of a man-made heat island is likely to be at least 8 km downwind before rain begins if it travels at the average echo speed shown in this study in Pennsylvania. This together with the fact that the average echo moved a distance of 21 km during its lifetime would imply that the maximum precipitation increase in Pennsylvania would occur about 29 km to the east northeast but be spread from 8 to 64 km downwind because of the variability of the speed of shower movement. Table 5.4 indicates that this reasoning produces a result similar to what is observed.
These data are for Pennsylvania and are not universally applicable, although Ligda and Mayhew (1954) also found that the showers move with the 700-mbar wind direction, and Clark (1960) found that echos traveled about the same distance as found in Pennsylvania. In some other areas, the direction and speed of movement of showers may be more highly variable. In that event, the effect in generating showers would be spread over a wide sector and thus of small consequence, since the net rainfall is not expected to increase significantly but only to be changed in location on a given occasion.
Because violent weather, such as the occurrence of tornadoes, results from convective phenomena, it is natural to ask whether there would also be an increase in these phenomena. Since severe weather is usually associated with organized lines and bands due to larger-scale convergence in the lower levels, the impact of the man-made heat source may not be so great as upon scattered showers. Any increase would also be 8 to 64 km downwind from any large heat source in an area like Pennsylvania, with the greater distance being more likely. Tornadoes tend to develop from large, intense cells.
Tables 5.4–5.6, taken from Changnon (1973), summarize the effects noted on rainfall, hail, and thunderstorm frequency. Taken together, there seems to be little doubt that these effects are real.
The question arises when considering the impact of large power parks as to whether it makes a difference in how the heat is dissipated. That is, would there be any difference in the effects of a cooling pond, dry cooling, or evaporative cooling? Certainly when we discuss fogging, icing, or invisible plumes one is concerned about the quantity of water released and the altitude of release. This will be discussed later.
The net effect on downwind convection is apt to be somewhat similar in all cases. The initial vertical velocities would be larger in the case of the dry cooling towers, where sensible heat is added directly. Subsequent tapping of the naturally available latent heat will sustain convection in an unstable atmosphere. In the case of evaporative towers or the cooling pond, the lesser amount of sensible heat, somewhat compensated for by the reduction in air density due to the water vapor addition, may not result in vertical motion that will be as great initially. However, as long as the air reaches the condensation level, the net effect will be the same because the latent heat available in the vapor plume will be released to maintain positive buoyancy and sustain the convective development for some distance downwind. In the absence of any direct empirical evidence to the contrary, it would be a reasonable assumption that the manner of waste-heat dissipation is probably not extremely important in determining the effects of convection during shower periods that occur naturally. Thus we would not expect the power plant itself to have any more effect on weather than the city or industrial center that ultimately consumes the electrical energy generated at the site of the power plant unless the initial area is critical. Eventually the heat from the point source spreads to an equivalent area of the city. If one questions the environmental impact of the power plant, one must similarly question the environmental impact of consuming the energy, which results in sensible heat being added to the atmosphere at the terminal point of transmission line. Improved models and field studies will eventually answer the questions raised above and substitute physics and data for conjecture.
The higher dew point temperature in the vapor plume from evaporative cooling towers is in itself a destabilizing effect as latent heat is released earlier even if natural impulses cause the initial updraft to form a cloud. The air in the plume can thus be rendered unstable by lifting more easily than the ambient air. Also, natural cumulus clouds building into a moist plume will grow faster and bigger because of the reduced influence of entraining cool dry air, the principal enemy of cumulus growth (Austin, 1948).
In addition to the direct effect of the plume on convection, there is also an indirect effect of raising the humidity in a large swath downwind of the plant, which will in turn reduce the evaporation rate for precipitation falling from cloud bases higher than the plume. When a visible cloud exists, the precipitation elements will grow slightly as they fall through. J. R. Hummel of the Pennsylvania State University in an unpublished study has made some calculations that indicate that at low rainfall rates the increase in rainfall may be as much as 10 percent but usually of the order of 1 to 5 percent for reasonable rates of rainfall. These increases are within 2 km of the plant and are thus insignificant.
5.4
FOGGING AND ICING
If evaporative processes are used to dissipate the waste heat in a large power park then on the order of 107 g of water per second will be injected into the atmosphere at that point. Under average diffusion conditions this means that 2 km downwind the water vapor content of the air will be increased by on the order of 10 g per m3 and that increases of over 1 g will extend over many kilometers downwind. Especially in high and middle latitudes in the winter, this will generally tax the ability of the atmosphere to absorb it as vapor and a visible plume will persist downwind. For natural draft cooling towers these will be elevated and of little concern. Downwind plumes may be of concern for mechanical draft towers or cooling ponds. The natural draft plumes have been studied in some detail at the Keystone plant in Pennsylvania, and Table 5.7 shows the frequency with which plumes of various lengths occur at the Keystone plant according to Bierman et al. (1971). This is an 1800-MW fossil-fuel plant and is evaporating only about one tenth of the water vapor to be evaporated from a major power park of 20,000-MW capacity. Figure 5.5 shows an extreme case in which the ambient surface temperature was −12°C. The plume leveled off at 2000 m and persisted for many kilometers downwind. It is obvious then that long, persistent
TABLE 5.7 Plume Length at Keystone Power Station in Western Pennsylvania when It Did Not Merge with Overcast
|
Length (m) |
<600 |
>600 to <1500 |
>1500 |
|
Frequency (%) |
87.3 |
10.1 |
2.6 |
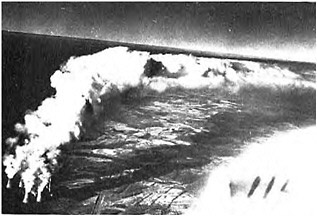
FIGURE 5.5 Extended high-level plume production at Keystone on a cold February morning.
plumes downwind in cold and humid weather will, if nothing else, have aesthetic effects in a populated area.
Examination of saturation deficit data indicates that plumes 2 km or more long will occur as much as 20 percent of the time if evaporational cooling is used at a large power park in Pennsylvania. If the wind direction is fairly persistent, these plumes may have an impact on solar radiation reaching the ground immediately downwind of the power plant. The question of whether these plumes would affect aircraft has been raised.
Extensive measurements have been made in the plumes from Keystone by flying through them in light aircraft. These measurements reveal that the vertical motions in the plumes above the very large natural draft cooling towers are of sufficiently low magnitude and short duration as to present no significant hazard to aircraft operating in or around them. The liquid-water content and drop sizes are so small and the ability to stay in the cloud is so limited that there is no possibility of significant icing or ice accumulation in the plume. Thus, the only significant effect of the plume on air navigation is to reduce visibility aloft during those few occasions when extended plumes occur. These occasions all correspond to periods when it is almost certain that low clouds and precipitation will be present naturally. The plume from the cooling tower has no special properties that will distinguish it from the natural clouds except its location. On the few occasions a year when the plume levels off immediately below the natural cloud base, there will be the effect of lowering the cloud base by as much as 100 m. Because of the penetration achieved by these plumes, this phenomenon will always occur at an altitude above 500 m and usually above 600 m. Thus in no case would this tend to increase the number of hours when ceilings would be below minimum. It should be emphasized that penetrations made were as low as 50 m above the towers. At these altitudes any condition of concern would be exaggerated as compared with what one would encounter at a height of several hundred meters above the towers.
It does make a great difference depending upon the altitude at which the water vapor is injected as to the severity of the downwind effect from the standpoint of persistent plumes affecting transportation or visibility. Large natural draft cooling towers and the attendant buoyancy of the air and water ejected from them would eliminate the chance of any surface effects. Fogging has not been a problem downwind of these installations and is not likely to be. However, in the case of mechanical draft cooling towers or cooling ponds the water injected at a very low level under high humidity and low temperature conditions will almost certainly produce large amounts of fog downwind. Figure 5.6 shows steel mills in Pennsylvania at which the low-level sources of both water vapor and pollutants cause dense fog beneath a strong inversion. The persistence of this fog into the morning hours represents a considerable weather modification. The existence for some hours of an elevated plume downwind from a power-plant installation if located almost always over the same area would, of course, have an effect on subsequent convection that might occur later in the day due to solar heating. The area under
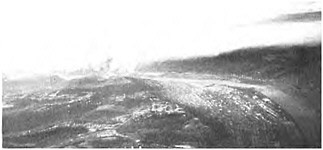
FIGURE 5.6 Extended low-level plume production by steel mills on an April morning.
the plume having been deprived of solar energy for several hours in the morning will actually tend to dampen convection in that particular area if the convection depends on solar heat absorbed at ground level (Weiss and Purdom, 1974).
Since in all evaporative cooling towers a certain amount of unevaporated water is ejected from a tower in the form of so-called drift (see Hosier et al., 1974) even with the most modern drift eliminators, it appears that for a 20,000. MW power installation, fallout of dissolved salts must be considered. This would normally not be important unless there are particularly sensitive agricultural crops in the area and high concentrations of substances that might damage the leaves of the crops. For example, if seawater were used the chloride might affect tobacco. If seawater were used in mechanical draft cooling towers then concentrations of thousands of kilograms per square kilometer per year may fall within a few kilometers of the plant, representing a serious problem from the standpoint of corrosion or damage to vegetation. For natural draft towers, the drift problem is less serious as a result of the height of injection in the larger area over which the material is dispersed. For mechanical draft towers, however, the local fallout can become of the order of 105 kg km−2 per year as opposed to 104 kg km−2 for a saltwater tower of natural draft variety. When freshwater is used, these rates fall to levels of the order of 104 kg km−2 per year for mechanical draft towers and 103 kg km−2 per year for natural draft towers. For the natural draft tower, ice deposition is an insignificant problem because of the great height at which water is injected. Most of the drift drops evaporate before reaching the ground. In the case of the lower-level mechanical draft towers, localized ice deposition may occur in the winter.
5.5
CONCLUSION
A look into the future dictates a more comprehensive investigation and understanding of the consequences of man’s activities. There will be more power plants with their warm-water discharges into natural waters or cooling la-
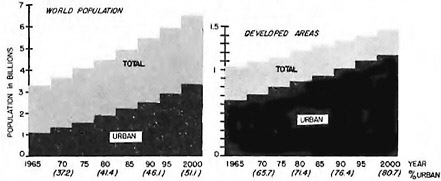
FIGURE 5.7 Projection of world population to the year 2000 in the world as a whole and the developed nations alone and the respective share of urban dwellers, from United Nations sources.
goons or cooling towers. The 1970 anthropogenic heat production was about 8 × 10³ GW or 0.01 percent of the heat received at the earth’s surface from the sun (Kellogg, 1974). By the end of the century, with an apparently inevitable doubling of the population and increased industrialization and mechanization, a conservative estimate of a tripled heat rejection can be projected. Although this is still only a very small fraction of the solar energy and unlikely to affect the global climate, it has to be considered that most of this heat will be dissipated in the small areas of metropolitan concentration. Here the projections show that by the end of the century 81 percent of the population in the developed nations and 51 percent of the world’s population will live in urban areas (Figure 5.7). This will lead to some large megalopolitan regions. There not only local heat rejection but also higher absorption and storage of solar energy will lead to considerable mesoclimatic changes. Not all of these are clearly foreseeable. There will, undoubtedly, be higher-temperature contrasts to the rural environment. There will also be more induction of rainfall. Initiation of severe local storms cannot be excluded, and the downwind effects must of necessity become more pronounced.
Efforts to increase our knowledge of the effects of existing man-made heat and moisture sources should be increased, and studies of the consequences of even larger and greater numbers of sources must be begun.
REFERENCES
Austin, J. M., and A. Fleisher (1948). A thermodynamic analysis of cumulus convection, J. Meteorol. 5, 240.
Barry, R. G., and R. A. Chambers (1966). A preliminary map of summer albedo over England and Wales, Quart. J. R. Meteorol. Soc. 92, 543.
Bergeron, T. (1965). On the low-level redistribution of atmospheric water caused by orography, Suppl. Proc. Inst. Conf. Cloud Phys. Tokyo, pp. 96– 100.
Bierman, G. F., G. A. Kunder, J. F. Sebald, and R. F. Visbisky (1971). Characteristics, classification and incidence of plumes from large draft cooling towers, paper presented at American Power Conf., Chicago, Ill., Apr. 22.
Black, J. F. (1963). Weather control: Use of asphalt coatings to tap solar energy, Science 199, 226.
Bornstein, R. D. (1968). Observations of the urban heat island effect in New York City, J. Appl. Meteorol. 7, 575.
Browning, K. A., F. F. Hill, and C. W. Pardoe (1974). Structure and mechanism of precipitation and the effect of orography in a wintertime warm sector, Quart. J. R. Meteorol. Soc. 100, 309.
Buettner, K. J. K., and C. D. Kern (1965). The determination of infrared emissivities of terrestrial surfaces, J. Geophys. Res. 70, 1329.
Changnon, S. A. (1973). Urban-industrial effects on clouds and precipitation, in Proc. Workshop on Inadvertent Weather Modification, Utah State U., Logan, Utah, Aug. 1973, pp. 111–139.
Chin, L. S. (1967). Albedo of natural surfaces in Barbados, Quart. J. R. Meteorol. Soc. 93, 116.
Clark, R. A. (1960). Study of convective precipitation echoes as revealed by radar observation, Texas, 1958–59, J. Meteorol. 17, 415.
Davies, J. A., P. J. Robinson, and M. Nunez (1971). Field determinations of surface emissivity and temperature for Lake Ontario, J. Appl. Meteorol. 10, 811.
Dessens, J., and H. Dessens (1964). Cumulus artificiel sur la Sahara, J. Rech. Atmos. 1, 29.
East, C. (1971). Chaleur urbaine a Montréal, Atmosphere 9, 112.
Fuchs, M., and C. B. Tanner (1966). Infrared thermometry of vegetation, Agron, J. 58, 597.
Geiger, R. (1961). Das klima der bodennahen Luftschicht, Friedr. Vieweg und Sohn, Braunschweig.
Gorodetsky, A. K., and G. F. Filipov (1967). Terrestrial measurements of the atmosphere and of the underlying surface in the spectral region 8–12, Izv. Atmos. Ocean Phys. 4, 228.
Hanna, S. R. (1971). Meteorological effects of cooling tower plumes, Contribution No. 48, NOAA Res. Lab., Atmos. Turbulence and Diffusion, Oak Ridge, Tenn.
Hosler, C. L. (1971). Wet Cooling Tower Plume Behavior, C.E.P. Tech. Manual No. T40, Cooling Towers, AIChE, p. 1.
Hosler, C. L., L. G. Davis, and D. R. Booker (1962). The role of orographic barriers of less than 3000 feet in the generation and propagation of showers, Rep. to NSF under Grant No. 7363, Dec.
Hosler, C. L., J. Pena, and R. Pena (1974). Determination of salt deposition rates from drift from evaporative cooling towers, J. Eng. Power, July, p. 283.
Huff, F. A., R. Beebe, D. M. A. Jones, and R. G. Semonin (1971). Effect of cooling tower effluents on atmospheric conditions in Northeastern Illinois, Circ. 100, Ill. State Water Survey, Urbana.
Kellogg, W. W. (1974). Long range influences of mankind on the climate, paper presented at world conf. on Toward a Plan of Action for Mankind: Needs and Resources—Methods of Forecasting, Inst. de la Vie, Paris, Sept. (typescript).
Kessler, A. (1971). Uber den Tagesgang von Oberflachentempera-
turen in der bonner Innenstadt en einem sommerlichen Strahlungstag, Erdlkunde 25, 13.
Kung, E. L., R. A. Bryson, and D. H. Lenchow (1964). Study of a continental albedo on the basis of flight measurements and structure of the earth’s surface, Mon. Weather Rev. 92, 543.
Landsberg, H. E., and T. N. Maisel (1972). Micrometeorological observations in an area of urban growth, Boundary Layer Meteorol. 2, 365.
Ligda, M. G. H., and W. A. Mayhew (1954). On the relationship between the velocities of small precipitation areas and geostrophic winds, J. Meteorol. 11, 421.
Lorenz, D. (1966). The effect of long-wave emissivity of natural surfaces on surface temperature measurements using radiometers, J. Appl. Meteorol. 5, 421.
Lorenz, D. (1973a). Die radiometrische Messung der Boden- und Wasseroberflächen-temperatur und ihre Anwendung insbesondere auf dem Gebiet der Meteorologie, Z. Geophys. 39, 627.
Lorenz, D. (1973b). Meteorologische Probleme bei der Stadtplanung, Baupraxis 9, 57.
Nkemdirim, L. C. (1972). A note on the albedo of surfaces, J. Appl. Meteorol. 11, 867.
Oguntoyinbo, J. S. (1974). Land-use and reflection coefficient (albedo) map for southern parts of Nigeria, Agric. Meteorol. 13, 227.
Scorer, R. S., and H. Wexler (1968). A Colour Guide to Clouds, Pergamon Press and Macmillan Co., London and New York.
Schickedanz, P. T. (1974). Inadvertent rain modification as indicated by surface rain cells, J. Appl. Meteorol. 13, 891.
Stanhill, G. G., G. G. Hofstede, and J. D. Kalma (1966). Radiation balance of natural and agricultural vegetation, Quart. J. R. Meteorol. Soc. 92, 128.
Stewart, J. B. (1971). The albedo of a pine forest, Quart. J. R. Meteorol. Soc. 97, 561.
Stout, G. (1961). Some observations of cloud initiation in industrial areas, Symp. on Air Over Cities, SEC Tech, Rep. A62-5, Public Health Service, Cincinnati.
Thomas, W. L., Jr. (1956). Man’s Role in Changing the Face of the Earth, U. of Chicago Press, Chicago, Ill.
Weiss, C. E., and J. F. Purdom (1974). The effect of early morning cloudiness on squall-line activity, Mon. Weather Rev. 102, 400.


