
1
Context and Challenges
This report assesses the status of energy-supply and end-use technologies1 in the United States, both at present and over the next two to three decades. It is intended to inform the development of wise energy policies by our nation’s decision makers and to provide the technical underpinnings for more detailed explorations of key energy-policy options in the second phase of the National Academies America’s Energy Future (AEF) project. The complete study charge is presented in Box 1.1.
This first chapter, which establishes the context for the detailed energy-technology assessments that appear in Part 2 of this report, is divided into five sections. They describe the current U.S. energy system; some challenges that are likely to be encountered in transforming it; the role of technology in this transformation; the AEF Committee’s strategy for addressing its study charge; and the report’s organization.
|
BOX 1.1 Study Charge This study will critically evaluate the current and projected state of development of energy-supply, storage, and end-use technologies. The study will not make policy recommendations, but it will analyze where appropriate the role of public policy in determining the demand and cost for energy and the configuration of the nation’s energy systems. The committee will develop a “refer-ence scenario” that reflects a projection of current economic, technology cost and performance, and policy parameters into the future. Within that scenario, the committee will evaluate energy technologies with respect to:
The committee may assess the sensitivity of these factors to possible variations in the key economic, technology cost and performance, and policy parameters that define the reference scenario. The primary focus of the study will be on existing technologies and technologies likely to be available for deployment within the next decade. A secondary focus will be on technologies with longer times to deployment. The study will specifically provide estimates and findings on the following:
|
THE CURRENT U.S.ENERGY SYSTEM
The U.S. energy system currently comprises a vast and complex set of interlocking technologies for the production, distribution, and use of fuels and electricity (Boxes 1.2 and 1.3; Figure 1.12). It evolved over the last century in response to a broad set of circumstances: rapidly growing demand for energy, advances in technology, diverse public policies and regulations, and the powerful market forces that have accompanied economic growth and globalization. As a result, the energy system’s technologies and production assets are of many different vintages and often rely on aging and increasingly vulnerable infrastructures.
Five critical characteristics of this system stand out:
-
The United States relies on the burning of carbon-based fossil fuels for more than 85 percent of its energy needs (Figure 1.2).
-
The burning of fossil fuels has a number of deleterious environmental impacts, among the most serious of which is the emission of greenhouse gases, 3 primarily carbon dioxide (CO2). At present, the United States emits about 6 billion tonnes (6 gigatonnes) of CO2 per year into the atmosphere. Emissions have grown by almost 20 percent since 1990 but have recently leveled off somewhat (Figure 1.3). However, CO2 emissions are projected to increase in the future under the Energy Information Administration’s (EIA’s) “business as usual ” reference case ((see Box 2.1 in Chapter 2).
-
Despite decades of declining energy intensity (i.e., energy consumption per dollar of gross domestic product; see Figure 1.4), the United States still has a higher per capita consumption of energy than either the European Union or Japan (Figure 1.5). And despite improvements in energy efficiency, U.S. energy consumption continues to rise, in part because of
|
2 |
Figures 1.1 through 1.12 are grouped under the section titled “America’s Energy Past, Present, and Future: An Overview in Charts and Graphs,” which starts on page 17. |
|
3 |
Greenhouse gases are so named because of their ability to absorb and emit infrared radiation. Water vapor and CO2 are the most common greenhouse gases in Earth’s atmosphere, but methane, nitrous oxides, and chlorofluorocarbons (CFCs) are also greenhouse gases. Recent studies (e.g., IPCC, 2007)indicate a high probability of a link between anthropogenic greenhouse gas emissions and observed effects on global warming, precipitation patterns, ocean acidification, and weather patterns. The National Academies recently initiated “America’s Climate Choices,” a suite of studies to inform and guide responses to climate change across the nation. |
|
BOX 1.2 Primary Energy and Useful Energy The energy that powers our civilization is obtained from a number of primary energy sources that exist in nature. These sources fall into two categories: flows of energy and stored energy. Examples of energy flows include sunlight, wind, and waves. Stored energy includes fossil energy (petroleum, natural gas, and coal), bioenergy (contained in biomass), and nuclear energy (stored in atomic nuclei in radioactive elements such as uranium) and the heat stored in Earth’s upper crust. Primary energy sources can be converted into useful energy that, for example, powers a vehicle, lights a building, or supplies heat for an industrial process, although the conversion process inevitably involves energy losses (which can be quite considerable) and often entails substantial costs. While the extent of these primary energy sources is usually large, there are a number of technological, economic, environmental, and labor constraints on converting them into useful energy. For example, many remaining domestic supplies of petroleum and natural gas are in difficult-to-access locations. Some are in environmentally sensitive areas. And renewable energy is unevenly distributed across the United States; in some cases, regions with abundant renewable potential are physically distant from demand centers. Such constraints are in fact critical in determining the actual mix of useful energy supplies that are available at particular times. Much of this report deals with the technology options for overcoming some of these constraints. |
-
economic and population growth.4 U.S. dependence on energy imports continues to rise as well (Figure 1.6). And steady increases in energy use are projected for the future (Figure 1.7) under EIA’s business-as-usual reference case.5
-
The United States is almost completely dependent on petroleum for transportation—a situation that entails unique energy-security6 chal-
|
BOX 1.3 Resources, Reserves, and Potential The terms “resource,” “reserve,” and “potential” are used throughout this report to describe the primary energy sources that exist in nature and may be tapped to produce useful energy. “Resource” refers to quantities of stored energy—i.e., solid, liquid, or gaseous fuels derivable from petroleum, natural gas, coal, uranium, geothermal, or biomass—that exist in nature and may be feasible to extract or recover, given favorable technology and economics. ”Reserve” refers to that portion of the resource that can be economically extracted or recovered with current technology. “Potential” is used instead of resource to describe energy flows—such as from sunlight, wind, or the movement of water—that occur in nature and may be feasible to recover, given favorable technology and economics. These primary energy sources are very large compared to U.S. energy demand. For example, the energy from sunlight reaching the land surface of the United States is thousands of times greater than the country’s current annual consumption of energy; the energy from wind available in the United States is at least an order of magnitude larger; and the energy stored in geothermal, nuclear, and fossil reserves available to the United States is at least thousands of times larger. The challenge is to transform these vast resources into energy forms that are readily usable in a commercially and environmentally acceptable fashion. |
-
lenges. The nation relies on coal, nuclear energy, renewable energy (primarily hydropower), and, more recently, natural gas for generating its electricity (Figures 1.8 and 1.9).
-
Many of the energy system’s assets are aging: domestic oil and gas reserves are being depleted; currently operating nuclear plants were constructed largely in the 1970s and 1980s, and many coal plants are even older (Figure 1.10); and electrical transmission and distribution systems contain infrastructure and technologies from the 1950s. Renewing or replacing these assets will take decades and require investments totaling several trillion dollars.
Fossil fuels have supported U.S. economic prosperity since the latter part of the 19th century. But their low market prices during most of this period encouraged high levels of energy consumption per capita and generally discouraged the development of alternative sources of energy, with two notable exceptions: hydroelectric and nuclear power, which currently account for about 7 percent and 19 percent, respectively, of U.S. electricity generation. Our nation’s dependence on fossil fuels evolved not only because they were available at low market costs7 but also because their physical and chemical properties are well suited to particular uses: petroleum for transportation; natural gas as an industrial feedstock, for residential and commercial space heating, and, more recently, as a fuel for electric-power generation; and coal for the generation of electricity and as a feedstock for some industrial processes (Figure 1.8). Indeed, most consumer-based, industrial, and governmental activities require, either directly or indirectly, the consumption of fossil fuels.
The current profile of U.S. energy use, summarized in Figures 1.1 and 1.2, shows that nearly 40 percent of the nation’s economy is fueled by petroleum. More important, nearly all of our nation’s transportation needs are being met by petroleum-based fuels, as shown in Figure 1.8, and prospects for alternatives are currently limited. Domestic production of petroleum in the United States peaked8 in the 1970s and has been in decline for the past three decades. However, improvements in exploration and production technologies have helped to moderate these declines. About 56 percent of the petroleum consumed in the United States in 2008 was imported, in some cases from geopolitically turbulent or fragile regions.9
America’s enormous appetite for oil, coupled with growth in demand from other countries, puts upward pressures on world prices, increases revenues to oil-exporting nations, and heightens the influence of those nations in world affairs.
Historically, this influence has often been expressed in directions that are neither supportive of a well-functioning world oil market nor consistent with U.S. interests. Since U.S. consumption of oil is concentrated in key economic activities, such as transportation and home heating, this produces what many consider to be increasingly substantial economic and national security vulnerabilities. The current recession has reduced petroleum demand, and this condition may persist until the economic recovery gets under way. But if history is any guide, the resumption of worldwide economic growth will again raise the demand for petroleum and increase pressures on prices.
Almost a quarter of our nation’s economy is fueled by natural gas, mostly for residential and commercial space heating and industrial uses, but increasingly for electric-power generation (see Figure 1.8). Indeed, over the past two decades, natural-gas-fired facilities have accounted for a significant fraction of new U.S. baseload power plants (Figure 1.10).10 About 86 percent of the natural gas used in the United States at present is produced domestically, and much of the remainder comes from Canada. Prices for natural gas in the North American market have been lower than the price for liquefied natural gas11 on the world market.
During the last 2 years, North American natural gas production from conventional resources has declined. But production from unconventional sources—such as coal beds, tight gas sands (rocks through which flow is very slow), and shale—has increased, largely in response to higher prices and new technology. Recent price declines, however, have reduced the incentive to develop new natural gas production, especially from unconventional sources. If domestic production growth could be continued and production sustained over long periods, North American sources could meet some portion of the potential growth in U.S. demand for natural gas. If, however, growth in domestic natural gas production is limited—by some combination of production declines from existing sources and of less-than-expected growth in new sources—the United States might have to import more natural gas, which would result in increased import dependence and exposure to world prices for liquefied natural gas.
|
10 |
Natural gas plants are used to provide both baseload and peaking power, but Figure 1.10 shows only baseload plants. |
|
11 |
Liquifying natural gas by cooling it to low temperatures (about −160°C) at close to atmospheric pressures makes it easier to transport and store. |
Which of these futures occurs will depend as well on a set of interrelated factors including the following: demand growth, production technology, resource availability, and prices. There is some uncertainty, for example, regarding how easily domestic sources of natural gas production could be expanded and how quickly a global market for natural gas would emerge. If North American natural gas production cannot be expanded to meet demand, then dependence on natural gas imports could mirror that on petroleum.
Figure 1.8 also shows that the burning of fossil fuels—principally coal and secondarily natural gas—accounts for almost 75 percent of the electricity generated in the United States. Coal is abundant in this country and relatively inexpensive compared to other fossil fuels. The United States currently has about 20 years’ worth of identified coal reserves in active mines. However, a much larger resource would be available for production if new mines were opened and if the rail infrastructure required to deliver coal—or sufficient long-distance transmission lines for delivery of electricity generated near the mine mouth—could be put in place. Costs of production are low enough that substantial quantities of coal can be produced at current coal prices. However, coal mining has significant environmental impacts, which will limit its suitability in some locations.
The use of fossil fuels to generate energy has a number of deleterious impacts on land resources, water supplies, and the well-being of citizens. Arguably, the most important unregulated environmental impact of fossil-fuel use is the emission of greenhouse gases, primarily CO2, to the atmosphere. Petroleum use for transportation accounts for about one-third of total annual U.S. emissions of CO2 (Figures 1.11 and 1.12), and fossil-fuel use for electricity generation accounts for more than another third (Figure 1.11). Coal use causes most of the emissions from electricity production. Natural gas produces about half as much CO2 as coal per kilowatt-hour of electricity generated, but its emissions can be some 10–20 times higher per kilowatt-hour than those from nuclear or renewables (see Figure 2.15 in Chapter 2).
Although technologies for capturing and storing CO2 have been demonstrated in nonelectrical applications, they have not yet been shown to be safely deployable at a sufficient scale for coal- and natural-gas-fired power plants. Even if the technology were to be proven for electrical applications, building the necessary infrastructure would require major investments over long periods of time, and substantial new regulations would have to be formulated to address safety, ownership, and liability issues. And, of course, there would be impacts on the price of electricity.
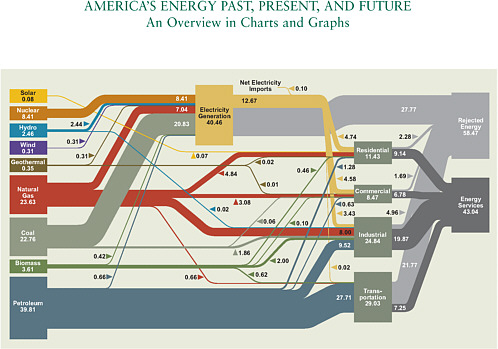
FIGURE 1.1 Energy consumption in the United States in 2007 in quadrillions of British thermal units (quads). The figure illustrates the delivery of energy from primary fuel sources, which are shown in the boxes on the left side of the figure, to the residential, commercial, industrial, and transportation sectors, which are shown in the boxes at the center-right side of the figure. Energy is delivered to these sectors primarily in three forms: (1) electricity, which is produced principally from coal, natural gas, and nuclear power, and to a much lesser extent from renewable sources (hydro, solar, wind, and biomass); (2) liquid fuels, principally petroleum, with a small contribution from biomass-derived fuels (e.g., corn ethanol); and (3) natural gas for heating and as an industrial feedstock. Small quantities of coal and biomass are also used as industrial feedstocks. The width of the bars indicates the relative contributions of each energy source; the absolute contribution (in quads) is shown by the numerical labels next to each bar. The bar for electricity represents retail electricity sales only and does not include self-generated electricity. The boxes on the right side of the figure show that a total of about 101.5 quads of energy were consumed in the United States in 2007; about 43 quads were used to provide energy services, and more than 58 quads were “rejected” (i.e., not utilized to provide energy services) because of inefficiencies in energy production, distribution, and use.
Sources: Lawrence Livermore National Laboratory and the Department of Energy, based on data from the Energy Information Administration, 2008a.
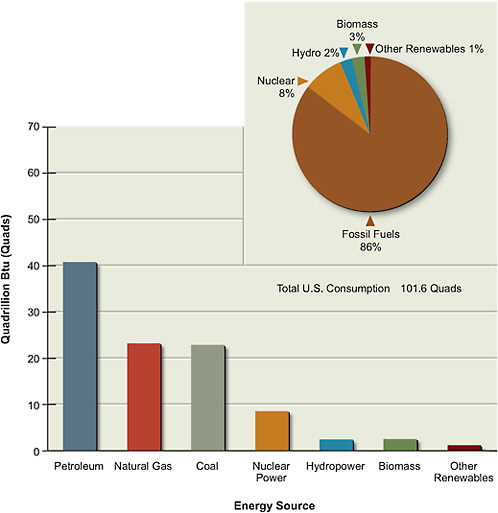
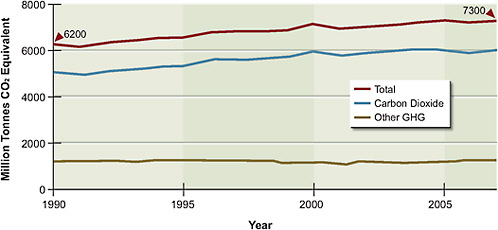
FIGURE 1.3 Greenhouse gas emissions in the United States, 1990–2007, in millions of tonnes CO2equivalent. The “other” greenhouse gas (GHG) emissions shown on the diagram include methane and nitrous oxide, converted to CO2-equivalent units. The 1990 and 2007 point estimates have been rounded to two significant figures.
Source: Energy Information Administration, 2008b.
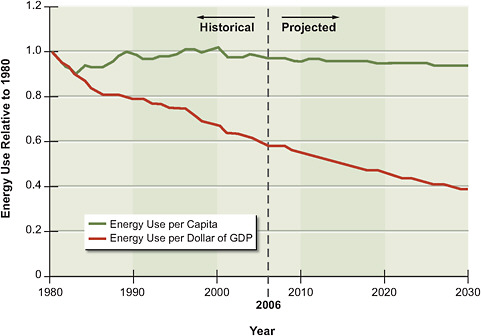
FIGURE 1.4 Energy use in the United States per dollar of GDP and per capita, with 1980 energy use per dollar of GDP and per capita set to 1.0.
Source: Energy Information Administration, 2008b.
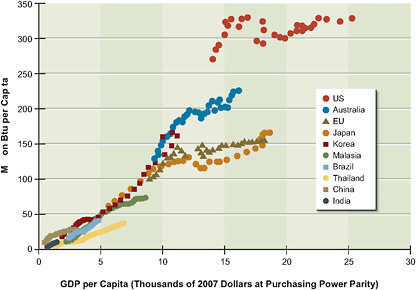
FIGURE 1.5 Annual per capita energy use (in million Btu per capita) as a function of gross domestic product (GDP) at purchasing-power parity per capita. A progression over time for several representative countries is shown. GDP is a measure of economic activity. On average, higher per capita energy consumption is associated with increasing per capita GDP; however, in some cases, per capita GDP has increased while energy use has declined.
Sources: Adapted from Shell International BV, Shell Energy Scenarios to 2050 (2008), based on data from the International Monetary Fund and British Petroleum.
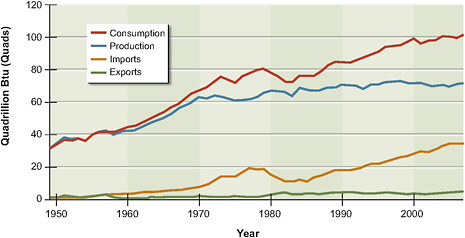
FIGURE 1.6 Primary U.S. energy consumption, production, imports, and exports, 1949–2007, in quads.
Source: Energy Information Administration, 2008b.
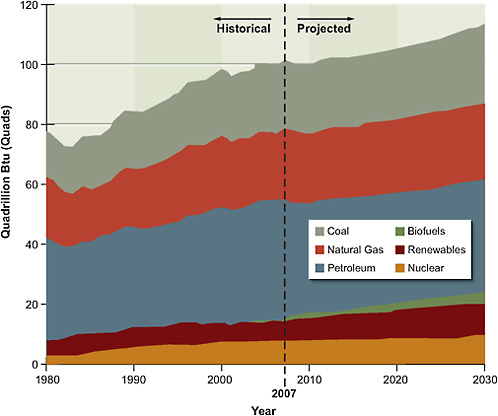
FIGURE 1.7 Historical (1980–2007) and projected (2008–2030) energy consumption in the United States by primary energy source, in quads. The projected energy use from 2020 to 2030 reflects the U.S. Energy Information Administration’s (EIA’s) 2008 reference case; this reference case assumes that current policies that affect energy supply and consumption will remain unchanged and that economic growth rates and technology development and deployment trends will continue over the next 20 years. As explained in Box 2.1 in Chapter 2 and in Annex 3.A in Chapter 3, the AEF Committee uses the EIA reference case as the reference scenario for its study.
Source: Energy Information Administration, 2008b.
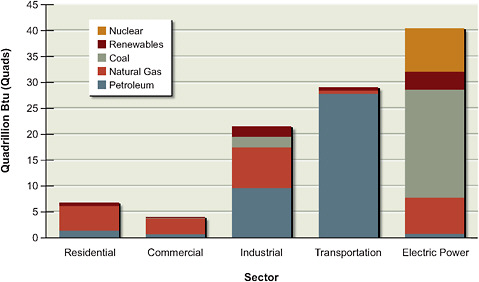
FIGURE 1.8 Primary energy consumption by production sector and fuel type in the United States in 2007. Energy consumed by the electric power sector is used to produce electricity consumed by the end-use sectors shown in the figure.
Source: Data from Energy Information Administration, 2008b.
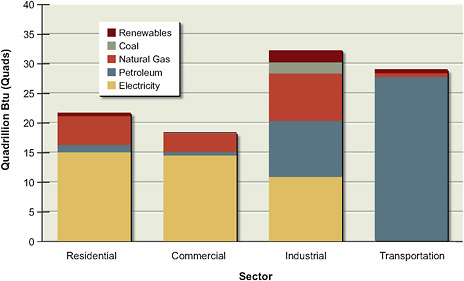
FIGURE 1.9 Total energy consumption in the United States in 2007, shown by end-use sector and by fuel type. Also shown is each end-use sector’s consumption of electricity. Electricity is a secondary energy source and is generated using fossil fuels and nuclear and renewable sources.
Source: Data from Energy Information Administration, 2008b.
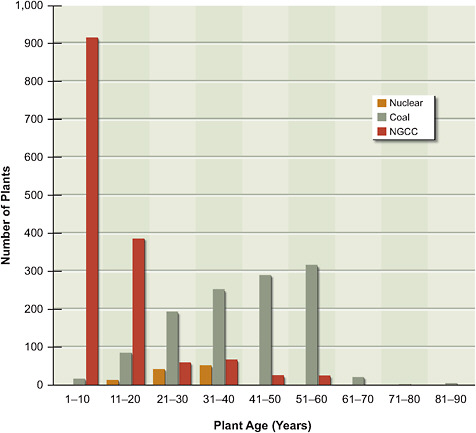
FIGURE 1.10 Age of U.S. baseload power plants, in years. The age of U.S. nuclear plants, coal plants, and natural gas combined cycle (NGCC) plants is shown in 10-year intervals, as measured from their initial year of operation projected to 2007. Only plants that are used primarily for retail electricity production are shown. Natural gas single-cycle plants are not shown because they are intended for peaking rather than baseload generation. Many of these baseload plants have been upgraded since plant operations commenced.
Source: Data from Energy Information Administration (www.eia.gov/cneaf/electricity/page/capacity/capacity.html).
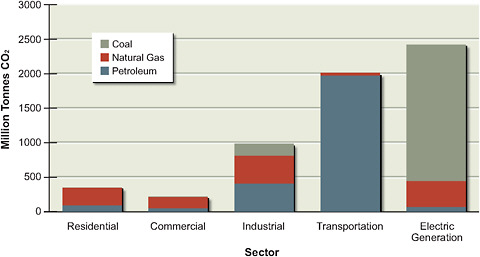
FIGURE 1.11 Primary CO2emissions by production sector and fuel type in the United States in 2007 in millions of tonnes per year. Emissions from the electric power sector result from the production of electricity that is consumed by the end-use sectors shown in the figure.
Source: Data from Energy Information Administration, 2008b.
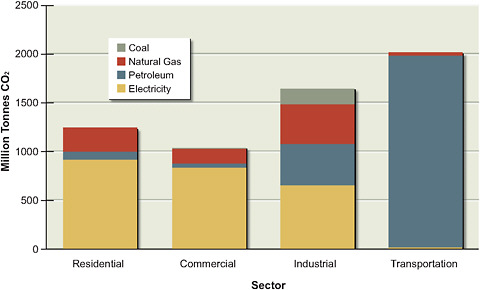
FIGURE 1.12 Total CO2emissions in the United States in 2007 by end-use sector and primary energy source, in millions of tonnes per year. Also shown is each end-use sector’s consumption of electricity. Electricity is a secondary energy source and is generated using fossil fuels and nuclear and renewable sources.
Source: Data from Energy Information Administration, 2008b.
Nevertheless, new technologies that use energy more efficiently and that avoid, or capture and safely store, greenhouse gas emissions are essential components of a portfolio of alternatives for transforming energy production and use. Indeed, failure to develop and implement such technologies will greatly limit the options available for reducing the nation’s greenhouse gas emissions to the atmosphere.
CHALLENGES TO TRANSFORMING ENERGY PRODUCTION AND USE
There is a growing recognition that our nation’s current approaches for obtaining useful energy, being largely dependent on fossil fuels, are unsustainable over the long term and that we must therefore transform the manner in which energy is produced, distributed, and consumed. The need to transform the U.S. energy system is motivated by several factors.
-
Heightened long-term competition for fossil fuels as a result of worldwide population and economic growth.
-
Increasing U.S. reliance on world markets and their vulnerable supply chains for supplies of petroleum (and possibly, in the future, of natural gas).
-
Mounting volatility in market prices for fossil fuels. For example, petroleum prices have ranged from about $32 to $147 per barrel over the past 2 years, which has helped to promote volatility in prices for coal and natural gas.
-
Growing concerns about the impacts on the environment of burning fossil fuels—especially the impacts of CO2 emissions to the atmosphere on global warming—and the time spans of such impacts.12
The challenge before us is to transform the U.S. energy system in a manner that increases its sustainability, supports long-term economic prosperity, promotes
energy security, and reduces the adverse environmental impacts arising from energy production and use. Such a transformation could, for example, promote sustainability by using energy more efficiently and increasing the use of renewable-energy sources; support long-term economic prosperity by ensuring the availability of adequate supplies of energy; improve energy security by decreasing the nation’s reliance on petroleum imports; and reduce adverse environmental impacts by reducing CO2 emissions to the atmosphere.
Concerns about the sustainability, security, or environmental impacts arising from energy production and use have been reflected in the agendas of all U.S. presidents since Franklin D. Roosevelt. Such concerns were reflected, for example, in:
-
Richard Nixon’s “Project Independence” (1974)
-
Gerald Ford’s “Energy Independence Act” (1975)
-
Jimmy Carter’s “National Energy Plan” (1977)
-
Ronald Reagan’s “Energy Security” report (1987)
-
George H.W. Bush’s “National Energy Strategy” (1991)
-
Bill Clinton’s “Federal Energy R&D for the Challenges of the 21st Century” report (1997)
-
George W. Bush’s “Reliable, Affordable, and Environmentally Sound Energy for America’s Future” report (2001).
Environmental policies and regulations—including, for example, those stemming from the Clean Air Act and the National Environmental Policy Act—have at times focused our nation’s attention on energy efficiency and conservation and the use of renewable sources of energy, which has led to dramatic improvements in air quality. In fact, statutes such as the Clean Air Act demonstrate that thoughtful regulation can be a very useful tool for dealing with important externalities—those involved, for example, in the unconstrained emissions of pollutants (e.g., NOx, SOx) from the burning of fossil fuels.
These policies and regulations have focused in part on mitigating the environmental impacts of energy production and use, but they have been piecemeal efforts. The fact is that the United States has never implemented a truly comprehensive set of national policies for obtaining and using energy to meet national goals for sustainability, economic prosperity, security, and environmental quality. Instead, as noted previously, the U.S. energy system has developed in response to an array of uncoordinated market forces and shifting public policies.
Yet there has been a growing recognition over the past decade of the need
for such comprehensive national policies. Congress made an unsuccessful attempt to pass major energy legislation in 2002, successfully passed such legislation in 2005 (Energy Policy Act of 2005) and in 2007 (Energy Independence and Security Act [EISA] of 2007), and was working on another major energy bill as the present report was being completed. Additionally, the Obama administration recently announced a new national fuel efficiency policy that will accelerate the implementation of EISA fuel economy standards for light-duty vehicles. During this same period there has been a sharp rise in investment activity focused on clean energy—from a few tens of millions of dollars in the late 1990s to hundreds of billions of dollars today.
It is the AEF Committee’s judgment that comprehensive and sustained national policies for energy production and use will be needed to achieve a timely transformation to the more sustainable, secure, and environmentally benign energy system envisioned in this report. However, to help shape these policies will require sound and dispassionate technical analyses of the opportunities and challenges before us. Such analyses should address technology capabilities, costs, times to maturity and commercial deployment, and impacts on the environment, economy, and national security. The technical analysis in the present report aims to help support the development of such policies.
THE ROLE OF TECHNOLOGY
Transforming the U.S. energy system as described in the preceding section will require the continued improvement of existing technologies as well as the development and national-scale deployment of new technologies, including:
-
Existing and new energy efficiency technologies.
-
Existing and new energy-supply technologies—including wind, solar, geothermal, biofuels, and nuclear power.
-
Carbon capture and storage (CCS) technologies on a large-enough scale to reduce CO2 emissions from the burning of fossil fuels.
-
Modern electrical transmission and distribution systems to accommodate 21st-century electricity supplies (especially from intermittent resources such as wind and solar), support future growth in electricity demand, and enable national-scale deployments of sophisticated demand-side technologies.
Many different pathways can potentially be pursued to these ends. But identifying pathways that are consistent with the nation’s priorities and then taking the actions needed to achieve the desired transformations are among the most difficult challenges of our time.
The national-scale deployment of new technologies will have learning curves and will entail a variety of risks, and such deployments can have unforeseen economic and environmental impacts. Thus, in addition to evaluating the potential contributions of existing and emerging technologies, we also need to understand the nontechnological constraints on their rates of deployment and to decide on the roles of the public and private sectors and current and future generations for shouldering deployment costs and risks. In short, transformation of our nation’s energy system will require a sustained national effort involving carefully focused technology research, development, and demonstration; realignments of public policies and regulations; substantial capital investments; and allied resources (materials, infrastructure, and people) in both the public and the private sectors.
Many energy-supply and end-use technologies are ready for significant deployment now, but others will not be available until they have been demonstrated at scale13 or until important technological barriers have been overcome. Of course, once a technology is ready for deployment, a number of important economic, regulatory and policy, and resource factors will govern the actual pace, scale, and cost of deployment. Especially important in this regard are the prices for fossil fuels and other materials, the availability and costs of specialized resources and capital, and key public policies and regulations that address, for example, renewable-energy portfolio standards, building regulations, corporate average fuel economy (CAFE) standards, and carbon prices.14 Because of the uncertainties about how these factors will play out in the decades ahead, the technology-deployment options that are identified in this chapter and in Part 2 of this report should be considered as important first-step technology assessments rather than as forecasts as to which technologies will be implemented and how important each technology will be.
The committee also recognizes that currently unpredictable developments in
technology could have dramatic impacts on future deployment options. There is little doubt that beyond the next few decades, new technologies—which employ, for example, advanced materials and innovative chemical processes not yet in view—could play transformative roles. Along these same lines, better understanding of how geoengineering15 or the ecology of microbial systems affects climate could yield new insights on managing greenhouse gas emissions from energy production and use. In fact, unexpected breakthroughs might even enable fusion technology to contribute to the U.S. energy supply before 2050. Given the contingent nature of technology development, there will always be uncertainties in future technology pathways.
While the development and widespread deployment of both evolutionary and new technologies will play a central role in transforming the energy system, so too will new public policies and international collective actions that are equitable, efficient, and effective. Such collaborations will be needed not only because of the inherently global nature of the challenges but also because of the differing priorities and capacities of other countries. Market forces alone will not be sufficient to effect this transformation, as market externalities—including social costs not reflected in prices, regulatory constraints, the lack of information for knowledgeable market decision making, and other significant uncertainties—are likely to prevent energy markets from generating fully adequate price signals. Access to and competition for capital will be pertinent as well. And conflicts could arise when individual nations seek their own economic, political, or other national benefits—not necessarily consistent with shared international interests—in addressing issues such as global warming.
Because the energy system is so large, complex, and fully integrated into all aspects of American life, its successful transformation will take the full ingenuity and commitment of the public and private sectors. Moreover, the transformation must engage the routine attention of the public itself. In this sense, the present energy challenge is fundamentally different from historical efforts such as the Manhattan Project and the Apollo Project, which focused on specific technical objectives rather than on a very large and complex societal infrastructure. Those
projects were enormous technological and organizational triumphs, to be sure, but they were generally disconnected from the daily lives of the nation’s citizens. Nevertheless, particular technological elements—such as CCS, advanced batteries for transportation, advanced geothermal energy for electricity production, and low-cost efficient lighting and solar panels—might very well benefit from focused development and demonstration programs even as the many nontechnological challenges are being addressed.
STRATEGY FOR ADDRESSING THE STUDY CHARGE
The focus of this study, consistent with its charge (Box 1.1), is on energy-supply and end-use technologies—in particular their deployment-readiness, performance, costs, barriers, and impacts. The AEF Committee also assessed the prospects of some other technologies that will be critical both in meeting the anticipated growth of energy demand and in enabling the deeper market penetration of the new energy-supply and end-use technologies themselves. These critical technologies range from CCS, which would support not only the continued use of fossil fuels for electricity generation but also any future production of liquid fuels, to advanced battery, fuel-cell, and hydrogen technologies.
The committee considered technology development and deployment over three time periods—2008–2020, 2020–2035, and 2035–2050—but focused mainly on the first two periods, not only because the more distant future is harder to analyze but also because it depends critically on what occurs (or does not occur) earlier. Notably, the committee found that what can be realized in the two later periods will be contingent on the accomplishments in the critical first period, which is immediately ahead of us. Indeed, a major message of this report is that the nation can achieve the necessary and timely transformation of its energy system only if it embarks on an accelerated and sustained level of technology development, demonstration, and deployment along several parallel paths between now and 2020. The cases for such urgent actions are strikingly similar in virtually all of the energy domains addressed in this report, whether they pertain to specific energy-supply technologies, end-use technologies, or electricity transmission and distribution.
In addressing its study charge, the committee avoided reinventing the wheel. Where appropriate, it took advantage of the existing energy literature, which is both extensive and information-rich, to inform its judgments. In some selected
cases, the committee performed additional technical analyses to fill gaps in the literature or reconcile conflicting assessments. The approaches that the committee used are described in more detail in Part 2 of this report.
The committee also relied heavily on the reports of the three panels that were created as part of this Phase I study to undertake detailed examinations of energy efficiency technologies, alternative transportation fuels, and renewable-energy technologies. The three panel reports are, specifically:
-
Real Prospects for Energy Efficiency in the United States (available at http://www.nap.edu/catalog.php?record_id=12621)
-
Liquid Transportation Fuels from Coal and Biomass: Technological Status, Costs, and Environmental Impacts (available at http://www.nap.edu/catalog.php?record_id=12620)
-
Electricity from Renewable Resources: Status, Prospects, and Impediments (available at http://www.nap.edu/catalog.php?record_id=12619).
The AEF Committee used these panel reports to inform its judgments about energy supply and cost for the particular technologies involved. Selected members of these panels, including their chairs and vice chairs, also served on the authoring committee for the present report.
The U.S. energy system is so large and complex that the committee was unable, in the time available, to assess the potential for transformation of its every relevant aspect. Note in particular that:
-
The focus of the report is on energy-supply and end-use technologies that are most likely, in the judgment of the committee, to have meaningful impacts on the U.S. energy system during the three time periods considered in this study (encompassing the next 40 years or so). However, the committee did not assess the future role of technologies for the exploration, extraction, storage, and transportation of primary energy sources (e.g., fossil fuels), nor did it assess the role of some critial components of a modernized infrastructure—including tankers, roads, pipelines, and associated storage facilities—in delivering these resources from suppliers to consumers.
-
The report does not explore in any depth the U.S. energy system at the regional level. Thus, the implications of the dramatic regional heterogeneity in the United States—for example, in energy resource endow-
-
ments, climates, and prices—on energy-supply and end-use technologies are not considered in any detail.
-
The potential energy-supply contributions from the options assessed in this report have been estimated technology by technology. The committee did not, however, conduct an integrated assessment of how these technologies might compete in the marketplace and how that competition and other external factors could affect actual deployment rates and outcomes over time. For example, the successful deployment of energy efficiency technologies could reduce the demand for electricity and the need to deploy additional electricity-generation capacity, except perhaps to correct regional supply imbalances or replace aging assets with more efficient and environmentally benign facilities. Also, the utilization of biomass for liquid fuels production could reduce the supplies of biomass available for electricity generation. Therefore the potential contributions of the energy-supply and end-use technologies identified in this report should not be viewed as predictions of any specific future mix of primary energy resources and conversion methods.
-
The committee has not made judgments about the relative desirability of the supply options described in this report or about their appropriate pace and scale of deployment. Such decisions are beyond the committee’s charge and are the responsibility of policy makers, investors, consumers, and, indeed, all citizens.
-
The committee and its panels developed the cost estimates presented in this report by using a range of methodologies (as described in Annex 3.A in Chapter 3 and in Part 2). It derived some of these estimates independently, with the assistance of consultants, whereas other estimates came from assessments documented in the literature. The cost estimates themselves were based on a number of underlying assumptions about commodity prices, construction costs, and fuel, regulatory, and operating costs, as well as on “conditional” assumptions16 about the success of new-technology deployment. As a consequence the cost estimates presented in this report should not be used to make detailed comparisons across technologies. However, because these estimates are presented as ranges that reflect the principal uncertainties in the underlying
-
assumptions, the committee judges that they are sufficiently robust to be useful for rough comparisons.
-
The report does not provide an evaluation of the full range of options for reducing energy use. Such reductions are generally understood to be obtainable in two ways: (1) deploying technologies to improve the efficiency of energy production and use and (2) conserving energy through behavioral or lifestyle changes (e.g., taking public transportation to work rather than driving).17 The focus of this report is on the assessment of technologies that address the first factor—improving the efficiency of energy use. It addresses energy conservation only insofar as conservation is affected by the deployment of more energy-efficient technologies. To be sure, conservation is an important option for reducing energy use, but its detailed consideration is well beyond the technological scope of this study. A study on energy conservation would require, for example, an in-depth understanding of how social, economic, and policy factors affect energy consumption.
-
The report does not provide forecasts of future prices of primary energy inputs (e.g., for petroleum and coal) or the effects of possible future policies and regulations concerning CO2 emissions on such prices. Such prices, however, will influence the relative competitiveness of the energy-supply and end-use technologies discussed in this report, and they will affect technology choices and paces of development, especially in the private sector.
REPORT ORGANIZATION
This chapter has briefly discussed the current characteristics of the U.S. energy system, the challenges to improving the system’s sustainability and security, the role of technology, and the committee’s strategy for addressing its study charge (Box 1.1). The next two chapters complete Part 1 of this report by providing sum-
maries of the study’s key findings (Chapter 2) and of the technology assessments (Chapter 3) of Part 2.
Part 2 contains six chapters (Chapters 4–9), which document the committee’s detailed assessments of energy-supply and end-use technologies. The topics addressed in these chapters are, specifically,
-
Energy efficiency in transportation, industry, and residential and commercial buildings (Chapter 4)
-
Production and use of alternative transportation fuels, in particular biofuels as well as fuels derived from converting coal, or mixtures of coal and biomass, into liquids (Chapter 5)
-
Production of renewable energy such as wind, solar, and geothermal energy, as well as hydropower and biopower (Chapter 6)
-
Domestic fossil-fuel energy, particularly as coupled with technologies that would capture and safely store CO2 (Chapter 7)
-
Production of electricity from nuclear energy (Chapter 8)
-
Electricity transmission and distribution systems that reliably accommodate intermittent energy supplies such as solar and wind and sophisticated demand-side energy efficiency technologies (Chapter 9).
REFERENCES
EIA (Energy Information Administration). 2008a. Annual Energy Review 2007. DOE/EIA-0384(2007); Washington, D.C.: U.S. Department of Energy, Energy Information Administration.
EIA. 2008b. Annual Energy Outlook 2008. DOE/EIA-0383(2008). Washington, D.C.: U.S. Department of Energy, Energy Information Administration.
IPCC (Intergovernmental Panel on Climate Change). 2007. Climate Change 2007: Synthesis Report. Contribution of Working Groups I, II and III to the Fourth Assessment Report of the Intergovernmental Panel on Climate Change. Geneva: IPCC.
Simmons, M.R. 2005. Twilight in the Desert: The Coming Saudi Oil Shock and the World Economy. Hoboken, N.J.: John Wiley & Sons, Inc.
Wood, J.H., G.R. Long, and D.F. Morehouse. 2004. Long-Term World Oil Supply Scenarios: The Future Is Neither as Bleak nor as Rosy as Some Assert. Energy Information Administration. Available at http://www.eia.doe.gov/pub/oil_gas/petroleum/feature_articles/2004/worldoilsupply/oilsupply04.html.


